Embed Size (px)
Citation preview

Clemson UniversityTigerPrints
All Dissertations Dissertations
12-2018
Influence of Consumer Involvement in TouristInformation Search: Application of Economics ofInformation Theory in a DestinationPeter Judca MKUMBOClemson University, [email protected]
Follow this and additional works at: https://tigerprints.clemson.edu/all_dissertations
This Dissertation is brought to you for free and open access by the Dissertations at TigerPrints. It has been accepted for inclusion in All Dissertations byan authorized administrator of TigerPrints. For more information, please contact [email protected].
Recommended CitationMKUMBO, Peter Judca, "Influence of Consumer Involvement in Tourist Information Search: Application of Economics ofInformation Theory in a Destination" (2018). All Dissertations. 2265.https://tigerprints.clemson.edu/all_dissertations/2265

INFLUENCE OF CONSUMER INVOLVEMENT IN TOURIST INFORMATION SEARCH: APPLICATION OF ECONOMICS OF INFORMATION THEORY IN A DESTINATION
A Dissertation Presented to
the Graduate School of Clemson University
In Partial Fulfillment of the Requirements for the Degree
Doctor of Philosophy Parks, Recreation, and Tourism Management
by Peter Judca MKUMBO
December 2018
Accepted by: Professor Sheila J. Backman, Committee Chair
Professor Kenneth F. Backman, Co-chair Professor DeWayne D. Moore Professor Michael J. Dorsch
Professor Jumanne A. Maghembe

ii
ABSTRACT
In the modern digital world, it is increasingly challenging for destination marketers to design
integrated marketing communication (IMC) strategies. The spectrum of information sources
has become broader, serving for wider market interests. The importance of information in the
modern world is increasing exponentially, and the tourism industry is traditionally information
intense. There is an endless list of information outlets, and it is impossible to be present in all
the information platforms. The spectrum of outlets includes old-school prints like magazines
and newsletters on the one hand, while on the other hand there are modern advanced Web 2.0
technologies like social media platforms and highly customized digital ads. The presence of
many information outlets creates both opportunities and challenges. Opportunities could be
considered as the presence and access of many promotion options for suppliers while the
challenges would be which are the best options to use, why, how and when targeting which
market segments. It requires a destination marketer to carefully choose a few information
outlets with optimum outcomes individually and combined. Choosing the right outlets is one
thing, developing/creating the right content for each outlet is another thing.
This research is about how tourists search for destination information. Specifically,
what information sources are mostly preferred by international tourists in a safari destination,
how reliable are the preferred information sources perceived, and how often are these
information sources used by the tourists. Additionally, this study uses the economics of
information theory to investigate the relationship between the investment a tourist puts in
searching for destination information across numerous information sources as well as the
frequency of using such information sources with the satisfaction they get. Consumer

iii
involvement is used as an antecedent construct to investigate information search behavior and
tourist satisfaction.
A mixed methods research approach was used. A questionnaire was designed on
Qualtrics and was conveniently distributed using iPads to international tourists exiting
Tanzania at three international airports Dar es Salaam, Kilimanjaro, and Zanzibar. A checklist
was prepared to guide interviews with a few participants who were also conveniently invited
to be interviewed after having filled out the questionnaire. A total of 356 participants filled out
the questionnaire, and 21 were further interviewed. Quantitative data was analyzed using
structural equation modeling analytical approach, while qualitative data was analyzed
manually after being transcribed.
Results show that consumer involvement does not have a statistically significant effect
on information search behavior. A safari tourist uses seven information sources on average
when planning their trip. One of the reasons for using multiple sources of information is to
validate information gained in one source across other sources to see if there is consistency.
The most preferred sources of information are personal sources. There is a statistically
significant relationship between the number of information sources a tourist uses with the
satisfaction with information search. However, there is no significant relationship between the
tourists' frequency of use information source and their satisfaction with information search.
This means investing in the number of information sources is more effective than using one
source more frequently. Generalization of the findings of this research is limited to safari
destinations.

iv
DEDICATION
To
ArDam Peter MKUMBO
Bertha Daniel NGUKU
Safina Nehemia KAALI
Aron Mgoli KAALI (R.I.P.)

v
ACKNOWLEDGMENTS
I would like to express my sincere appreciation to my advisors Professor Sheila J.
Backman and Professor Kenneth F. Backman (both from the Department of Parks,
Recreation, and Tourism Management), who have mentored me throughout my graduate
school career here at Clemson University. I would like to thank both of you for all your
support and directions in making this dissertation possible. I would also like to thank my
other committee members: Professor DeWayne D. Moore (Psychology Department –
Quantitative Methods), Professor Michael J. Dorsch (Marketing Department – Marketing
Strategies), and Professor Jumanne A. Maghembe (Tanzania, Natural Resources and
Tourism) for their contributions to the completion of this dissertation.
Additionally, I owe special thanks to my fellow current and past graduate students
in the Department of Parks, Recreation and Tourism Management at Clemson University,
especially Dr. Geoffrey Riungu, Dr. Li-Hsin Chen, Dr. Garrett Stone, Dr. John Mgonja,
Dr. Agnes Sirima, Dr. Malek Jamaliah, and Peter Marwa to mention just a few for your
various forms of support during my time at Clemson.
People who assisted in facilitating the data collection processes and logistics. I am
indebted by staff in the Ministry of Natural Resources and Tourism, especially Dr. Aloyce
Nzuki (Deputy Permanent Secretary), Deograsias Mdamu (Director of Tourism), Ephraim
Mwangomo (Personal Assistant to the Minister), Geoffrey Meena (Marketing Manager,
TTB), Victor Ketansi (Marketing Manager, TANAPA), Beatrice Kessy (Chief Park
Warden, Saanane National Park), Josephat Msimbano (Senior Tourism Officer), Kanisia
Mwadua (Senior Tourism Officer), Mary Mushi (Tourism Officer I) and Heda Challe
(Tourism Officer II). I would also like to thank the staff of Julius Nyerere International
Airport especially Priscus Mkawe (Principal Human Resource Officer) and Renata
Wangeri (Airport Operations Officer). I am equally appreciative of the assistance offered
to me by Fatma Mohammed (Operations Manager, Zanzibar International Airport) and Mr.
Msemwa (Security Officer, Kilimanjaro International Airport).
Finally, I thank my family — my wife, Bertha and my son ArDam, who bear the
scars and share the joy of this educational endeavor.
vi
TABLE OF CONTENTS
ABSTRACT ........................................................................................................................ ii DEDICATION ................................................................................................................... iv
ACKNOWLEDGMENTS .................................................................................................. v
TABLE OF CONTENTS ................................................................................................... vi LIST OF FIGURES ........................................................................................................... xi LIST OF TABLES ............................................................................................................ xii CHAPTER ONE ................................................................................................................. 1
INTRODUCTION .............................................................................................................. 1
1.1. Introduction ........................................................................................................ 1
1.2. Background ........................................................................................................ 1
1.3. Integrated Marketing Communications in Tourism ........................................... 3
1.4. Tourism Promotion in Tanzania ......................................................................... 5
1.5. Problem Statement ............................................................................................. 7
1.6. Justification of the Study .................................................................................... 9
1.7. Study Objectives and Research Questions ....................................................... 13
1.8. Study Limitations ............................................................................................. 15
1.9. Definitions of Terms ........................................................................................ 15
1.10. Organization of the Research Report ............................................................... 16
CHAPTER TWO .............................................................................................................. 18
LITERATURE REVIEW ................................................................................................. 18
2.1. Introduction ...................................................................................................... 18
2.2. Information Search in the Tourism Industry .................................................... 18
2.3. Search Qualities ................................................................................................ 23
2.4. Involvement ...................................................................................................... 24
2.5. Information Sources and Search Behavior ....................................................... 31
2.6. Tourist Expectations, Experience, and Satisfaction ......................................... 36
2.7. Economics of Information Theory ................................................................... 39
2.8. Conceptual Model ............................................................................................ 42
2.9. Chapter Summary ............................................................................................. 43

vii
CHAPTER THREE .......................................................................................................... 47
RESEARCH METHODOLOGY...................................................................................... 47
3.1. Introduction ...................................................................................................... 47
3.2. The Study Site .................................................................................................. 47
3.3. Research Approach and Procedures ................................................................. 51
3.3.1 Research Approach ..................................................................................... 51
3.3.2 Research Procedures ................................................................................... 53
3.3.2.1 Population and Sampling Design ........................................................ 53
3.4. Data Collection Instruments and the Process ................................................... 55
3.4.1 Development of the Survey Instrument ...................................................... 55
3.4.1.1 Measurements Scale for Consumer Involvement ............................... 56
3.4.1.2 Information Sources ............................................................................ 59
3.4.1.3 Measurement Scales for Tourist Satisfaction ..................................... 60
3.4.1.5 Measurement Scale for Satisfaction with Information Search ........... 62
3.4.2 Interview Checklist ..................................................................................... 63
3.5. Pilot Test ........................................................................................................... 63
3.5.1 Observations from the Pilot Test ................................................................ 64
3.5.1.1 Survey Observations and Results........................................................ 64
3.5.1.2 Measurement Models for Consumer Involvement Profile.................. 64
3.5.1.3 Measurement Model for Tourist Experience ...................................... 65
3.5.2 Interview Checklist ..................................................................................... 66
3.6. Data Collection Process .................................................................................... 66
3.7. Data analyses .................................................................................................... 67
3.8. Chapter Summary ............................................................................................. 70
CHAPTER FOUR ............................................................................................................. 71
PRESENTATION OF DESCRIPTIVE STATISTICS ..................................................... 71
4.1. Introduction ...................................................................................................... 71
4.2. Response Rate .................................................................................................. 71
4.3. Respondent’s Country of Residence ................................................................ 72
4.4. Main Purpose of the Trip .................................................................................. 75
4.5. Repeat Visitors vs First Timers ........................................................................ 75
4.6. Travel Party Composition ................................................................................ 76

viii
4.7. Length of Stay .................................................................................................. 76
4.8. Individual Average Expenditure ...................................................................... 77
4.9. Trip Coordination ............................................................................................. 78
4.10. Gender .............................................................................................................. 79
4.11. Education .......................................................................................................... 80
4.12. Occupation ........................................................................................................ 80
4.13. Income .............................................................................................................. 81
4.14. Participants Age ............................................................................................... 81
4.15. Consumer Involvement Profile ........................................................................ 82
4.16. Information Sources Used ................................................................................ 84
4.17. Reliability of Information Sources ................................................................... 84
4.18. Frequency of Using Information Sources ........................................................ 85
4.19. Satisfaction with Information Search ............................................................... 87
4.20. Ease of Assessing Search Qualities .................................................................. 87
4.21. Tourist Experience ........................................................................................... 88
4.22. Destination Experience ..................................................................................... 89
4.23. Destination Description .................................................................................... 90
4.24. Reason for Repeat Visit .................................................................................... 91
4.25. Chapter Summary ............................................................................................. 92
CHAPTER FIVE .............................................................................................................. 94
PRESENTATION OF INFERENTIAL STATISTICAL RESULTS ............................... 94
5.1. Chapter Introduction ......................................................................................... 94
5.2. Screening of Multivariate Outliers ................................................................... 94
5.3. Missing Values Analysis .................................................................................. 95
5.4. Confirmatory Factor Analyses and Measurement Models ............................... 99
5.4.1. Measurement Model for Consumer Involvement Profile ......................... 100
5.4.2. Measurement Model for Ease of Assessing Search Qualities .................. 107
5.4.3. Measurement Model for Satisfaction with Information Search ............... 109
5.4.4. Measurement Model for Ease of Assessing Search Qualities .................. 110
5.4.5. Measurement Model for Tourist Experience ............................................ 111
5.4.6. Structural Model with all Constructs ........................................................ 114
5.5. Number of Information Sources ..................................................................... 116

ix
5.6. The Depth of Information Search ................................................................... 116
5.7. Diagnosis of Multicollinearity ........................................................................ 117
5.8. Conceptual Structural Model .......................................................................... 118
5.9. Hypotheses Testing ........................................................................................ 121
5.10. Chapter Summary ........................................................................................... 123
CHAPTER SIX ............................................................................................................... 124
PRESENTATION OF INTERVIEW RESULTS ........................................................... 124
6.1. Introduction .................................................................................................... 124
6.2. Preferred Information Sources ....................................................................... 126
6.3. Reliability of Information Sources ................................................................. 128
6.4. Frequency, Depth, and Satisfaction with Information ................................... 133
6.5. Chapter Summary ........................................................................................... 136
CHAPTER SEVEN ........................................................................................................ 137
CONCLUSIONS AND IMPLICATIONS ...................................................................... 137
7.1. Chapter Introduction ....................................................................................... 137
7.2. Review of the Findings and Conclusions ....................................................... 137
7.3. Which information sources are mostly preferred by international tourists who visit Tanzania and why? ............................................................ 138
7.4. How does consumer involvement as an antecedent construct influence preference in information sources and types of information search? ............. 140
7.5. How does the breadth and depth of information search relate to ease of search qualities? ............................................................................................. 142
7.6. How does ease of evaluating search qualities, breadth, and depth of information search relate to satisfaction with collected information? ........... 143
7.7. How does satisfaction with collected information relate to destination satisfaction? .................................................................................................... 144
7.8. Theoretical Implications ................................................................................. 145
7.9. Implication for Destination Marketing ........................................................... 146
7.10. Limitations of the Study and Future Research ............................................... 146
APPENDICES ................................................................................................................ 148
APPENDIX A ................................................................................................................. 149
SURVEY USED IN PILOT STUDY ............................................................................. 149
APPENDIX B ................................................................................................................. 160
PILOT AND FINAL CHECKLIST FOR INTERVIEWS .............................................. 160

x
APPENDIX C ................................................................................................................. 161
MEASUREMENT MODELS FROM PILOT STUDY .................................................. 161
APPENDIX D ................................................................................................................. 163
FINAL QUESTIONNAIRE............................................................................................ 163
APPENDIX E ................................................................................................................. 178
RESEARCH PERMIT .................................................................................................... 178
REFERENCES ............................................................................................................... 180

xi
LIST OF FIGURES
Figure 1.1: Trends of international arrivals ........................................................................ 6 Figure 1.2: International arrivals in the year 2015 .............................................................. 6 Figure 2.1:Conceptual framework .................................................................................... 43 Figure 2.2: Conceptual framework and hypotheses .......................................................... 46 Figure 3.1: Geographical location of Tanzania................................................................. 48 Figure 3.2: Map of Tanzania showing major airports ....................................................... 49 Figure 3.3: Sketch of the exit lounges .............................................................................. 53 Figure 3.4: Analytical procedure ...................................................................................... 69 Figure 4.1:Average individual expenditure in USD ......................................................... 78 Figure 4.2: Trip organization ............................................................................................ 79 Figure 4.3: Description of destination experience ............................................................ 90 Figure 4.4: Destination description ................................................................................... 91 Figure 4.5: Reasons for repeat visit .................................................................................. 92 Figure 5.1: CFA of RSK dimension ............................................................................... 106 Figure 5.2:CFA Structure of ESQ ................................................................................... 108 Figure 5.3: CFA structure of ISA ................................................................................... 109 Figure 5.4: CFA structure for ESQ ................................................................................. 110 Figure 5.5: Layout of structural model for all constructs ............................................... 115 Figure 5.6: Modified conceptual structural model .......................................................... 119 Figure 5.7:Structural model showing significant, insignificant and suggested relationships......................................................................................................................................... 122 Figure 5.8:Reorganized structural model showing only significant relationships .......... 123

xii
LIST OF TABLES
Table 3.1: Passenger volume for the three airports ........................................................... 50 Table 3.2: Aircraft movements for the airports ................................................................ 50 Table 3.3: Airlines that fly to the three airports ................................................................ 50 Table 3.4: Measurement Scale for Consumer Involvement.............................................. 57 Table 3.5: Information Sources......................................................................................... 60 Table 3.6: Tourist experience with the destination ........................................................... 61 Table 3.7: Measurement scale for satisfaction with information search .......................... 62 Table 4.1: Response Rate .................................................................................................. 72 Table 4.2: Respondents' country of residence .................................................................. 73 Table 4.3: International Arrivals in Tanzania in 2016 ...................................................... 74 Table 4.4: Main purpose of the trip to Tanzania ............................................................... 75 Table 4.5: Repeat visitors vs first timers .......................................................................... 75 Table 4.6: Travel party composition ................................................................................. 76 Table 4.7: Length of stay .................................................................................................. 77 Table 4.8: Individual average expenditure ........................................................................ 77 Table 4.9: Trip organization ............................................................................................. 79 Table 4.10: Gender proportion of participants .................................................................. 79 Table 4.11: Education levels of participants ..................................................................... 80 Table 4.12: Occupation of participants ............................................................................. 80 Table 4.13: Participants income ........................................................................................ 81 Table 4.14: Participants' age groups ................................................................................. 82 Table 4.15: Descriptive statistics for consumer involvement profile ............................... 83 Table 4.16: Information sources used ............................................................................... 84 Table 4.17: Reliability of information sources ................................................................. 85 Table 4.18: Frequency of using information source ......................................................... 86 Table 4.19: Satisfaction with information search ............................................................. 87 Table 4.20: Ease of assessing search qualities .................................................................. 88 Table 4.21: Tourist experience ......................................................................................... 89 Table 5.1: Measurement model for consumer involvement profile ................................ 101 Table 5.2: Factor correlations in consumer involvement profile (CIP) .......................... 102 Table 5.3: Second order measurement model for CIP .................................................... 103 Table 5.4: Second order measurement model of CIP excluding PRO ............................ 104 Table 5.5: Final second order measurement model of CIP excluding RSK and PRO.... 105 Table 5.6: Final first order measurement model for risk (RSK) ..................................... 106 Table 5.7: Final first order measurement model for PRO .............................................. 107 Table 5.8: Final measurement model for ease of assessing search qualities .................. 108 Table 5.9: Final measurement model for satisfaction with information search .............. 109 Table 5.10: Measurement model for ease of assessing search qualities ................................. 112 Table 5.11: Measurement models for tourist experience construct ................................ 113 Table 5.12: Final measurement models for tourist experience construct ....................... 114

xiii
Table 5.13: Second order measurement model for tourist experience construct ............ 114 Table 5.14: Factor correlations for tourist experience construct .................................... 115 Table 5.15: Mean number of information sources used by participants ......................... 116 Table 5.16: Depth of information search ....................................................................... 117 Table 5.17: Diagnosis of multicollinearity of variables.................................................. 118 Table 5.18: Initial results of full structural model .......................................................... 119 Table 5.19: Final structural model .................................................................................. 121 Table 5.20: Hypotheses testing ...................................................................................... 121 Table 6.1: Interviewees’ code names ............................................................................. 125

1
CHAPTER ONE
INTRODUCTION
1.1. Introduction
This research is about how tourists search for destination information. Specifically,
what information sources are mostly preferred by international tourists in a safari
destination, how reliable are the preferred information sources perceived, and how often
are these information sources used by the tourists. Additionally, this study investigates the
relationship between tourist satisfaction and their information search behavior. Consumer
involvement is used as an antecedent construct to investigate information search behavior
and tourist satisfaction. This chapter is about the introduction of the study. It highlights the
background, problem statement, justification of the study and the objectives.
1.2. Background
Information is one of the many sources of knowledge. One would say the
importance of information in the modern world is increasing exponentially. This is partly
due to the fast growth and innovations in information and communication technologies.
Advances in information and communication technologies have made the world a village.
The tourism industry, which is traditionally an information-intense industry, has benefited
from these advances in information and communication technologies. Suppliers of tourism
services and products have been able to reach out to the markets at more cheaper costs than
ever before. Advances in information technologies have also enabled tourists to evaluate

2
different products and services before they can actually buy them and have been
empowered to share their experiences with the world in an endless number of online
platforms (Minazzi, 2015).
The spectrum of information sources has become broader, serving for wider market
interests. The spectrum includes old school (traditional) channels like magazines and
newsletters on the one hand while on the other hand are modern advanced Web 2.0
technologies like social media platforms and highly customized digital ads. The presence
of many information outlets creates both opportunities and challenges. Opportunities could
be considered as the presence and access of many promotion options for suppliers while
the challenges would be which are the best options to use, why, how and when targeting
which market segments. It is, therefore, becoming increasingly important for a supplier to
identify the markets they want to target along with the best information channels they could
use to reach them out. The best option could be one channel of information or could be a
combination of different options, both channels and, outlets, in an integrated manner
commonly referred as integrated marketing communications (Pickton & Broderick, 2001;
Reid & Mike, 2005; Turner, 2017).
A number of theories could be applied in investigating information sources
preferred by the consumer; however, the common ones are the theory of information
economics (Stigler, 1961) and the theory of information foraging (Pirolli, 2009). The
economics of information theory assumes that a consumer rationally evaluates and
compares cost and benefit when searching for particular information (Stigler, 1961) while
the theory of information foraging (Pirolli and Card 1999) explains how people apply

3
different strategies in locating the information they need in different environments. This
theory suggests that one uses information scents (Pirolli, 2009) to identify and locate
beneficial content and channels of information to be explored further. Information only
makes sense when it hits the psychological pressure points that embed the information
motivation of the consumer. This study adopts the economics of information theory.
1.3. Integrated Marketing Communications in Tourism
Development of service advertising in particular touristic experiences misses strong
theoretical frameworks that could be adapted to varied contexts. Ford, Smith, & Swasy,
(1988) argue that advertising plays a restricted role in the assessment and selection of
services. Web 2.0 and internet technologies have made dissemination of information the
easiest thing than ever before (Minazzi, 2015). Consumers of services including tourists
rely more upon personal sources of information (like sales representative and word-of-
mouth from friends, relatives and in online platforms) when evaluating and selecting a
service or a destination (Chen & Pearce, 2012; Smith, 2000; Zeithaml, 1981). Furthermore,
the literature shows that the least effective information sources for services are ‘impersonal
advertising’ while the most influential are networking and relationships (Dawes, Dowling,
& Patterson, 1991).
The integrated marketing communications (IMC) model of information
dissemination is widely used due to its fundamental view that advertising, regardless of
how many communication channels are used, merely plays one main role of creating an
image for the product or service (Hallahan, Holtzhausen, Ruler, Verčič, & Sriramesh, 2007;

4
Smith, 2000). IMC is a reality among both services and goods, and if used well it can create
synergy and steady front among communication tools for effective target marketing
(Carlson, Grove, & Dorsch, 2003; Grove, Carlson, & Dorsch, 2007). The IMC model
emphasizes that managers and marketers should focus on the image created by all
communications received by the consumer and not solely on one channel of the
communication.
As mentioned earlier, the modern world is full of a broad spectrum of information
channels and outlets. Destination managers and marketers will need a better understanding
of how tourists choose and evaluate their tourist experiences through information sources
they use. The general assumption appears to be that touristic experiences are at least similar
enough in the tourist’s mind that they are chosen and evaluated, often, in the same manner.
Tourism businesses and destination marketing managers have to identify combinations of
information channels and outlets with higher impacts and invest in those. An ideal
combination of information sources is essentially what is often being referred as integrated
marketing communication (Batra & Keller, 2016; Dahl, Eagle, & Low, 2015; Ots &
Nyilasy, 2017; Turner, 2017).
A step before developing an integrated marketing communication strategy is a
knowledge of the variety of information sources mostly preferred by the market one targets.
Such knowledge should inform the managers on how different options could be combined
for greater impact. Thus, this study, among other objectives, seeks to understand tourist-
preferred information sources and information search behavior for tourists who visit
Tanzania, a largely safari destination.

5
1.4. Tourism Promotion in Tanzania
This research was conducted in Tanzania. National parks and specifically wildlife
are among key tourist attractions in Tanzania. The country has renowned national parks
like Serengeti, Kilimanjaro, and Tarangire and is one of the destinations in Sub-Saharan
Africa that are rich in wildlife resources. It is ranked number three in the world in terms of
richness in natural resources attractions by the World Economic Forum (World Economic
Forum, 2015; World Travel & Tourism Council, 2013). Tourism revenue contributes about
17% of the country’s GDP and is the second foreign currency earner after gold (Tourism
Division, 2016b). The category of international tourists is the largest contributor to this
revenue. Tanzania is an ideal study site for this project as it is one of the famous Sub-
Saharan safari destinations (Tourism Division, 2016b) yet very few tourism studies being
conducted in its destination context.
While the country is endowed with the richness of natural resources like big games,
beaches and landscapes it is, however, receiving fewer tourists in comparison to other
countries in the same region that are less competitive in tourist attractions like Kenya,
Namibia, and Botswana. (Figures 1.1 & 1.2). It is widely hypothesized that part of the
problem could be a poor understanding of the information sources preferred by tourists.
There could be numerous reasons for low visitations, and it may require the multi-phase
grand project to uncover all the issues. This project seeks to investigate tourist-preferred
information sources and information search behavior among international tourists who visit
the country.

6
Figure 1.1: Trends of international arrivals Source: African Development Bank Database (2016)
Figure 1.2: International arrivals in the year 2015 Source: World Bank Database (2016) in ‘000,000’

7
Tourism marketing, specifically the promotion of tourist attractions in the country
is mainly done by three parastatal organizations namely Tanzania Tourist Board (TTB),
Tanzania National Parks (TANAPA) and Ngorongoro Conservation Area Authority
(NCAA). Tanzania Tourist Board is the overall organization responsible for marketing
and promoting countrywide tourist attractions including activities or special events.
Tanzania National Parks (TANAPA) manages all protected areas designated as national
parks in the country by doing that it also markets attractions found in the national parks.
Ngorongoro Conservation Area Authority manages the Ngorongoro Conservation Area
and markets tourist attractions found within the area.
Tourism marketing is the main duty of the Tanzania Tourist Board. The Board is
responsible for marketing and promoting Destination Tanzania domestically and
internationally. On the other hand, TANAPA and NCAA have full-fledged directorates for
tourism planning and marketing. The three organizations have their own marketing
strategies. However, there is a lot of collaboration in areas that overlap among their
strategies especially integrated marketing communications (Own experience and personal
conversation with TTB Marketing Manager, 2017).
1.5. Problem Statement
Advances in information and communication technologies have led to the evolution
of endless information outlets (Mihajlović, 2012; Minazzi, 2015). It is impossible to be
present in all information channels and outlets in all languages with relevant contents for
all market segments. This calls for suppliers to identify market segments they want to serve

8
and develop meaningful profiles that could be addressed using various designs of
marketing mix which includes promotion mix (Bigne & Andreu, 2004; Budeva & Mullen,
2014; Masiero & Nicolau, 2012; Tkaczynski, Rundle-Thiele, & Beaumont, 2010).
Various studies have looked at binary relationships between various observed
variables as well as constructs (Fodness & Murray, 1997, 1999; Korneliussen & Greenacre,
2017b; Murray, 1991; Sharifpour, Walters, Ritchie, & Winter, 2013). The bigger and
comprehensive pictures of the relationships among numerous variables and constructs are
just handful; the majority of pictures are small and were developed in peace meals, largely
in Western economies. Cross-validations of findings of various studies in tourism are rare.
This, partly, limits generalizations of findings and a wider adaptation of theories; thus,
stunted development of tourism as a field of study and other related fields as well.
Understanding how inputs correlate with outcomes is very poor or limited across
many tourism businesses, attractions, and destinations in the tourism industry. It is largely
unknown how safari tourists get information about the destination, how the information
sources they use to influence their expectations and how their information search behavior
correlate with the length of stay, expenditure, number of attractions visited, and
satisfaction. The knowledge on how all these factors including tourist demographics and
involvement relate and interact with each other is almost non-existence in the literature of
emerging destinations.

9
1.6. Justification of the Study
This research is important for numerous reasons and enriches destination-
marketing literature in a number of ways. It builds upon a body of literature using the theory
of economics of information (Stigler, 1961) at the destination level, contrary to previous
studies that apply the theory at the business level outside the tourism industry. It
investigates touristic experience in a context of safari destination exploring tourist
involvement, information search, and destination satisfaction. This research help marketing
managers in Tanzania to be informed of what communication channels to be used when
promoting the destination to certain markets. It also integrates marketing communications
and tourist behavior literature.
Destination managers and marketers, among many of their key roles, are expected
to effectively and efficiently communicate products they offer to the markets they target.
This is often done through a variety of promotion mix or through integrated marketing
communication (IMC) strategies. However, before developing a promotion mix, it is
important that the managers and marketers have a better understanding of how their target
markets source information about destination products (Pike & Page, 2014).
Information search is one of the important early stages of the purchase decision
process by the tourist. The foundations of marketing touristic experiences, like other
services, rest upon its intangibility, where production and consumption take place at the
same point; such unique features make them even difficult to communicate appropriately
to the market. Such characteristics of tourist experiences are also difficult to evaluate in the
same way as manufactured goods (Smith, 2000; Zeithaml, 1981). Research on media

10
content analysis has revealed (Pickett, Grove, & Laband, 2001) that ads for services,
including tourist experiences, appeal more emotionally and marketers of tourist
experiences should provide tourists with solid attributes to help them comprehend and
evaluate tourist experiences prior to buying.
Literature relating to tourism marketing suggest numerous determinants of
information search (Gursoy & McCleary, 2003; Smith, 2000). Among those determinants
is consumer involvement (Gursoy & Gavcar, 2003). Even though this area has been fairly
developed little empirical research has examined the influence of tourist involvement on
sources of information using the economics of information theory when purchasing
touristic experiences. This research intends to examine the relationship between tourist
involvement and pre-trip information search and how that relate to destination satisfaction
as the ultimate goal of the tourist.
With the fast growth in diversity of marketing communication channels, tourism
businesses like tour operators, travel agencies, tourist attractions, and managers of tourist
destinations are increasingly becoming and often concerned with which marketing
communication channels to use to attract clients. This research intends to investigate
collective information sources including new forms of communication. Understanding the
information needs of different groups of tourists, the knowledge that would assist different
businesses and destinations in becoming successful at businesses they are in.
A deeper understanding of a variety of communication channels that consumers
prefer gives the marketing consultant priceless advantage (Holm, 2006; Kitchen & Proctor,
2015; Lamberti & Noci, 2010). Through communication channels, a consultant can learn

11
about the interests of the markets or segments of the markets he/she targets, and through
the same communication channels, a consultant can get the message across to the target
markets as well as getting feedback on how his/her business is being perceived by
consumers.
Tourism is an information-intense industry and the search for information is often
the first step in holiday planning by tourists (Gursoy & Umbreit, 2004). Information search
is simply the motivated acquisition of knowledge from the environment (Gursoy &
McCleary, 2003). The existing literature shows that there are consistency differences in
how communication channels and information sources are being used by different market
segments (Korneliussen & Greenacre, 2017). Tourists may use their previous experiences
and knowledge retrieved from memory when searching for particular information (Fodness
& Murray, 1998) and may often, especially in this era of information technology,
supplement with new up-to-date sources they can access (Korneliussen & Greenacre,
2017a).
Replicabilities of empirical studies in tourism are very rare, limiting the
applications of theories to only certain contexts. There are just a handful of cross-
validations of propositions from one context to different locations to confirm or disconfirm
previous findings. This has made it difficult to generalize the findings, thus obstacles for
the full development of theories or just development of theories with very limited
applications and contexts. This study broadens the application of the economics of
information theory in a new context and relatively different field too.

12
Sources of information play an integral role in destination awareness. A study was
conducted in 1990 to investigate the spectrum of information sources used by tourists from
European countries who visited national parks in the US (Uysal, McDonald, & Reid, 1990).
It found that there were significant differences in the use of information sources among
respondents from different countries and different ages. The publication also shows how
travel behavior influenced preferences of information sources. A similar researched on the
topic among first-time and repeat tourists from Germany, the United Kingdom, and France
who visited the USA. By using logit, discriminant and correspondence analyses to visualize
patterns in information source usage (Chen & Gursoy, 2000) found that there were
significant differences between first-time and repeat travelers in information source
behavior based on a spectrum of factors including country of residence and purpose of the
trip.
Among a few publications that attempted to look at the use of information sources
by consumers (Fodness & Murray, 1997; Gursoy & Umbreit, 2004; Korneliussen &
Greenacre, 2017; Uysal et al., 1990) have made a call for a broad investigation on this topic
focusing on different tourist products and different destinations as well as market
generating countries. However, there is no single publication so far, on how safari tourists
source their information and the reasons behind their preferences. After two decades of
researching and a fairly large volume of publications on tourist information sources, it is
time to get into the specifics of how tourists with different demographics and different
levels of involvement source information for specific destinations as well as an explanation
of any variations. It is largely unknown how different components of integrated marketing

13
communication channels interact to result in high impact for both different stakeholders
like travel agents and destination managers. It is undeniable that there are variations among
tourists’ interests in how they consume information as well as how they source information
about particular destinations or attractions. It is, therefore, crucial to gain insights that are
specific to different market segments as well as different attractions. While there are
numerous publications about how markets could be segmented based on tourism
information sources, there is limited research on how different segments of safari tourists
differ in their interests for information sources and any underlying reasons for such
differences if there are any. Therefore, there is a need for scientific research to investigate
on how safari tourists source external information when planning their holidays.
As mentioned earlier, tourism is an information-intense industry, yet one would
hardly see studies that make application of the economics of information theory in
investigating information search behavior among tourists. This study intends to make
application of this theory to research on how involvement influences preference of
information sources among tourists.
1.7. Study Objectives and Research Questions
The overall goal of this project is to understand how consumer (tourist)
involvement influence use of information sources and destination satisfaction by
international tourists to Tanzania. It also seeks to uncover the reasons behind such
preferences and any variations of preference among these international tourists.

14
Specifically, this project sought to answer the following questions:
i. Which information sources are mostly preferred by international tourists who visit
Tanzania and why?
ii. How does consumer involvement as an antecedent construct influence preference
in information sources and types of information search among international tourists
who visit Tanzania?
iii. How does breadth, and depth of information search relate to ease of evaluating
search qualities?
iv. How does ease of evaluating search qualities, breadth, and depth of information
search relate to satisfaction in collected information?
v. How does satisfaction with collected information related to destination
satisfaction?
This project is expected to result in a deeper understanding of information sources
that are mostly preferred by tourists and the reasons for such preferences. Such insights
will help in the advances of the theoretical foundation and certainly would be very
beneficial to destination management organizations for them to improve their marketing
communication strategies. It will uncover the insights on how the breadth of information
search and depth of information search relate to important outcomes like tourist experience
and satisfaction. It will also help management of these organizations make research-backed
decisions when it comes to different combinations of marketing communication tools for
different market segments. The overall impact of the project is to increase the number of
international tourists.

15
1.8. Study Limitations
This study has a few limitations. Data were collected at the end of the low season
(in May) before the high season started (in June). A similar study if conducted in high
season may result in different conclusions from this study. The study focused on
international tourists departing Tanzania; its findings cannot be used in making policies
regarding domestic tourists and visitors. Interviews conducted were not in-depth enough,
lasted for a maximum of 15 minutes. Only consumer-focused information sources were
used; no attention was paid to business-to-business information sources.
1.9. Definitions of Terms
A few terms and phrases those relating to operationalization are used in this study
and here are their definitions:
Tourist expectations: Tentative mental or neural representations of future events,
destination mental image or unfinished learning processes that a tourist has about
the destination or an attraction (Gnoth, 1997).
Satisfaction: The extent to which tourist expectations have been met (Grimmelikhuijsen &
Porumbescu, 2017).
Tourist experience: Tourist experience is the ‘‘pure’’, ‘‘net’’ or ‘‘peak’’ experience,
usually derived from the attractions (Quan & Wang, 2004). Tourist experience is a function
of tourist expectations.

16
International tourist: Any person of age 18 years and above who is visiting Tanzania for a
period of not less than 24 hours and not more than 365 days for any purpose (UNWTO,
2007). It includes residents who have been in Tanzania for not more than a year.
Information source: Is a thing, technology, platform, place, or a person, from which an
international tourist obtained diverse knowledge about Tanzania as a tourist destination
(Fodness & Murray, 1999).
Diversity/breadth of information sources: Forms or types of information sources. In this
study it is measured by the number of information sources a tourist consulted when
planning their trip to Tanzania.
The depth of information search: Frequency of using an information source.
Tourist involvement: Unobserved state of motivational, arousal or interest in a tourist
destination or tourist activity or an attraction (Dimanche, Havitz, & Howard, 1991).
1.10. Organization of the Research Report
This dissertation is composed of seven chapters. Chapter One highlights the
introduction of the study, background, justification, and objectives of the study. Chapter
Two provides a review of the current literature regarding the key concepts and constructs
as well as how they relate to each other. Additionally, Chapter Two also discusses existing
knowledge gaps, theoretical and conceptual frameworks. Chapter Three focuses on
methodological approaches used in designing tools (questionnaire and interview checklist)
for data collection and well as the analytical approaches to be used. Chapter Four presents
descriptive statistics results where demographics, the main purpose of the trip, size and
composition of travel party, length of stay and expenditure are presented. Chapter Five

17
presents inferential statistical results in which measurement and structural models are
prepared and assessed. Hypotheses are also tested in this chapter. Chapter Six is about
analysis and presentation of qualitative results. In this chapter, quotes from participants are
used to further inform the explanatory results in Chapter Five. The last chapter of this
dissertation is Chapter Seven which presents conclusions, managerial and theoretical
implications are presented. It also presents the limitations of the study as well as avenues
for future research.

18
CHAPTER TWO
LITERATURE REVIEW
2.1. Introduction
This chapter presents previous work in the general area of customer information
search behavior and specific in the tourism industry. Review of existing literature in this
area included main publications from the late 1960’s to date. The review was done in
different forms of publications that included peer-reviewed journal publications, general
public periodicals, industry reports, and textbooks. The saturation of review was
determined when similar literature knowledge started repeating.
2.2. Information Search in the Tourism Industry
Sources of information are among the many ways in which people acquire
knowledge or become aware of the existence of something somewhere. Acquired
knowledge could be temporary or permanently stored in the brain and could be used for
decision-making processes in daily life. In the tourism and travel industry, holidays have
potentials to motivate information search behaviors by potential travelers. Information
search enables them to make informed decisions about their travel and vacation interests
and plans (Fodness & Murray, 1998). Information could be acquired both consciously and
subconsciously (Gursoy & McCleary, 2003). The topic of information search has been
fairly researched on in consumer studies including tourism (Berning & Jacoby, 1974;

19
Fodness & Murray, 1997; Gursoy & Chen, 2000; Jacobsen & Munar, 2012; Pan &
Fesenmaier, 2006).
Previous studies in the area of information search behavior have developed some
typologies on how different variables could influence external information search behavior
(Srinivasan & Ratchford, 1991). That tourists’ choices of information sources are a discrete
information search strategy with underlying spatial, temporal, and operational dimensions
and; that tourists could be segmented by the information sources they prefer (Fodness &
Murray, 1998). A number of models have been proposed to explain tourist information
search strategies (Fodness & Murray, 1999) in which tourist information search strategies
are said to be the outcome of non-static complex processes where numerous information
sources are used in unique algorithms to respond to internal and external contingencies
when planning their holidays. Gursoy & McCleary (2003b) developed an integrative
framework to explain how factors like familiarity, expertise, and involvement could
influence information search strategy of the traveler.
The typologies, models, and frameworks in information search behavior have often
included aspects of the environment, contextual variables, consumer characteristics as well
as product features (Alba & Hutchinson, 1987; Chen & Gursoy, 2000; Fodness & Murray,
1997, 1998, 1999; Gursoy & McCleary, 2003; Gursoy & Umbreit, 2004; Korneliussen &
Greenacre, 2017a; Vogt & Fesenmaier, 1998). Information search behavior in tourism
could be thought as a sequence of correlated travel information acquisition behaviors,
contexts, and characteristics.

20
The majority of information search studies in the industry of tourism and hospitality
adopt one or both of the two frameworks, the strategic model (Snepenger, Meged, Snelling,
& Worrall, 1990) and the contingency model (Schul & Crompton, 1983). The strategic
model suggests that information search strategy is a combination of numerous information
sources, while the contingency model seems to be more comprehensive and defines
information search strategy by taking specific variables (characteristics of the trip, traveler,
and products as well as the contextual factors) into consideration (Fodness & Murray,
1999).
Tourist information search strategies are the result of a dynamic process in which
travelers use various types and amounts of information sources to respond to internal and
external contingencies in vacation planning (D’Ambra & Mistlis, 2005; Fodness & Murray,
1997, 1998). According to these authors, in any given decision-making situation, there is a
minimum of three different strategies for information search: spatial, temporal, and
operational. The spatial dimension refers to the radius of search activity: internal (accessing
the information from memory) or external (acquiring information from surrounding
environment) (Fodness & Murray, 1997; Gursoy, 2001; Gursoy & McCleary, 2003).
Internal information search utilizes past experiences and knowledge stored in one’s brain.
It is the most readily available source of information for the majority of daily decisions.
External information search often happens when there is insufficient internal knowledge to
make decisions or solve a problem. As the word external suggests, this type of information
search does seek information from external sources like magazines, guided books and
asking friends to mention a few. In search, the decision is often delayed until needed

21
knowledge is gained to a certain threshold level. Temporal information search strategy
represents the timing of search activity. Under this dimension, the search can be either
ongoing, accumulating knowledge base to be used in the future purchase decisions
(Fodness & Murray, 1998). An operational information search strategy is essentially a
search that focuses on particular sources due to their perceived effectiveness in problem-
solving and decision-making (Fodness & Murray, 1999).
According to the study by Fodness & Murray (1998), commercial travel
guidebooks, Destination Marketing Organization (DMO) guides, and printed matters like
news bulletins tended to be used along with at least three other information sources. While
according to these authors, individual experience, travel agencies, and friends or relatives
were observed to be the information sources that mostly used alone. When planning a trip
in any given purchase decision, a minimum of three separate information searching
strategies: spatial, temporal, and operational are needed.
Tourism is an information-intense industry (Kim, Chung, & Lee, 2011; Xiang &
Gretzel, 2010). It is an industry that is heavily dependent on information as one of the main
lubricants for it to function at optimum levels. Most of the tourism services or products are
consumed at production points, but part of the purchases happens before one gets to these
production points. So, tourists are required to assess the product or experience through
information they can access. Such an assessment is referred to as search qualities in
marketing (Mortimer & Pressey, 2013). Nowadays, tourists have access to numerous and
varied information sources to aid their trip planning. The literature suggests that the search
for information used to plan leisure travel is likely to take longer and to involve the use of

22
more information sources than the search for information about most other consumer
products (Fodness & Murray, 1998).
Tourists do consider a number of factors when deciding which information search
strategy to use. Some of these factors are the amount of investment and expected benefits
(Fodness & Murray, 1997; Pan & Fesenmaier, 2006). Other factors are familiarity,
involvement, trip composition, the purpose of the trip, product characteristics and
accessibility of information technologies (Fodness & Murray, 1998; Gursoy & McCleary,
2003; Pan & Fesenmaier, 2006).
While information search is an active area of tourism research with relatively
extensive conceptual and empirical foundation, the specific topic of relationship between
tourist choice of information sources and the outcomes that are also considered to be part
of destination performance metrics is an important concern that has not received a
considerable attention in a broad spectrum of contexts.
It is unclear how tourists weigh and factor in numerous personal outcomes when
searching for travel-related information. It is undoubted that such weighing varies across
tourists. The breadth and depth of information search could potentially influence some of
the outcomes. As mentioned earlier, the motive one searches for information before a
purchase is to have a better knowledge and thus reduce the uncertainty of making a wrong
purchase decision (Fodness & Murray, 1997; Vogt & Fesenmaier, 1998). Additionally, the
function of an individual’s motives is to protect, satisfy, and enhance themselves (Gursoy,
2001). Information search could have various immediate outcomes depending on the initial
purpose of searching; it could be improving one’s awareness, fulfilling curiosity thirst,

23
facilitate a process of making an informed decision like making an informed purchase or
consumption option (Engel, Blackwell, & Miniard, 1995; Fodness & Murray, 1998).
However, most of the studies in the area of information search in the tourism industry were
conducted in western destinations, and there is a lack of sufficient knowledge in the
existing literature on how tourists to a safari destination search for information and what
are the immediate outcomes.
Theory of information economics (Stigler, 1961) proposes that an individual is
likely to invest more in information search as long as they perceive the benefits of making
informed purchase outweighs the cost for information search (Fodness & Murray, 1997;
Gursoy & Umbreit, 2004; Nelson, 1970; Pan & Fesenmaier, 2006; Stigler, 1961; Urbany,
1986). Some of the expected personal outcomes of information search are improved market
expertise and enhanced overall satisfaction (Fodness & Murray, 1998). However, there is
a lack of tourism studies that have investigated how investment in information search
relates to tourist satisfaction among other outcomes using the theory of information
economics in a broader context.
2.3. Search Qualities
Nelson (1970) established that when consumers are looking for quality information,
they can search through different information sources or can experiment by experiencing
actually. Later on, Darby & Karni, (1973) established that there are qualities of products
or services that are difficult to evaluate by neither searching nor experiencing, these are
credence qualities like medical operations. It is also argued that the majority of

24
manufactured products are easy to evaluate their qualities through searching while the
quality of normal services can be better evaluated after having experienced them (Zeithaml,
1981). Specialized services are difficult to evaluate their qualities even after having
experienced them (Darby & Karni, 1973). Services like touristic experiences would,
therefore, expected to be more difficult to evaluate through searching than after having
experienced them. There is a lack of publications that have investigated the ease/difficulty
of evaluating touristic experiences using the SEC (Search, Experience, Credence)
framework (Zeithaml, 1981). Within the general marketing field, a few researchers have
looked at it (ease/difficulty of evaluating quality) through the SEC framework (Ford et al.,
1988; Iacobucci, 1992; Mitra, Reiss, & Capella, 1999; Smith, 2000). Others have
researched on the topic from specific product contexts (Moorthy, Ratchford, & Talukdar,
1997), while a few have studied this question from a context of service versus product
(Murray, 1991; Smith, 2000).
2.4. Involvement
Involvement is unobservable state of motivation, arousal or interest (Rothschild,
1984; Zaichkowsky, 1986). According to Havitz and Dimanche, (1990) involvement is “a
psychological state of motivation, arousal, or interest between an individual and
recreational activities, tourist destinations or related equipment, at one point in time,
characterized by the perception of the following elements: importance, pleasure value, sign
value, risk probability, and risk consequences”. It is evoked by particular stimuli or
situations and has some drive properties. Involvement has been suggested by (Cai, Feng,

25
& Breiter, 2004a; Carneiro & Crompton, 2010; Prebensen, Woo, Chen, & Uysal, 2012a)
as an important concept for research to consider in an attempt to understand tourist
information search behavior. Its consequences are types of searching, information
processing and decision making (Dimanche et al., 1991). Involvement motivates
consumers, including tourists in information search behaviors (Beatty & Smith, 1987).
Involvement is linked with interest and excitement for product or experience (Jamrozy,
Backman, & Backman, 1996a). It influences consumer attitudes and behaviors (Cai et al.,
2004a).
The construct of involvement has been broadly used in the consumer studies
including marketing and information search behavior (Bienstock & Stafford, 2006;
Dimanche et al., 1991; Gursoy & Gavcar, 2003; Gursoy & McCleary, 2003; Zaichkowsky,
1986, 1994). While there are commonalities in the conceptual boundaries between leisure
and consumer behavior, there are still variations in the nature of involvement between the
two (Dimanche et al., 1991). Involvement has been extensively used in tourism studies as
both an antecedent due its motivational, arousal, and its predicting characteristics
(Gahwiler & Havitz, 1998; Kim, Scott, & Crompton, 1997; Kyle & Chick, 2002; Hwang,
Lee, & Chen, 2005; Kyle, Kerstetter, & Guadagnolo, 2002; Mittal, 1989), and as an
endogenous construct (Jang, Lee, Park, & Stokowski, 2000; Kyle, Absher, Hammitt, &
Cavin, 2006; Madrigal, Havitz, & Howard, 1992; Zalatan, 1998) as it could be influenced
by other constructs as well. The level of involvement relates to the intention of participating
in recreational activities and travel (Kim et al., 1997; Kyle et al., 2006; Park, Yang, Lee,

26
Jang, & Stokowski, 2002; Williams, 1984). Involvement also triggers the search for
information (Hyde, 2000; Luo, Feng, & Cai, 2004).
According to Gitelson & Crompton, 1983, Hyde, 2000, the amount of information
search by a tourist relates to the level of purchase involvement. However, other researchers
(Dimanche et al., 1991; Otto and Ritchie, 1996) suggest that the level of involvement might
not necessarily relate to cognitive decision-making and that the relationship between the
level of involvement and decision-making when planning a touristic trip is not always
linear (Murray, 1991). Involvement is also observed to drive tourist’s physical, emotional,
spiritual and mental engagement in a touristic experience and thus enhancing the overall
individual’s satisfaction (Andres & Dimanche, 2014; Prebensen, Woo, & Uysal, 2013b;
Prebensen, Woo, Chen & Uysal, 2012).
In this study, involvement is being looked at from an individual tourist, how
involved they were with a safari destination and how the resulting response relates to
information search behavior. Tourists, like other consumers, assign logical and emotional
values to experiences (Zaichkowsky, 1986, 1994). The level of involvement is observed to
correlate positively with the perception of the consumer on how the touristic experience is
personally relevant to them. In that sense, involvement has a strong connection with
affective and cognitive parts of one’s brain (Martín-Santana, Beerli-Palacio, & Nazzareno,
2017; Prayag & Ryan, 2012; Yuksel, Yuksel, & Bilim, 2010). The stronger the personal
relevance and feeling a consumer has towards certain experience, the higher the level of
involvement is likely to be observed between the person and the experience. Therefore,
involvement could be used to assess one’s feeling, motivation, arousal and personal

27
relevance towards certain product or experience. Also, involvement has high potential in
influencing a traveler’s information search behavior (Havitz & Dimanche, 1999; Hyde,
2000).
A tourist’s level of involvement with an attraction/activity or destination is likely
to be determined by the degree to which they perceive the attraction/activity or destination
to be personally relevant. In an effort to conceptualize the construct of involvement, many
theoretical models for the construct have evolved (Havitz and Dimanche 1999; Rothschild
1984) as well as measurement scales to operationalize the construct. However, two main
measurement scales for involvement are dominant and have gained broader acceptance in
different contexts. The personal involvement inventory scale (PII) was developed by
(Zaichkowsky, 1986) and consumer involvement profile (CIP) a multi-dimensional scale
that was initially developed in French by (Kapferer & Laurent, 1985). The initial versions
of the two measurement scales were modified to address observed weaknesses (Kapferer
& Laurent, 1993; Zaichkowsky, 1994).
Personal involvement inventory was initially developed as a unidimensional
construct with a total of 22 items (Zaichkowsky, 1986). In her conceptualization, she
identified involvement as enthusiasm, excitement, and interest in the product class,
activities, or information. The author also argued that an involved consumer assigns both
rational and emotional and values to a product, brand, an experience (Zaichkowsky, 1986).
Thus, involvement expresses how personal, relevant a product, brand, or experience is to
the consumer. While the measurement scale PII is extensively tested and accepted as a
unidimensional, other authors (McQuarrie and Munson 1987; Mittal 1989; Broderick and

28
Mueller 1999) have found it to be a two-factor construct. The measurement scale was
observed to have too many unnecessary items and later on was modified to a newer version
of 12 items (Zaichkowsky, 1994). Since then the measurement scale has been widely used
as a 12-item unidimensional scale.
On the other hand, CIP a multi-dimensional scale has as well extensively been used
and widely accepted among authors (Broderick and Mueller 1999; Havitz, Dimanche and
Howard 1993; Jamrozy et al. 1996; Kapferer and Laurent 1993; Laurent and Kapferer
1985; McQuarrie and Munson 1987). The authors who initially developed the suggested
five dimensions of the construct of involvement; the importance of the product or brand
what it means personally to an individual; the pleasure value of the product or experience,
its emotional appeal, its ability to provide pleasure and enjoyment; the symbolic or sign
value attributed by the consumer to the product, its purchase, or its consumption; the
perceived importance of negative consequences if it happens a poor choice has been made;
and the perceived importance of making such a choice.
Tourism authors (Havitz and Dimanche 1999) who have extensively researched on
the construct of involvement in the contexts of tourism and leisure agree that the construct
is multi-dimensional and that a single dimension proposed by (Zaichkowsky, 1986, 1994)
cannot capture sufficiently the nomological radius of the construct. The tourism research
(Havitz and Dimanche 1999) have also criticized the dimensions of perceived importance
of negative consequences and the perceived importance of making a choice for being too
simple to capture the risk involved in leisure, recreational, and touristic experiences. It is
generally agreed that a multi-dimensional scale of involvement is preferred in when

29
measuring visitors’ involvement (Havitz and Dimanche 1990; Havitz et al. 1993; Jamrozy
et al. 1996; Reid and Crompton 1993; Gursoy, 2003). Hence this study also adapts the
multi-dimensional measurement scale of involvement that was initially developed by
(Kapferer & Laurent, 1985; Kapferer & Laurent, 1993) with some modifications as
suggested by (Dimanche et al., 1990; 1991, 1993; 1999).
There are mixed and conflicting results on the influence of involvement on
information search behavior. A study conducted by Hyde, (2000) involving independent
travelers in New Zealand, confirmed that involvement had a significant impact on
information search. However, the author did not make it explicit which involvement
measurement scale of the main two was used and how it was used. Another study by Maria
João Carneiro & Crompton (2010) investigated the influence of involvement on the search
for information among visitors of two national parks in Portugal. They adapted only three
dimensions (interest, pleasure, and sign) of consumer involvement profile (Dimanche,
Havitz, and Howard, 1991; Laurent and Kapferer, 1985). The authors run multiple layers
of analyses, and it resulted that involvement did not have a significant influence on
information search for the two visited parks it had only marginally significant (p = 0.04)
influence on information search for alternative destinations that were considered to be
visited, however, were not visited. The study by Cai, Feng, and Breiter (2004) using three
categories of involvement level; high, medium, and low found that high-involvement
positively relates to the use of the internet when searching for destination information.
However, the study did not use any of the two PII, and CIP mainly used measurement
scales for consumer involvement.

30
This study uses the full (five dimensions – Table 3.4) involvement measurement
scale (Kapferer & Laurent, 1985, 1993; Laurent & Kapferer, 1985) as an antecedent
construct to investigate how involvement relates to investment in information search in
terms number of information sources consulted (breadth of information search) and the
frequency of use of information source (depth of information search) (Figure 2.1). The use
of a multi-dimensional measurement scale of involvement suits the context of this study as
Tanzania is largely being perceived as an exotic destination among tourists from western
markets. Am multi-dimensional scale is therefore deemed appropriate to capture a wider
radius of the involvement construct and the variations among participants from different
countries.
While there are mixed results regarding the use of the construct of involvement as
a predictor for information search behavior among tourists, we should further current
research effort to wider contexts. As it could be seen some studies in the contexts of
tourism, have used PII (Jamrozy et al., 1996a) while others have used selected dimensions
of CIP (Maria João Carneiro & Crompton, 2010). This study uses all five dimensions of
CIP as an antecedent construct in understanding it relates with information search behavior
among international tourists who visit Tanzania. It is hypothesized that there are significant
positive relationships between involvement and the breadth and depth of information
search.
H1a: There is a statistically significant positive relationship between tourist
involvement and the breadth of information search.

31
H1b: There is a statistically significant positive relationship between tourist
involvement and the depth of information search.
2.5. Information Sources and Search Behavior
Information sources have been classified in numerous ways. Some researchers have
classified them regarding personal vs. impersonal (Engel et al., 1995; Hawkins, Best, &
Coney, 1992). Commercial or marketer-controlled information sources include personal
selling, promotion, public relations, advertisements, use of consultants, travel agents, trade
fairs, brochures, and exhibitions (Spreng, MacKenzie, & Olshavsky, 1996). A few other
scholars have classified information sources as consumer controlled or interpersonal that
include family and friends. Information sources that are classified as neutral include all
those that are controlled neither by consumers nor by marketers like unbiased ratings,
guidebooks, consumer reports, critiques and reviews (Beatty & Smith, 1987; Kotler &
Armstrong, 2015). This research adopts the three-source categorization of information
sources; marketer controlled, consumer controlled and neutral sources (Mitra et al., 1999;
Moorthy et al., 1997; Murray, 1991; Smith, 2000). The use of this categorization of
information sources best suits this study and managerially relevant.
Goods are generally regarded as the contrast of services, as they are tangible, easily
standardized, and produced before consumption (Zeithaml, 1981). Such characteristics
make marketer-controlled mass media ideal platform for promoting and advertising of
goods, and thus easy to evaluate prior to purchase (Pride & Ferrell, 2016; Smith, 2000;
Vakratsas & Ambler, 1999; Zeithaml, 1981). Additionally, goods and services that are

32
relatively easier to evaluate before a purchase decision is made are less complex
(Iacobucci, 1992). Marketer controlled information sources are cheaper for a tourist and
are easily obtained in comparison to other categories of information sources, consumer
controlled and neutral ratings. Consumers tend to trust marketer-controlled information
sources only for those goods and services that can be easily evaluated with confidence
before purchase (Ford et al., 1988). In general, market-controlled information sources are
impactful in promoting or advertising products and services that are easily evaluated prior
to purchase (Smith, 2000).
Consumers tend to rely on personal sources of information when moving to the
right of Zeithml’s SEC continuum or in a simple language when moving from left, i.e.,
from manufactured goods to general/normal services to more specialized, complex and
highly skilled services (Zeithaml, 1981). This also entails the direction of flow of
consumer-controlled information sources. Services like touristic experiences in which
production and consumption take place simultaneously are somewhat challenging to
evaluate the quality of experience due to their characteristics of being difficult to
standardize, intangible and highly perishable (Shostack, 1977). Advertising of touristic
experiences, therefore, poses a number of challenges. It requires the strategy to be built
around making the experience feel like tangible good to make it easier for prospective
tourist to evaluate before purchasing. By so doing, the touristic experience would be good-
like with more explicit search qualities and thus relatively easier to evaluate (Pride &
Ferrell, 2016). Noncommercial, personal information sources have been found to be
significantly influential in consumer decision-making (Gilly, Graham, Wolfinbarger, &

33
Yale, 1998). Such information sources are often rated as the most important sources
especially when the consumer perceives high risks (Dawes et al., 1991; Murray, 1991).
Personal-noncommercial information sources like family and friends are more effective
and reliable before the purchase of touristic experience decision is made (Young, 1981).
A few researchers have investigated the impact of the closeness of the word-of-
mouth recommendation. If the source of information is someone who is a friend or relative
of the potential buyer the influence is likely to be higher as the ties strength is stronger and
the information being shared is well tailored to the interests of the decision maker and also
the trust of the information is high (Duhan, Johnson, Wilcox, & Harrell, 1997). Stronger
ties are very instrumental in influence while weak ties are better for information flow. As
the tourist gets closer to deciding which touristic experience to purchase, the perceived risk
increases and likely to look for personal advice from stronger ties (Smith, 2000).
Further literature on this topic informs that neutral sources such as consumer reports
or other sources of unbiased information are regarded to be more objective sources of
information before a purchase is made (Ford et al., 1988). In the tourism industry, these
are commonly known as the list of “destinations to visit this year,” and some organizations
(Safari.com, Lonely Planet, TripAdvisor, Forbes, National Geographic, and CNN to
mention a few) do issue, these lists, often at the beginning of the year. Such neutral ratings
and reviews are considered by tourists to be more objective and are relied on as they
provide some credibility and tangibility to disembodied existence (Ford et al., 1988; Mitra
et al., 1999).

34
The fact that a tourist will find it hard to evaluate a touristic experience in an exotic
destination before purchase; the purchase may be perceived riskier especially when
considering the amount of monetary investment required (Murray, 1991). The perception
of risk would make a potential tourist search for more information in different platforms
and sources as well as the quantity of information collected is likely to be large in order to
help this potential tourist evaluate the quality of touristic experience through search. Also,
the theory of economics of information argues that consumers, in this case, tourists, search
for information until they are satisfied with the amount of information and are sufficiently
informed to make a decision (Nelson, 1970; Stigler, 1961; Urbany, 1986). The search for
information would include a broad number of information sources but also deep among
reliable information sources. Breadth and depth of information search are likely to make it
easier for the tourist to evaluate the quality of touristic experience (Smith, 2000). This
study, therefore, hypothesizes that:
H2a: The diversity of information search is statistically significantly related to ease
of assessing quality through searching.
H2b: The depth of information search is statistically significantly related to ease of
assessing quality through searching.
As mentioned earlier, the increase in information collected increases the knowledge
of the tourist incrementally until information saturation point is reached (Jiang, Awadallah,
Shi, & White, 2015). Information saturation point is the point at which any additional
information does not add any new knowledge to the decision maker. It is the point when
one feels informed enough to decide on a purchase or not. It is the point when one feels the

35
risk of making an uninformed decision has been minimized to the manageable levels. When
a tourist possesses sufficient knowledge to formulate a purchase decision effectively, they
become satisfied with the information collected. Because it is a function of the discrepancy
between the information available to the tourist and the knowledge required for an
informed decision to be made (Smith, 2000). It is therefore hypothesized that the diversity
of information sources used and the depth of information collected will have a positive
relationship with information satisfaction.
H3a: Breadth of information search is positively related to satisfaction with
information search.
H3b: Depth of information search is positively related to satisfaction with
information search.
H3c: Ease of search qualities is positively related to satisfaction with information
search
As noted by Gursoy (2001) three notable theoretical advances in information search
behavior have been observed in the broader area of consumer behavior studies. The first is
the psychological approach. Under this stream, consumer and product characteristics are
correlated with task-related constructs as well as involvement (Cai et al., 2004a; Jamrozy
et al., 1996a; Prebensen et al., 2012a). The second stream relates to the economics of
information search. This approach applies cost-benefit frameworks in information search
studies. The economic theory of search suggests that consumers weigh cost and benefits of
search when making search decisions. The third stream is the consumer information
processing. This stream deals with memory and cognitive aspects of information

36
processing theory (Egelhoff, 1991; LaBerge & Samuels, 1974). Other scholars in this area
like (Boulding, Lee, & Staelin, 1994; Rao & Monroe, 1988; Schmidt & Spreng, 1996)
argue that there are essentially only two approaches for studying information search
behavior which are information processing and economics of information theories.
According to Schmidt & Spreng (1996), motivational and psychological perspectives of
information search are, basically, under information processing theory. This study adapts
the economics of information theory (EOI).
2.6. Tourist Expectations, Experience, and Satisfaction
Expectations are tentative mental or neural representations of future events or
unfinished learning processes (Gnoth, 1997). They could essentially be considered as
variations of beliefs (Hsu, Cai, & Li, 2010). Expectations have the potential to contain in
them a considerable amount of effect especially in situations of unknowns like experiences
that have had never been encountered before. One of the foundational theories to explain
the formation of expectations is the expectancy theory formulated by Vroom, (1964).
Expectancy could generally be considered as the degree of belief that consequences
succeed acts (Feather, 1990). The expectancy theory tries to correlate action to the
perceived attractiveness of expected outcomes (Hsu et al., 2010). The expectancy theory is
forecaster in nature it tries to predict the future rewards and thus a motivation to participate
in an activity. Such future anticipatory rewards are based on an individual’s knowledge or
beliefs. In the context where a potential tourist is involved in evaluating destinations and
other tourism facilities, through searching for information comes across a volume of

37
information about different attributes of the destination. This information constantly shapes
and re-shape the expectations of the potential tourist about the destination.
Individual’s motivation to engage in an activity is a function of the expectation they
hold that they will be able to realize desired outcomes. As mentioned earlier, when a person
is involved in information search for a destination, the immediate expectations are to get
their understanding improved. Improvement in knowledge about the destination they are
planning on visiting would help them reduce uncertainty through making informed
decisions (Fodness & Murray, 1999; Gursoy & McCleary, 2003; Vogt & Fesenmaier,
1998). It is undoubted that engaging in information search will influence an individual’s
expectations about the destination. An individual’s attitude sets them to respond through
assessment of perceived quality, grouping, and interpreting spectrum of experiences in line
with expectations (Ajzen, 2005; Fishbein & Ajzen, 1975). In this study, expectations will
be assessed indirectly through tourist’s actual experience as to how the expectations were
met, exceeded or short of.
The quality of purchase decisions could be assessed from various tourist’s
consumption outcomes in terms of perception, satisfaction/dissatisfaction, destination
image and loyalty (Fodness & Murray, 1998). This study will focus on tourist satisfaction
and its relationship with destination expectations shaped by the information a tourist got
about the destination. Tourist satisfaction is the outcome in the comparison between tourist
expectations about various attributes of the destination and tourist’s actual experience
(Pizam, Neumann, & Reichel, 1978). Some models and frameworks have been developed
over the years to explain the customer satisfaction process. Of the frameworks and models,

38
Expectancy Disconfirmation Theory (Oliver, 1980) is among the popular ones. Tourist
satisfaction is a function of the match between expectations tourist had about the attractions
or destination and the performance of the actual touristic experience. When it happens that
the expectation and the perception differ, a positive difference would mean over
satisfaction while the negative difference would mean dissatisfaction. In other words,
higher performance experience than expected would mean over satisfaction while a lower
performance experience than expected would translate into dissatisfaction (Hui, Wan, &
Ho, 2007; Oliver, 1980). Following Oliver (1980) framework, Expectancy
Disconfirmation Paradigm evolved. The paradigm has received critique (Yüksel & Yüksel,
2001), broad applications (Chon, 1989; Hui et al., 2007; McKinney, Yoon, & Zahedi, 2002;
Oliver, Balakrishnan, & Barry, 1994) as well as its extension (Grimmelikhuijsen &
Porumbescu, 2017; Zehrer, Crotts, & Magnini, 2011). The paradigm has been tested across
different fields and confirmed to work well in a broad spectrum (Chon, 1989; Lankton,
McKnight, Wright, & Thatcher, 2016; Petrovsky, Mok, & León-Cázares, 2017; Qazi,
Tamjidyamcholo, Raj, Hardaker, & Standing, 2017; Siu, Kwan, Wong, & Zhang, 2017;
Zehrer et al., 2011).
This study adapts the conceptual background of the expectancy disconfirmation
model in measuring tourist satisfaction. It does not intend to test the theory. Satisfaction of
the tourist will be measured on how expectations were met after actual experience.
Additionally, overall tourist satisfaction will be measured using a single item. In this study,
satisfaction will also be used to assess the quality of the purchase. A tourist who is satisfied
with the information they received and felt knowledgeable enough to decide to visit

39
Tanzania; there shouldn’t be a significant discrepancy between their actual experience and
expectations. It is therefore hypothesized that:
H4: There is a significant positive relationship between satisfaction with information
collected with destination satisfaction.
2.7. Economics of Information Theory
The economics of information (EOI) theory was developed by Stigler (1961). The
author proposed that consumers learn themselves about what is offered in the marketplace
only to the point where the marginal cost of gathering more information equals or exceeds
the marginal return (Ratchford, 1980; Urbany, 1986). Consumers weigh the costs and
benefits when searching for information (Moorthy et al., 1997). Since there are variations
on the perception of cost and benefits among buyers, the level of being informed about
what is available in the marketplace varies as well. Some buyers will be well-informed than
others. The theory put forward six propositions:
i. The expected savings from a given search are related positively to the dispersion of
prices.
ii. The extent of search is negatively related to the cost of search, ceteris paribus.
iii. The existence of price dispersion in the marketplace is due only partially to seller
heterogeneity. It is also a manifestation of buyer ignorance.
iv. The gain from search decreases with continued search (i.e., there are diminishing
returns to continued search).

40
v. The more spent on the purchase and the larger the quantity of purchase, the greater will
be the return from the search.
vi. The more search that a buyer undertakes, the lower will be the average price paid, and
the smaller will be the variance of prices the buyer considers.
Seller pricing behavior that results in price dispersion is affected by (a) buyer
search, (b) how quickly market information becomes obsolete, and (c) advertising
(advertising works to inform consumers better and leads therefore to less price dispersion)
(Stigler, 1961; Urbany, 1986). The original Stigler's model has undergone a few minor
revisions (Ratchford, 1982; Rothschild, 1978; Telser, 1973; Urbany, 1986; Weitzman,
1979) however; these foundational propositions are still intact.
The focus of this research is proposition (v). Under this proposition, this research
explores the level of investment a tourist makes for information search and how such
investment relates to perceived returns. Regarding investment a tourist makes, three main
variables are considered; involvement, the frequency of information search (depth of
information search), and the number of information sources consulted (breadth of
information search). Regarding the returns for investment, this research considers the very
primary outcome, the satisfaction with information gained from the search, as well as
tourist satisfaction with the destination after having actually visited.
Previous publications (Darby & Karni, 1973; Mortimer & Pressey, 2013; Nelson,
1970) have established that when consumers are searching for information, they usually
have two main goals; information for price and quality of the good. Additionally,
information for accessibility. In looking for quality information, consumers can decide to

41
search across numerous sources of information or by experimenting, i.e. actual
consumption and learn from experiencing the product (Nelson, 1970). However, there are
product or service qualities that are difficult to assess even after consumption; they require
more investment to gain, Darby & Karni, (1973) call such quality information credence.
Search qualities are those that are evaluated in order for a purchase decision to be
made. Such a process may involve comparison and cross-validation of quality information
across different information sources. The comparison is extended to include different
similar products or services using a broad list of criteria like perceived experience and price
(Darby & Karni, 1973; Nelson, 1970; Zeithaml, 1981). Participants in this study will be
asked to evaluate easiness of assessing destination qualities through searching prior to the
actual visit as well as after having visited.
Experience qualities are those that consumption must take place first for them to be
evaluated. In this study, experience qualities will be assessed by using tourist satisfaction
after actual experience. Credence qualities are difficult to evaluate even when after
consumption has taken place. Such qualities are beyond this research.
This research extends the applicability of the economics of information theory in
the tourism industry and specifically in a unique context, which is largely a safari
destination. The existing studies that use the theory (Gursoy, 2001; Smith, 2000) in the
tourism industry are in the contexts of business levels and not destinations. Both of these
two studies did not say what they actually contributed to (proving or disapproving) the
theory. This study is going to be one of the earliest studies that apply the economics of
information theory in the context of destination within the tourism industry. This research

42
also extends into looking beyond immediate returns of information search, by looking at
the overall destination satisfaction by tourists after they have actually visited it. This will
be a significant application of the economics of information theory beyond traditional
services and goods environments.
2.8. Conceptual Model
The conceptual model Figure 2.1 has been developed. There are a few
assumptions that are being made relating to the model:
i) Tanzania is assumed to be perceived as a relatively expensive destination to
visit by international tourists especially those from outside of Africa. It
would require a significant amount of investment for a tourist to visit it.
This assumption will make the perceived risk of making a wrong decision
among tourist to be significantly high.
ii) It is assumed that Tanzania is perceived as an exotic destination by
international tourists from outside Africa. This might also significantly rise
perceived risk among international tourists.
iii) It is also assumed that touristic experiences being under services it is
difficult to evaluate their qualities through information search. Easier to
assess after consumption.

43
Figure 2.1:Conceptual framework
Consumer involvement with the product has a positive correlation with information
search (Gursoy & Gavcar, 2003). High involvement would make it easier for a potential
tourist to assess the quality of touristic experience through searching. Breadth and depth of
information search and ease of search quality would have a significant effect on the
satisfaction of the collected information and thus sufficient knowledge of the touristic
experience prior to actual experience. Sufficient knowledge of the touristic experience will
correctly shape tourist expectations of the destination, and thus a positive destination
satisfaction will be realized.
2.9. Chapter Summary
Information search behavior has been fairly investigated in the tourism industry at
different levels from business to destination. Two main frameworks, strategic (Snepenger
et al., 1990) and contingency (Schul & Crompton, 1983), have been used. Information
search behavior influences tourist behavior, those who search for more information tend to
stay longer at the destination and spend more (Fodness & Murray, 1997). Consumer

44
involvement, unobservable state of motivation, arousal or interest toward certain brand,
product or experience, has been used as both an antecedent and endogenous construct in
information search related studies (Cai, Feng, & Breiter, 2004b; Carneiro & Crompton,
2010; Hyde, 2000). While there are a few measurement scales for involvement, two PII a
unidimensional scale (Zaichkowsky, 1986, 1994) and CIP a multi-dimensional scale
(Kapferer & Laurent, 1993; Laurent & Kapferer, 1985) are the most widely used ones.
Results on the effect of involvement on information search behavior are mixed, some
studies (Cai et al., 2004b; Hyde, 2000) found as significant relationships while others
(Carneiro & Crompton, 2010) could not find significant relationships. It is unknown what
influence will CIP, if used with all five dimensions, have on information search behavior
among tourists who visit Tanzania. It is also unknown what would be the results when a
theory of economics of information is applied at a destination level to investigate
information search behavior among international tourists in a safari. There is a gap in
existing literature on how investment in tourist information search (breadth and depth)
relate to tourist satisfaction with the destination. This study intends to address some of
these knowledge gaps in the existing literature using the economics of information theory
in a context of safari destination with a focus to international tourists. A conceptual
framework has been developed along with hypotheses to be tested (Figure 2.2).

45
Here is the list of research questions:
i. Which information sources are mostly preferred by international tourists who visit
Tanzania and why?
ii. How does consumer involvement as an antecedent construct influence preference
in information sources and types of information search among international tourists
who visit Tanzania?
iii. How does breadth, and depth of information search relate to ease of evaluating
search qualities?
iv. How does ease of evaluating search qualities, breadth, and depth of information
search relate to satisfaction in collected information?
v. How does satisfaction with collected information related to destination
satisfaction?
Here is the list of hypotheses:
H1a: There is a statistically significant positive relationship between tourist involvement
and the breadth of information search.
H1b: There is a statistically significant positive relationship between tourist involvement
and the depth of information search.
H2a: The diversity of information search is statistically significantly related to ease of
assessing quality through searching.
H2b: The depth of information search is statistically significantly related to ease of
assessing quality through searching.

46
H3a: Breadth of information search is positively related to satisfaction with information
search.
H3b: Depth of information search is positively related to satisfaction with information
search.
H3c: Ease of search qualities is positively related to satisfaction with information search.
H4: There is a significant positive relationship between satisfaction with information
collected with destination satisfaction.
Figure 2.2: Conceptual framework and hypotheses

47
CHAPTER THREE
RESEARCH METHODOLOGY
3.1. Introduction
This chapter details the methodological approaches that were used in this study to
test the research hypotheses and thus address the objectives and research questions. It
describes the study sites, methodological approach, data collection instruments and
sampling. It also presents results of the pilot test along with modifications of some data
collection tools.
3.2. The Study Site
This research was conducted in Tanzania Figure 3.1. The United Republic of
Tanzania was formed in 1964 from two countries Tanganyika, the mainland and the islands
of Zanzibar. The country is located on the east coast of Africa and borders the Indian Ocean
in the east, Kenya and Uganda in the north, Rwanda, Burundi, and Democratic Republic
of Congo in the west, Zambia, Malawi, and Mozambique in the south. It has a population
of 50 million people (NBS, 2012). The country has renowned national parks like Serengeti,
Kilimanjaro, and Tarangire and is one of the destinations in Sub-Saharan Africa that are
rich in wildlife resources. It is ranked number three in the world in terms of richness in
natural resource attractions by the World Economic Forum (World Economic Forum,
2015; World Travel & Tourism Council, 2013).

48
Within the country, data was collected specifically at three airports namely (with
International Air Transport Association (IATA) codes in brackets) Julius Nyerere (DAR),
Kilimanjaro (JRO) and Abeid Amani Karume (ZNZ) International Airports (Figure 3.2).
DAR, JRO, and ZNZ are the main international airports in the country. DAR is the biggest
and busiest of the three. The airport is located in Dar es Salaam, the biggest commercial
city in the country. JRO is located on the border of Arusha and Kilimanjaro regions in the
northern part of the country, where the most famous national parks of the country are
located. ZNZ is the second busiest airport in the country and is located on the island of
Unguja one of the two islands that make up Zanzibar. The islands are famous destinations
in beach, historical and cultural attractions. The three Tables 3.1, 3.2, and 3.3 show number
of passengers, aircraft movements, and airlines that fly for each of the three airports from
2010 to 2015. Tanzania is an ideal study site for this project as it is one of the famous Sub-
Saharan safari destinations receiving over a million international tourists annually
(Tourism Division, 2016b).
Figure 3.1: Geographical location of Tanzania

49
Figure 3.2: Map of Tanzania showing major airports
Source: Maps of world (2015) https://www.mapsofworld.com/international-airports/africa/tanzania.html

50
Table 3.1: Passenger volume for the three airports
S/N AIRPORT 2010 2011 2012 2013 2014 2015
1 DAR ES SALAAM (JNIA)
1,556,410
1,829,219
2,088,282
2,348,819
2,478,055
2,496,394
2 KILIMANJARO (JRO)
477,206
659,181
665,108
824,848
802,371
780,800
3 ZANZIBAR (ZNZ)
614,449
736,145
798,441
856,607
934,337
878,789 Source: (Tanzania Ministry of Transport, 2015) Table 3.2: Aircraft movements for the airports
S/N AIRPORT 2010 2011 2012 2013 2014 2015
1 DAR ES SALAAM (DAR)
62,620
70,460
75,564
77,185
77,990
75,240
2 KILIMANJARO (JRO)
16,640
20,967
20,407
21,790
19,942
19,758
3 ZANZIBAR (ZNZ)
46,162
42,629
44,725
48,044
50,672
51,731 Source: Tanzania Ministry of Transport (2015) Table 3.3: Airlines that fly to the three airports DAR, JRO and ZNZ
S/N NAME CODE DESTINATION DAR JRO ZNZ 1 Air Tanzania TC Moron, Comoros √ √ √ 2 Emirates EK Dubai, UAE √ √ 3 KLM KL Amsterdam, The Netherlands √ √ 4 SwissAir LX Zurich, Switzerland √ 5 Kenya Airways KQ Nairobi, Kenya √ √ 6 Qatar Airways QR Doha, Qatar √ √ √ 7 Etihad Airways EY Abu Dhabi, UAE √ 8 South African Airways SA Johannesburg, South Africa √ 9 Ethiopian Airline ET Addis Ababa, Ethiopia √ √ √
10 Oman Air WY Muscat, Oman √ √ 11 Condor DE Frankfurt, Germany √ √ 12 FlyDubai FZ Dubai, UAE √ √ √ 13 Turkish Airline TK Istanbul, Turkey √ √ √ 14 RwandAir WB Kigali, Rwanda √ √ 15 Precision Air PW Nairobi, Kenya √ √ √ 16 FastJet FN Johannesburg, South Africa √ 17 Inter Iles Air II Moron, Comoros √ 18 Egypt Air MS Cairo, Egypt √ 19 Air Mozambique TM Maputo, Mozambique √ 20 Ewa Air ZD Dzaoudzi, Mayotte √ 21 Air Zimbabwe UM Harare, Zimbabwe √ 22 Air Uganda U7 Kampala, Uganda √
Source: Tanzania Airports Authority (2017)

51
3.3. Research Approach and Procedures
3.3.1 Research Approach
There are five research questions to be addressed by this study. It also seeks to
uncover the reasons behind tourist preferences and any variations of preference among
these international tourists. Specifically, this project seeks to answer the following
questions:
i. Which information sources are mostly preferred by international tourists who visit
Tanzania and why?
ii. How does consumer involvement as an antecedent construct influence preference
in information sources and types of information search among international tourists
who visit Tanzania?
iii. How does breadth, and depth of information search relate to ease of evaluating
search qualities?
iv. How does ease of evaluating search qualities, breadth, and depth of information
search relate to satisfaction in collected information?
v. How does satisfaction with collected information relate to destination satisfaction?
To answer these questions, data were collected at the three international airports in
the country namely Dar es Salaam, Kilimanjaro, and Zanzibar International Airports. The
mixed methods approach, specifically concurrent embedded design was used as a
methodological framework design (Creswell & Clark, 2011). Under this approach, both
quantitative and qualitative data were collected concurrently. A questionnaire was designed
by the researcher using Qualtrics software (Qualtrics, 2017). Quantitative data were

52
collected using the designed questionnaire that was downloaded in iPads using Qualtrics
mobile application (Qualtrics, 2017). A sample of tourists who filled in the survey were
further invited to participate in a short interview about the subjects of the study. A
concurrent embedded mixed methods research approach offers opportunities to generate a
better understanding of the phenomenon as it legitimizes multiple responses to the critical
issues in question (Greene, 2012; Greene & Caracelli, 2003). As a method, it focuses on
collecting, analyzing, and mixing both quantitative and qualitative data in a single study or
series of studies (Creswell, 2009). In this study, qualitative and quantitative analyses are
interpreted with an intention to complement each other. It is one of the best approaches to
address weaknesses of each method quantitative and qualitative approach. Mixed methods
approach helps the researcher to get a picture that is as comprehensive as possible of the
topics under investigation.
The researcher distributed the questionnaires to international tourists. He
approached tourists at the airport boarding lounges, politely introduced himself, gave a
brief introduction to the study he was conducting and requested the tourist to participate in
the study. He randomly approached and requested the participation of as many tourists as
possible that he encountered. One may call this approach a convenient sampling procedure
of the study sample. It is a convenience sample because all possible travelers over the age
of 18 years who were sitting in the exit lounges were approached and requested to
participate. It is random because travelers who were sitting in the lounges are of different
demographics (gender, nationality, age, employment status, marital status, and education
level (see descriptive statistics next chapter)). Approached tourists were made aware that

53
participation was voluntary and that no one was going to be asked to explain the reason in
case they were not interested in participating. Figure 3.3 shows a sketch of the exit lounges.
Figure 3.3: Sketch of the exit lounges
3.3.2 Research Procedures
3.3.2.1 Population and Sampling Design
This study targets the population of international tourists visiting Tanzania who are
18 years old and above. They are individuals who have spent more than 24 hours in
Tanzania but less than 12 months (UNWTO, 2007) and are departing from Tanzania to
overseas. Ninety-five percent of total tourists who visit Tanzania are international tourists
(Tourism Division, 2014, 2015b, 2016b). It is also true that international tourists contribute
the most in tourism revenue (Tourism Division, 2015a, 2016a). However, the researcher

54
acknowledges the importance of including domestic tourists but was unable to
accommodate them within the current study due to limited resources.
The study sample for this research is composed of international tourists who depart
from Tanzania by air at the three selected airports DAR, JRO and ZNZ. Several
publications (Algina & Olejnik, 2000; Feldt & Ankenmann, 1999; Kelley & Maxwell,
2003) have suggested various approaches in arriving at appropriate sample sizes for
different research. The main criteria are based on two dominant research approaches,
qualitative or quantitative, expected analytical procedures, power, effect sizes, number of
predictors, population size, response rates and experience from previous relatively similar
studies in similar contexts (Gursoy, 2001; MacCallum, Browne, & Sugawara, 1996;
Maxwell, 2000; Tabachnick & Fidell, 2012). Since this study partly uses Confirmatory
Factor Analysis (CFA) and Structural Equation Modeling (SEM), a minimum sample size
of 60 (MacCallum, Widaman, Preacher, & Hong, 2001; MacCallum, Widaman, Zhang, &
Hong, 1999) participants is required, however effort was made to get a bigger sample to
enhance power, effect sizes and fitness of models (MacCallum, 1986; MacCallum et al.,
1996). A previous study (Mgonja, Backman, Backman, Moore, & Hallo, 2016, 2017) in a
similar Tanzanian context resulted in a response rate of 88%. The current study assumed a
slightly conservative response rate of 60% and a minimum target of 200 participants. It
was, therefore, planned that a minimum of 334 tourists (200/0.6) were to be approached
and invited to participate in the study. DAR being the busiest of the three airports (Tables
3.1-3.3). It was planned that a minimum of 164 tourists (334/2) were to be invited to

55
participate in the study at the airport and a minimum of 85 tourists (334/4) in each of the
two airports JRO and ZNZ.
3.4. Data Collection Instruments and the Process
As mentioned earlier, this research takes a mixed methods approach. A quantitative
approach was done using a structured questionnaire designed in Qualtrics software
(Appendix A). Five iPad tablets were used in the process of data collection in which
participants were handed these tablets which were used to fill in the questionnaire. This
approach reduces research errors and saved time during data processing and analyzing.
Through literature review, different measurement scales for different constructs that have
been widely used elsewhere were sourced and adapted in this study. In order to adapt the
scales appropriately, local experts in tourism were consulted for their opinions and a pilot
test was conducted at two of the three airports. These measurement scales are discussed in
detail in the following sections of this chapter. The qualitative part of the research was
conducted through short interviews with a small sample of tourists who also filled out the
questionnaire. A checklist of questions was prepared to guide the interviews (Appendix B).
3.4.1 Development of the Survey Instrument
Development of the survey instrument in this research was based on previous
related tourist publications. A draft questionnaire was initially developed in Qualtrics and
shared with graduate students and faculty in the department of parks, recreation and
tourism management at Clemson University for their comments and inputs. The designed

56
Qualtrics questionnaire is divided into blocks in which each block contains a specific
measurement scale for a construct or a variable. The format and flow of the survey starts
with a page in Clemson logo briefing a participant about the purpose of the survey and the
research objectives. This complements the oral introduction that was given by the
researcher to the participant about the research. This very first section highlights, among
other things, that participating in a survey is by choice. The logo helps to genuinely
emphasize the legitimacy of the survey and creates a positive impression among survey
takers (Dillman, Smyth, & Christian, 2014). The contact information of the researcher
along with his supervisors is also listed in that section.
Some basic demographic questions about the country where a tourist is a resident
of, states/provinces and cities. This is followed by trip characteristics, prior travel
experiences, the number of attractions visited, involvement, information sources used
along with the frequency of use and reliability, and satisfaction both with information and
destination after the experience. The very last section contains additional demographic
questions like gender, income, employment status, and education level.
3.4.1.1 Measurements Scale for Consumer Involvement
A tourist’s level of involvement with an attraction/activity or destination is likely
to be determined by the degree to which they perceive the attraction/activity or destination
to be personally relevant. Measurement scales for involvement commonly known as
personal involvement inventory (PII) were initially developed by (Zaichkowsky, 1986) and
consumer involvement profile (CIP) (Kapferer & Laurent, 1985; Laurent & Kapferer,

57
1985). The initial versions of the two measurement scales were modified to address
observed weaknesses (Kapferer & Laurent, 1993; Zaichkowsky, 1994).
Measurement scales for the construct of involvement have been widely used and
tested extensively (Backman & Crompton, 1989; Bienstock & Stafford, 2006; Bruwer,
Burrows, Chaumont, Li, & Saliba, 2014; Dimanche et al., 1991; Hanzaee, Khoshpanjeh,
& Rahnama, 2011; Jamrozy, Backman, & Backman, 1996b; Lin & Chen, 2006; Nella &
Christou, 2014; Prebensen, Woo, Chen, & Uysal, 2012b; Ritchie, Tkaczynski, & Faulks,
2010).
This study adapts the Consumer Involvement Profile (CIP) measurement scale
developed by Laurent & Kapferer (1985) due to its multidimensional nature which enables
a wider capture of the construct nomological radius. The measurement scale has five
dimensions namely, personal interest, pleasure value, sign value, and risk consequence,
and risk probability (Table 3.4).
Table 3.4: Measurement scale for consumer involvement
Dimension Item
Interest
The destination I visit is extremely important to me
I'm very interested in visiting tourist destinations like Tanzania
I care very much about visiting tourist destinations like Tanzania
Pleasure
I really enjoy visiting tourist destinations like Tanzania
Whenever I visit tourist destinations like Tanzania, it's like giving myself a present
To me, is quite a pleasure visiting tourist destinations like Tanzania
Sign
You can tell a lot about a person from the tourist destinations they visit
The tourist destination a person visits, says something about who they are
The tourist destination I visit reflects the sort of person I am

58
Risk
I get annoyed very much if I make a mistake visiting a tourist destination, not of my interest
I get irritated to visit a tourist destination which isn't right
I get upset with myself if it turned out I'd made the wrong choice when selecting a tourist destination to visit
I would be unhappy if it happens, I have unknowingly chosen a destination that isn't of my interest
Probability
When I'm considering a tourist destination to visit, I always feel rather unsure about what to pick
When you book a tourist destination, you can never be quite sure it was the right choice or not
Choosing a tourist destination to visit is rather difficult
When you book a tourist destination to visit, you can never be quite certain about your choice
As the names of dimensions suggest, each part of the measurement assesses a
different aspect of involvement. The first dimension, personal interest, aims at assessing
the personal interest an individual has in a product, brand or experience; in the tourism
context, it could mean attraction or a destination along with the experience it offers and the
associated personal meaning or importance for that person. The extent to which an
attraction or destination expresses one’s self is assessed using the dimension of sign value.
The pleasure dimension is developed to capture how the attraction or destination is able to
bring about enjoyment to an individual. The risk dimension assesses how a potential tourist
perceives the likely negative consequences of making a poor selection of attraction or
destination. The last dimension assesses how this potential tourist perceives the probability
of making such a poor choice.
The scale has been widely tested and used extensively in the contexts of tourism
industry and recreation (Dimanche et al., 1991; Kyle, Graefe, Manning, & Bacon, 2003;
Kyle, Absher, Hammitt, & Cavin, 2006; Prebensen et al., 2012a; Ritchie et al., 2010). The
reported reliability of scale dimensions (Cronbach’s Alpha) ranges from 0.70 to 0.90 and
59
the loadings of items range from 0.50 - 0.90. The overall fit of the involvement
measurement model in Gursoy and Gavcar, (2003) study was χ2(32) = 45.57 (p = 0.057); the
GFI = 0.96; AGFI = 0.94; NFI = 0.91; NNFI = 0.96; the CFI = 0 .97; IFI = 0.97; PGFI =
0.56; and PNFI = 0.65. It is therefore thought to be a suitable measurement scale to use in
this study as mentioned above its dimensions also capture a wide range (personal interest,
pleasure value, sign value, risk, and probability) of consumer involvement profile (Gursoy
& Gavcar, 2003; Havitz & Dimanche, 1999; Havitz, Green, & McCarville, 1993; McCleary
& Whitney, 1994; Reid & Crompton, 1993). The involvement items were measured on a
seven-point Likert type strongly disagree-strongly agree scale.
3.4.1.2 Information Sources
Nine information sources (Table 3.5) are adapted from various studies (Fodness &
Murray, 1999; Gursoy, 2001; Korneliussen & Greenacre, 2017a; Mgonja et al., 2016, 2017;
Vogt & Fesenmaier, 1998) and from the destination marketing organization in the country,
Tanzania Tourist Board (TTB) regarding their marketing communication channels. The
question was phrased as “how unlikely/likely you were engaged in looking for information
in the following sources of information when you were planning this trip?” This question
intended to measure the breadth of information sources used (See Table 3.5). The
information sources are assessed on a seven-point extremely unlikely-extremely likely
Likert type scale. The follow-up question asked about a tourist’s perception of how reliable
information sources are by using a seven-point Likert type measure ranging from strongly
unreliable-strongly reliable. All sources of information that scored above point four were
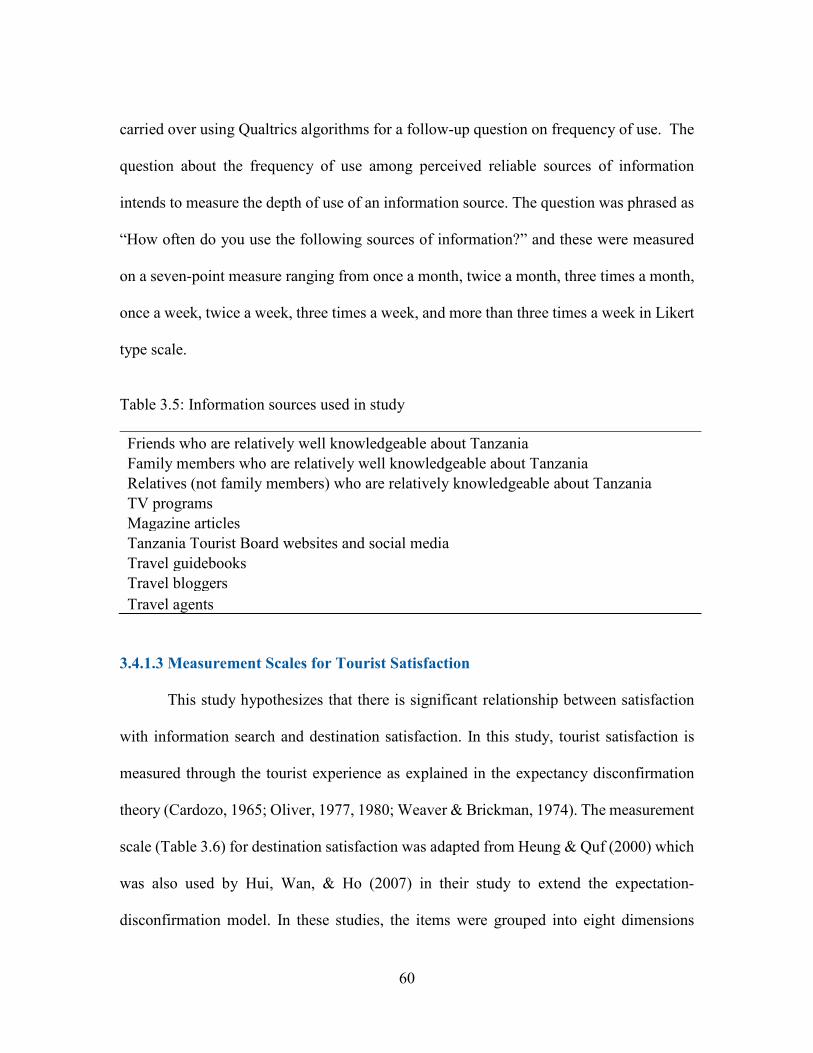
60
carried over using Qualtrics algorithms for a follow-up question on frequency of use. The
question about the frequency of use among perceived reliable sources of information
intends to measure the depth of use of an information source. The question was phrased as
“How often do you use the following sources of information?” and these were measured
on a seven-point measure ranging from once a month, twice a month, three times a month,
once a week, twice a week, three times a week, and more than three times a week in Likert
type scale.
Table 3.5: Information sources used in study Friends who are relatively well knowledgeable about Tanzania Family members who are relatively well knowledgeable about Tanzania Relatives (not family members) who are relatively knowledgeable about Tanzania TV programs Magazine articles Tanzania Tourist Board websites and social media Travel guidebooks Travel bloggers Travel agents
3.4.1.3 Measurement Scales for Tourist Satisfaction
This study hypothesizes that there is significant relationship between satisfaction
with information search and destination satisfaction. In this study, tourist satisfaction is
measured through the tourist experience as explained in the expectancy disconfirmation
theory (Cardozo, 1965; Oliver, 1977, 1980; Weaver & Brickman, 1974). The measurement
scale (Table 3.6) for destination satisfaction was adapted from Heung & Quf (2000) which
was also used by Hui, Wan, & Ho (2007) in their study to extend the expectation-
disconfirmation model. In these studies, the items were grouped into eight dimensions

61
namely (with reliability ‘Cronbach’s Alpha in brackets) people (0.830), overall
convenience (0.790), price (0.830), accommodation & food (0.810), commodities (0.820),
attractions (0.700), culture (0.750), and climate and image (0.630). Loadings for the items
range from ‘safe place to visit’ (0.5233) to immigration and customs (0.826), and 62% of
the items had loadings of 0.700 and above (Heung & Quf, 2000). Three additional items;
learn about history and culture, experience something different and see some beautiful
scenery with their loadings 0.720, 0.625, and 0.603 respectively, are adapted from Hsu,
Cai, & Li (2010). The added three items are among five destination experience items used
in Wang, Qu, & Hsu, (2016) in which they reported loadings are 0.910 for “learn about
history and culture”, 0.893 for “experience something different” and 0.788 for “beautiful
scenery”. In adapting these items properly to the context of this study, local tourism experts
were consulted for their professional opinions. The names of dimensions in Table 3.6 are
slightly modified following the results of EFA and CFA from pilot study (Appendix C).
The question was phrased, as “Now that you have visited Tanzania and you are about to
fly back, how would you assess your expectations based on your actual travel experience
in Tanzania?” on a seven-point measurement ranging from Far short of expectations-Far
exceeds expectations Likert type scale.
Table 3.6: Tourist experience with the destination
Dimension Item
Attractions
Learning about its history and culture Experience of something different Some beautiful scenery Diversity of wildlife Seeing the big five Attractiveness of natural and scenic landscapes

62
Expediency
Helpfulness and efficiency of immigration/customs/police officers Simplified immigration and customs procedures Convenience of shopping Convenience of transportation within the country and between attractions
Hospitality
Helpfulness and efficiency of hotel/restaurant/retail staff Comfort of hotel accommodations Hotel services Hotel facilities
Safety Friendliness and courteousness of people in Tanzania Climate and weather Safety and peacefulness
Prices Prices for hotel accommodation Prices of food Prices of international air tickets
Foods Variety of food Quality of food
3.4.1.5 Measurement Scale for Satisfaction with Information Search
The measurement scale for satisfaction with information search (Table 3.7) is
adapted from (Smith, 2000; Westbrook & Fornell, 1979). The scale contains seven items
that assess satisfaction with information search from different perspectives. Reported
loadings range from 0.59 to 0.92 and Cronbach’s alpha 0.79. The items were all measured
on a seven-point Likert type scale ranging from strongly disagree-strongly agree.
Table 3.7: Measurement scale for satisfaction with information search
1 Getting information about Tanzania and its tourist attraction was a wise decision
2 I was satisfied with my information search about Tanzania and its tourist attractions
3 If I had to do it all over again, I would seek information in the same manner that I did 4 I was pleased with my search for information about Tanzania and its tourist attractions
5 The information I collected about Tanzania and its tourist attractions made me feel knowledgeable about the country
6 The information I collected about Tanzania and its tourist attractions helped me to make informed decision about visiting the country
7 I am happy for what I did in getting information about Tanzania and its tourist attractions

63
3.4.2 Interview Checklist
As mentioned earlier, this study takes an embedded mixed method approach. A
checklist for an interview (Appendix B) contains questions that sought to investigate
‘whats,’ and ‘whys’ tourists prefer specific information search behavior and sources. The
interview checklist was also used as a guide to the interview process. Interviews took a
maximum of 15 minutes. Specifically, the interview asked questions about information
search strategies and any influencers or reasons behind the strategies being used by tourists.
The researcher voice-recorded the interviews after seeking participant consent. He also
took notes where possible during the interviews and later on after the interviews he wrote
additional notes to flesh out the summaries.
3.5. Pilot Test
The pilot test was conducted at two of the three airports, DAR and JRO, between
August 10 and 24, 2017. The researcher secured all research authorizations from
responsible government organizations, the Ministry of Natural Resources and Tourism
(MNRT) as well as Tanzania Airports Authority (TAA). The research was also given a
permission to access exit lounges. At the airports he approached passengers that were
seated in the exit lounges, introduced himself and the study he was conducting then invited
the passenger to participate in filling out the survey. A total of 122 passengers at the two
airports were approached and invited to participate in filling out the Qualtrics survey using
three tablets that were borrowed from the Department of Parks, Recreation and Tourism
Management at Clemson University. Of the 122 approached individuals, seven chose not

64
to participate and 115 participated, thus a response rate of 94%. In addition to 115
individuals who filled out the survey, 11 more were asked to participate in a short interview
and all agreed.
3.5.1 Observations from the Pilot Test
3.5.1.1 Survey Observations and Results
Some observations were noted in the pilot test (Appendix C). General observations
show that there were a few respondents whose first language is not English sought some
clarifications, especially in reverse coded items. Of the 115 surveys that were filled out,
six were found to be unusable, they were, therefore, dropped out, and only 109 were
retained for further analyses. Missing data was assessed and found to be 0.124%. The
missing pattern was also diagnosed specifically MCAR in which the test shows negative
(P<0.00000), meaning that the missingness is random.
3.5.1.2 Measurement Models for Consumer Involvement Profile
Exploratory Factor Analysis (EFA) with oblimin rotation and then Confirmatory
Factor Analysis (CFA) were conducted for the measurement scale of involvement
construct. Items iii, x and xii, exhibited poor loadings (Appendix C). Items iii and x were
dropped out when calculating reliabilities, Cronbach’s α a composited reliability and Rho
(ρ) a measure of weighted reliability. As the construct is multi-dimensional, a second order
CFA was conducted.
Due to the poor loading of items iii, x and xii, the wording of the items was revised
for the final measurement scale. Item (i) was reworded to remove the reverse code, and it

65
reads as “I care very much about visiting tourist destinations like Tanzania.” The revised
version for item (x) is “I get annoyed very much if I make a mistake visiting a tourist
destination, not of my interest”; item (xi) is “I get irritated to visit a tourist destination
which isn't right”; item (xii) is “I get upset with myself if it turned out I'd made the wrong
choice when selecting a tourist destination to visit”. It is also recommended to add a fourth
item in this dimension that says “I would be unhappy if it happens, I have unknowingly
chosen a destination that isn't of my interest.”
3.5.1.3 Measurement Model for Tourist Experience
The measurement model for tourist experience against tourist expectations was also
conducted using EFA with oblimin rotation then CFA due to it being a multi-dimensional
construct. As in the tourist expectations, six factors (scenic attractions, expediency, safety,
foods, prices, and hospitality) were extracted, and they are composed of the same items
with exception to items ix and xii which were dropped out due to poor loading on
expediency factor (Appendix C). The rest of items were found to be fairly reliable with
exception of item xix which loads slightly low. Due to the multi-dimensionality of the
experience construct, a second order CFA was conducted, and the results are good as
shown in Appendix C. The majority of extracted factors are reliable with both composite
and weighted measures of 0.70 and above except expediency which is marginally accepted
at 0.61. Even though some of the items were found to be problematic in the pilot test, they
are retained for the final version survey and in addition, a destination-specific item
“diversity of wildlife” was added.

66
The initial idea of this project did not include the ease of evaluation for search
qualities as well as satisfaction with information search. These were included in the study
later on after the pilot data was already collected. So, there are not pilot results for the three
constructs.
3.5.2 Interview Checklist
Ten travelers at the exist lounges were randomly approached and requested to
participate in a short interview about information sources they used, expectations, and
satisfaction. The interviews ranged from 7 minutes to 13 minutes. Preliminary findings
from the pilot study show that the internet related information sources are the most used to
gather and plan the trip. Ease of internet access, a variety of information that is available
in online platforms were mentioned as main reasons for using the internet. There is no one
single information source that is being used in isolation of others but a number of sources
are used in combination. The final version of the interview checklist investigated deeper
on “whats” and “whys”.
3.6. Data Collection Process
A final questionnaire (Appendix D) for this study was developed based on
additional literature information and results of the pilot test. Clemson University
Institutional Review Board (IRB) granted the permission to conduct the research with a
permit number IRB2018-229. The researcher had also an introduction letter from his
dissertation committee Co-chair and solicited an additional letter from the Ministry of
Natural Resources and Tourism (Appendix E) introducing him to executive directors of the

67
three airports. It built trust from the officials that the researcher is known to the reputable
government organization. These letters were then emailed to respective airports. In addition
to the three copies of introduction letter to the airports’ executives, the researcher was
handed his own copy for verification if needed on arrival at the airports.
A total of 426 travelers seated in the boarding lounges at the airports were politely
approached and invited to participate in the research, of them, 360 positively responded
and filled out the survey on iPads handed out by the researcher. Of the 356 tourists who
filled out the survey, 21 were requested to participate in a short interview that lasted for
10-15 minutes. Approaching travelers in the boarding lounges, worked well as they had
already checked in and were just relaxed waiting to board planes. In addition to Qualtics
cloud storage of data, the researcher backed up the data into computer and memory sticks.
Field notes book was well kept and pictures of pages were taken using mobile phone and
stored in the phone disk.
3.7. Data analyses
Collected data are analyzed using two different approaches. Descriptive statistics
for quantitative data are presented for the sample in the next chapter. In the subsequent
chapter, inferential statistics and hypotheses tests are presented. Quantitative data are
further analyzed using procedures of structural equation modeling (SEM) in which
confirmatory factor analyses will be used to prepare measurement models before structural
models are tested. The SEM is a combined confirmatory factor analysis (CFA), path
analysis, and multiple regression. SEM is largely a confirmatory analytic technique, though
it can still be used in exploratory projects. SEM includes two main components;

68
measurement and structural models. A measurement model is basically a CFA. However,
CFA is an analytic tool on its own (Jackson, Gillaspy, & Purc-Stephenson, 2009). CFA is
considered to be one of the robust statistical tools for investigating the nature of
relationships among latent constructs (Brown & Moore, 2017; Marsh, Wen, & Hau, 2004).
It is theory driven. Therefore, the planning of the analysis is driven by the theoretical
relationships among the observed and unobserved variables or constructs (Schreiber, Nora,
Stage, Barlow, & King, 2006). It is, therefore, one of the most suitable tools to be used in
this study to test the study hypotheses.
Figure 3.4 shows in diagrammatic form the process data analysis. It starts with step
one which is sample description specifically frequency tables for various variables. This
step will also involve calculating the measure of central tendency (means) and dispersion
(standard deviation). SPSS software will be the main tool in this phase. Step two opens a
door into advanced statistical analyses. It involved data management aspects in which
outliers are identified, missingness tested for missing completely at random (MCAR) or
Missing at Random (MAR) and data are imputed using expectation maximization (EM)
imputation. Once data are imputed step three starts. This step is all about developing
measurement models. The fitness of measurement models is assessed using absolute,
incremental and parsimony fit indices. When measurement models are assessed and found
to be fit and specified the last step starts. This step four involves testing the conceptual
model commonly referred to as a structural model. Exogenous and endogenous factors are
identified and relationships based on the conceptual model are indicated and tested. The

69
process of testing structural model starts with assessing the fitness of the model, then the
significance of the relationships (direct and mediated) and finally the size of effects.
Figure 3.4: Analytical procedure
Analysis of qualitative data opens step 5. Interviews are transcribed and analyzed
based on key themes across interviews. These will then be used to enrich explanations of
relationships between and among constructs in the structural model. Verbatim quotes will
be used to support relationships. In this way, both quantitative and qualitative analyses will
help to get a more comprehensive picture of the relationships.

70
3.8. Chapter Summary
Embedded mixed methods approach has been used in this research. A pilot study
was conducted prior to the final version of the research. Tourists were handed in tablets to
fill out the questionnaire in the English language in the exit lounges of three international
airports located in Dar es Salaam, Kilimanjaro, and Zanzibar. A few tourists were further
invited to participate in a short interview regarding their preference in information sources.
A total of 426 travelers were approached and invited to participate in this study, 360
participated. Additionally, 21 tourists were interviewed.

71
CHAPTER FOUR
PRESENTATION OF DESCRIPTIVE STATISTICS
4.1. Introduction
This chapter presents results of the descriptive statistics of this study. Descriptive
statistics help to understand the general picture of data and issues related to data
completeness as well as dispersion of responses to different observed variables. Descriptive
statistics are also helpful in summarizing data in a simple meaningful way that could be
understood by a broader audience. The chapter presents demographic data first then
measures of central tendency and dispersion later.
4.2. Response Rate
As mentioned in the previous chapter, a total of 426 travelers were approached and
invited to participate in the survey. Of the 426 travelers, 360 filled out the survey, a
response rate of 84.5%. This high response rate is partly due to the fact that travelers were
approached while seated and relaxed at the boarding lounges after they had checked in and
had gone through all security check points. It made it easier for the researcher to approach
participants and also convenient for travelers to positively respond. The response statistics
are shown in Table 4.1. However, there are unit non-responses (66 cases) and item non-
response (4 cases). The main reasons for unit non-responses are (i) some travelers from
non-English-speaking countries being less proficient in English language, (ii) some of the
travelers are residents in Tanzania, that they have been living in the country for over a year,

72
and (iii) a few refused to complete the survey as the time for them to board was a few
minutes away. Four surveys were found completely unfilled hence contributed to item non-
response rate.
Table 4.1: Response rate
Measure Number of Responses Total number of travelers approached 426 Unit non-responses 66
Item non-responses 4 Total number of non-responses 70
Total number of survey responses 356 The total number of filled out surveys included for further analysis N = 356. 4.3. Respondent’s Country of Residence
Participants in this research were asked the name of the country they reside. The
results in Table 4.2 shows that the majority reside in the USA (15.4%), South Africa
(15.2%), Germany (6.7%) and the UK (5.3%). It appears that this study captures
participants who are residents of 50 countries in all six major continents. A reader could
also see there are five travelers who mentioned they reside in Tanzania. These residents are
non-Tanzanian citizen and have moved to the country within the last six months. They are
therefore, at this time, treated as other international tourists based on the UNWTO
definition of tourist (UNWTO, 2007).

73
Table 4.2: Respondents' country of residence S/N Country of Residence Frequency Percent Cumulative Percent
1 USA 55 15.4 15.4 2 South Africa 54 15.2 30.6 3 Germany 24 6.7 37.4 4 United Kingdom 20 5.3 42.7 5 Kenya 17 4.8 47.5 6 Netherlands 15 4.2 51.7 7 Australia 13 3.7 55.3 8 France 13 3.7 59 9 Spain 10 2.8 61.8
10 Sweden 9 2.5 64.3 11 Switzerland 9 2.5 66.9 12 Belgium 8 2.2 69.1 13 Zimbabwe 8 2.2 71.3 14 Denmark 7 2 73.3 15 Russia 7 2 75.3 16 Uganda 7 2 77.2 17 Canada 6 1.7 78.9 18 Brazil 5 1.4 80.3 19 Oman 5 1.4 81.7 20 Tanzania 5 1.4 83.1 21 China 4 1.1 84.3 22 Norway 4 1.1 85.4 23 India 3 0.8 86.2 24 Israel 3 0.8 87.1 25 Philippines 3 0.8 87.9 26 Portugal 3 0.8 88.8 27 UAE 3 0.8 89.6 28 Ukraine 3 0.8 90.4 29 Algeria 2 0.6 91 30 Italy 2 0.6 91.6 31 Morocco 2 0.6 92.1 32 Mozambique 2 0.6 92.7 33 New Zealand 2 0.6 93.3 34 Palestine 2 0.6 93.8 35 Qatar 2 0.6 94.4 36 Reunion Island 2 0.6 94.9 37 Romania 2 0.6 95.5 38 Saudi Arabia 2 0.6 96.1 39 Angola 1 0.3 96.6 40 Argentina 1 0.3 96.9

74
41 Chile 1 0.3 97.2 42 Colombia 1 0.3 97.5 43 DRC 1 0.3 97.8 44 Ethiopia 1 0.3 98 45 Indonesia 1 0.3 98.3 46 Japan 1 0.3 98.6 47 Namibia 1 0.3 98.9 48 Nigeria 1 0.3 99.2 49 Thailand 1 0.3 99.4 50 Uruguay 1 0.3 100
Total 355 100
When compared to 2016 statistics of international arrivals in the country (Table
4.3), it appears that there was not much of a change in the top ten international source
markets with exceptions of Australia and Sweden which are among the top ten countries
in this study but are not in the top ten of 2016 international arrivals in Tanzania (Tourism
Division, 2016b).
Table 4.3: International arrivals in Tanzania in 2016

75
4.4. Main Purpose of the Trip
Among the very first questions, participants were asked to indicate the main purpose
of their trip to Tanzania (Table 4.4). All most 57% of all participants reported that that the
primary purpose of their trip to Tanzania was leisure-related. This is followed by business
(21.9%), volunteering (9.3%), visiting families and friends (5.9%), as well as educational
purposes (5.9%).
Table 4.4: Main purpose of the trip to Tanzania Main purpose Frequency Percent Cumulative Percent Holiday/Vacation/Leisure 202 56.7 56.7 Business trip 78 21.9 78.9 Volunteering 33 9.3 88.2 Visiting family and friends 21 5.9 94.1 Education/Academic 21 5.9 100 Total 355
4.5. Repeat Visitors vs First Timers
Participants were asked if they are visiting Tanzania for the first time or had visited
the country before. It is more likely that people who had visited a place before would show
a different pattern of information search in comparison to those who visit for the first time.
Table 4.5 shows that first timers are more than twice (70%) of those who had visited the
country before (30%).
Table 4.5: Repeat visitors vs first timers Frequency Percent Cumulative Percent This is my first visit to Tanzania 247 70 70 I have visited the country before 106 30 100 Total 353 100

76
4.6. Travel Party Composition
Participants were asked about their travel companion and had to choose among the
four options; travel by myself, couple, family or group of friends. Table 4.6 shows
frequencies of travel party composition among participants of this study. The two biggest
group were couples (31.7%) and those who were traveling by themselves (30.3%). The
third group in terms of frequency are those who traveled as groups of friends (23.1%) and
the smallest group by frequency are families (14.9%).
Table 4.6: Travel party composition Frequency Percent Cumulative Percent Just myself 106 30.3 30.3 Couple 111 31.7 62.0 Family 52 14.9 76.9 Group of friends 81 23.1 100.0 Total 350 100.0
4.7. Length of Stay
Table 4.7 shows the number of nights participants spent in Tanzania. The majority
of participants stayed in the country for 8-14 nights (38.8%) followed by those who spent
a week or less (36.8%). Those who spent more than a month in the country are slightly
over 15% while participants who stayed for three and four weeks are 6.2% and 2.5%
respectively.

77
Table 4.7: Length of stay Number of nights Frequency Percent Cumulative Percent
7 or less 131 36.8 36.8 8 -14 138 38.8 75.6
15 - 21 22 6.2 81.7 22 - 28 9 2.5 84.3
More than 28 56 15.7 100 Total 356 100
4.8. Individual Average Expenditure
Participants were also asked to share their approximated daily expenditure at the
destination. Of all participants, 267 shared their individual average expenditure at the
destination. Table 4.8 and Figure 4.1 display the individual daily average expenditure.
Table 4.8: Individual average expenditure
Frequency Percent Cumulative
Percent $ 50 or less (1) 119 44.6 44.6 $ 51 - 100 (2) 51 19.1 63.7 $ 101 - 150 (3) 26 9.7 73.4 $ 151 - 200 (4) 22 8.2 81.7 $ 201 - 250 (5) 7 2.6 84.3 $ 251 -300 (6) 12 4.5 88.8 Above $ 300 (7) 30 11.2 100.0 Total 267 100.0

78
Figure 4.1:Average individual expenditure in USD
1= (50 or less); 2 = (51-100); 3 = (101 - 150); 4 = (151 - 200); 5 = (201 – 250); 6 = (251-300); 7 = above 300.
Participants who spent USD 50 or less are the majority (44.6%) followed by those
who spent between USD 51 and 100 (19.1%) and the those who spent more than USD 300
are ranked 3rd (11.2). The smallest group in terms of expenditure is the one that spent
between USD 201 and 250 (2.6%).
4.9. Trip Coordination
Participants were also asked about how the trips were organized. Table 4.9 and
Figure 4.2 show the frequencies on how trips were organized by travelers who participated
in this study. It appears that independent travelers, those who planned the trips by
themselves as individual travelers and as travel parties, are the majority by 40.2% and
14.1% respectively. Participants who booked their trip as package tours make up 28.7%
while semi packaged tours are 17%.

79
Table 4.9: Trip organization
Frequency Percent Cumulative
Percent Independent tour - individual (1) 137 40.2 40.2 Independent tour - travel group (2) 48 14.1 54.3 Package tour (3) 98 28.7 83.0 Semi packaged tour (4) 58 17.0 100.0 Total 341 100.0
Figure 4.2: Trip organization 1 = Independent (individual); 2 = Independent (travel group); 3 = Package tours; 4 = Semi-packaged tours. 4.10. Gender
The proportions of participants' gender were balanced. Table 4.10 shows that of the
total 343 participants, females were 50.7% while male participants were 49.3%.
Table 4.10: Gender proportion of participants Frequency Percent Cumulative Percent Male 169 49.3 49.3 Female 174 50.7 100.0 Total 343 100.0

80
4.11. Education
Table 4.11 shows frequency of education levels among participants of this study. It
appears that the majority of participants have first degree (45.1%), followed by those with
higher degrees (37.1%). College graduates are the third group in terms of frequencies
(10.3%) while those with high school education make up 7.5% of all participants.
Table 4.11: Education levels of participants Frequency Percent Cumulative Percent High school 26 7.5 7.5 College level (Not university) 36 10.3 17.8 University first degree 157 45.1 62.9 Masters/MD/PhD 129 37.1 100.0 Total 348 100
4.12. Occupation
Table 4.12 shows the frequencies of occupational status among participants of this
study. It appears that professionals are the majority (42.3%), followed by private sector
employees (26.7%) and students (11%) are the third group. Those who work in tourism
and hospitality-related industries make up the smallest group of the seven groups.
Table 4.12: Occupation of participants Frequency Percent Cumulative Percent University student 38 11.0 11 Tourism and Hospitality related job 9 2.6 13.6 Government employee 27 7.8 21.4 Private sector employee 92 26.7 48.1 Retired 14 4.1 52.2 Professional 146 42.3 94.5 Other 19 5.5 100.0 Total 345 100

81
4.13. Income
Respondents were also asked about the range of their annual income in USD. Table
4.13 shows the frequencies of different income categories. As shown in the table, the
category of participants with annual income that ranges from USD 30,000 to 49,999 are
the majority (29%), followed by those with less than USD 30,000. Those with annual
income range USD 70,000 – 89,999 and above 90,000 are 11.4% and 12.3% respectively
of the total participants.
Table 4.13: Participants income Frequency Percent Cumulative Percent less than $30000 81 25.6 25.6 $30000 - 49999 92 29.0 54.6 $50000 - 69999 69 21.8 76.3 $70000 - 89999 36 11.4 87.7 $90000 or more 39 12.3 100.0 Total 317 100
4.14. Participants Age
Table 4.14 shows that of the total participants (N = 349), the majority were in the
age-groups of 26-35 (43.6%), 36-45 (21.2%), and 22-25 (11.5%). The rest age groups 18-
21; 46-55; 56-65 and above 65 years of age their frequencies in this study range from 5%
to 6%. Individuals in age groups 36-45 are commonly described as experiencing relatively
more, leisure-structural constraints like raising of young children (Crawford, Jackson and
Godbey, 1991). However, this study doesn’t strongly support that. The frequency of leisure
travel by people of this age-group is apparently among the highest in this study.

82
Table 4.14: Participants' age groups Frequency Percent Cumulative Percent 18 - 21 20 5.7 5.7 22 - 25 40 11.5 17.2 26 - 35 152 43.6 60.7 36 - 45 74 21.2 81.9 46 - 55 24 6.9 88.8 56 - 65 20 5.7 94.6 Above 65 19 5.4 100 Total 349 100
4.15. Consumer Involvement Profile
In this study, consumer involvement is used as an exogenous construct that triggers
the need for a traveler to search for information. Table 4.15 presents the psychographic
results of consumer involvement profile for each dimension. It shows the total number of
participants (N) who answered the item, mean for each dimension and standard deviation
(SD) a measure of dispersion among responses of participants in each item statement.
The results show that the mean across all five dimensions of the construct ranges
from 4.03 in the dimension of probability to 5.42 in the dimension of interest. Standard
deviation ranges from 1.38 in the dimension of interest to 1.64 in the dimension of interest.
The measure of dispersion i.e. standard deviation shows that there were noticeable
variations among responses of participants in this study. The measurement scale is in
seven-point Likert-type scale ranging from 1(Strongly disagree), 2(Disagree), 3(Somewhat
disagree), 4(Neither agree nor disagree), 5(Somewhat agree), 6(Agree), and 7(Strongly
agree). A higher average means that participants agreed more with the statements. In this
context, participants agree more in the interest dimension than in the dimension of
probability.

83
Table 4.15: Descriptive statistics for consumer involvement profile Dimension Item N Mean SD
Interest
1 The destination I visit is extremely important to me 356 5.43 1.34
2 I'm very interested in visiting tourist destinations like Tanzania 356 5.47 1.40
3 I care very much about visiting tourist destinations like Tanzania 356 5.36 1.40
Dimensional average 5.42 1.38
Pleasure
4 I really enjoy visiting tourist destinations like Tanzania 356 5.50 1.36
5 Whenever I visit tourist destinations like Tanzania, it's like giving myself a present 356 5.30 1.47
6 To me, is quite a pleasure visiting tourist destinations like Tanzania 356 5.49 1.40
Dimensional average 5.43 1.41
Sign
7 You can tell a lot about a person from the tourist destinations they visit 356 5.25 1.38
8 The tourist destination a person visits, says something about who they are 354 5.16 1.34
9 The tourist destination I visit reflects the sort of person I am 356 4.98 1.51
Dimensional average 5.13 1.41
Risk
10 I get annoyed very much if I make a mistake visiting a tourist destination, not of my interest 355 4.30 1.57
11 I get irritated to visit a tourist destination which isn't right 356 4.43 1.59
12 I get upset with myself if it turned out I'd made the wrong choice when selecting a tourist destination to visit 355 4.42 1.61
17 I would be unhappy if it happens, I have unknowingly chosen a destination that isn't of my interest 354 4.62 1.58
Dimensional average 4.44 1.59
Probability
13 When I'm considering a tourist destination to visit, I always feel rather unsure about what to pick 356 3.86 1.66
14 When you book a tourist destination, you can never be quite sure it was the right choice or not 355 4.23 1.62
15 Choosing a tourist destination to visit is rather difficult 356 3.87 1.68
16 When you book a tourist destination to visit, you can never be quite certain about your choice 356 4.15 1.58
Dimensional average 4.03 1.64 *A seven-point Likert-type scale was used ranging from 1(Strongly disagree), 2(Disagree), 3(Somewhat disagree), 4(Neither agree nor disagree), 5(Somewhat agree), 6(Agree), and 7(Strongly agree)

84
4.16. Information Sources Used
Sources of information are integral components of this study. Participants were
asked to disagree/agree on the likelihood of them having used one or more of the listed
sources of information. On a seven-point Likert-type scale, participants were asked how
they disagree/agree with the statements. Table 4.16 shows the results. The average response
is 5.04 which is slightly above the mid-point of the scale. Word of mouth from friends who
are relatively well knowledgeable about Tanzania leads by a mean of 5.66 while TV
programs have the lowest mean of 4.54. When looking at dispersion it appears that the
highest variation in responses among participant is the use of travel agents as sources of
information (SD = 1.69).
Table 4.16: Mean for each information source used
Item N Mea
n SD 1 Friends who are relatively well knowledgeable about Tanzania 356 5.66 1.46 2 Family members who are relatively well knowledgeable about Tanzania 356 5.28 1.62 3 Relatives (not family members) who are relatively knowledgeable about Tanzania 355 5.34 1.61 4 TV programs 356 4.54 1.68 5 Magazine articles 356 4.74 1.59 6 Tanzania Tourist Board websites and social media 356 4.94 1.66 7 Travel guidebooks 356 5.16 1.59 8 Travel bloggers 356 5.14 1.55 9 Travel agents 356 4.57 1.69
Average 5.04 1.63 *A seven-point Likert-type scale was used ranging from 1(Strongly disagree), 2(Disagree), 3(Somewhat disagree), 4(Neither agree nor disagree), 5(Somewhat agree), 6(Agree), and 7(Strongly agree)
4.17. Reliability of Information Sources
Following the question on likelihood of having used one the information sources,
participants were asked how reliable they perceived the information sources. In this
question, only items, that scored above 4 (neither agree nor disagree) were shown to the

85
participant. This means that the participant saw only those information sources that they
likely had used them. The reader should expect to see fewer number of participants in this
this question in comparison to previous ones. Table 4.17 shows the result.
Table 4.17: Mean of the reliability of information sources
Source of Information N Mean SD Friends who are relatively well knowledgeable about Tanzania 307 5.86 1.02
Family members who are relatively well knowledgeable about Tanzania 289 5.76 0.93 Relatives (not family members) who are relatively knowledgeable about Tanzania 283 5.67 0.96
TV programs 237 5.34 0.87
Magazine articles 257 5.26 1.04
Tanzania Tourist Board websites and social media 253 5.20 0.93
Travel guidebooks 275 5.56 0.92
Travel bloggers 277 5.44 0.84
Travel agents 233 5.47 0.91
*A seven-point Likert-type scale was used ranging from 1(Strongly unreliable), 2(Unreliable), 3(Somewhat unreliable), 4(Neither reliable nor unreliable), 5(Somewhat reliable), 6(Reliable), and 7(Strongly reliable)
It appears that, among information sources that are considered reliable by
participants, “friends who are relatively well knowledgeable about Tanzania” has the
highest mean (5.86), meaning the most reliable of all reliable information sources. The
websites and social media platforms of Tanzania Tourist Board are the least among reliable
(Mean = 5.20). The table also shows that participants’ responses vary the most (SD = 1.04)
in “magazine articles” and the least (SD = 0.84) in “travel blogs”.
4.18. Frequency of Using Information Sources
Again, as a follow up to the question on how reliable information sources are
perceived, participants of this study were asked to indicate how frequently they use the
information sources (Table 4.18). Information source in this question was shown only to

86
those participants who indicated the information source is reliable i.e. a score of above 4
(neither reliable nor unreliable) in the previous section (question). The question is asked in
seven-point Likert-type scale ranging from A seven-point Likert-type scale was used
ranging from 1(Once a month), 2(Twice a month), 3(Three times a month), 4(Once a
week), 5(Twice a week), 6(Three times a week), and 7(More than three times a week).
Table 4.18: Frequency of using information source
Source of information N Mean SD Friends who are relatively well knowledgeable about Tanzania 284 3.44 2.07
Family members who are relatively well knowledgeable about Tanzania 266 3.23 1.95 Relatives (not family members) who are relatively knowledgeable about Tanzania 259 2.97 1.77
TV programs 206 2.49 1.44
Magazine articles 218 2.53 1.43
Tanzania Tourist Board websites and social media 204 2.58 1.49
Travel guidebooks 245 2.98 1.81
Travel bloggers 243 3.02 1.82
Travel agents 209 2.67 1.59
*A seven-point Likert-type scale was used ranging from 1(Once a month), 2(Twice a month), 3(Three times a month), 4(Once a week), 5(Twice a week), 6(Three times a week), and 7(More than three times a week)
Table 4.18 shows that, among all information sources that were perceived to be
reliable, “friends who are relatively well knowledgeable about Tanzania” has the highest
frequency of use (mean = 3.44). Magazine articles are the least frequently used among
reliable information sources (mean = 2.53). Participants’ responses agree the most in
“magazine articles” (SD = 1.43) while disagree the most in “friends who are relatively well
knowledgeable about Tanzania” with standard deviation of 2.07.
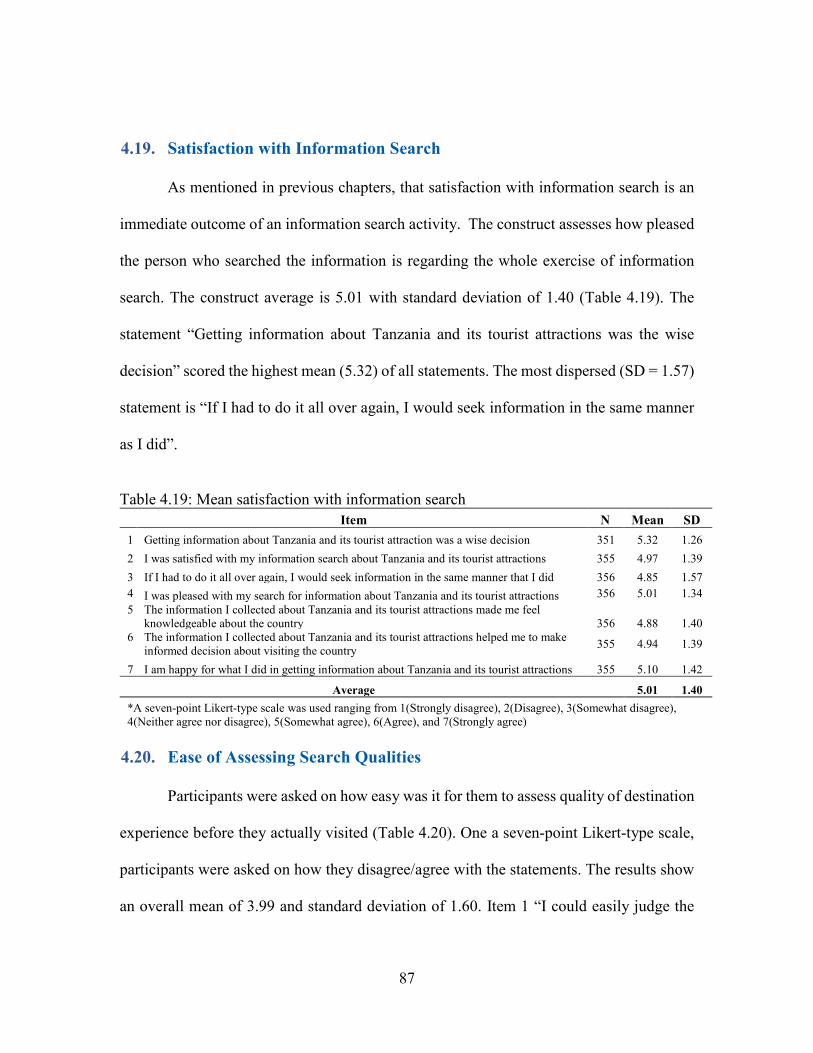
87
4.19. Satisfaction with Information Search
As mentioned in previous chapters, that satisfaction with information search is an
immediate outcome of an information search activity. The construct assesses how pleased
the person who searched the information is regarding the whole exercise of information
search. The construct average is 5.01 with standard deviation of 1.40 (Table 4.19). The
statement “Getting information about Tanzania and its tourist attractions was the wise
decision” scored the highest mean (5.32) of all statements. The most dispersed (SD = 1.57)
statement is “If I had to do it all over again, I would seek information in the same manner
as I did”.
Table 4.19: Mean satisfaction with information search
Item N Mean SD 1 Getting information about Tanzania and its tourist attraction was a wise decision 351 5.32 1.26 2 I was satisfied with my information search about Tanzania and its tourist attractions 355 4.97 1.39 3 If I had to do it all over again, I would seek information in the same manner that I did 356 4.85 1.57 4 I was pleased with my search for information about Tanzania and its tourist attractions 356 5.01 1.34 5 The information I collected about Tanzania and its tourist attractions made me feel
knowledgeable about the country 356 4.88 1.40 6 The information I collected about Tanzania and its tourist attractions helped me to make
informed decision about visiting the country 355 4.94 1.39
7 I am happy for what I did in getting information about Tanzania and its tourist attractions 355 5.10 1.42
Average 5.01 1.40 *A seven-point Likert-type scale was used ranging from 1(Strongly disagree), 2(Disagree), 3(Somewhat disagree), 4(Neither agree nor disagree), 5(Somewhat agree), 6(Agree), and 7(Strongly agree)
4.20. Ease of Assessing Search Qualities
Participants were asked on how easy was it for them to assess quality of destination
experience before they actually visited (Table 4.20). One a seven-point Likert-type scale,
participants were asked on how they disagree/agree with the statements. The results show
an overall mean of 3.99 and standard deviation of 1.60. Item 1 “I could easily judge the

88
quality of this destination experience before having actually visited it” is the most dispersed
with standard deviation of 1.65 while item 3 “With this destination, it is not difficult to
evaluate what you’re getting before you visit it” is least dispersed (SD = 1.59). However,
a reader would notice that the range among standard deviations of items is very small
(0.06). Similarly, the range among means of items is very small too (0.33).
Table 4.20: Ease of assessing search qualities
Item N Mean SD 1 I could easily judge the quality of this destination experience before having actually visited it 355 3.95 1.65 2 I could easily evaluate this destination before having actually visited it 354 3.95 1.59 3 With this destination, it is not difficult to evaluate what you’re getting before you visit it 354 3.87 1.58 4 I could easily evaluate the quality of experience of this destination through various sources of
information I used before having actually visited it 355 4.20 1.59
Average 3.99 1.60 *A seven-point Likert-type scale was used ranging from 1(Strongly disagree), 2(Disagree), 3(Somewhat disagree), 4(Neither agree nor disagree), 5(Somewhat agree), 6(Agree), and 7(Strongly agree)
4.21. Tourist Experience
Participants were asked to evaluate their experience at the destination against their
expectations prior to arriving. Table 4.21 shows the results from responses in the six
dimensions. A seven-point Likert-type scale ranging from 1(Far short of expectations),
2(Short of expectations), 3(Somewhat short of expectations), 4(As expected), 5(Somewhat
far exceeds expectations), 6(Exceeds expectations), to 7(Far exceeds expectations) was
used to assess actual experience of the participants. According to expectancy
disconfirmation theory, the mid-point of the scale will mean satisfied while the lower
scores will mean dissatisfaction and scores above mid-point are interpreted as over
satisfaction (Wang et al., 2016). Attractions dimension is observed to have the highest
mean (5.89) among the six dimensions while expediency appears to have the lowest mean

89
(3.98). Dimension of food is the most dispersed with standard deviation of 1.47.
Dispersion range is very small (0.07).
Table 4.21: Means of the six dimensions of tourist experience Dimension Item N Mean SD
Attractions
1 Learning about its history and culture 356 4.65 1.38 2 Experience of something different 356 4.96 1.34 3 Some beautiful scenery 356 5.28 1.40
21 Diversity of wildlife 349 4.76 1.55 22 Seeing the big five 335 4.44 1.61 18 Attractiveness of natural and scenic landscapes 356 5.23 1.42
Dimensional average 4.89 1.45
Expediency
4 Helpfulness and efficiency of immigration/customs/police officers 356 4.03 1.37
7 Simplified immigration and customs procedures 356 3.95 1.45 8 Convenience of shopping 356 3.68 1.40
9 Convenience of transportation within the country and between attractions 356 3.90 1.37
Dimensional average 3.89 1.40
Hospitality
5 Helpfulness and efficiency of hotel/restaurant/retail staff 356 4.66 1.45 13 Comfort of hotel accommodations 356 4.20 1.42 14 Hotel services 353 4.31 1.41 15 Hotel facilities 355 4.34 1.40
Dimensional average 4.38 1.42
Safety 6 Friendliness and courteousness of people in Tanzania 356 5.15 1.41
19 Climate and weather 355 4.07 1.46 20 Safety and peacefulness 356 4.63 1.45
Dimensional average 4.62 1.44
Prices 10 Prices for hotel accommodation 355 3.99 1.29 11 Prices of food 356 4.17 1.25 12 Prices of international air tickets 356 4.39 1.79
Dimensional average 4.18 1.45
Foods 16 Variety of food 354 4.17 1.50 17 Quality of food 355 4.24 1.45
Dimensional average 4.21 1.47 *A seven-point Likert-type scale was used ranging from 1(Far short of expectations), 2(Short of expectations), 3(Somewhat short of expectations), 4(As expected), 5(Somewhat far exceeds expectations), 6(Exceeds expectations), and 7(Far exceeds expectations)
4.22. Destination Experience
In addition to the previous questions, participants were also asked to describe their
experience in one word. Figure 4.3 shows a word cloud of the responses from 346

90
participants who answered this question. It appears that the majority of participants
described their experience with the destination as “amazing”, “wonderful”, “awesome”,
“fantastic”, and “beautiful”
Figure 4.3: Description of destination experience *The larger the font size the more frequent the term 4.23. Destination Description
Again, participants were as well asked, in one word, to describe Tanzania as tourist
destination based on their own actual experience. Figure 4.4 shows the results. A total of
339 participants answered this question and it appears that the majority described Tanzania
as a tourist destination “beautiful”, “good”, “wonderful”, “amazing”, “excellent”, “great”,
“friendly”, and “interesting”.

91
Figure 4.4: Destination description *The larger the font size the more frequent the term. 4.24. Reason for Repeat Visit
One last interesting question that participants were asked is what would be the main
reason if they were to re-visit Tanzania in the future. Figure 4.5 shows the results. A total
of 340 participants answered this question. It shows that the majority of participants, if they
are to re-visit Tanzania, the main reasons would be “to enjoy more”, “friendly people”,
“beaches”, “climb Mount Kilimanjaro”, “go on a safari”, “holiday”, “work”, “nature”, and
“parks”.

92
Figure 4.5: Reasons for repeat visit *The larger the font size the more frequent the term. 4.25. Chapter Summary
This chapter presented descriptive statistics of the results. The valid response rate
is 83.6%. This research includes residents of 50 countries from all over the world. The
majority of participants are residents of the USA, South Africa and Germany. Primary
purpose of the trip for the majority (57%) of participants in this study is
holiday/leisure/vacation and 54% of participants organized their trips independently.
About 70% of the participants were visiting the country for first time. Regarding the travel
party size, solo travelers were 30.3% and couples were 31.7%. About 75% of participants
stayed in the country for 14 nights or less while 64% spent USD 100 or less per day. Gender
93
wise, about 51% of the participants are females. Those with university first degree make
up 45% of all participants while those with income ranging from USD 30,000 to 89,999
are 62%. Participants who are aged 22 to 45 years make up 76% of all.
The majority of participants described their travel experience in Tanzania as
“amazing” and “wonderful”. They also described Tanzania as a “beautiful” and “amazing”
tourist destination. When asked, if they were to re-visit Tanzania, what would be the main
reason, most participants mentioned “beaches”, “safari”, and “holiday”. Of all information
sources, “friends who are relatively more knowledgeable about Tanzania” is considered as
a most reliable (mean = 5.86) and the most frequently used source of information (mean =
3.44).
94
CHAPTER FIVE
PRESENTATION OF INFERENTIAL STATISTICAL
RESULTS
5.1. Chapter Introduction
In this chapter, inferential statistical analyses are conducted. It begins with screening
in order to make data clean for advanced analyses. Specifically, this chapter identifies
outliers, assesses the missingness of data, prepares measurement models for different
constructs in the conceptual model and finally the structural model that tests hypotheses.
Key variables and constructs are consumer involvement profile (CIP), information sources,
the frequency of use information sources, ease of assessing search qualities, satisfaction
with information search, and destination satisfaction measured by tourist experience.
Inferential statistics help in trying to reach conclusions that are beyond the immediate
data alone to the general population that is being studied. Generally speaking, inferential
statistics are used to make judgments of the probability of how sample observations would
apply to the population. Thus, inferential statistics are used to infer findings from study
samples to the population.
5.2. Screening of Multivariate Outliers
The accuracy of data entry was not a problem as the survey was designed in Qualtrics
and data were collected using tablets. Moreover, this is one of many advantages that
information technologies offer in research, saves time and reduces errors. It is

95
recommended that as soon as data is entered into analytical software, it should be screened
for its accuracy. The observation of minimum and maximum values to reflect the Likert-
Type scale was found to be correct.
Normally, variables with skewness and kurtosis values beyond 3.29 (P<0.001, for
samples smaller than 200) would need a transformation to meet normality assumption of
parametric statistics (Hair, Black, Babin, Anderson, & Tatham, 2006; Tabachnick & Fidell,
2012). Moreover, for large samples than 200, the cut off value is 2.58, given that standard
errors are small. Alternatively, the outliers need to be identified and get deleted. In this
study SPSS software version 25 was used to assess outliers and nine cases (1138; 1259;
1052; 1167; 1162; 1238;1273;1353, and 1339), based on Studentized Deleted Residual and
Mahalanobis Distance tests, were confidently found to be potential outliers and were
deleted.
5.3. Missing Values Analysis
Missing data or incomplete cases are not uncommon in survey research. Often missing
data happens when no data has been entered in a certain variable. The sources could be the
respondent or the researcher when entering collected data into a computer program for
analysis. Regardless of the source, missing data could cause loss of invaluable data for the
research project in question. Most analytical procedures would exclude cases or variables
with severe missing values. However, while it is true that the use of only complete cases
makes it simple for the exercise of analyzing data, important information carried in the
incomplete cases is excluded in the analyses. Excluding incomplete cases makes it
impossible to fully understand the missingness pattern (Allison, 2003; Graham, 2009). It

96
would eventually flaw the inference of the findings. Furthermore, mishandling of missing
values may be sources of misleading measures, reduction of power and biases.
There are essentially three patterns of missingness of data: (i) Missing Completely
At Random (MCAR) it occurs when missing values are completely randomly distributed
across cases and variables (Kline, 2015). In other words, MCAR missing pattern means
missing values on dependent variable “Y” have no relationship with values on the
dependent variable “Y” and independent variable “X.” It is the most preferred behavior of
missingness. A Chi-square Little’s MCAR test is available in SPSS for diagnosing this type
of missingness; (ii) Missing At Random (MAR), this happens when missing values are not
completely randomly distributed across cases and variables (Kline, 2015). Such
missingness is randomly distributed at the level of sub-sample. It happens when missing
values on dependent variable “Y” do not relate to values on dependent variable “Y” but
relate to values on the independent variable “X.” One would say this type of missingness
exhibits weaker randomness in comparison to MCAR. It is the second best missingness
next to MCAR that researchers would prefer to see. To test for MAR in SPSS, a Separate
Variance t-Test is generated by default under MV A function. In that test output, columns
are all variables while rows are those variables with 5% or more missing values. Any cell
with P (2-tailed) <= 0.5 exhibits a significant correlation of missing values between the
row and column variables. Therefore, the missingness is not completely at random in such
context; and (iii) Missing Not At Random (MNAR), this is the worst pattern of
missingness. It entails that the missing values show a well-defined pattern (Kline, 2015).
It is yet to be found an approach of how to calculate the probability of this form of

97
missingness (Fichman & Cummings, 2003). In this current study the test of missingness
shows, the missing values are at random across variables and cases thus MAR (P<0.0001).
Literature suggests that whenever MAR is observed missing values should be
imputed (Fichman and Cummings, 2003). There are a few approaches for imputation of
missing values: (i) Complete case analysis-listwise deletion; (ii) Available case analysis--
pairwise deletion; (iii) Conditional mean imputation, usually using least square regression;
(iv) Multiple Imputations (MI); (v) Unconditional mean imputation; and (vi) Maximum
Likelihood Estimation (MLE).
There are a few weaknesses with some of these approaches of imputation. Both,
pairwise and listwise deletions as the names suggest, the delete cases with missing values.
Listwise deletion tends to omit cases with incomplete variables while pairwise deletion
does not include an account for cases with missing value variables in the analysis being
performed. The two approaches founded on the assumption that the missingness is MCAR
so omitting cases with missing values will not affect the subsequent analyses. It is not
always the case that the missingness is MCAR, actually very seldom (Fichman &
Cummings, 2003). One could see the biases created by the two approaches and thus their
main weakness. Multiple regression approach fills out missing values with the same value
to all cases with similar independent variable values (Fichman & Cummings, 2003). By
doing so, it tends to overcorrect and reduces variability among respondents.
Simple (grand) mean a substitution is an approach of imputation whereby a missing
value is replaced with the mean of the observations in non-missing cells for that variable.
The approach is also founded on the assumption that the missingness is at random. Simple

98
(grand) mean imputation does not retain the relationships among variables. Instead, it
preserves the mean of observed values. If it happens that the missingness is not at random,
it is possible that any inferences made from the find will be flawed. The multiple-
imputation method replaces each missing value with a set of plausible values that represent
the uncertainty about inherent in imputation (Rubin, 2004). It creates a set of imputations
normally 5 to 10, calculates the variation in parameter estimates then combine the results.
The MLE is currently the best and most recommended method of imputation. It
demands fewer statistical assumptions of data and assumes missing values are MAR
(Fichman & Cummings,2003). It uses an approach called Expectation Maximization (EM).
It is an iterative procedure that uses other variables to impute a missing value (Expectation)
and checks if the value is the most likely (Maximization). If not, it re-imputes a new value
that is more likely. It repeats this process until it reaches the most likely value.
In this study, the assessment of missingness pattern was conducted using EQS
across constructs and variables. Missing values were observed to be 141 data points which
are 0.53% of the total data points. The pattern of the missing values was found to be not
MCAR (χ2 = 2510, df = 2037, N = 347, p<0.000) suggesting that it was likely a MAR. This
was confirmed by the "Separate Variance t-Tests" procedure on SPSS Missing Value
Analysis. This procedure, by default, prints a separate table of variance t-tests. In such a
table, rows are all variables which have 5% missing or more, while columns are all the
variables. The SPSS’s Missing Value Analysis procedure did not print this table indicating
that there were no variables with 5% or more of the values missing and thus confirmed the
missingness was MAR. It, therefore, paved a room for data imputation. A positive test of

99
MAR allows both MI and MLE as appropriate approaches for imputation (Allison, 2003;
Graham, 2009; Schafer & Graham, 2002). This study used an EM approach specifically
MLE imputation under EQS 6.4.
5.4. Confirmatory Factor Analyses and Measurement Models
Confirmatory Factor Analysis (CFA) is a special form of analysis used in various
social sciences research projects to test whether measures of a construct are consistent with
the understanding of the researcher about the nature of the construct in question (Kline,
2015). It is the following step after exploratory factor analysis (EFA) to determine the
factor structure of the dataset when one has no idea of which items converge to what
factors. One would say CFA is a multivariate statistical procedure that is useful in testing
how well the observed variables represent constructs. CFA confirms the structure of the
factor. Essentially, CFA is a tool one could use to confirm or reject the measurement theory
(Byrne, 2006). CFA allows the researcher to test the hypotheses on whether relationships
between observed variables and their underlying constructs exist or not as well as how
strong and reliable those relationships are. It is of vital importance for the researcher to
confirm all the factors in the hypothesized research model. The CFA process partly
involves: i) conducting preliminary descriptive statistical analyses like outlier diagnoses
and missing data analyses, ii) estimating parameters in the model, iii) assessing model fit,
and iv) presenting and interpreting the results (Byrne, 2006; Kline, 2015).

100
5.4.1. Measurement Model for Consumer Involvement Profile
A confirmatory factor analysis (CFA) procedure using software EQS 6.4, under
ROBUST function with LaGrange Multiplier (LM) Test set-on, was performed on the 17-
item CIP scale to verify if the statements appropriately load on the respective dimensions
(or factors) of INT, PLE, SGN, RSK, and PRO. The 17 variables are listed in Table 5.1
along with loadings, Average Variance Extracted (AVE), reliability for both Cronbach’s
Alpha (α) and a weighted composite reliability Rho (CR). The test was performed under
the Maximum Likelihood (ML) method (normal distribution assumption).
When assessing measurement models estimated under Maximum Likelihood
methods, the first things are the pattern coefficients, if items load only on factors they
should and fit indices (Kline, 2015). An ideal measurement model is the one with
insignificant chi-square values (an absolute measure), with CFI equal or above 0.95 (an
incremental measure), and RMSEA or SRMR value of equal or below 0.05 (a combined
measure that takes into consideration degrees of freedom/parsimony) (Byrne & Crombie,
2003). However, chi-square tends to increase with an increase in sample size, weighing
between chi-square and sample size, it is better to have big sample sizes due to numerous
advantages including power and effect sizes rather than having lowest chi-square (Byrne,
2006; Kline, 2015).

101
Table 5.1: Measurement model for consumer involvement profile
Dimension Code Item Loading AVE (α) CR (ρ)
Interest (INT)
INT1 The destination I visit is extremely important to me 0.69 0.66 0.85 0.85
INT2 I'm very interested in visiting tourist destinations like Tanzania 0.90
INT3 I care very much about visiting tourist destinations like Tanzania 0.83
Pleasure (PLE)
PLE1 I really enjoy visiting tourist destinations like Tanzania 0.87 0.68 0.86 0.86
PLE2 Whenever I visit tourist destinations like Tanzania, it's like giving myself a present 0.78
PLE3 To me, is quite a pleasure visiting tourist destinations like Tanzania 0.82
Sign (SGN)
SGN1 You can tell a lot about a person from the tourist destinations they visit 0.76 0.67 0.86 0.86
SGN2 The tourist destination a person visits, says something about who they are 0.85
SGN3 The tourist destination I visit reflects the sort of person I am 0.84
Risk (RSK)
RSK1 I get annoyed very much if I make a mistake visiting a tourist destination, not of my interest 0.77 0.60 0.86 0.86
RSK2 I get irritated to visit a tourist destination which isn't right 0.81
RSK3 I get upset with myself if it turned out I'd made the wrong choice when selecting a tourist destination to visit 0.79
RSK4 I would be unhappy if it happens, I have unknowingly chosen a destination that isn't of my interest 0.73
Probability (PRO)
PRO1 When I'm considering a tourist destination to visit, I always feel rather unsure about what to pick 0.63 0.53 0.81 0.81
PRO2 When you book a tourist destination, you can never be quite sure it was the right choice or not 0.69
PRO3 Choosing a tourist destination to visit is rather difficult 0.75
PRO4 When you book a tourist destination to visit, you can never be quite certain about your choice 0.82
χ2 = 200.48, df = 109, p<0.00, CFI = 0.96, RMSEA = 0.05, CI = 0.038, 0.060, N = 347

102
From the measurement model (Table 5.1) the model fits well (χ2 = 200.48, df =
109, p<0.00, CFI = 0.96, RMSEA= 0.05, CI = 0.038, 0.060, N = 347). All items load
reasonably well in their dimensions. The loadings range from 0.63 in PRO1 to 0.90 in
INT2. Even though it could be better to have item loadings >= 0.70 (Hair, Black, Babin, &
Anderson, 2010), 0.6’s is still not too bad loading it could be relied on as long as other
items in the dimension are >= 0.70. Convergent validity of items to constructs as measured
by AVE appears to be reasonably good (AVE >= 0.5) (Malhotra, 2009). The dimension of
PRO is marginally valid (0.53).
Table 5.2 shows factor correlations (correlations of dimensions) along with square
roots values of AVE in the diagonal for easy of assessing discriminant validity of
dimensions. The results show positive discriminant validity, square roots of AVE in the
diagonal are bigger than values of factor correlations. However, there is a very high
correlation between INT and PLE (0.80) making it very marginally valid.
Table 5.2: Factor correlations in consumer involvement profile (CIP) INT PLE SGN RSK PRO
INT 0.81 PLE 0.80 0.82 SGN 0.43 0.49 0.82 RSK 0.16 0.19 0.36 0.78 PRO 0.06 -0.02 -0.02 0.35 0.73
Note: Diagonal bolded values are the square roots of AVEs for each factor See Table 5.1 for the abbreviations of dimensions
Such a strong correlation could be contributed by the fact that the two dimensions
are very close as they measure a high level of motivation within the construct. It also
appears that INT, PLE, and SGN have the lowest correlations with PRO and RSK. This
could be because the two dimensions of risk and probability measure the consequences of

103
making bad decisions. The model is reliable as measured by composite reliability weighted
average Rho (ρ). The composite reliability ranges from 0.81 in PRO dimension to 0.86 in
RSK, SGN, and PLE dimensions. The standard to reliable measurements is ρ or α to be
equal or bigger than 0.70 (Jackson et al., 2009; Kline, 2015). Since consumer involvement
profile is a multi-dimensional construct, the fit of second-order measurement model needs
to be assessed (Barbara M. Byrne & Crombie, 2003; Kline, 2015; Schreiber et al., 2006).
Using EQS 6.4 software a CFA second order measurement model was run in ROBUST
function and ML method, with LM test on for covariances between factor disturbances
(factor errors). One item with the highest loading in each dimension was fixed to 1 to allow
estimation of factor loadings to the second order construct. Table 5.3 shows the results.
Table 5.3: Second order measurement model for CIP
Dimension Loading AVE (α) CR (ρ) INT 0.85
0.39 0.64 0.68 PLE 0.94 SGN 0.52 RSK 0.23 PRO 0.02
χ2 = 250, df = 114, p<0.000, CFI = 0.94, RMSEA = 0.06, CI = 0.049, 0.068, N = 347 See Table 5.1 for abbreviations of dimensions.
The fit appears to be relatively good (χ2 = 250, df = 114, p<0.000, CFI = 0.94,
RMSEA = 0.06) but there is plenty of room for improvement. Loading (0.02) for PRO is
the lowest of all factors, and it has an insignificant contribution to the CIP construct
according to this dataset. Convergent validity as measured by AVE appears to be poor

104
(below 0.5) meaning that the factors are not consistently measuring the same construct
(Kline, 2015).
Due to the observed weaknesses of the second order measurement model, the model
was to be re-specified with four factors INT, PLE, SGN, and RSK under the same analytical
specifications and methods as previous only excluding dimension of PRO. Table 5.4 shows
the results. It appears that the model has been improved from CFI 0.94 to 0.96 (the bigger,
the better); RMSEA 0.06 to 0.05 (the smaller, the better). Convergent validity AVE also
improved from 0.39 to 0.48 but still below the approximate cutoff point of 0.5. Loading
for RSK is also still unreliable, a reliable loading is the one that is equal or above 0.70 but,
in some rare situations, one may still accept one with a value of 0.5 (Hooper, Coughlan, &
Mullen, 2008). So, the decision to re-specify the model was reached, and the new version
of the measurement model excluded RSK. Second order CFA was re-run using the same
conditions of a ROBUST function, ML method, with the LM test of covariance between
factor disturbances being set on. Table 5.5 shows the resulting measurement model.
Table 5.4: Second order measurement model of CIP excluding PRO
Dimension Loading (λ) AVE (α) CR (ρ) INT 0.85
0.48 0.76 0.91 PLE 0.94 SGN 0.52 RSK 0.23
χ2 = 161, df = 61, p<0.000, CFI = 0.96, RMSEA = 0.05, CI = 0.039, 0.067, N = 347
It appears that there is much improvement in the new measurement model (Table
5.5). CFI went up from 0.96 to 0.98, Chi-square is marginally significant (p = 0.04),

105
RMSEA improved from 0.05 to 0.046 and the most important are indices for convergent
validity AVE improved from 0.48 to 0.64 crossing the cutoff point of 0.5 meaning we have
confidence that the three factors INT, PLE and SGN consistently measure the same
construct reliably (ρ = 0.83) (Table 5.5). It is concluded that this is the best and final second
order measurement model for CIP. The excluded dimensions of RSK and PRO will still be
used in the structural models but will be treated as independent factors that covary with
each other as well as with the second order measurement model of CIP (Byrne & Crombie,
2003; Kline, 2015; McDonald & Ho, 2002).
Table 5.5: Final second order measurement model of CIP excluding RSK and PRO
Dimension Loading (λ) AVE (α) CR (ρ) INT 0.82
0.64 0.82 0.83 PLE 0.99 SGN 0.51
χ2 = 23, df = 13, p = 0.04, CFI = 0.98, RMSEA = 0.046, CI = 0.02, 0.07, N = 347
Since RSK and PRO have been excluded from the second order measurement
model of CIP, they have to be assessed as independent measurement models before being
covaried with each other and with the second order measurement model. First order CFA
using EQS 6.4 software, under ROBUST function, and ML method, with LM test set
between observed variable errors, was run to assess the fitness of factors RSK and PRO.
Tables 5.6 and 5.7 show the results. First order RSK factor with four items was run first
and the results showed okay fit (χ2 = 10, df = 2, p = 0.005, CFI = 0.98, RMSEA = 0.121,
CI = 0.062, 0.190, N = 347). As the reader could see, RMSEA (0.121) is very poor (even

106
though it is highly affected by the degrees of freedom being very few). However, also, the
LM test indicated a significant improvement of model fitness would be achieved if errors
covariance between items RSK2 and RSK4 are included in the model (Figure 5.1). The
model had to be re-specified to include the LM-suggested errors covariance between items
RSK2 and RSK4. The new and final improved model Table 5.6 was produced.
Figure 5.1: CFA of RSK dimension
Table 5.6: Final first order measurement model for risk (RSK)
Item Loading (λ) AVE (α) CR (ρ) RSK1 0.77
0.60 0.86 0.86 RSK2 0.82 RSK3 0.80 RSK4 0.71
χ2=0.997, df= 1, p=0.32, CFI=1, RMSEA=0.000, CI = 0.000, 0.142, N= 347 With error covariance between RSK2 & RSK4
Specifically, the chi-square improved from 10 to 0.997, CFI improved from 0.98 to
1, RMSEA improved from 0.121 to less than 0.000 (Table 5.6). The model is valid as
shown by AVE value of 0.60 and also reliable Rho (ρ) of 0.86. Having an error covariance
between two items in the same factor means that the two items are relatively much closer
to each other when compared to other items within the factor or construct. In this case, it
appears that items RSK2 (I get irritated to visit a tourist destination which isn't right) and
RSK4 (I would be unhappy if it happens, I have unknowingly chosen a destination that

107
isn't of my interest) appear to have been interpreted pretty much in a similar way by the
participants.
A CFA model for PRO was also estimated using the same conditions, ROBUST
function, ML method and LM test set for error covariance of observed variables. Table 5.7
shows the results. The fit indices show that the measurement model is fit (χ2 = 7, df = 2,
p<0.03, CFI = 0.99, RMSEA = 0.09, CI = 0.028, 0.161). However, there are a few
weaknesses; loading for item PRO1 is relatively small (0.63) making it the least reliable of
the four items; convergent validity is marginally positive (0.53) and RMSEA is not
excellent (0.09) it may have been impacted by the few degrees of freedom. The model is
reliable (ρ = 0.81).
Table 5.7: Final first order measurement model for the dimension of probability (PRO)
Item Loading (λ) AVE (α) CR (ρ) PRO1 0.63
0.53 0.81 0.81 PRO2 0.69 PRO3 0.75 PRO4 0.82
χ2 = 7, df = 2, p<0.03, CFI = 0.99, RMSEA = 0.09, CI = 0.028, 0.161, N = 347
5.4.2. Measurement Model for Ease of Assessing Search Qualities
A CFA was run using EQS 6.4 software, under ROBUST function, ML method
with LM test set for error covariances between observed variables. The initial measurement
model appeared to be relatively good (χ2 = 28, df = 2, p<0.01, CFI = 0.97, RMSEA = 0.19,
CI = 0.135, 0.261). However, LM test suggested an additional error covariance between
items ESQ1 and ESQ2 (Table 5.8). The wording of the two items is very similar and this

108
might have led into confusion among participants, thus failed to tell the difference between
the two items. The suggested error covariance was added (Figure 5.2). The new model
appeared to have been significantly improved in comparison to the previous one (Table
5.8). Specifically, chi- square improved from 28 to 0.21, RMSEA improved from 0.19 to
0.000 and CFI improved from 0.97 to 1 (Table 5.8). The items also appear to be measuring
the same thing as proved by AVE (0.65), they are also reliable ρ = 0.89.
Figure 5.2:CFA Structure of ESQ
χ2 = 28, df = 2, p<0.00, CFI = 0.97, RMSEA = 0.19, CI = 0.135, 0.261. Table 5.8: Final measurement model for ease of assessing search qualities
Code Item Loading
(λ) AVE (α) CR (ρ)
ESQ1 I could easily judge the quality of this destination experience before having actually visited it 0.71
0.65 0.88 0.88 ESQ2 I could easily evaluate this destination before having actually visited it 0.85 ESQ3 With this destination, it is not difficult to evaluate what you’re getting
before you visit it 0.87
ESQ4 I could easily evaluate the quality of experience of this destination through various sources of information I used before having actually visited it
0.79
Χ2 = 0.21, df = 1, p<0.64, CFI = 1, RMSEA = 0.000, CI = 0.000, 0.110, N = 347 With error covariance between ESQ1 & ESQ2

109
5.4.3. Measurement Model for Satisfaction with Information Search
A CFA was run using EQS 6.4 under both ML and ROBUST methods with LM
test set on for error covariances between items. The initial model resulted in χ2 = 82, df =
14, p<0.00, CFI = 0.95, RMSEA=0.09, CI = 0.062, 0.114, N = 347 which is good but not
the best. LM test suggested error covariances between items ISA5 and ISA6 (Figure 5.3).
Looking at these two items (ISA5 and ISA6) the similarity of wording might have confused
participants (Table 5.9). Then the CFA was re-run under the same conditions and methods.
The results (Table 5.9) are better than the previous model.
Figure 5.3: CFA structure of ISA Table 5.9: Final measurement model for satisfaction with information search
Code Item Loading (λ) AVE (α) CR (ρ)
ISA1 Getting information about Tanzania and its tourist attraction was a wise decision 0.59
0.59 0.91 0.91
ISA2 I was satisfied with my information search about Tanzania and its tourist attractions 0.79
ISA3 If I had to do it all over again, I would seek information in the same manner that I did 0.75
ISA4 I was pleased with my search for information about Tanzania and its tourist attractions 0.83
ISA5 The information I collected about Tanzania and its tourist attractions made me feel knowledgeable about the country
0.75
ISA6 The information I collected about Tanzania and its tourist attractions helped me to make informed decision about visiting the country
0.81
ISA7 I am happy for what I did in getting information about Tanzania and its tourist attractions
0.84
χ2 = 37, df = 13, p<0.000, CFI = 0.98, RMSEA = 0.07, CI = 0.046, 0.101, N = 347 With error covariance between ISA5 & ISA6

110
The re-specification of measurement improved the model chi-square from 82 to 37,
CFI from 0.95 to 0.98 and RMSEA from 0.09 to 0.07 (Table 5.9). Of all the items, ISA1
has the lowest loading. However, it is retained. Convergent validity is marginally fine AVE
= 0.59 and the measurement are reliable ρ = 0.91. Hence the model is accepted as the final
measurement model for satisfaction with information search.
5.4.4. Measurement Model for Ease of Assessing Search Qualities
A CFA was run using EQS 6.4 software, under ROBUST function, ML method with
LM test set for error covariances between observed variables. The initial measurement
model appeared to be relatively good (χ2 = 28, df = 2, p<0.00, CFI = 0.97, RMSEA = 0.19,
CI = 0.135, 0.261). However, LM test suggested an additional error covariance between
items ESQ1 and ESQ2. The suggested error covariance was added (Figure 5.4). The new
model appeared to have been significantly improved in comparison to the previous one
(Table 5.10). Specifically, chi- square improved from 28 to 0.21, RMSEA improved from
0.19 to 0.000 and CFI improved from 0.97 to 1 (Table 5.8). The items also appear to be
measuring the same thing as proved by AVE (0.65), they are also reliable ρ = 0.89.
Figure 5.4: CFA structure for ESQ

111
Table 5.10: Measurement model for ease of assessing search qualities
Code Item Loading (λ) AVE (α) CR (ρ) ESQ1 I could easily judge the quality of this destination experience before having
actually visited it 0.71
0.65 0.88 0.89 ESQ2 I could easily evaluate this destination before having actually visited it 0.85 ESQ3 With this destination, it is not difficult to evaluate what you’re getting
before you visit it 0.87
ESQ4 I could easily evaluate the quality of experience of this destination through various sources of information I used before having actually visited it
0.79
χ2 = 0.21, df = 1, p<0.64, CFI = 1, RMSEA = 0.000, CI = 0.000, 0.110, N = 347 With error covariance between ESQ1 & ESQ2
5.4.5. Measurement Model for Tourist Experience
A CFA was run for each of the five factors within the tourist experience construct,
using EQS 6.4 software under ML and ROBUST methods with LM test set on for error
covariance between items. For factors under identified factors, they were combined in
order to get loading estimates (Table 5.11). As it could be seen in Table 5.11, the fit indices
are not very good. The model was re-specified by deleting problematic items ATT4, ATT5,
and HSP1 and adding an error covariance between items EXP1 and EXP2 was added. The
1st order model was then re-run under the same conditions as before adding the covariances
between all dimensions (Table 5.11). The new 1st order measurement model for tourist
experience appeared to have been improved a lot (χ2 = 127.8, df = 119, p<0.27 CFI =1,
RMSEA = 0.02, CI = 0.000, 0.003, N = 347, ρ = 0.92, α = 0.90). Fit indices show it is a
good measurement models (Byrne & Stewart, 2006; Kline, 2015). The reader’s attention
is directed to some weak observations in Table 5.11. Convergent validities for factors EXP,
SFT, HSP and PRC are at the margin. However, they are reliable factors (Table 5.12) and
have discriminant validity support them (Table 5.13).

112
Table 5.11: Measurement models for tourist experience construct
Dimension Code Item Loading
(λ) AVE (α) CR (ρ) SQRT-AVE Fit Indices
Attractions (ATT)
ATT1 Learning about its history and culture 0.73
0.52 0.86 0.88 0.72 χ2=45, df= 5, p<0.000, CFI=0.93, RMSEA=0.15
ATT2 Experience of something different 0.80 ATT3 Some beautiful scenery 0.80 ATT4 Diversity of wildlife 0.70 ATT5 Attractiveness of natural and scenic landscapes 0.56
Expediency (EXP)
EXP1 Helpfulness and efficiency of immigration/customs/police officers 0.72
0.51 0.78 0.80 0.69 χ2=40, df= 2, p<0.000, CFI=0.91, RMSEA=0.24
EXP2 Simplified immigration and customs procedures 0.79 EXP3 Convenience of shopping 0.58 EXP4 Convenience of transportation within the country and
between attractions 0.66
Hospitality (HSP)
HSP1 Helpfulness and efficiency of hotel/restaurant/retail staff 0.61
0.64 0.87 0.91 0.80 χ2=14, df= 2, p<0.00, CFI=0.98, RMSEA=0.13
HSP2 Comfort of hotel accommodations 0.83 HSP3 Hotel services 0.91 HSP4 Hotel facilities 0.82
Safety (SFT)
SFT1 Friendliness and courteousness of people in Tanzania 0.60 0.50 0.53 0.69 0.61
Fit indices are meaningless the model is just identified
SFT2 Climate and weather 0.42 SFT3 Safety and peacefulness 0.77
Prices (PRC)
PRC1 Prices for hotel accommodation 0.65
0.52 0.53 0.72 0.62
Fit indices are meaningless the model is just identified
PRC2 Prices of food 0.79 PRC3 Prices of international air tickets 0.35
Foods (FDS)
FDS1 Variety of food 0.85
0.74 0.85 0.85 0.86
Fit indices are meaningless the model is under identified
FDS2 Quality of food 0.87

113
Table 5.12: Final measurement models for tourist experience construct
Dimension Code Item Loading
(λ) AVE (α) CR (ρ) SQRT-AVE Fit Indices
Attractions (ATT)
ATT1 Learning about its history and culture 0.76 0.64 0.84 0.84 0.80
Fit indices are meaningless the model is just identified
ATT2 Experience of something different 0.86 ATT3 Some beautiful scenery 0.77
Expediency (EXP)
EXP1 Helpfulness and efficiency of immigration/customs/police officers 0.65
0.51 0.80 0.80 0.71 χ2=6.2, df= 1, p<0.01, CFI=0.98, RMSEA=0.12
EXP2 Simplified immigration and customs procedures 0.74 EXP3 Convenience of shopping 0.68 EXP4 Convenience of transportation within the country and between
attractions 0.77
Hospitality (HSP)
HSP2 Comfort of hotel accommodations 0.85
0.50 0.89 0.89 0.71
Fit indices are meaningless the model is just identified
HSP3 Hotel services 0.88 HSP4 Hotel facilities 0.84
Safety (SFT)
SFT1 Friendliness and courteousness of people in Tanzania 0.75 0.50 0.74 0.75 0.70
Fit indices are meaningless the model is just identified
SFT2 Climate and weather 0.69 SFT3 Safety and peacefulness 0.67
Prices (PRC)
PRC1 Prices for hotel accommodation 0.70
0.52 0.62 0.63 0.62
Fit indices are meaningless the model is just identified
PRC2 Prices of food 0.74 PRC3 Prices of international air tickets 0.35
Foods (FDS)
FDS1 Variety of food 0.88
0.74 0.85 0.85 0.86
Fit indices are meaningless the model is underidentified
FDS2 Quality of food 0.84
1st Order measurement model: χ2 = 127.8, df = 119, p<0.27, CFI = 1, RMSEA = 0.02, CI = 0.000, 0.003, N = 347

114
Table 5.13: Second order measurement model for tourist experience construct Dimension Loading (λ) AVE SQRT (AVE) (α) CR (ρ)
ATT 0.68 0.64 0.80
0.90 0.92
SFT 0.81 0.50 0.71 EXP 0.79 0.51 0.71 HSP 0.77 0.50 0.71 PRC 0.80 0.52 0.72 FDS 0.73 0.74 0.86
χ2 = 172, df = 128, p<0.01, CFI = 0.98, RMSE A= 0.03, CI = 0.018, 0.043, N = 347, ρ = 0.89, α = 0.89
Table 5.14: Factor correlations for tourist experience construct ATT SFT EXP HSP PRC FDS
ATT 0.80 SFT 0.70 0.71 EXP 0.48 0.61 0.71 HSP 0.51 0.59 0.57 0.71 PRC 0.49 0.53 0.70 0.65 0.72 FDS 0.46 0.53 0.61 0.60 0.60 0.86
Note: Diagonal values in bold are the square roots of AVEs for each dimension See Table 5.11 for abbreviations of dimensions
Since the construct of tourist experience is multidimensional, a second-order CFA
was run. Table 5.12 shows all factors loads sufficiently (>0.7) with exception to ATT with
loads slightly low (0.68). The second order fit indices are also plausible (χ2 = 172, df = 128,
p<0.00 CFI = 0.98, RMSEA = 0.03, CI = 0.018, 0.043, ρ = 0.89, α = 0.89, N = 347).
Discriminant validity is also supported as shown in the factor correlation matrix (Table
5.13). The diagonal values are the square roots of AVE. It is therefore retained as the final
measurement model for the construct of the tourist experience.
5.4.6. Structural Model with all Constructs
A CFA was conducted involving all constructs as specified in previous sections.
The model was run using EQS 6.4 software, under ML and ROBUST methods with LM

115
test set on for error covariances and disturbance covariances between observed variables
and factors respectively. Additionally, the exogenous factors; a second order CIP that
includes INT, PLE, and SGN; RSK and PRO were covaried (Bedeian, Day, & Kelloway,
1997; Barbara M. Byrne & Crombie, 2003). Figure 5.5 shows a simplified diagram of the
construct layout. It resulted in the following indices under ROBUST methods χ2 = 1262.94,
df = 962, p<0.00 CFI = 0.96, RMSEA = 0.03, CI = 0.025, 0.034, N = 347, ρ = 0.95, α =
0.91. These are undoubted good fit indices indicating a good model fit (Kline, 2015). So,
it was considered to be the final structural model for all constructs put together.
Figure 5.5: Layout of structural model for all constructs
Key: INT=Interest, PLE=Pleasure, SGN=Sign, CIP=Consumer Involvement Profile, RSK=Risk, PRO=Probability, ESQ=Ease of Search Qualities, SIS=Satisfaction with Information Search, TEXP=Tourist Experience, ATT=Attractions, EXP=Expediency, HSP=Hospitality, SFT=Safety, PRC=Prices, FDS=Foods.

116
5.5. Number of Information Sources
A new variable was computed in SPSS software version 25 by summing up
information sources that a participant indicated they have used in planning the trip. To do
this, all information sources that scored point 5 (Slightly likely), 6 (moderately likely) or 7
(extremely likely) on the Likert-type scale were summed up. The question asked, “When
planning this trip, how likely did you use the following information sources.” So, it makes
sense to consider only those information sources that scored above point 4. Since there are
nine information sources, the maximum score in the new computed variable a participant
could get is 9, and the minimum is 0 (Table 5.15).
Table 5.15: Mean number of information sources used by participants
N Mean SD Skewness Kurtosis Minimum Maximum 347 6.83 2.60 -0.98 -0.19 0 9
5.6. The Depth of Information Search
The depth of information search was computed from the frequency of use of a
particular information source. The frequency of use ranged from once a month (1), twice a
month (2), three times a month (3), once a week (4), twice a week (5), three times a week
(6) and more than three times a week (7). The new variable was computed using SPSS
software version 25. A participant who used all nine information sources at a frequency of
more than three times a week would score a total point of 9*7 = 63, and this is the maximum
score (Table 5.16) shows the total frequency of use of information sources across all nine
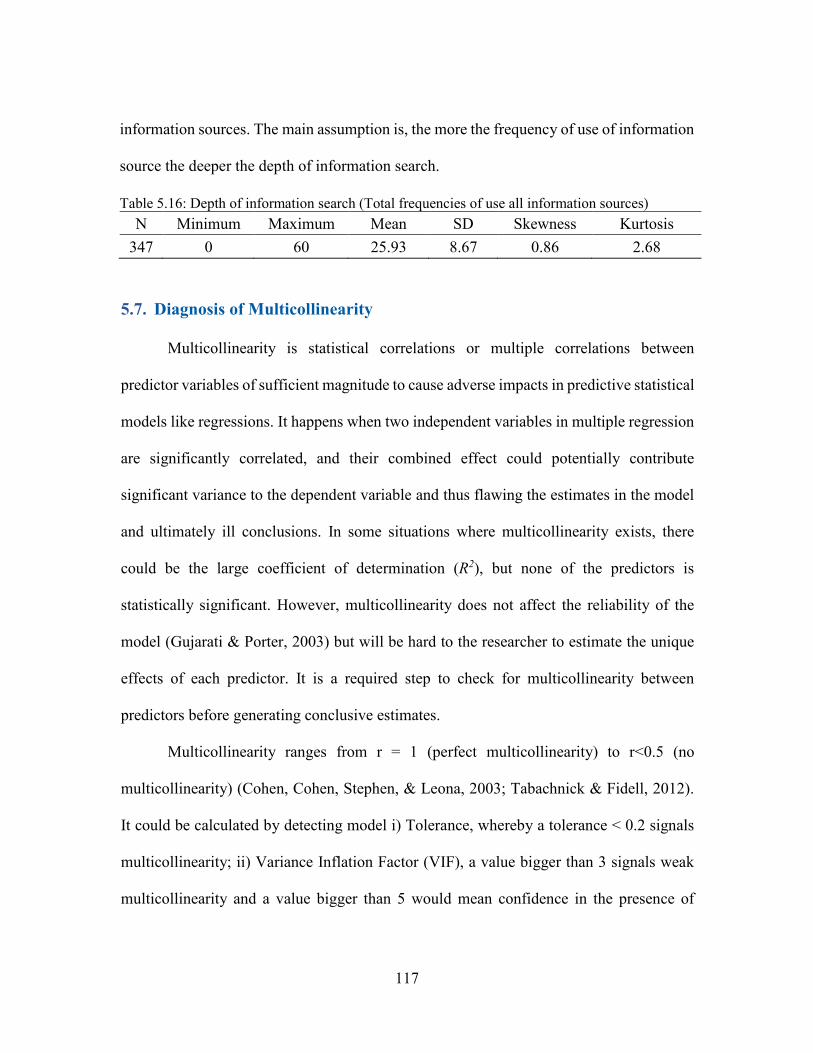
117
information sources. The main assumption is, the more the frequency of use of information
source the deeper the depth of information search.
Table 5.16: Depth of information search (Total frequencies of use all information sources) N Minimum Maximum Mean SD Skewness Kurtosis
347 0 60 25.93 8.67 0.86 2.68
5.7. Diagnosis of Multicollinearity
Multicollinearity is statistical correlations or multiple correlations between
predictor variables of sufficient magnitude to cause adverse impacts in predictive statistical
models like regressions. It happens when two independent variables in multiple regression
are significantly correlated, and their combined effect could potentially contribute
significant variance to the dependent variable and thus flawing the estimates in the model
and ultimately ill conclusions. In some situations where multicollinearity exists, there
could be the large coefficient of determination (R2), but none of the predictors is
statistically significant. However, multicollinearity does not affect the reliability of the
model (Gujarati & Porter, 2003) but will be hard to the researcher to estimate the unique
effects of each predictor. It is a required step to check for multicollinearity between
predictors before generating conclusive estimates.
Multicollinearity ranges from r = 1 (perfect multicollinearity) to r<0.5 (no
multicollinearity) (Cohen, Cohen, Stephen, & Leona, 2003; Tabachnick & Fidell, 2012).
It could be calculated by detecting model i) Tolerance, whereby a tolerance < 0.2 signals
multicollinearity; ii) Variance Inflation Factor (VIF), a value bigger than 3 signals weak
multicollinearity and a value bigger than 5 would mean confidence in the presence of

118
multicollinearity, and finally a value bigger than 10 would be interpreted as a
multicollinearity of large magnitude; iii) Pearson’s correlation (r) between predictors, a
value greater than 0.9 indicates the presence of multicollinearity (Cohen et al., 2003; Hair,
Celsi, Money, Samouel, & Page, 2015; O’brien, 2007; Tabachnick & Fidell, 2012). In this
study, multicollinearity between two predictors (number of information sources used and
the depth of information search) was diagnosed using SPSS software version 25. The result
shows that there is no multicollinearity between the two variables as VIF is 1. Additionally,
a pearson’s correlation r is 0.023 (Table 5.17).
Table 5.17: Diagnosis of multicollinearity of variables
Model Unstandardized
Coefficients Standardized Coefficients t Sig. Collinearity Statistics
B Std. Error Beta Tolerance VIF (Constant) 6.65 0.44 15.07 0.00
Depth of Info Search 0.01 0.02 0.023 0.43 0.67 1.0 1.0 Dependent variable: Number of Information Sources
5.8. Conceptual Structural Model
A reader is reminded of the conceptual model Figure 2.2 of this study. Because the
CIP construct was broken into three factors, 2nd Order CIP, RSK and PRO (Figure 5.5) it
has led to slight modification of the conceptual model appearance. The new modified
conceptual structural model (Figure 5.6) has three exogenous factors that are covaried to
each other and each one of them predicts the number of information sources used (NIS),
ease of search (ESQ) and depth of information search (DIS).
A CFA was run with all variables and constructs as indicated in Figure 5.5, using
EQS 6.4 software under ML and ROBUST methods with LM test set on for

119
Variance/Covariance Matrix (PFF, PDD, PFV, and PVV); Dependent <- Independent
(GVF, GFF, and GFV); and Dependent <- Dependent Var (BVF, and BFF). The results are
shown in Table 5.18.
Figure 5.6: Modified conceptual structural model
Table 5.18: Initial results of full structural model
S/N
Dependent Variable Independent Variables R2
1 NIS 0.112CIP - 0.042PRO + 0.174RSK 0.012 2 DIS 0.022PRO - 0.326CIP + 0.279RSK 0.002 3 ESQ 0.013CIP - 0.141PRO + 0.215RSK* + 0 .015NIS + 0.005DIS 0.041 4 SIS 0.21ESQ* + 0.078NIS
* - 0.003DIS 0.105
5 TEXP 0.514SIS* 0.284
χ2=1459, df=1048, p<0.000 CFI=0.94, RMSEA=0.034, CI = 0.029, 0.038, N= 347, ρ = 0.83, α = 0.84 Key: INT=Interest, PLE=Pleasure, SGN=Sign, CIP=Consumer Involvement Profile, RSK=Risk, PRO=Probability, ESQ=Ease of Search Qualities, SIS=Satisfaction with Information Search, TEXP=Tourist Experience, ATT=Attractions, EXP=Expediency, HSP=Hospitality, SFT=Safety, PRC=Prices, FDS=Foods, NIS=Number of Information Sources, DIS=Depth of Information Search, Asterisk * = Statistically significant relationship at p<=0.05.

120
As it could be seen in Table 5.18, of all the dimensions of CIP, exogenous factors,
only risk (RSK) appears to have a significant relationship with ease of assessing search
qualities (ESQ). However, such relationship explains only 4% of the total variance. A
number of information sources used (NIS) and ease of assessing search qualities (ESQ)
have significant positive relationships with satisfaction with information search (SIS), and
together, they explain a total of 10.5% of the variance in that relationship. Satisfaction with
information search (SIS) significantly relates positively with tourist experience (TEXP).
Fit indices of the structural model appear to be not too bad (χ2 = 1459, df = 1048,
p<0.000 CFI = 0.94, RMSEA = 0.034, CI = 0.029, 0.038, N = 347, ρ = 0.83, α = 0.84).
However, LM test suggests an addition of two more relationships for the model to be better
specified. The suggested relationships are a direct relationship from PLE to TEXP and a
direct relationship from PLE to SIS. These additional relationships were added, and the
whole structural model was re-run under the same set conditions as before. The results are
shown in Table 5.18.
Re-specification of the structural model appears to have brought in some changes
and improvements (Table 5.19). Specifically, previously significant relationships between
RSK and EQS as well as between NIS and EQS become insignificant; χ2 improved from
1459 to 1378.6; CFI went up from 0.94 to 0.95; RMSEA went down from 0.034 to 0.030;
composite reliability ρ went up from 0.84 to 0.88. It was therefore concluded to be the final
structural model. Reader’s attention is directed to observe the impact of newly added
relationships. An addition of CIP in equation 4 (Table 5.19) significantly improved the
total amount of explained variance from 10.5% to 23.4%. Surprisingly, the addition of PLE

121
in equation five didn’t have any effect in the total amount of explained variance even
though the relationship is statistically significant. Instead, it reduced the estimate that SIS
has on TEXP.
Table 5.19: Final structural model
S/N Dependent Variable Independent Variables R2
1 NIS 0.187CIP - 0.038PRO + 0.135RSK 0.013 2 DIS 0.753PRO - 1.195CIP - 1.271RSK 0.005 3 ESQ 0.958CIP - 0.498PRO + 0.986RSK + 0.058NIS + 0.005DIS 0.04 4 SIS 0 .390PLE* + 0.189ESQ* + 0.054NIS* + 0.001DIS 0.234 5 TEXP 0.237PLE* + 0.423SIS* 0.287
χ2=1378.6, df=1045, p<0.000 CFI=0.95, RMSEA=0.03, CI = 0.026, 0.035, N= 347, ρ = 0.88, α = 0.84
Key: INT=Interest, PLE=Pleasure, SGN=Sign, CIP=Consumer Involvement Profile, RSK=Risk, PRO=Probability, ESQ=Ease of Search Qualities, SIS=Satisfaction with Information Search, TEXP=Tourist Experience, ATT=Attractions, EXP=Expediency, HSP=Hospitality, SFT=Safety, PRC=Prices, FDS=Foods, NIS=Number of Information Sources, DIS=Depth of Information Search, Asterisk * = Statistically significant relationship at p<=0.05. 5.9. Hypotheses Testing
This research put forward a number of hypotheses as indicated in Chapter 2 and
Figure 2.2. From the result of the final structural model Table 5.18, a number of hypotheses
were rejected while a few failed to be rejected as indicated in Table 5.20
Table 5.20: Hypotheses testing S/N Hypotheses statements Relationship(s) Results H1a There is a statistically significant positive relationship between
tourist involvement and the breadth of information search. NIS ← CIP Not supported NIS ← RSK Not supported NIS ← PRO Not supported
H1b There is a statistically significant positive relationship between tourist involvement and the depth of information search.
DIS ← CIP Not supported DIS ← RSK Not supported DIS ← PRO Not supported
H2a The diversity of information search is statistically significantly related to ease of search quality.
ESQ← NIS Not supported
H2b The depth of information search is statistically significantly related to ease of search quality.
ESQ ← DIS Not supported
H3a The breadth of information search is positively related to information satisfaction.
SIS ← NIS Supported

122
H3b The depth of information search is positively related to information satisfaction.
SIS ← DIS Not supported
H3c Ease of search qualities is positively related to information satisfaction.
SIS ← ESQ Supported
H4 There is a significant positive relationship between satisfaction of information collected with destination satisfaction.
TEXP ← SIS Supported
Key: CIP=Consumer Involvement Profile, ESQ=Ease of Search Qualities, SIS=Satisfaction with Information Search, TEXP=Tourist Experience, NIS=Number of Information Sources, DIS=Depth of Information Search.
Figure 5.7 shows all hypothesized relationships and new suggested relationships
from LM test. Heavy solid arrowed lines indicate significant relationships; heavy dotted
lines are new suggested significant relationships and light lines are insignificant
relationships. Figure 5.8 shows only significant relationships of the conceptual model. The
observations show that all statistically significant relationships are positive. An increase in
ease of assessing search qualities of the destination experience, number of information
sources used and pleasure are likely to increase satisfaction with information search.
Similarly, satisfaction with information search and pleasure are proportionally related with
tourist experience, i.e. an increase in satisfaction with information search or pleasure is
likely to increase tourist experience.
Figure 5.7:Structural model showing significant, insignificant and suggested relationships

123
Figure 5.8:Reorganized structural model showing only significant relationships Key: INT=Interest, PLE=Pleasure, ESQ=Ease of Search Qualities, SIS=Satisfaction with Information Search, TEXP=Tourist Experience, NIS=Number of Information Sources. 5.10. Chapter Summary
This chapter presented inferential statistics and findings of the study. It began with
data screening in order to make it clean for advanced analyses. In this chapter, outliers were
identified, missingness of data was assessed, measurement models for different constructs
in the conceptual model were assessed and finally the structural model along with tests for
hypotheses. It appears that of all the five dimensions of the consumer involvement profile,
pleasure is significantly related to ease of search qualities of destination experience. It is
not the depth of information but the breadth of information that matters the most in
satisfaction of information search among international tourists to Tanzania. The
relationship between breadth of information search (NIS) and tourist experience (TEXP)
is fully mediated through satisfaction with information search (SIS) while pleasure (PLE)
is related with tourist experience (TEXP) both directly and indirectly through satisfaction
with information search (SIS). Hence a partially mediated relationship.

124
CHAPTER SIX
PRESENTATION OF INTERVIEW RESULTS
6.1. Introduction
This chapter presents the results of interviews that were conducted with a few
tourists after they completed the questionnaire. The interviews were relatively short and
were intended to explore the main sources of information that tourists used when planning
their trip to Tanzania, how reliable they consider those information sources and why. This
qualitative approach was deemed to be an important way of collecting extra information to
supplement and support quantitative results. Conveniently after filling out a questionnaire,
a tourist was politely asked if they were happy to be interviewed about the information
sources they used when planning their trip to Tanzania. A researcher reminded the tourists
that their participation in the interviews was voluntary and was asked to give their consent
for voice recording. A total of 21 tourists were interviewed for 10 – 15 minutes using an
interview checklist (Appendix B). All participants except one gave their consent for audio
recording. The tourist who was uncomfortable to be audio recorded the researcher had to
take notes when interviewing that participant. The interviews were conducted in English
and were thereafter transcribed. Transcriptions were then thematically coded, key themes
were identified, and they inform this chapter. The theme coding was done independently
by two individuals, the researcher and a Ph.D. candidate in the same department of Parks,
Recreation, and Tourism Management. After coding, the two versions of theme coding
were compared and they happened to very similar. Key themes were “type of information

125
sources used”, “information search process”, “reliability of preferred information sources”
and “the reasons for using multiple sources of information”. Theme-coding of the transcript
independently by two people was done so as to make sure there was consistency in
interpreting the transcript thus increasing the validity of the themes. From this analysis,
three main themes emerged i) preferred information sources (personal, neutral, and
marketer/commercial); ii) perception of reliability of information sources, and iii)
frequency of consulting the perceived reliable information sources. Interviewees were
given code names as presented on table 6.1.
Table 6.1: Interviewees’ code names Code Description AUSHT Australian resident on holiday trip BRAHT Brazilian resident on holiday trip CANHT Canadian resident on holiday trip CHNBHT Chinese resident on both business and holiday trip DANHT Danish resident on holiday trip EGBT Egyptian resident on business trip DUTHT Dutch resident on holiday trip RUSHT Russian resident on holiday trip NZHT New Zealand resident on holiday trip SAHT South African resident on holiday trip SABHT South African resident on both business and holiday trip UKHT British resident on holiday trip USHT American resident on holiday trip USBT American resident on business trip USVT American resident on volunteering trip USBHT American resident on both business and holiday trip USSAT American resident on study abroad trip

126
6.2. Preferred Information Sources
Tourist preference of information sources when planning their trips to Tanzania
varied from personal, neutral, and commercial. It was also revealed that tourists do not
stick on one information source but shop around across numerous sources of information.
It was obvious that personal information sources were mostly preferred of them all. Tourist
would first prefer to ask friends, relatives, and colleagues who had been to Tanzania before.
The questions that they ask these personal sources are key tourist attractions, personal
experiences, recommendations, logistic-related questions like booking processes and trip
organization. Asking recommendations from friends does help in narrowing down a list of
interests. Then a tourist would go online searching for these particular interests across
different platforms from search engines, blogs, destination or supplier websites,
guidebooks, wiki pages, and video search engines like YouTube.
At this point, a tourist is not looking for any detailed information about the
destination but tries to cross-validate the information from one source to another to see if
there is consistency in various aspects like quality of attractions, experiences, and value for
money. Below are some of the quotes from select interviewees.
“Sometimes I get a few suggestions, and I look further into it myself in online sites.
So, when I got a few suggestions for hotels in Zanzibar, I looked online on the
hotel's websites and see which one I liked the most. Friends or personal sources
are usually my first sources of information. The way I make final decisions, after
looking at the websites, is kind of my personal preferences… it depends on a
number of factors. I make decision based on my schedule, how much money it costs,
how much I am willing to spend on and what fits my preferences. I have had used
TripAdvisor on my first trip to Tanzania. I didn’t use TripAdvisor this time for

127
Tanzania because there are already few known hotels that most of the expatriates
like me and my co-workers have been using them for a while, so we keep coming to
the same hotels each time we come here.” (USBT1)
“Word of mouth plays a great role. Our friends came here on holidays and had
great times. When they came back home, they shared their experiences with us.
That’s the best way to sell something. If your friends tell you something, you trust
them. That is probably the biggest drive. But also, social media, TripAdvisor,
Holidaytrip, even Facebook, Instagram, I have visited so many of these pages by
doing so I am trying to corroborate information across different platforms and do
you know what? Everybody has a platform that works for them. When a business is
connected to the internet, tourists take pictures on mobile phones and immediately
share with their friends or followers across numerous social media platforms. The
power of WiFi and mobile phone is enormous it can make or break your business.
The Internet is a very powerful tool; it exposes your business. Someone can say a
good thing, and another person can say a disaster. It’s called globalization; the
world has become a very small place. In some ways, social media also acts as
quality control it puts pressure on suppliers to deliver the best, they can deliver to
make sure the people have a fantastic time.” (UKHT1)
“Mixed sources, my own search, talking to people, Airbnb, TripAdvisor,
LonelyPlanet, and Travel blogs, to find what is around to get ideas. Most of the
time when I get to the place, I talk to the locals to see what other people are saying.
I try to make my judgment where I should go based on all the information, I got
prior as well as what I am learning at the destination. So, it usually a combination
of everything for me at least. It is not about the depth of information but cross
checking if the information you get from source x is consistent across other
sources” (CANHT2)

128
“I searched online for hotels, Booking.com/expedia.com/trivago.com. Another way
of getting information is relying on official sources, and our official sources are
embassies [Egyptian embassy] in the country where I am going. If I need any kind
of information or if I feel this country is not safe and I will be arriving late I just
call the embassy and ask if there is someone who can pick me up from the airport
and take me to my hotel.” (EGBT1)
“Generally, I would google like ‘things to see’ or ‘things to do’ in the new city. I
as well usually ask a couple of my friends who had been to the city before for their
recommendations or opinions. I would ask friends for restaurants that I need to
visit, or things I would need to see, and I would keep some notes on my phone. And
then I would go online; I generally like to look on sites like TripAdvisor because
it’s kind of well-known site. But also, I try to find blogs; these are more of someone
own personal experience of doing something as opposed to just google search
engine. So, I usually kind of getting those perspectives, what TripAdvisor says and
what an individual says through their personal experiences. So that’s generally I
would do.” (DUTHT1)
6.3. Reliability of Information Sources
As seen in the previous section, tourists use numerous sources of information when
planning their holidays. The main reason for them using multiple information sources is to
corroborate information obtained in one source across a few more to see if there are any
significant discrepancies. Tourists look for information partly because they want to reduce
the risk of making poorly informed holiday decisions (Nelson, 1970). Tourists use a few
techniques to tell whether a source is reliable or not. When looking for information about
a certain destination, the majority of tourists would first try to find a personal source; it
could be a relative, friend, or a co-worker. Personal sources, which are essentially words-

129
of-mouth, are considered to be the most reliable sources of information (Hernández-
Méndez, Muñoz-Leiva, & Sánchez-Fernández, 2015). Tourists who were interviewed in
this study mentioned a number of reasons why they consider personal sources to be
reliable; the personal sources are close to them, they are either family members, friends,
relatives or co-workers, they have no strong reasons why they should not trust them. Some
of the personal sources are people who have traveling together in a number of holiday trips
they have known each other for long enough they know each other’s interests, so when
such a source recommends something, the recommendation is trusted and is taken. Below
are some of the quotes from a few interviewees:
“Yes, they had been here before me. I have been working with these friends for 12 years, and we have traveled a lot together, they know what my interests are what I like what I don’t like. So, if they tell me something, I trust them.” (SABHT2) “Talking to other volunteers and reading their blogs. They are reliable because it is their experiences you have to believe they are truthful but it doesn’t mean that you are going to experience exactly the same way.” (USVT1) “I think just based on their experience they came to Tanzania for the same reasons and for the same duration. So, I kind of trust the information from them and their recommendations. Even for my trip to Zanzibar, a US citizen who lives in Tanzania suggested a hotel, and I stayed there and was good. So, every time I follow directions it turns out well, I gave more trust from my co-workers that I can trust their suggestions on things to do and where to stay.” (USBT2) “I rely on my personal sources because they are my friends. And because I have no any reason not to trust them. I respect their opinions as I have a sense, I know who they are, I know what they are interested in, and I would be interested in the same types of things if we are looking for the same types of vacations. I usually take everyone’s opinions, but it doesn’t mean I am going to do everything just because they were recommended. Some may not fit in my itinerary or might be something I am not interested in. But if its someone I know generally like they are your friends,

130
I like them; I get along with them, I don’t see why I wouldn’t consider what they have to say.” (AUSHT1)
“He has been here for 12 years. He has a lot of experience. I believe what he says.
He is like local guide here. He knows where to travel and where to see the big five
and beautiful beaches here in Tanzania. So that’s why I trust him.” (CHNBHT1)
“Some of the information on the internet can be misleading if you are not used to
Africa. We are used to traveling in southern Africa we can tell the difference. I rely
more on what my friends are saying. My friends usually have video footage and
take photos. They traveled a lot with us; we had been together with them when we
went to Zimbabwe, Botswana. If they tell me something, I trust it.” (SAHT2)
“I kind of rely on his knowledge of the destination, I trust him, since we have been
traveling together for a long time now. And I know he is good at travel planning,
so I trust his recommendations.” (NZHT1)
“It’s not what they are saying; it’s from who it [is] coming from. If it’s the member
of the family, my brother, my sister, my mom, my dad and they are telling me
something I trust them. Or if its someone like my best friend, somebody whom I
have known them for years, somebody whom I went to school with, I trust them. So,
they are telling me something; it must be true. That carries so much weight than
when it’s a complete stranger. When a complete stranger comes to you and says
something how do you qualify it? You can’t, because you don’t know that person.
Is that person lying to me? Does he have an alternative motive behind what he
says? Is he saying what I want to hear not what I need to hear? You have to look
at the source of information. Where does the source come from? Whether you read
it online, whether it’s verbal word of mouth, whether its friend, families, or it’s a
complete stranger. Everybody automatically attaches different values to it.”
(UKHT1)

131
“I rely on and trust friends the most because they are my friends, they know me,
they know my culture, they know what I like as well as what is good for me. We
have a lot in common, so I would rather trust my friends.” (SAHT2)
However, some of the tourists rely on travel agents, and this is what they think about the
reliability of travel agents:
“I like using travel agents for logistics part of it. I use them for airport pick-ups,
day driving. They were very reliable and responsive. If they are responsive, I feel
like I can trust them more. If I have questions and they answer them quickly, it gives
me assurance that things will be as they are. And I will use them again and would
recommend them to other people as well.” (USHT2)
“Their purpose is to earn money, to get profit. So, in order for them to make money,
they have to satisfy their guests, you have to give them full honest information so
that you can get another customer. If a travel agent provides good services to a
customer, the customer will be satisfied and will share a positive experience and
recommend the agent to friends. So, I believe travel agents won’t have any motive
of providing false information as it will hurt their own business in a long run.”
(RUSHT1)
“I book my holiday through agents; you have to look through the history of tourism
business. Companies like Thomas Cook, they have been in the industry for the very
very long time. So, somebody back in London, back in the UK when they want to
book a holiday, they already know these agents because for the last 10 or 15 years
they have been going back to the same place. Every year I go to TUI, and I book
my holidays through TUI. These agents have their loyalty schemes which motivate
people to come back. They have a wide range of destinations, tour operators like
TUI or Thomas Cook do not come to one destination, they go all over the world.
So, if want to book a holiday, I contact my travel company, and I have the ability

132
to wherever I want to go. These big tour operators have access to so many different
destinations. Because these companies are worldwide companies.” (UKHT1)
Some of the tourists use multiple sources so as to validate information and sources:
“Blogs are uncorroborated; you form your own opinions after reading many blogs
then you decide, you summarize yourself. When you start seeing some of the things
that a blogger says do not fit with the rest of the information then you know the
blogger is unreliable and probably, he doesn’t know what he is talking about.”
(SAHT3)
“You have to read [blog posts] and see if they know what they are talking about or
not. We are pretty experienced travelers; we have traveled over the years. I had
been to like 80… 85 countries. We have a blog ourselves, so we can tell if the blog
is reliable or not.” (USHT3)
“It is difficult to tell about reliability, that’s why I use multiple sources cross-
referencing or validating if you like to see which sources are reliable. The other
reason why I use locals is to cross-check and see what locals are saying. If you find
something online and when you get here and ask locals, and they don’t know where
it is, then you know that is kind of dodgy. And also, that’s one of the reasons we
ask friends and relatives who have some knowledge about the destination, you trust
them, they can’t tell you something dodgy. So, I try to look multiple sources and see
if there is the consistency of information across various sources. Sometimes you
kind of making your own best judgment.” (CANHT2)
“I will regard social media information as reliable when that information is
accompanied with videos, pictures, and reviews from a neutral source. Even
bloggers, I will trust the information they post if is accompanied by images like
their group photos and videos while at that particular destination. I don’t consider

133
a review reliable from someone who has never visited the destination. I usually skip
those documents or information [that lack pictures or videos].” (CHNBHT1)
“Let me tell you; I am not relying on any kind of information 100%. Regardless
who the source is, I always have to validate the information in more than three
sources to see if there is any truth in it. But I would say personal sources are mostly
reliable than other sources. Often your personal sources are people who are close
to you, you have known each other for quite some time, you probably know each
other interests, and they don’t have any profit motive behind like commercial ads
that use celebrates. One advantage personal sources you can talk to them, ask
endless questions, you can see their body languages when you are talking. So, to
answer your question, I would say personal sources like word-of-mouth are the
most reliable” (DANHT1)
6.4. Frequency, Depth, and Satisfaction with Information
Regarding the frequency of use of information sources, participants in this study
admitted that there is no uniformity on how they frequently use information sources or
platforms. However, consultations to personal sources like family members or friends take
about one to two hours where the individuals would sit down or talk over the phone. In
such conversations, the information seeker would listen to the source’s experiences and
ask questions on various aspects as the conversation goes on. This helps the information
seeker to get a better understanding of the destination and assess their motivation whether
the destination is right for them or not. Such conversation usually helps the information
seeker to get an idea on where to start if they choose to validate the information in online
platforms or other forms of information sources.

134
Regarding depth of information search, there were two main takes away from the
interviews. Participants who come just for holiday or business trips that last less than three
weeks are less interested in the depth of information when planning their trips. One the
other hand, those who plan to stay for longer than three weeks for example volunteers or
study abroad programs are more interested in getting deeper richer information about
various aspects of the destination like attractions, weather, culture, foods, and safety to
mention a few. The depth of information is gained mainly from guidebooks, literature
textbooks and past volunteers who had been in the same or closely related locations. Other
relevant sources of information are blogs of previous volunteers, who used to post regularly
their experiences while in those places.
“I also look on the blogs people who had been in Peace Corp program, many
people write blog posts weekly or monthly about what they do in Tanzania. The
posts are often detailed and provide richer insights that the Peace Corp Manuals.
And the fact that people who posted are volunteers like me, they make sure future
volunteers are sufficiently informed of the locations before they arrive. So, I looked
at that. I also posted on Reddit and asked for someone who had been to Tanzania.
I talked to one girl who had been to Tanzania for about two hours and shared her
experiences. So, I got information about Tanzania mostly from Peace Corp but the
much richer information from other volunteers. I also bought LonelyPlanet
guidebook for Tanzania, I learned about opportunities on what to do in Tanzania.
In the book, you can see both popular and unpopular things. Like Ngozi lake in
Mbeya, you won’t see it on websites.” (USVT2)
“I was here for two weeks, I didn’t look into the depth of information about the
country but the little I knew about it I wanted to check with if it is consistent in other

135
sources like social media and internet. I knew I would get detailed information
about different attractions when I am here, asking the tour guides or managers. But
also, I bought a guidebook about Tanzania, and I was reading it on the plane. It
gave me more information about the attractions and culture.” (BRAHT1)
“I learned about Tanzania through the program called School for Field Studies
(SFS). I was interested in the field studies they had. They had openings in Costa
Rica and Tanzania. And thought I wouldn’t get a similar experience in Costa Rica
as in Tanzania. I believed it was going to be like a once in a lifetime experience, so
I decided to come to Tanzania…I talked to people who had to be in the program
before. I talked to my advisor about it. And the people whom I talked to in the
program they really liked it, so I thought it was a good fit… I would say of all the
sources of information that I used students’ information were most detailed and
reliable, I guess because their experience is first hand. The shared with me detailed
information like what the program was all about, what they experienced, they
helped me know what the program was going to be like.” (USSA1)
In general, participants reported that they felt sufficiently informed about the
destination and that made them decide to visit it. While the depth of knowledge varied
among them depending on the purpose of the trip (leisure, business or volunteering) length
of stay (less than three weeks vs. longer than three weeks), they all expressed being
satisfied with the amount of knowledge they had about the destination prior to them
arriving in Tanzania.
“I would say, yes, I was knowledgeable enough about the country to make an
informed decision. I think I knew what attractions are here like parks, wild animals,
the culture and beaches. I knew someone would pick me up from the airport to the
hotel. So, yes I made informed decision to come to this trip” (USHT1)

136
Participants’ expectations were met and for some were even exceeded. A few
reported minor discrepancies between information they got in planning the trip with their
actual experiences for example safety issues were found to be somewhat exaggerated.
Some (females) were told it is not allowed to wear pants like a pair of jeans in Tanzania;
they were surprised to see so many residents wearing them. Some volunteers also
mentioned that guidebooks handed to them by volunteer organizations lackied detail
information. Nevertheless, these tourists were satisfied with their travel experience in
Tanzania.
6.5. Chapter Summary
This chapter presented qualitative results from 21 interviewees that were conducted
in addition to having filled out questionnaires. Participants used numerous sources for
information when planning their trips to Tanzania: from personal sources (friends, family
members, previous volunteers, and co-workers), neutral sources (guidebooks, blogs, and
friends’ social media pages), and commercial ones (TV programs, Travel agents, and
suppliers’ websites). Personal sources are perceived to be the most reliable. It is very
common among participants to validate information from one source across other sources.
When a piece of information from one source is found to be consistent across numerous
sources is considered valid, and the source gains reliability. Participants were satisfied with
information about the destination prior to their trips and felt were knowledgeable enough
to make informed travel decisions. While there were minor discrepancies in the information
received when planning the trips with their actual experience while at the destination,
overall tourists’ expectations were met and exceeded.

137
CHAPTER SEVEN
CONCLUSIONS AND IMPLICATIONS
7.1. Chapter Introduction
This chapter presents conclusions and implications of the study. Key conclusions
of the results are presented first the theoretical and practical implications as well as
limitations and future avenues are presented in the last section.
7.2. Review of the Findings and Conclusions
The overall goal of this study among other objectives, seeks to understand tourist-
preferred information sources and information search behavior for tourists who visit
Tanzania. It uses consumer (tourist) involvement as an antecedent construct that motivate
and influence search for information. Using the theory of economics of information
(Stigler, 1961), this study used satisfaction with information sources and tourist satisfaction
as outcome constructs. Tourist satisfaction is represented by the construct of tourist
experience (Heung & Quf, 2000). It also sought to uncover the reasons behind preferences
for information sources among these tourists.
Specifically, this project sought to answer the following questions:
i. Which information sources are mostly preferred by international tourists who visit
Tanzania and why?

138
ii. How does consumer involvement as an antecedent construct influence preference in
information sources and types of information search among international tourists
who visit Tanzania?
iii. How does breadth, and depth of information search relate to ease of evaluating
search qualities?
iv. How does ease of evaluating search qualities, breadth, and depth of information
search relate to satisfaction in collected information?
v. How does satisfaction with collected information relate to destination satisfaction?
The following sections present review of the findings and conclusions of each objective.
7.3. Which information sources are mostly preferred by international tourists
who visit Tanzania and why?
Personal sources of information are mostly preferred by tourists who visit Tanzania.
Personal sources of information scored the highest among information sources used by
tourists (Table 4.16). A previous study by Duhan et al., (1997) found similar results.
Personal sources in most cases are friends, family members or co-workers. Often times
such sources are close to the information seeker and relate in numerous ways like overlap
of interests, culture and professional/career dimensions. Tanzania is largely considered a
long-haul and probably a peripheral destination (Albrecht, 2010; Moscardo, 2005; Stuart,
Pearce, & Weaver, 2005) when looking at the key international markets it depends on
(Table 4.3). It is also considered an exotic destination by the majority of international
tourists who reside outside Africa. When these characteristics (long-haul, peripheral, and
139
exotic) combined together, it makes sense for tourists to rely more on personal sources of
information. In this study, tourists used personal information sources to get highlights of
tourist attractions, hear from people who have visited the destination before of their own
experiences and also narrow down the number of options, attractions or activities to be
engaged in on their arrival at the destination.
“Sometimes I get a few suggestions and I look further into it myself in online
sites. So, when I got a few suggestions for hotels in Zanzibar I looked online on the
hotels websites and see which one I liked the most. Friends or personal sources are
usually my first sources of information.” (USBT1)
“I ask a couple of my friends who had been to the city before for their
recommendations or opinions. I would ask friends for restaurants that I need to
visit, or things I would need to see, and I would keep some notes on my phone. And
then I would go online, I generally like to look on sites like TripAdvisor because
it’s kind of well-known site.” (DUTHT1)
One of the reasons why personal sources are the most preferred information sources
is because they are also considered to be most reliable (Table 4.17). Tourists to Tanzania
relied the most on personal information sources when planning their trips. Personal sources
were found to convey the actual experience at the destination. Such sources provide an
opportunity for the information seeker to ask more follow up question especially if it
involves verbal conversations.
“Word of mouth plays a great role… If your friends tell you something you trust
them…It’s not what they are saying, it’s from who it [is] coming from. If it’s the
member of the family, my brother, my sister, my mom, my dad and they are telling
me something I trust them. Or if its someone like my best friend, somebody who I

140
have known them for years, somebody who I went to school with, I trust them. So,
they are telling me something, it must be true. That carries so much weight than
when it’s a complete stranger” (UKHT1).
“I rely more on what my friends are saying. My friends usually have video footage
and take photos. They travelled a lot with us, we had been together with them when
we went to Zimbabwe, Botswana. If they tell me something, I trust it...” (SAHT2).
“I rely on my personal sources because they are my friends. And because I have no
any reason not to trust them. I respect their opinions as I have a sense, I know who
they are, I know what they are interested in and I would be interested in the same
types of things if we are looking for the same types of vacations…if its someone I
know… like they are your friends, I like them, I get along with them, I don’t see why
I wouldn’t consider what they have to say.” (AUSHT1)
Similar results have been found in previous studies (Smith, 2000; Zeithaml, 1981).
Unlike commercial sources, personal sources are generally considered to have no profit
motive behind when sharing their experiences.
7.4. How does consumer involvement as an antecedent construct influence
preference in information sources and types of information search?
Consumer involvement as an antecedent construct in this study was unexpectedly
observed not to have significant effect on the aggregated variable that represents number
of information sources used which intended to measure the breadth of information search.
Consumer involvement as defined by (Zaichkowsky, 1986) a state of arousal or motivation
was thought to be appropriate motivational construct for information search. Two
hypotheses (H1a & H1b) were developed to test the relationships. The relationships

141
between consumer involvement with breadth (number) and depth (frequency) of
information search were found to be not statistically significant at the confidence level of
95% (p<= 0.05) (Table 5.19). Instead a lower order dimension of pleasure in the construct
of consumer involvement is found to be directly significantly related to satisfaction with
information search and tourist experience (Figure 5.6). These results echo those found in
(Carneiro & Crompton, 2010) which also found no significant relationship between the
involvement with information search among tourists to two visited national parks in
Portugal. While a study by Goldsmith & Litvin, (1999) using personal involvement scale
developed by Zaichkowsky, (1986) and focusing on only tourists who use travel agents
found significant positive relationship between involvement and information search. It
appears that there are mixed results when using involvement as antecedent construct in
information search, Kim, Scott, & Crompton, (1997) found positive relationship between
involvement and information when using a involvement scale developed by Zaichkowsky,
(1986), however there were no significant relationship when using the multi-dimensional
involvement scale developed by Laurent & Kapferer, (1985), only two dimensions of
importance (interest) and pleasure were found to be marginally significant.
A few explanations might be possible in the context of this study i) Weak power to
detect effect sizes, larger samples might reveal different results; ii) The use of higher order
consumer involvement construct was not appropriate, lower order at dimensional level
might lead into different results; iii) Aggregating nine information sources into single
variable might have resulted into weaker relationships among individual information
sources with the higher order construct of consumer involvement and/or with individual

142
dimensions of consumer involvement. Letting the individual information sources to freely
relate with consumer involvement might also reveal different results; iv) Analyzing data
based on different subgroups of sample like gender, main purpose of trip, length of stay,
expenditure, and country of residence may show different results; v) The choice of
consumer involvement scale developed by Laurent & Kapferer, (1985) as antecedent
construct was not appropriate for this context. The use of personal involvement scale
developed by Zaichkowsky, (1986) or traditional tourist motivation construct might have
revealed different results.
7.5. How does the breadth and depth of information search relate to ease of
search qualities?
It was initially argued that the breadth and depth of information search would
improve the destination knowledge of a potential tourist. Such improvement of knowledge
would have a significant relationship with ease of evaluating touristic experience of the
destination prior to actually visit it. In other words, a potential tourist with improved
knowledge of the destination would find it easier to evaluate the quality of destination
experience through searching prior to them actually visiting it. Two hypotheses H2a and
H2b were developed in order to test the relationships. Contrary to how it was initially
argued, both of the hypotheses tested negative (Table 5.19). The main explanation might
be similar to previous section that an aggregated variable of information sources may have
resulted into weakened relationship or effect size in comparison to just letting the
individual information sources to freely relate to ease of evaluating search qualities.

143
7.6. How does ease of evaluating search qualities, breadth, and depth of
information search relate to satisfaction with collected information?
Satisfaction with information search was argued to be the immediate benefit of
investment one makes in information search in line with the theory of economics of
information (Stigler, 1961). Such satisfaction with information search would be a pre-
requisite for someone feeling they are knowledgeable enough to make informed decision
of whether to go visit the destination or not. It is an immediate benefit one realizes after
investing in information search. According to the theory of economics of information, a
higher investment in information search should results in higher satisfaction rates. In other
words, the breadth and depth of information search should be positively related with the
satisfaction with information search. The relationships were tested using hypotheses H3a
and H3b. The results show that the breadth of information search (measured by the number
of information sources – H3a) is significantly related to satisfaction with information
search (Table 5.19). This partly supports the theory of economics of information (Stigler,
1961).
Contrary to breadth of information search, the depth of information search (H3b)
measured by the frequency of use an information source was found to be not significantly
related to satisfaction with information search (Table 19). While this is somewhat
surprising but it is partly supported by the qualitative data. Tourists who were interviewed
mentioned that they use multiple information sources to cross validate information gained
from one source across other sources.
144
“Let me tell you, I am not relying on any kind of information 100%.
Regardless who the source is, I always have to validate the information in more
than three sources to see if there is any truth in it.” (DANHT1).
It also appears that tourists who come for short holiday are less likely to be
interested in the depth of information regarding the destination. The most important for
this kind of tourists is how reliable and valid the information is. This means a typical
potential safari tourist who plans an average of two weeks holiday, would just search for
information enough to ignite an interest for a destination and sufficient to motivate them
to validate the information across a few more sources, less interested in the details.
However, those who visit the destination for relatively longer period like volunteers are the
ones who are more interested in the depth of information and the right place to get deeper
information about the destination is from literature books and some guidebooks. However,
this group of tourists is very small 9.3% (Table 4.4) to have significant influence in
statistical analyses.
7.7. How does satisfaction with collected information relate to destination
satisfaction?
It was initially argued that, a well-informed potential tourist will have a possession
of right knowledge about the destination. Such person would have significantly invested in
information search both depth-wise and breadth-wise. According to the expectancy
disconfirmation theory (Cardozo, 1965) such knowledge should shape tourist expectations
about destination experience prior to them visiting the destination as closely as possible to
the actual experience, thus satisfaction (Lankton et al., 2016; Zehrer et al., 2011). Based on

145
expectancy disconfirmation theory, overall satisfaction is expressed when tourist
expectations match tourist experience. This study, therefore, used tourist experience which
was evaluated against tourist expectations as a measure of tourist satisfaction with the
destination. This leads to the final hypothesis (H4) that a correctly informed tourist will, in
the end, realize satisfaction with the destination as their expectations will not be far off the
actual experience at the destination.
7.8. Theoretical Implications
This is one of the few if not first study that applied the economics of information theory
at destination level. Previous studies (Evans & Wurster, 1997; Gursoy, 2001; McCall,
1970; Stiglitz, 2000; Urbany, 1986) focused on a business level but didn’t take a specific
destination approach. Findings of this study partly support the proposition (v) of the theory
of economics of information that states “the more spent on the purchase and the larger the
quantity of purchase, the greater will be the return from the search”. The more a tourist
invest in search for information across many information sources the more they find correct
and reliable information about the destination and likely she/he will be satisfied when they
visit the destination. This is because when searching across many information sources the
tourist will be able to identify which information is valid i.e. consistent and which one is
not. Getting correct information about touristic experiences offered at the destination
shapes realistic tourist expectations. When tourist expectations are realistic the gap
between expectations and actual experience is significantly minimized and thus according
to the theory of expectancy disconfirmation (Cardozo, 1965; Qazi et al., 2017; Van Ryzin,
2013) satisfaction will be realized.

146
However, investing in finding deeper information in one source does not shape
realistic tourist expectations about the experiences offered at the destination. This makes
sense as if a tourist relies on a source that provide incorrect information about the
destination will result in ill-expectations and consequently the mismatch between
expectations and actual experience will be big and most likely a negative one. Correct and
reliable information is the one that is consistent across multiple sources not the detailed
one from only one or two sources.
7.9. Implication for Destination Marketing
This study has a few implications for destination managers including marketers.
Satisfied tourists are those who use multiple information sources. Providing reliable
information across a number of information outlets helps potential tourists in finding
consistency of information and thus improve trust and reliability on the content of the
destination information. Destination managers need to identify information outlets and
supply them with reliable information that realistically portrays the experiences offered by
the destination. Understanding that private sector also does destination marketing, it is
important for destination management organization (DMO) to regularly audit the content
across different outlets to make sure that the destination contents in these information
outlets reflect the actual experience at the destination.
7.10. Limitations of the Study and Future Research
This study was conducted in Tanzania, a largely safari destination. Therefore,
generalization of the findings is limited even though some are similar to other studies in

147
different contexts. The use of English language, excluded many tourists from non-English
speaking countries from participation, one would therefore say the study is limited to
English speaking tourists. This study was conducted in May, towards the end of low season
in Tanzania (Tourism Division, 2016b). Conducting research during this time of the year
might have limited participant audience to only those few who were able to visit the
destination at low season. It should be remembered that the tourism industry in Tanzania
is heavily dependent on international markets especially those in the northern hemisphere,
Europe, North America, Middle East and Asia. In the majority of these countries, holiday
seasons start in June. So, conducting this study in May might have potentially missed out
many participants.
Future research avenues could include i) Use of different antecedent constructs
instead of involvement; ii) Different segments of tourists behave and consume differently,
so would be interesting to segment tourists into regions where they reside, gender, age,
education, and income to see if findings will be different from these in this study; iii)
Conducting similar study in high season with large sample would also be something to be
consider in the future research; iv) Adding constructs of perceived destination image and
behavioral intention along with overall satisfaction would also be another research avenue.

148
APPENDICES

149
APPENDIX A
SURVEY USED IN PILOT STUDY
Survey Flow
Introduction to the survey Group Number Airline Departure Airport Country of origin Repeat visit Travel experience Trip characteristics Consumer Involvement Profile (CIP) Sources of information considered reliable Search qualities Satisfaction with information search Tourist Experience Destination image Additional demographic information Education level Occupation Income Age
Page Break

150
Start of Block: Default Question Block Q1 Dear participant, my name is Peter Mkumbo, I am a Ph.D. Candidate in the Department of Parks, Recreation and Tourism Management at Clemson University, United States of America. As part of the requirements of the Ph.D. program, I am conducting a thesis project to understand information sources used by tourists who visit Tanzania along with you, and satisfaction. A committee of five professors is supervising this project. Prof. Ken Backman and Prof. Sheila Backman are Co-chairing the committee. We are inviting you to participate in this survey. It is your choice to participate in this survey; you are free to decline at any point. There are no risks or discomforts to you that may be caused by this research study. The information you provide will help in finding practical solutions on how to improve management and marketing strategies for why and how travelers choose destination Tanzania. Your individual answers will not be disclosed. They will be combined with those of other respondents to guide us in the analysis process. Thank you in advance for your cooperation. Your opinions are very important to us. Peter J. MKUMBO Ph.D. Candidate - Clemson University, SC. USA If you have questions or concerns regarding this survey please contact me at Clemson University Department of Parks, Recreation and Tourism Management 270 Lehotsky Hall, 29634 Clemson, SC, USA +1-864-650 -8439 (US) +255 675 416 614 (Tanzania) [email protected] OR my supervisors Prof. Ken Backman [email protected] Prof. Sheila Backman [email protected]
End of Block: Default Question Block
Start of Block: Group Number

151
Q2 Group # ________________________________________________________________
End of Block: Group Number
Start of Block: Airline Q3 Kindly enter the name of the airline you are flying with from this airport today
________________________________________________________________ End of Block: Airline
Start of Block: Departure Airport Q4 Airport of Departure from Tanzania today is
o Kilimanjaro International Airport (KIA) (1)
o Dar es Salaam International Airport (JNIA) (2)
o Zanzibar International Airport (3) End of Block: Departure Airport
Start of Block: Country of origin Q5 Could you tell us where are you from?
o Country name you permanently reside (1) ________________________________________________
o State (2) ________________________________________________
o Province (3) ________________________________________________
o Region (4) ________________________________________________
o Name of the city you live in (5) ________________________________________________
o Zip /Postal Code (6) ________________________________________________ End of Block: Country of origin
Start of Block: Repeat visit Q6 Have you ever visited Tanzania before?
o Yes, I have visited the country before (Please say how many times) (1) ________________________________________________
o No, this is my first visit to Tanzania (2) End of Block: Repeat visit
Start of Block: Travel experience
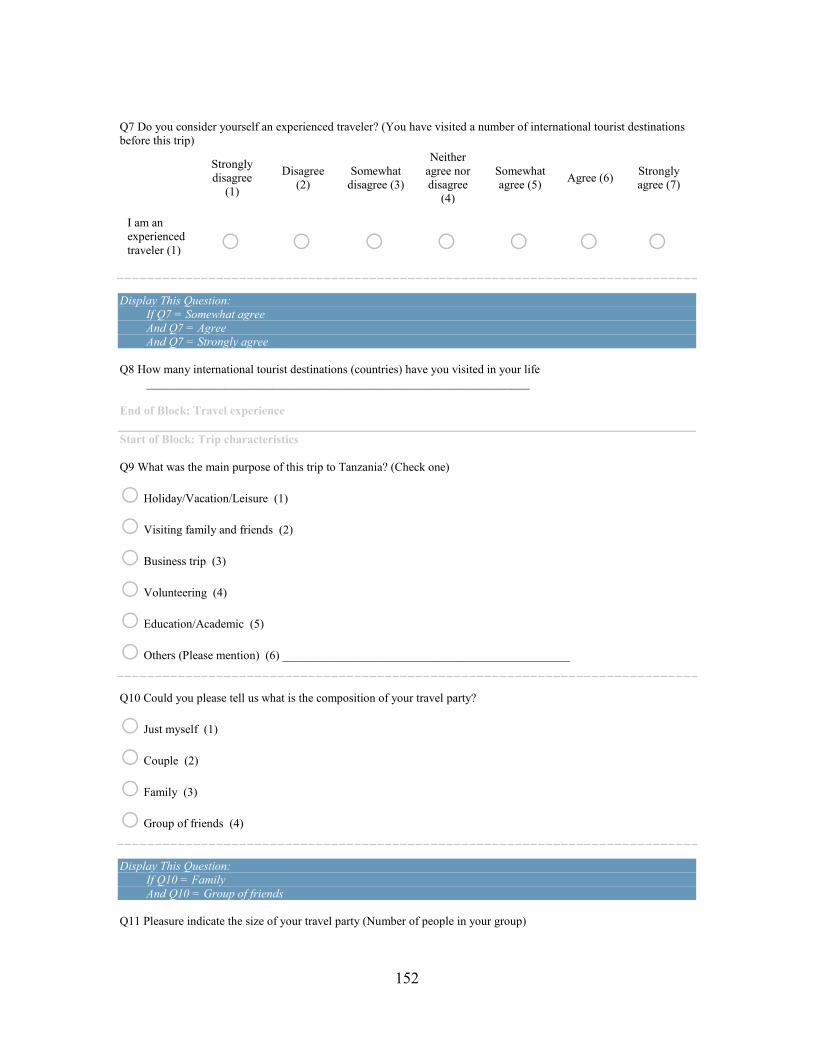
152
Q7 Do you consider yourself an experienced traveler? (You have visited a number of international tourist destinations before this trip)
Strongly disagree
(1)
Disagree (2)
Somewhat disagree (3)
Neither agree nor disagree
(4)
Somewhat agree (5) Agree (6) Strongly
agree (7)
I am an experienced traveler (1) o o o o o o o
Display This Question:
If Q7 = Somewhat agree And Q7 = Agree And Q7 = Strongly agree
Q8 How many international tourist destinations (countries) have you visited in your life
________________________________________________________________ End of Block: Travel experience
Start of Block: Trip characteristics Q9 What was the main purpose of this trip to Tanzania? (Check one)
o Holiday/Vacation/Leisure (1)
o Visiting family and friends (2)
o Business trip (3)
o Volunteering (4)
o Education/Academic (5)
o Others (Please mention) (6) ________________________________________________ Q10 Could you please tell us what is the composition of your travel party?
o Just myself (1)
o Couple (2)
o Family (3)
o Group of friends (4) Display This Question:
If Q10 = Family And Q10 = Group of friends
Q11 Pleasure indicate the size of your travel party (Number of people in your group)

153
________________________________________________________________ Q12 Was this trip a group tour?
o Yes (1)
o No (2) Q13 Could you tell us what was/is your role in the group with regard to planning and management of this trip? (Check all that apply)
▢ Help in searching for destination (Tanzania) information (1)
▢ Help in booking of different facilities/tours/events (2)
▢ I am the one who selected Tanzania as the destination of the trip (3)
▢ Other (please state) (4) ________________________________________________ Q14 Kindly please tell us about:
o Length of stay (number of nights) in this trip to Tanzania (1) ________________________________________________
o Number of national parks/game/marine parks visited (2) ________________________________________________
o Individual average expenditure per day in US$ (please EXCLUDE international flights) (3) ________________________________________________
o Group (travel party) total expenditure per day in US$ if you are party of the travel party (please EXCLUDE international flights) (4) ________________________________________________
Q15 How was this trip/holiday organized?
o I organized everything by myself/ourselves (independent) (1)
o We as a travel party organized everything by ourselves (2)
o An agent/representative organized everything for me/us (package tour) (3)
o I/we organized part of the trip and the other part was organized by agent/representative (Semi packaged tour) (4) End of Block: Trip characteristics Start of Block: Consumer Involvement Profile (CIP) Q21 We would also like to know how you disagree/agree with the following statements

154
Strongly disagree
(1)
Disagree (2)
Somewhat disagree
(3)
Neither agree nor
disagree (4)
Somewhat agree (5) Agree (6) Strongly
agree (7)
The destination I visit is extremely important to me (1) o o o o o o o I'm very interested in visiting tourist destinations like Tanzania (2) o o o o o o o I care very much about visiting tourist destinations like Tanzania (3) o o o o o o o I really enjoy visiting tourist destinations like Tanzania (4) o o o o o o o Whenever I visit tourist destinations like Tanzania, it's like giving myself a present (5) o o o o o o o To me, is quite a pleasure visiting tourist destinations like Tanzania (6) o o o o o o o You can tell a lot about a person from the tourist destinations they visit (7) o o o o o o o The tourist destination a person visits, says something about who they are (8) o o o o o o o The tourist destination I visit reflects the sort of person I am (9) o o o o o o o I get annoyed very much if I make a mistake visiting a tourist destination, not of my interest (10) o o o o o o o I get irritated to visit a tourist destination which isn't right (11) o o o o o o o I get upset with myself if it turned out I'd made the wrong choice when selecting a tourist destination to visit (12) o o o o o o o When I'm considering a tourist destination to visit, I always feel rather unsure about what to pick (13) o o o o o o o When you book a tourist destination, you can never be quite sure it was the right choice or not (14) o o o o o o o Choosing a tourist destination to visit is rather difficult (15) o o o o o o o

155
When you book a tourist destination to visit, you can never be quite certain about your choice (16) o o o o o o o I would be unhappy if it happens I have unknowingly chosen a destination that isn't of my interest (17) o o o o o o o
End of Block: CIP Start of Block: Sources of information considered more reliable when planning a trip Q22 When planning this trip, how reliable did you consider the following information sources?
Strongly
unreliable (1)
Unreliable (2)
Somewhat unreliable
(3)
Neither reliable nor
unreliable (4)
Somewhat reliable
(5)
Reliable (6)
Strongly reliable
(7)
Getting information from friends who are relatively well knowledgeable about Tanzania. (1)
o o o o o o o Getting information from family members who are relatively well knowledgeable about Tanzania (2)
o o o o o o o From relatives (not family members) who are relatively well knowledgeable about Tanzania (3)
o o o o o o o Getting information from travel agents (4) o o o o o o o Getting information from TV (5) o o o o o o o Getting information from the radio (6) o o o o o o o Getting information from an article in magazine articles(7) o o o o o o o Information from travel bloggers (8) o o o o o o o Getting information from travel guidebooks (9) o o o o o o o
End of Block: Sources of information considered more reliable when planning a trip
Start of Block: Frequency of use of information sources Q23 [This question will include only information sources in Q22 that will be scored “Somewhat reliable” and above] How often did you use these information sources before you paid for your trip to Tanzania?

156
Once a month
Twice a month
Three times a month
Once a week Twice a week
Three times a week
More than 3 times a week
o o o o o o o End of Block: Frequency of use of information sources
Start of Block: Satisfaction with Information search 25 How do you disagree/agree with the following statements regarding your satisfaction with the information you got about Tanzania before you paid for your trip here?
Strongly disagree
(1)
Disagree (2)
Somewhat disagree
(3)
Neither agree nor
disagree (4)
Somewhat agree (5)
Agree (6)
Strongly agree (7)
Getting information about Tanzania and its tourist attraction was a wise decision (1)
o o o o o o o I was satisfied with my information search about Tanzania and its tourist attractions (2)
o o o o o o o If I had to do it all over again, I would seek information in the same manner that I did (3)
o o o o o o o I was pleased with my search for information about Tanzania and its tourist attractions (4)
o o o o o o o The information I collected about Tanzania and its tourist attractions made me feel knowledgeable about the country (5)
o o o o o o o The information I collected about Tanzania and its tourist attractions helped me to make an informed decision about visiting the country (6)
o o o o o o o I am happy for what I did in getting information about Tanzania and its tourist attractions(7)
o o o o o o o End of Block: Satisfaction with Information search
Q26 Now that you have visited Tanzania and you are about to fly back, how would you assess your expectations based on your actual travel experience in Tanzania?
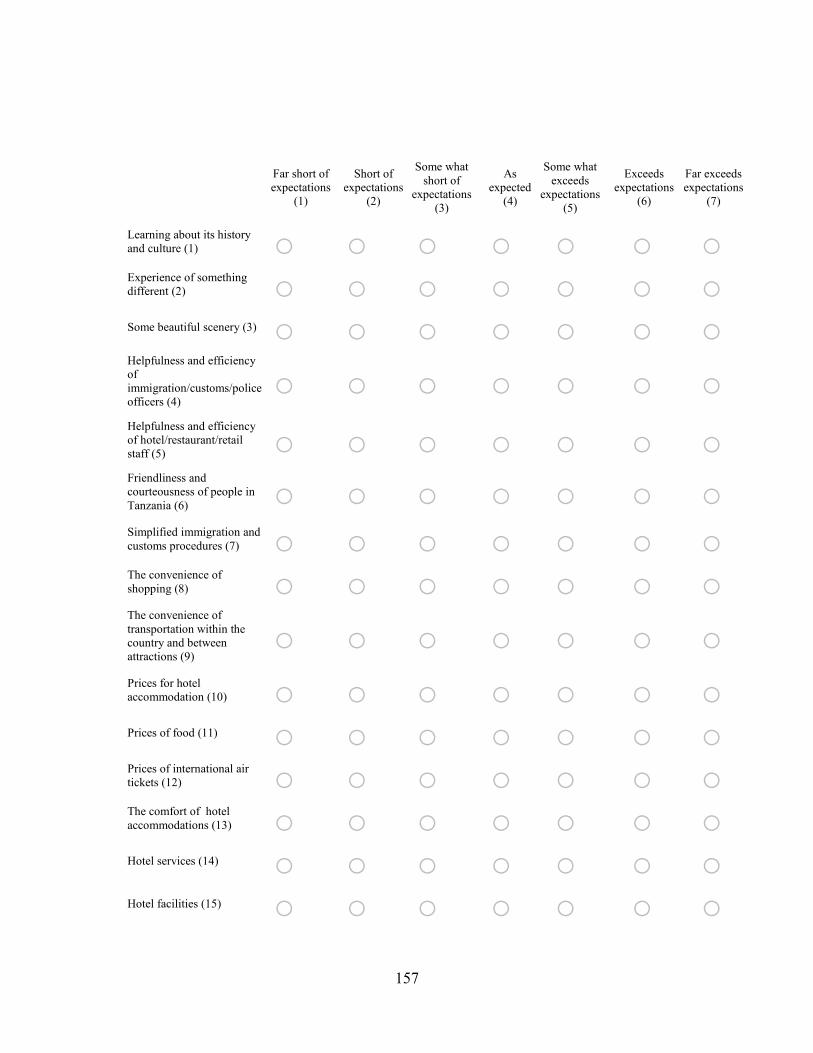
157
Far short of expectations
(1)
Short of expectations
(2)
Some what short of
expectations (3)
As expected
(4)
Some what exceeds
expectations (5)
Exceeds expectations
(6)
Far exceeds expectations
(7)
Learning about its history and culture (1) o o o o o o o Experience of something different (2) o o o o o o o Some beautiful scenery (3) o o o o o o o Helpfulness and efficiency of immigration/customs/police officers (4)
o o o o o o o Helpfulness and efficiency of hotel/restaurant/retail staff (5) o o o o o o o Friendliness and courteousness of people in Tanzania (6) o o o o o o o Simplified immigration and customs procedures (7) o o o o o o o The convenience of shopping (8) o o o o o o o The convenience of transportation within the country and between attractions (9)
o o o o o o o Prices for hotel accommodation (10) o o o o o o o Prices of food (11) o o o o o o o Prices of international air tickets (12) o o o o o o o The comfort of hotel accommodations (13) o o o o o o o Hotel services (14) o o o o o o o Hotel facilities (15) o o o o o o o

158
Variety of food (16) o o o o o o o Quality of food (17) o o o o o o o The attractiveness of natural and scenic landscapes (18) o o o o o o o Climate and weather (19) o o o o o o o Safety and peacefulness (20) o o o o o o o The diversity of wildlife (21) o o o o o o o
End of Block: Perceived Experience Start of Block: Destination description in one word Q27 In one word how would you describe your experience in Tanzania? _________________________________________________ End of Block: Destination description in one word
Start of Block: Destination experience Q28 In one word, how would you describe a tourist destination Tanzania? _________________________________________________ Q29 If you are to re-visit Tanzania in the future, what would be the main motivator OR reason? ________________________________________________________________ End of Block: Reason for a repeat visit Start of Block: Additional demographic information Q38 Which of the following best describes your gender
o Male (1)
o Female (2)
o Prefer not to say (3) End of Block: Additional demographic information
Start of Block: Education level Q39 Which of the following best describes your education level?
o High school (1)
o College level (Not university) (2)
o University first degree (3)

159
o Above first degree (Masters, MD, and Ph.D.) (4) Q40 Which of the following best describes your occupation status
o University student (1)
o Tourism and Hospitality related job (2)
o Government employee (3)
o Private sector employee (4)
o Retired (5)
o Professional (6)
o Other (please mention) (7) ________________________________________________ End of Block: Occupation
Start of Block: Income Q41 Could you indicate what is your annual income range in US$
o less than $30000 (1)
o $30000 - 49999 (2)
o $50000 - 69999 (3)
o $70000 - 89999 (4)
o $90000 or more (5) End of Block: Income
Start of Block: Age Q42 Which of the following best describe your age group
o 18 - 21 (1)
o 22 - 25 (2)
o 26 - 35 (3)
o 36 - 45 (4)
o 46 - 55 (5)
o 56 - 65 (6)
o Above 65 (7) End of Block: Age

160
APPENDIX B
PILOT AND FINAL CHECKLIST FOR INTERVIEWS
Dear participant, I appreciate you filling out our survey and agreeing to be interviewed. This interview is part of the same research project. It is expected to take a maximum of 15minutes. As I mentioned in the survey, you are not required in any way to participate in this interview, you are free to stop at any time if you change your mind. I do not know of any risks or discomforts to you that may be caused by this interview. The information you provide will be combined with those collected using survey in an anonymous way. You do not need to mention your name in this interview. Thank you in advance for your cooperation. Your pinions are very important to my project and studies. If you have questions or concerns regarding this interview, please contact me at Peter J. MKUMBO Clemson University Department of Parks, Recreation and Tourism Management 270 Lehotsky Hall, 29634 Clemson, SC, USA +1-864-650 -8439 (US) [email protected] OR my supervisors Prof. Ken Backman [email protected] Prof. Sheila Backman [email protected] Interview questions 1. First, I would like to learn where are you from and who are you traveling with? 2. What is the purpose of this trip to Tanzania? 3. How did you get information or learn about Tanzania and its tourist attractions? 4. How often do you use the information sources you just mentioned? 5. Why do you relay on the information sources you mentioned? 6. How ease/difficulty was for you to evaluate the quality of touristic experience in Tanzania using
the information you searched? 7. How satisfied were you with the information you got about Tanzania and its attractions? 8. How did your actual experience relate to your expectation, do you feel your expectations have
been met? 9. How would you describe your experience and satisfaction with Tanzania 10. What did you like the most about your visit to Tanzania? And what did you like the least about
your visit to Tanzania? 11. How likely are you to recommend destination Tanzania as a travel destination for friends and
relatives? why?

161
APPENDIX C
MEASUREMENT MODELS FROM PILOT STUDY
Measurement model for consumer involvement profile form pilot test. Dimension Item Loadin
g Reliability
Interest
i. The destination I visit is extremely important to me 0.64
α = 0.80 ρ = 0.94
ii. I'm really very interested in visiting tourist destinations like Tanzania
0.97
iii. I couldn't care less about visiting tourist destinations like Tanzania
-0.13*
Pleasure
iv. I really enjoy visiting tourist destinations like Tanzania 0.73
α = 0.84 ρ = 0.85
v. Whenever I visit tourist destinations like Tanzania, it's like giving myself a present
0.78
vi. To me, is quite a pleasure visiting tourist destinations like Tanzania
0.87
Sign
vii. You can tell a lot about a person from the tourist destinations they visit
0.82
α = 0.91 ρ = 0.94 viii. The tourist destination a person visits, says something about
who they are 0.96
ix. The tourist destination I visit reflects the sort of person I am 0.86
Risk
x. It doesn't matter too much if one makes a mistake visiting a tourist destination, not of their interest
-0.22*
α = 0.67 ρ = 0.98
xi. It is very irritating to visit a tourist destination, which is not right
1.00
xii. I should be annoyed with myself if it turned out I'd made the wrong choice when selecting a tourist destination to visit
0.35
Probability
xiii. When I am considering a tourist destination to visit, I always feel rather unsure about what to pick
0.75
α = 0.90 ρ = 0.91
xiv. When you book a tourist destination, you can never be quite sure it was the right choice or not
0.87
xv. Choosing a tourist destination to visit is rather difficult 0.81 xvi. When you book a tourist destination to visit, you can never be quite certain about your choice
0.88
*Items iii and x were discarded when calculating reliability due to poor loadings Second order CFA, χ2=91.4; P=0.06; CFI=0.97; RMSEA=0.05
Measurement model for tourist perception from the pilot test
Dimension Item# Item label Loading Reliability
Scenic attractions
ii Experience something different 0.65 α = 0.73 ρ = 0.74 iii Enable me to see some beautiful scenery 0.70
xviii Attractive natural and scenic landscapes 0.72
Expediency iv Helpful and efficient immigration/customs/police officers 0.63 α = 0.61 ρ = 0.62 vii Simple immigration and customs procedures 0.70
Safety vi Friendliness and courteousness of Tanzanians 0.76 α = 0.75

162
xix Enjoyable climate and weather 0.52 ρ = 0.78 xx Peace and safety of the country 0.81
Foods xvi Experience great variety of food 0.75 α = 0.81 ρ = 0.84 xvii Satisfaction in the quality of foods 0.89
Prices x Reasonable prices of hotel accommodation 0.86 α = 0.83 ρ = 0.83 xi Reasonable prices of food 0.82
Hospitality xiii Comfort in hotel accommodations 0.78 α = 0.90
ρ = 0.91 xiv Satisfaction in hotel services 0.91 xv Satisfaction in hotel facilities 0.90
Items i, v, viii, ix and xii were found to be unreliable items, so were dropped out Second order CFA, χ2= 89.97; P= 0.06; CFI= 0.97; RMSEA= 0.05

163
APPENDIX D
FINAL QUESTIONNAIRE
Introduction of the questionnaire Group Number Airline Departure Airport Country of origin Repeat visit Travel experience Trip characteristics Consumer Involvement Profile (CIP) Sources of Information Used Sources of Information considered reliable Frequency of Use Information Sources Search qualities Satisfaction with Information Search Tourist Experience Additional demographic information
Page Break

164
Start of Block: Default Question Block
Dear participant, my name is Peter Mkumbo, I am a Ph.D. Candidate in the Department of Parks, Recreation and Tourism Management at Clemson University, United States of America. As part of the requirements of the Ph.D. program, I am conducting a thesis project to understand information sources used by tourists who visit Tanzania along with you, and satisfaction. A committee of five professors is supervising this project. Prof. Ken Backman and Prof. Sheila Backman are Co-chairing the committee. We are inviting you to participate in this survey. It is your choice to participate in this survey; you are free to decline at any point. There are no risks or discomforts to you that may be caused by this research study. The information you provide will help in finding practical solutions on how to improve management and marketing strategies for why and how travelers choose destination Tanzania. Your individual answers will not be disclosed. They will be combined with those of other respondents to guide us in the analysis process. Thank you in advance for your cooperation. Your opinions are very important to us. Peter J. MKUMBO PhD. Candidate - Clemson University, SC. USA If you have questions or concerns regarding this survey please contact me at Clemson University Department of Parks, Recreation and Tourism Management 270 Lehotsky Hall, 29634 Clemson, SC, USA +1-864-650 -8439 (US) +255 675 416 614 (Tanzania) [email protected] OR my supervisors Prof. Ken Backman [email protected] Prof. Sheila Backman [email protected] End of Block: Default Question Block
Start of Block: Group Number Q2 Group #
________________________________________________________________ End of Block: Group Number Start of Block: Airline Q3 Kindly enter the name of the airline you are flying with from this airport today

165
________________________________________________________________ End of Block: Airline Start of Block: Departure Airport Q4 Airport of Departure from Tanzania today is
o Kilimanjaro International Airport (KIA) (1)
o Dar es Salaam International Airport (JNIA) (2)
o Zanzibar International Airport (3) End of Block: Departure Airport Start of Block: Country of origin Q5 Could you tell us where are you from?
o Country name you permanently reside (1) ________________________________________________
o State (2) ________________________________________________
o Province (3) ________________________________________________
o Region (4) ________________________________________________
o Name of the city you live in (5) ________________________________________________
o Zip /Postal Code (6) ________________________________________________ End of Block: Country of origin Start of Block: Repeat visit Q6 Have you ever visited Tanzania before?
o Yes, I have visited the country before (Please say how many times) (1) ________________________________________________
o No, this is my first visit to Tanzania (2) End of Block: Repeat visit
Start of Block: Travel experience Q7 Do you consider yourself an experienced traveler? (You have visited a number of international tourist destinations before this trip)
Strongly disagree
(1)
Disagree (2)
Somewhat disagree
(3)
Neither agree nor
disagree (4)
Somewhat agree (5)
Agree (6)
Strongly agree (7)

166
I am an experience
traveler (1)
o o o o o o o Display This Question:
If Q7 = Somewhat agree
And Q7 = Agree
And Q7 = Strongly agree
Q8 How many international tourist destinations (countries) have you visited in your life
End of Block: Travel experience
Start of Block: Trip characteristics Q9 What was the main purpose of this trip to Tanzania? (Check one)
o Holiday/Vacation/Leisure (1)
o Visiting family and friends (2)
o Business trip (3)
o Volunteering (4)
o Education/Academic (5)
o Others (Please mention) (6) ________________________________________________ Q10 Could you please tell us what is the composition of your travel party?
o Just myself (1)
o Couple (2)
o Family (3)
o Group of friends (4) Display This Question:
If Q10 = Family And Q10 = Group of friends
Q11 Pleasure indicate the size of your travel party (Number of people in your group)
________________________________________________________________ Q12 Was this trip a group tour?
o Yes (1)

167
o No (2) Q13 Could you tell us what was/is your role in the group with regard to planning and management of this trip? (Check all that apply)
▢ Help in searching for destination (Tanzania) information (1)
▢ Help in booking of different facilities/tours/events (2)
▢ I am the one who selected Tanzania as the destination of the trip (3)
▢ Other (please state) (4) ________________________________________________ Q14 Kindly please tell us about:
o Length of stay (number of nights) in this trip to Tanzania (1) _____
o Number of national parks/game/marine parks visited (2) _________
o Individual average expenditure per day in US$ (please EXCLUDE international flights) (3) __
o Group (travel party) total expenditure per day in US$ if you are party of the travel party (please EXCLUDE international flights) (4) ________________________________________________
Q15 How was this trip/holiday organized?
o I organized everything by myself/ourselves (independent) (1)
o We as a travel party organized everything by ourselves (2)
o An agent/representative organized everything for me/us (package tour) (3)
o I/we organized part of the trip and the other part was organized by agent/representative (Semi packaged tour) (4)
End of Block: Trip characteristics

168
Start of Block: Consumer Involvement Profile (CIP) Q16 We would also like to know how you disagree/agree with the following statements
Strongly disagree (1)
Disagree (2)
Somewhat disagree (3)
Neither agree nor disagree (4)
Somewhat agree (5)
Agree (6)
Strongly agree (7)
The destination I visit is extremely important to me (1) o o o o o o o I'm very interested in visiting tourist destinations like Tanzania (2) o o o o o o o I care very much about visiting tourist destinations like Tanzania (3) o o o o o o o I really enjoy visiting tourist destinations like Tanzania (4) o o o o o o o Whenever I visit tourist destinations like Tanzania, it's like giving myself a present (5) o o o o o o o To me, is quite a pleasure visiting tourist destinations like Tanzania (6) o o o o o o o You can tell a lot about a person from the tourist destinations they visit (7) o o o o o o o The tourist destination a person visits, says something about who they are (8) o o o o o o o The tourist destination I visit reflects the sort of person I am (9) o o o o o o o I get annoyed very much if I make a mistake visiting a tourist destination, not of my interest (10) o o o o o o o

169
I get irritated to visit a tourist destination which isn't right (11) o o o o o o o I get upset with myself if it turned out I'd made the wrong choice when selecting a tourist destination to visit (12) o o o o o o o When I'm considering a tourist destination to visit, I always feel rather unsure about what to pick (13) o o o o o o o When you book a tourist destination, you can never be quite sure it was the right choice or not (14) o o o o o o o Choosing a tourist destination to visit is rather difficult (15) o o o o o o o When you book a tourist destination to visit, you can never be quite certain about your choice (16) o o o o o o o I would be unhappy if it happens I have unknowingly chosen a destination that isn't of my interest (17) o o o o o o o
End of Block: CIP Q17 When planning this trip, how unlikely/likely did you use the following information sources?
Extremely unlikely (1)
Moderately unlikely (2)
Slightly unlikely (3)
Neither likely nor unlikely (4)
Slightly likely (5)
Moderately likely (6)
Extremely likely (7)
Getting information from friends who are relatively well knowledgeable about Tanzania. (1) o o o o o o o Getting information from family members who are relatively well knowledgeable about Tanzania (2) o o o o o o o

170
From relatives (not family members) who are relatively well knowledgeable about Tanzania (3) o o o o o o o Getting information from travel agents (4) o o o o o o o Getting information from TV (5) o o o o o o o Getting information from radio (6) o o o o o o o Getting information from magazine articles (7) o o o o o o o Information from travel bloggers (8) o o o o o o o Getting information from travel guidebooks (9) o o o o o o o
Start of Block: Sources of information considered more reliable when planning a trip Q18 When planning this trip, how reliable did you consider the following information sources?(Information sources here were only shown to those respondents who indicated they had likely used the information source in the previous question i.e. those information sources that score above 4)
Strongly unreliable (1)
Unreliable (2)
Somewhat unreliable (3)
Neither reliable nor unreliable (4)
Somewhat reliable (5)
Reliable (6)
Strongly reliable (7)
Getting information from friends who are relatively well knowledgeable about Tanzania. (1) o o o o o o o
End of Block: Sources of information considered more reliable when planning a trip

171
Start of Block: Frequency of use of information sources Q19 [This question included only information sources in Q22 that scored “Somewhat reliable” and above] How often did you use these information sources before you paid for your trip to Tanzania?
Once a month (1)
Twice a month (2)
Three times a month (3) Once a week (4) Twice a
week (5)
Three times a
week (6)
More than 3 times a week (7)
….. (1) o o o o o o o End of Block: Frequency of use of information sources
Start of Block: Search qualities (Before actual experience) Q20 How do you disagree/agree with the following statements regarding your experience in evaluating Tanzania as a tourist destination before you came to visit?
Strongly disagree (1)
Disagree (2)
Somewhat disagree (3)
Neither agree nor disagree (4)
Somewhat agree (5)
Agree (6)
Strongly agree (7)
I could easily judge the quality of this destination experience before having purchased it. (1) o o o o o o o I could easily evaluate this destination before buying it (2) o o o o o o o With this destination, it is not difficult to evaluate what you’re getting before you buy (3) o o o o o o o I could easily evaluate the quality of experience of this destination through various sources of information I used before I actually visited it (4) o o o o o o o
End of Block: Search qualities (Before actual experience) Start of Block: Satisfaction with collected information (Information search)

172
Q21 How do you disagree/agree with the following statements regarding your satisfaction with the information you got about Tanzania before you paid for your trip here?
Strongly disagree (1)
Disagree (2)
Somewhat disagree (3)
Neither agree nor disagree (4)
Somewhat agree (5)
Agree (6)
Strongly agree (7)
Getting information about Tanzania and its tourist attraction was a wise decision (1) o o o o o o o I was satisfied with my information search about Tanzania and its tourist attractions (2) o o o o o o o If I had to do it all over again, I would seek information in the same manner that I did (3) o o o o o o o I was pleased with my search for information about Tanzania and its tourist attractions (4) o o o o o o o The information I collected about Tanzania and its tourist attractions made me feel knowledgeable about the country (5) o o o o o o o The information I collected about Tanzania and its tourist attractions helped me to make informed decision about visiting the country (6) o o o o o o o I am happy for what I did in getting information about Tanzania and its tourist attractions(7) o o o o o o o
End of Block: Satisfaction with collected information (Information search)

173
Q22 Now that you have visited Tanzania and you are about to fly back, how would you assess your expectations based on your actual travel experience in Tanzania?
Far short of expectations (1)
Short of expectations (2)
Some what short of expectations
(3)
As expected (4)
Some what exceeds
expectations (5)
Exceeds expectations (6)
Far exceeds expectations (7)
Learning about its history and culture (1) o o o o o o o Experience of something different (2) o o o o o o o Some beautiful scenery (3) o o o o o o o Helpfulness and efficiency of immigration/customs/police officers (4) o o o o o o o Helpfulness and efficiency of hotel/restaurant/retail staff (5) o o o o o o o Friendliness and courteousness of people in Tanzania (6) o o o o o o o Simplified immigration and customs procedures (7) o o o o o o o Convenience of shopping (8) o o o o o o o Convenience of transportation within the country and between attractions (9) o o o o o o o Prices for hotel accommodation (10) o o o o o o o

174
Prices of food (11) o o o o o o o Prices of international air tickets (12) o o o o o o o Comfort of hotel accommodations (13) o o o o o o o Hotel services (14) o o o o o o o Hotel facilities (15) o o o o o o o Variety of food (16) o o o o o o o Quality of food (17) o o o o o o o Attractiveness of natural and scenic landscapes (18) o o o o o o o Climate and weather (19) o o o o o o o Safety and peacefulness (20) o o o o o o o Diversity of wildlife (21) o o o o o o o
End of Block: Perceived Experience Start of Block: Destination description in one word Q23 In one word how would you describe your experience in Tanzania? _________________________________________________

175
End of Block: Destination description in one word
Start of Block: Destination experience Q24 In one word, how would you describe a tourist destination Tanzania? _____________ End of Block: Destination experience
Start of Block: Reason for a repeat visit Q25 If you are to re-visit Tanzania in the future, what would be the main motivator OR reason? ____________ End of Block: Reason for a repeat visit
Start of Block: Likelihood to share experience in online platforms
Start of Block: Experience qualities (After having experienced) Q26 How do you disagree/agree with the following statements regarding your experience in evaluating Tanzania as a tourist destination after you have visited.
Strongly disagree (1)
Disagree (2)
Somewhat disagree (3)
Neither agree nor disagree (4)
Somewhat agree (5)
Agree (6)
Strongly agree (7)
I find it easier to evaluate this destination after having visited it. (1) o o o o o o o I could easily determine the quality of experience of this destination after having visited it. (2) o o o o o o o I could readily know if this destination was a good deal immediately after visiting it. (3) o o o o o o o I could easily tell about the quality of this destination only after visiting it (4) o o o o o o o

176
Start of Block: Additional demographic information Q27 Which of the following best describes your gender
o Male (1)
o Female (2)
o Prefer not to say (3) End of Block: Additional demographic information
Start of Block: Education level Q28 Which of the following best describes your education level?
o High school (1)
o College level (Not university) (2)
o University first degree (3)
o Above first degree (Masters, MD and PhD) (4) End of Block: Education level
Start of Block: Occupation Q29 Which of the following best describes your occupation status
o University student (1)
o Tourism and Hospitality related job (2)
o Government employee (3)
o Private sector employee (4)
o Retired (5)
o Professional (6)
o Other (please mention) (7) ________________________________________________ End of Block: Occupation
Start of Block: Income Q30 Could you indicate what is your annual income range in US$
o less than $30000 (1)
o $30000 - 49999 (2)

177
o $50000 - 69999 (3)
o $70000 - 89999 (4)
o $90000 or more (5) End of Block: Income
Start of Block: Age Q31 Which of the following best describe your age group
o 18 - 21 (1)
o 22 - 25 (2)
o 26 - 35 (3)
o 36 - 45 (4)
o 46 - 55 (5)
o 56 - 65 (6)
o Above 65 (7) End of Block: Age

178
APPENDIX E
RESEARCH PERMIT

179

180
REFERENCES
Ajzen, I. (2005). Attitudes, Personality and Behaviour (2nd Editio). Maidenhead, Berkshire, England: Open University Press.
Alba, J. W., & Hutchinson, J. W. (1987). Dimensions of Consumer Expertise. Journal of
Consumer Research, 13(4), 411–454. https://doi.org/10.1086/209080. Albrecht, J. N. (2010). Challenges in Tourism Strategy Implementation in Peripheral
Destinations—The Case of Stewart Island, New Zealand. Tourism and Hospitality Planning & Development, 7(2), 91–110. https://doi.org/10.1080/14790531003737102.
Algina, J., & Olejnik, S. (2000). Determining Sample Size for Accurate Estimation of the
Squared Multiple Correlation Coefficient. Multivariate Behavioral Research, 35(1), 119–137. https://doi.org/10.1207/S15327906MBR3501.
Allison, P. D. (2003). Missing Data Techniques for Structural Equation Modeling.
Journal of Abnormal Psychology, 112(4), 545–557. https://doi.org/10.1037/0021-843X.112.4.545.
Backman, S. J., & Crompton, J. L. (1989). Discriminating Between Continuers and
Discontinuous of two Leisure Services. Journal of Park and Recreation Administration, 7(4), 56–71.
Batra, R., & Keller, K. L. (2016). Integrating Marketing Communications: New Findings,
New Lessons and New Ideas. Journal of Marketing, In press(November), 122–145. https://doi.org/10.1509/jm.15.0419.
Beatty, S. E., & Smith, S. M. (1987). External Search Effort: An Investigation Across
Several Product Categories. Journal of Consumer Research, 14(1), 83–95. Retrieved from http://www.jstor.org/stable/2489245.
Bedeian, A. G., Day, D. V., & Kelloway, K. E. (1997). Correcting for Measurement Error
Attenuation in Structural Equation Models: Some Important Reminders. Educational and Psychological Measurement, 57(5), 785–799.

181
Berning, C. A. K., & Jacoby, J. (1974). Patterns of Information Acquistion in New Product Purchases. Journal of Consumer Research, 1(2), 18–22.
Bienstock, C. C., & Stafford, M. R. (2006). Measuring Involvement With the Service: A
Further Investigation of Scale Validity and Dimensionality. Journal of Marketing Theory and Practice, 14(3), 209–221. https://doi.org/10.2753/MTP1069-6679140303.
Bigne, J. E., & Andreu, L. (2004). Emotions in Segmentation: An Empirical Study.
Annals of Tourism Research, 31(3), 682–696. https://doi.org/10.1016/j.annals.2003.12.018.
Boulding, W., Lee, E., & Staelin, R. (1994). Mastering the mix: Do advertising,
promotion, and sales force activities lead to differentiation? Journal of Marketing Research, 31(2), 159–172. https://doi.org/10.2307/3152191.
Brown, T. A., & Moore, M. T. (2017). Confirmatory Factor Analysis. Boston, MA:
Boston University. Bruwer, J., Burrows, N., Chaumont, S., Li, E., & Saliba, A. (2014). Consumer
Involvement and Associated Behaviour in the UK High-End Retail Off-Trade Wine Market. International Review of Retail, Distribution and Consumer Research, 24(2), 145–165. https://doi.org/10.1080/09593969.2013.839464.
Budeva, D. G., & Mullen, M. R. (2014). International Market Segmentation. European
Journal of Marketing, 48(7/8), 1209–1238. https://doi.org/10.1108/EJM-07-2010-0394.
Byrne, B. M. (2006). Structural Equation Modeling With EQS: Basic Concepts,
Applications, and Programming (2nd Editio). Mahwah, NJ: Routledge. Byrne, B. M., & Crombie, G. (2003). Modeling and Testing Change: An Introduction to
the Latent Growth Curve Model. Understanding Statistics. https://doi.org/10.1207/S15328031US0203_02.
Byrne, B. M., & Stewart, S. M. (2006). The MACS Approach to Testint for Multigroup
Invariance of a Second-Order Structure: A Walk Through the Process. Structural Equation Modeling, 13(2), 204–228. https://doi.org/10.1207/s15328007sem1302.

182
Cai, L. A., Feng, R., & Breiter, D. (2004a). Tourist Purchase Decision Involvement and Information Preferences. Journal of Vacation Marketing, 10(2), 138–148.
Cai, L. A., Feng, R., & Breiter, D. (2004b). Tourist Purchase Decision Involvement and
Information Preferences. Journal of Vacation Marketing, 10(2), 138–148. Cardozo, R. N. (1965). An Experimental Study of Customer Effort, Expectation, and
Satisfaction. Journal of Marketing Research, 2(3), 244–249. https://doi.org/10.2307/3150182.
Carlson, L., Grove, S. J., & Dorsch, M. J. (2003). Services Advertising and Integrated
Marketing Communications: An Empirical Examination. Journal of Current Issues and Research in Advertising, 25(2), 69–82. https://doi.org/10.1080/10641734.2003.10505150.
Carneiro, M. J., & Crompton, J. L. (2010). The Influence of Involvement, Familiarity,
and Constraints on the Search for Information about Destinations. Journal of Travel Research, 49(4), 451–470. https://doi.org/10.1177/0047287509346798.
Carneiro, M. J., & Crompton, J. L. (2010). The Influence of Involvement, Familiarity,
and Constraints on the Search for Information about Destinations. Journal of Travel Research, 49(4), 451–470. https://doi.org/10.1177/0047287509346798.
Chen, J. S., & Gursoy, D. (2000). Cross-cultural Comparison of the Information Sources
Used by First-time and Repeat Travelers and its Marketing Implications. International Journal of Hospitality Management, 19(2000), 191–203. https://doi.org/10.1016/S0278-4319(00)00013-X.
Chen, T., & Pearce, P. L. (2012). Research note: Seasonality patterns in Asian tourism.
Tourism Economics, 18(5), 1105–1115. https://doi.org/10.5367/te.2012.0163. Chon, K.-S. (1989). Understanding Recreational Traveler’s Motivation, Attitude and
Satisfaction. The Tourist Review, 44(1), 3–7. https://doi.org/https://doi.org/10.1108/eb058009.
Cohen, J., Cohen, P., Stephen, W. G., & Leona, A. S. (2003). Applied Multiple
Regression/Correlation Analysis for the Behavioral Sciences (3rd Editio). Mahwah, NJ: Lawrence Erlbaum Associates.

183
Creswell, J. W. (2009). Research Design: Qualitative, Quantitative and Mixed Method Aproaches. SAGE Publications (3rd Editio). Thousand Oaks, USA: SAGE Publications, Inc.
Creswell, J. W., & Clark, V. L. P. (2011). Designing and Conducting Mixed Methods
Research. SAGE (2nd Editio). SAGE Publications, Inc. D’Ambra, J., & Mistlis, N. (2005). The Web and Traditional Information Resources:
How Do They Contribute to Overall Satisfaction with an Information Service? In AMCIS 2005.207.
Dahl, S., Eagle, L., & Low, D. (2015). Integrated marketing communications and social
marketing. Journal of Social Marketing, 5(3), 226–240. https://doi.org/10.1108/JSOCM-07-2012-0031.
Darby, M. R., & Karni, E. (1973). Free Competition and the Optimal Amount of Fraud.
The Journal of Law and Economics, 16, 67–88. https://doi.org/10.3366/ajicl.2011.0005.
Dawes, P. L., Dowling, G. R., & Patterson, P. G. (1991). Information Sources Used to
Select Different Types of Management Consultancy Services. Asia Pacific Journal of Management, 8(2), 185–199.
Dillman, D. A., Smyth, J. D., & Christian, L. M. (2014). Internet, Phone, Mail, and
Mixed-Mode Surveys: The Tailored Design Method (4th ed.). Hoboken, NJ, USA: John Wiley & Sons Inc.
Dimanche, F., Havitz, M. E., & Howard, D. R. (1991). Testing the Involvement Profile
(IP) Scale in the Context of Selected Recreational and Touristic Activities. Journal of Leisure Research, 23(1), 31–66.
Duhan, D. F., Johnson, S. D., Wilcox, J. B., & Harrell, G. D. (1997). Influence on
Consumer Use of Word-of-Mouth Recommendation Sources. Journal of the Academy of Marketing Science, 25(4), 283–295.
Egelhoff, W. G. (1991). Information-Processing Theory and the Multinational Enterprise.
Journal of International Business Studies, 22(3), 341–368. Retrieved from http://www.jstor.org/stable/154913.

184
Engel, J. F., Blackwell, R. D., & Miniard, P. W. (1995). Consumer Behavior (8th Editio). Dryden, Texas: Fort Worth.
Evans, P. B., & Wurster, T. S. (1997). Strategy and the New Economics of Information.
Harvward Business Review, (September-October), 70–82. Retrieved from https://hbr.org/1997/09/strategy-and-the-new-economics-of-information.
Feather, N. T. (1990). Bridging the Gap Between Values and Actions: Recent
Applications of the Expectancy-Value Model. In E. T. Higgins & R. M. Sorrentino (Eds.), Handbook of Motivation and Cognition: Foundation of Social Behavior (1st Editio, pp. 151–192). New York, USA: 1990 The Guilford Press.
Feldt, L. S., & Ankenmann, R. D. (1999). Determining Sample Size for a Test of the
Equality of Alpha Coefficients When the Number of Part-Tests is Small. Psychological Methods, 4(4), 366–377. https://doi.org/10.1037/1082-989X.4.4.366.
Fichman, M., & Cummings, J. N. (2003). Multiple Imputation of Missing Data: Making
the Most of what you know. Organizational Research Methods, 6, 282–308. Fishbein, M., & Ajzen, I. (1975). Belief, Attitude, Intention, and Behavior: An
Introduction to Theory and Research. Reading, Massachusets: Addion-Wesley Publication Company. Retrieved from http://people.umass.edu/aizen/f&a1975.html.
Fodness, D., & Murray, B. (1997). Tourist Information Search. Annals of Tourism
Research, 24(3), 503–523. https://doi.org/10.1016/S0160-7383(97)00009-1. Fodness, D., & Murray, B. (1998). A Typology of Tourist Information Search Strategies.
Journal of Travel Research, 37(2), 108–126. Fodness, D., & Murray, B. (1999). A Model of Tourist Information Search Behavior.
Journal of Travel Research, 37(February), 220–230. Ford, G., Smith, D., & Swasy, J. (1988). An Empirical Test of the Search, Experience
and Credence Attributes Framework. In M. J. Houston (Ed.), Advances in Consumer Research (Vol. 15, pp. 239–243). Provo, Utah, USA: Association for Consumer Research.

185
Gilly, M. C., Graham, J. L., Wolfinbarger, M. F., & Yale, L. J. (1998). A Dyadic Study of Interpersonal Information Search. Journal of the Academy of Marketing Science, 26(2), 83–100. https://doi.org/10.1177/0092070398262001.
Gnoth, J. (1997). Tourism Motivation and Expectation Formation. Annals of Tourism
Research, 24(2), 283–304. https://doi.org/SOlSO-7383(96)00058-S. Goldsmith, R. E., & Litvin, S. W. (1999). Heavy Users of Travel Agents: A
Segmentation Analysis of Vacation Travelers. Journal of Travel Research, 38(November), 127–133.
Graham, J. W. (2009). Missing Data Analysis: Making It Work in the Real world. Annual
Review of Psychology, 60, 549–576. https://doi.org/10.1146/annurev.psych.58.110405.085530.
Greene, J. C. (2012). Engaging Critical Issues in Social Inquiry by Mixing Methods.
American Behavioral Scientist, 56(6), 755–773. https://doi.org/10.1177/0002764211433794.
Greene, J. C., & Caracelli, V. J. (2003). Making Paradigmatic Sense of Mixed Methods
Practice. In A. Tashakkori & C. Teddlie (Eds.), Handbook of Mixed Methods in Social and Behavioral Research (1st Editio, p. 784). Thousand Oaks, USA: SAGE Publications, Inc.
Grimmelikhuijsen, S., & Porumbescu, G. A. (2017). Reconsidering the Expectancy
Disconfirmation Model. Three Experimental Replications. Public Management Review, 19(9), 1272–1292. https://doi.org/10.1080/14719037.2017.1282000.
Grove, S., Carlson, L., & Dorsch, M. (2007). Comparing the Application of Integrated
Marketing Communication (IMC) in Magazine Ads Across Product Type and Time. Journal of Advertising, 36(1), 37–54. https://doi.org/10.2753/JOA0091-3367360103.
Gujarati, D., & Porter, D. (2003). Multicollinearity: What Happens if the Regressors are
Correlated. Basic Econometrics, 363–363. Gursoy, D. (2001). Development of A Travelers’ Information Search Behavior Model.
Virginia Tech.
186
Gursoy, D., & Chen, J. oseph S. (2000). Competitive Analysis of Cross-Cultural Information Search Behaviour. Tourism Management, 21(2000), 583–590. https://doi.org/10.1016/S0261-5177(00)00005-4.
Gursoy, D., & Gavcar, E. (2003). International Leisure Tourists’ Involvement Profile.
Annals of Tourism Research, 30(4), 906–926. https://doi.org/10.1016/S0160-7383(03)00059-8.
Gursoy, D., & McCleary, K. W. (2003). An Integrative Model of Tourists’ Information
Search Behavior. Annals of Tourism Research, 31(2), 353–373. https://doi.org/10.1016/j.annals.2003.12.004.
Gursoy, D., & Umbreit, W. T. (2004). Tourist Information Search Behavior: Cross-
cultural Comparison of European Union Member States. International Journal of Hospitality Management, 23(2004), 55–70. https://doi.org/10.1016/j.ijhm.2003.07.004.
Hair, J. F., Black, W., Babin, B., & Anderson, R. (2010). Multivariate Data Analysis (7th
Editio). Upper Saddle River, New Jersey: Prentice Hall. Hair, J. F., Black, W. C., Babin, B. J., Anderson, R. E., & Tatham, R. L. (2006).
Multivariate Data Analysis (6th ed.). Upper Saddle River, New Jersey: Pearson Prentice Hall.
Hair, J. F., Celsi, M., Money, A., Samouel, P., & Page, M. (2015). The Essentials of
Business Research Methods (3rd Editio). New York: Routledge. Hallahan, K., Holtzhausen, D., Ruler, B., Verčič, D., & Sriramesh, K. (2007). Defining
Strategic Communication. International Journal of Strategic Communication, 1(1), 3–35. https://doi.org/10.1080/15531180701285244.
Hanzaee, K. H., Khoshpanjeh, M., & Rahnama, A. (2011). Evaluation of the Effects of
Product Involvement Facets on Brand Loyalty. African Journal of Business Management, 5(16), 6964–6971. https://doi.org/10.5897/AJBM11.325.
Havitz, M. E., & Dimanche, F. (1990). Propositions for Testing the Involvement
Construct in Recreational and Tourism Contexts. Leisure Sciencies An Interdisciplinary Journal, 12(2), 179–195.

187
Havitz, M. E., & Dimanche, F. (1999). Leisure Involvement Revisited: Drive Properties and Paradoxes. Journal of Leisure Research, 31(2), 122–149.
Havitz, M. E., Green, T. R., & McCarville, R. E. (1993). Order Effects and the
Measurement of Enduring Leisure Involvement. Journal of Applied Recreation Research, 18(3), 181–195.
Hawkins, D. I., Best, R. J., & Coney, K. A. (1992). Consumer Behavior: Implications for
Marketing Strategy. Burr Ridge, IL, USA: Richard D. Irwin Inc. Hernández-Méndez, J., Muñoz-Leiva, F., & Sánchez-Fernández, J. (2015). The Influence
of E-Word-of-Mouth on Travel Decision-Making: Consumer Profiles. Current Issues in Tourism, 18(11), 1001–1021. https://doi.org/10.1080/13683500.2013.802764.
Heung, V. C. S., & Quf, H. (2000). Hong Kong as a Travel Destination: An Analysis of
Japanese Tourists’ Satisfaction Levels, and the Likelihood of Them Recommending Hong Kong to Others. Journal of Travel & Tourism Marketing, 9(1–2), 57–80. https://doi.org/10.1300/ J073v09n01_04.
Holm, O. (2006). Integrated marketing communication: from tactics to strategy.
Corporate Communications: An International Journal, 11(1), 23–33. https://doi.org/10.1108/13563280610643525.
Hooper, D., Coughlan, J., & Mullen, M. R. (2008). Structural Equation Modelling:
Guidelines for Determining Model Fit. Electronic Journal of Business Research Methods, 6(1), 53–60.
Hsu, C. H. C., Cai, L. A., & Li, M. (2010). Expectation, Motivation, and Attitude: A
Tourist Behavioral Model. Journal of Travel Research, 49(3), 282–296. https://doi.org/10.1177/0047287509349266.
Hui, T. K., Wan, D., & Ho, A. (2007). Tourists’ Satisfaction, Recommendation and
Revisiting Singapore. Tourism Management, 28(2007), 965–975. https://doi.org/10.1016/j.tourman.2006.08.008.

188
Hyde, K. F. (2000). A Hedonic Perspective on Independent Vacation Planning, Decision-making and Behaviour. In A. G. Woodside, G. I. Crouch, J. A. Mazanec, M. Oppermann, & M. Y. Sakai (Eds.), Consumer Psychology of Tourism, Hospitality and Leisure (pp. 177–209). Wallingford, UK.: CABI Publishing.
Iacobucci, D. (1992). An Empirical Examination of Some Basic Tenets in Services:
Goods-Services Continua. In T. Swartz, D. Bowen, & S. Brown (Eds.), Advances in Services Marketing and Management (Vol. 1, pp. 23–52). Greenwich, CT, USA: JAI Press, Inc.
Jackson, D. L., Gillaspy, A. J., & Purc-Stephenson, R. (2009). Reporting Practices in
Confirmatory Factor Analysis: An Overview and Some Recommendations. Psychological Methods, 14(1), 6–23. https://doi.org/10.1037/a0014694.
Jacobsen, J. K. S., & Munar, A. M. (2012). Tourist Information Search and Destination
Choice in a Digital Age. Tourism Management Perspectives, 1(2012), 39–47. https://doi.org/10.1016/j.tmp.2011.12.005.
Jamrozy, U., Backman, S. J., & Backman, K. F. (1996a). Involvement and Opinion
Leadership in Tourism. Annals of Tourism Research, 23(4), 908–924. Jamrozy, U., Backman, S. J., & Backman, K. F. (1996b). Involvement and Opinion
Leadersip in Tourism. Annals of Tourism Research, 23(4), 908–924. https://doi.org/10.1016/0160-7383(96)00022-9.
Jiang, J., Awadallah, H. A., Shi, X., & White, R. W. (2015). Understanding and
Predicting Graded Search Satisfaction. In Proceedings of the Eighth ACM International Conference on Web Search and Data Mining - WSDM ’15 (pp. 57–66). Shanghai, China. https://doi.org/10.1145/2684822.2685319.
Kapferer, J., & Laurent, G. (1985). Consumer Involvement Profiles: A New Practical
Approach to Consumer Involvement. Journal of Advertising Research, 25(6), 48–56. https://doi.org/Article.
Kapferer, J., & Laurent, G. (1993). Further Evidence on the Consumer Involvement
Profile: Five Antecedents of Involvement. Psychology & Marketing, 10(4), 347–355. https://doi.org/10.1002/mar.4220100408.

189
Kelley, K., & Maxwell, S. E. (2003). Sample Size for Multiple Regression: Obtaining Regression Coefficients that are Accurate, Not Simply Significant. Psychological Methods, 8(3), 305–321. https://doi.org/10.1037/1082-989X.8.3.305.
Kim, M.-J., Chung, N., & Lee, C.-K. (2011). The Effect of Perceived Trust on Electronic
Commerce: Shopping Online for Tourism Products and Services in South Korea. Tourism Management, 32(2011), 256–265. https://doi.org/10.1016/j.tourman.2010.01.011.
Kim, S.-S., Scott, D., & Crompton, J. L. (1997). An Exploration of the Relationships
Among Social Psychological Involvement, Behavioral Involvement, Commitment, and Future Intentions in the Context of Birdwatching. Journal of Leisure Research, 29(3), 320–341. https://doi.org/10.1080/00222216.1997.11949799.
Kitchen, P. J., & Proctor, T. (2015). Marketing communications in a post-modern world.
Journal of Business Strategy, 36(5), 34–42. https://doi.org/10.1108/JBS-06-2014-0070.
Kline, R. B. (2015). Principles and Practice of Structural Equation Modeling
(Methodology in the Social Sciences) (Fourth Edi). New York: The Guilford Press. Korneliussen, T., & Greenacre, M. (2017a). Information Sources Used by European
Tourists: A Cross-National Study. Journal of Travel Research, 1–13. https://doi.org/10.1177/0047287516686426.
Korneliussen, T., & Greenacre, M. (2017b). Information Sources Used by European
Tourists. Journal of Travel Research, (1527), 004728751668642. https://doi.org/10.1177/0047287516686426.
Kotler, P. T., & Armstrong, G. (2015). Principles of Marketing (16th ed.). Edinburgh
Gate, Esses: Pearson Education Limited. Kyle, G., Graefe, A., Manning, R., & Bacon, J. (2003). An Examination of the
Relationship Between Leisure Activity Involvement and Place Attachment Among Hikers Along the Appalachian Trail. Journal of Leisure Research, 35(3), 249–273.

190
Kyle, G. T., Absher, J. D., Hammitt, W. E., & Cavin, J. (2006). An Examination of the Motivation - Involvement Relationship. Leisure Sciences, 28(5), 467–485. https://doi.org/10.1080/01490400600851320.
LaBerge, D., & Samuels, S. J. (1974). Toward a Theory of Automatic Information
Processing in Reading. Cognitive Psychology, 6(2), 293–323. https://doi.org/10.1016/0010-0285(74)90015-2.
Lamberti, L., & Noci, G. (2010). Marketing strategy and marketing performance
measurement system: Exploring the relationship. European Management Journal, 28(2), 139–152. https://doi.org/10.1016/j.emj.2009.04.007.
Lankton, N. K., McKnight, D. H., Wright, R. T., & Thatcher, J. B. (2016). Research
Note-Using Expectation Disconfirmation Theory and Polynomial Modeling to Understand Trust in Technology. Information Systems Research, 27(1), 197–213. https://doi.org/10.1287/isre.2015.0611.
Laurent, G., & Kapferer, J.-N. (1985). Measuring Consumer Involvement Profiles.
Journal of Marketing Research, 22(1), 41–53. Retrieved from http://www.jstor.org/stable/3151549.
Lin, L., & Chen, C. (2006). The Influence of the Country‐of‐Origin Image, Product
Knowledge and Product Involvement on Consumer Purchase Decisions: An Empirical Study of Insurance and Catering Services in Taiwan. Journal of Consumer Marketing, 23(5), 248–265. https://doi.org/10.1108/07363760610681655.
Luo, M., Feng, R., & Cai, L. A. (2004). Information Search Behavior and Tourist
Characteristics. Journal of Travel & Tourism Marketing, 17(2–3), 15–25. https://doi.org/10.1300/J073v17n02.
MacCallum, R. C. (1986). Specification Searches in Covariance Structure Modeling.
Psychological Bulletin, 100(1), 107–120. https://doi.org/10.1037/0033-2909.100.1.107.
MacCallum, R. C., Browne, M. W., & Sugawara, H. M. (1996). Power Analysis and
Determination of Sample Size for Covariance Structure Modeling. Psychological Methods, 1(2), 130–149. https://doi.org/10.1037/1082-989X.1.2.130.

191
MacCallum, R. C., Widaman, K. F., Preacher, K. J., & Hong, S. (2001). Sample Size in Factor Analysis: The Role of Model Error. Multivariate Behavioral Research, 36(4), 611–637. https://doi.org/10.1207/S15327906MBR3604_06.
MacCallum, R. C., Widaman, K. F., Zhang, S., & Hong, S. (1999). Sample Size in Factor
Analysis. Psychological Methods, 4(1), 84–99. https://doi.org/doi.org/10.1037/1082-989X.4.1.84.
Malhotra, N. (2009). Marketing Research an Applied Orientation (6th Editio). London:
Pearson Publishing. Marsh, H. W., Wen, Z., & Hau, K.-T. (2004). Structural Equation Models of Latent
Interactions: Evaluation of Alternative Estimation Strategies and Indicator Construction. Psychological Methods, 9(3), 275–300. https://doi.org/10.1037/1082-989X.9.3.275.
Martín-Santana, J. D., Beerli-Palacio, A., & Nazzareno, P. A. (2017). Antecedents and
Consequences of Destination Image Gap. Annals of Tourism Research, 62(2017), 13–25. https://doi.org/10.1016/j.annals.2016.11.001.
Masiero, L., & Nicolau, J. L. (2012). Tourism Market Segmentation Based on Price
Sensitivity Finding Similar Price Preferences on Tourism Activities. Journal of Travel Research, 51(4), 426–435. https://doi.org/10.1177/0047287511426339.
Maxwell, S. E. (2000). Sample Size and Multiple Regression Analysis. Psychological
Methods, 5(4), 434–458. https://doi.org/10.1037/1082-989X.5.4.434. McCall, J. J. (1970). Economics of Information and Job Search Author ( s ). The
Quarterly Journal of Economics, 84(1), 113–126. Retrieved from http://www.jstor.org/stable/1879403.
McCleary, K. W., & Whitney, D. L. (1994). Projecting Western Consumer Attitudes
Toward Travel to Six Eastern European Countries. Journal of International Consumer Marketing, 6(3–4), 239–256.
McDonald, R. P., & Ho, M.-H. R. (2002). Principles and Practice in Reporting Structural
Equation Analyses. Psychological Methods, 7(1), 64–82. https://doi.org/10.1037/1082-989X.7.1.64.

192
McKinney, V., Yoon, K., & Zahedi, F. “Mariam.” (2002). The Measurement of Web-customer Satisfaction: An Expectation and Disconfirmation Approach. Information Systems Research, 13(3), 296–315. https://doi.org/10.1287/isre.13.3.296.76.
Mgonja, J. T., Backman, K. F., Backman, S. J., Moore, D. D., & Hallo, J. C. (2016).
Factors Moderating and Mediating Visitors’ Perceptions About Local Foods in Tanzania. Journal of Gastronomy and Tourism, 2(2), 87–106. https://doi.org/https://doi.org/10.3727/216929716X14720551277808.
Mgonja, J. T., Backman, K. F., Backman, S. J., Moore, D. D., & Hallo, J. C. (2017). A
Structural Model to Assess International Visitors’ Perceptions About Local Foods in Tanzania. Journal of Sustainable Tourism, 25(6), 796–816. https://doi.org/10.1080/09669582.2016.1250768.
Mihajlović, I. (2012). The Impact of Information and Communication Technology (ICT )
as a Key Factor of Tourism Development on the Role of Croatian Travel Agencies, 3(24), 151–159.
Minazzi, R. (2015). Social Media Marketing in Tourism and Hospitality. Cham: Springer
International Publishing. https://doi.org/10.1007/978-3-319-05182-6. Mitra, K., Reiss, M. C., & Capella, L. M. (1999). An Examination of Perceived Risk,
Information Search and Behavioral Intentions in Search, Experience and Credence Services. Journal of Services Marketing, 13(3), 208–228. https://doi.org/10.1108/08876049910273763.
Moorthy, S., Ratchford, B. T., & Talukdar, D. (1997). Consumer Information Search
Revisited: Theory and Empirical Analysis. Journal of Consumer Research, 23(4), 263–277. Retrieved from http://www.jstor.org/stable/2489564.
Mortimer, K., & Pressey, A. (2013). Consumer Information Search and Credence
Services: Implications for Service Providers. Journal of Services Marketing, 27(1), 49–58. https://doi.org/10.1108/08876041311296374.
Moscardo, G. (2005). Peripheral tourism development: Challenges, issues and success
factors. Tourism Recreation Research, 30(1), 27–43. https://doi.org/10.1080/02508281.2005.11081231.

193
Murray, K. B. (1991). A Test of Services Marketing Theory : Consumer Information Acquisition Activities. Journal of Marketing, 55(1), 10–25.
Nella, A., & Christou, E. (2014). Segmenting Wine Tourists on the Basis of Involvement
with Wine. Journal of Travel &Tourism Marketing, 31(7), 783–798. https://doi.org/10.1080/10548408.2014.889639.
Nelson, P. (1970). Information and Consumer Behavior. Journal of Political Economy,
78(2), 311–329. Retrieved from http://www.jstor.org/stable/1830691. O’brien, R. M. (2007). A Caution Regarding Rules of Thumb for Variance Inflation
Factors. Quality and Quantity, 41(5), 673–690. Oliver, R. L. (1977). Effect of Expectation and Disconfirmation on Postexposure Product
Evaluations: An Alternative Interpretation. Journal of Applied Psychology, 62(4), 480–486. https://doi.org/10.1037/0021-9010.62.4.480.
Oliver, R. L. (1980). A Cognitive Model of the Antecedents and Consequences of
Satisfaction Decisions. Journal of Marketing Research, 17(4), 460–469. https://doi.org/10.2307/3150499.
Oliver, R. L., Balakrishnan, P. V. (Sundar), & Barry, B. (1994). Outcome Satisfaction in
Negotiation: A Test of Expectancy Disconfirmation. Organizational Behavior and Human Decision Processes, 60, 252–275.
Ots, M., & Nyilasy, G. (2017). Just doing it: theorising integrated marketing
communications (IMC) practices. European Journal of Marketing, 51(3), 490–510. https://doi.org/10.1108/EJM-08-2015-0595.
Pan, B., & Fesenmaier, D. R. (2006). Online Information Search: Vacation Planning
Process. Annals of Tourism Research, 33(3), 809–832. https://doi.org/10.1016/j.annals.2006.03.006.
Petrovsky, N., Mok, J. Y., & León-Cázares, F. (2017). Citizen Expectations and
Satisfaction in a Young Democracy: A Test of the Expectancy-Disconfirmation Model. Public Administration Review, 77(3), 395–407. https://doi.org/10.1111/puar.12623.

194
Pickett, G. M., Grove, S. J., & Laband, D. N. (2001). The Impact of Product Type and Parity on the Informational Content of Advertising. Journal of Marketing Theory and Practice, 9(3), 32–43.
Pickton, D., & Broderick, A. (2001). Integrated Marketing Communications. Retrieved
from http://sutlib2.sut.ac.th/sut_contents/H72683.pdf. Pike, S., & Page, S. (2014). Destination Marketing Organizations and Destination
Marketing: a Narrative Analysis of the Literature. Tourism Management, 41, 1–26. Retrieved from http://eprints.bournemouth.ac.uk/21118/1/Eprints - Pike and Page - DMO and destination marketing-1.pdf.
Pirolli, P. L. (2009). Information Foraging Theory: Adaptive Interaction with
Information (1st Editio). New York, USA: Oxford University Press. Pizam, A., Neumann, Y., & Reichel, A. (1978). Dimentions of Tourist Satisfaction With
a Destination Area. Annals of Tourism Research, 5(3), 314–322. https://doi.org/10.1016/0160-7383(78)90115-9.
Prayag, G., & Ryan, C. (2012). Antecedents of Tourists’ Loyalty to Mauritius: The Role
and Influence of Destination Image, Place Attachment, Personal Involvement, and Satisfaction. Journal of Travel Research, 51(3), 342–356. https://doi.org/10.1177/0047287511410321.
Prebensen, N. K., Woo, E., Chen, J. S., & Uysal, M. (2012a). Motivation and
Involvement as Antecedents of the Perceived Value of the Destination Experience. Journal of Travel Research, XX(X), 1–12. https://doi.org/10.1177/0047287512461181.
Prebensen, N. K., Woo, E., Chen, J. S., & Uysal, M. (2012b). Motivation and
Involvement as Antecedents of the Perceived Value of the Destination Experience. Journal of Travel Research, 52(2), 253–264. https://doi.org/10.1177/0047287512461181.
Pride, W. M., & Ferrell, O. C. (2016). Marketing (18th Editi). Boston, MA, USA:
Cengage Learning.

195
Qazi, A., Tamjidyamcholo, A., Raj, R. G., Hardaker, G., & Standing, C. (2017). Assessing Consumers’ Satisfaction and Expectations Through Online Opinions: Expectation and Disconfirmation Approach. Computers in Human Behavior, 75(2017), 450–460. https://doi.org/10.1016/j.chb.2017.05.025.
Qualtrics. (2017). Qualtrics Research Core. Provo, Utah, USA: Qualtrics Inc. Retrieved
from http://www.qualtrics.com. Quan, S., & Wang, N. (2004). Towards a Structural Model of the Tourist Experience: An
Illustration From Food Experiences in Tourism. Tourism Management, 25(2004), 297–305. https://doi.org/10.1016/S0261-5177(03)00130-4.
Rao, A. R., & Monroe, K. B. (1988). The Moderating Effect of Prior Knowledge on Cue
Utilization in Product Evaluations. Source Journal of Consumer Research, 15(2), 253–264. Retrieved from http://www.jstor.org/stable/2489530%5Cnhttp://about.jstor.org/terms.
Ratchford, B. T. (1980). The Value of Information for Selected Appliances. Journal of
Marketing Research, 17(1), 14–25. https://doi.org/10.2307/3151112. Ratchford, B. T. (1982). Cost-Benefit Models for Explaining Consumer Choice and
Information Seeking Behavior. Management Science, 28(2), 197–212. Retrieved from http://www.jstor.org/stable/2631304.
Reid, I. S., & Crompton, J. L. (1993). A Taxonomy of Leisure Purchase Decision
Paradigms Based on Level of Involvement. Journal of Leisure Research, 25(2), 182–202.
Reid, & Mike. (2005). Performance Auditing of Integrated Marketing Communication
(Imc) Actions and Ou. Journal of Advertising Winter, 34(4). https://doi.org/10.1080/00913367.2005.10639208.
Ritchie, B. W., Tkaczynski, A., & Faulks, P. (2010). Understanding the Motivation and
Travel Behavior of Cycle Tourists Using Involvement Profiles. Journal of Travel & Tourism Marketing, 27(4), 409–425. https://doi.org/10.1080/10548408.2010.481582.

196
Rothschild, M. L. (1978). Searching for the Lowest Price When the Distribution of Prices is Unknown. Princeton University.
Rothschild, M. L. (1984). Perspectives on Involvement: Current Problems and Future
Directions. Advances in Consumer Research, 11(1), 216–217. Rubin, D. B. (2004). Multiple Imputation for Nonresponse in Surveys. United States of
America: John Wiley & Sons Inc. Schafer, J. L., & Graham, J. W. (2002). Missing Data: Our View of the State of the Art.
Psychological Methods, 7(2), 147–177. https://doi.org/10.1037//1082-989X.7.2.147. Schmidt, J. B., & Spreng, R. A. (1996). Cost-Benefit Models for Explaining Consumer
Choice and Information Seeking Behavior. Journal of the Academy of Marketing Science, 24(3), 246–256.
Schreiber, J. B., Nora, A., Stage, F. K., Barlow, E. A., & King, J. (2006). Reporting
Structural Equation Modeling and Confirmatory Factor Analysis Results: A Review. Journal of Educational Research, 99(6), 323–337. https://doi.org/10.3200/JOER.99.6.323-338.
Schul, P., & Crompton, J. L. (1983). Search Behavior of International Vacationers:
Travel-Specific Lifiestyle and Sociodemographic Variables. Journal of Travel Research, 22(2), 25–30. https://doi.org/10.1177/004728758302200206.
Sharifpour, M., Walters, G., Ritchie, B. W., & Winter, C. (2013). Investigating the Role
of Prior Knowledge in Tourist Decision Making: A Structural Equation Model of Risk Perceptions and Information Search. Journal of Travel Research, 53(3), 307–322. https://doi.org/10.1177/0047287513500390.
Shostack, G. L. (1977). Breaking Free From Product Marketing. Journal of Marketing,
41(2), 73–80. https://doi.org/10.2307/1250637. Siu, N. Y.-M., Kwan, H.-Y., Wong, H., & Zhang, T. J.-F. (2017). Enhancing Positive
Disconfirmation and Personal Identity Through Customer Engagement in Cultural Consumption. In P. Rossi (Ed.), Proceedings of the 2016 Academy of Marketing Science (AMS) World Marketing Congress (Developments in Marketing Science) (pp. 525–536). Paris, France: Springer International Publishing.

197
Smith, R. K. (2000). Involvement & Consumer Evaluation of Goods & Services: The Effect on Information Search & Goal Clarity. Ph.D. Thesis. The University of Memphis. Retrieved from http://repository.tamu.edu/handle/1969.1/ETD-TAMU-2009-12-7545%5Cnhttp://repository.tamu.edu/handle/1969.1/1315.
Snepenger, D., Meged, K., Snelling, M., & Worrall, K. (1990). Information Search
Strategies By Destination-Naive Tourists. Journal of Travel Research, 29(1), 13–16. https://doi.org/10.1177/004728759002900104.
Spreng, R. A., MacKenzie, S. B., & Olshavsky, R. W. (1996). A Reexamination of the
Determinants of Consumer Satisfaction. Journal of Marketing, 60(3), 15–32. https://doi.org/10.2307/1251839.
Srinivasan, N., & Ratchford, B. T. (1991). An Empirical Test of a Model of External
Search for Automobiles. Journal of Consumer Research, 18(2), 233–242. https://doi.org/10.1086/209255.
Stigler, G. J. (1961). The Economics of Information. Journal of Political Economy,
69(3), 213–225. Retrieved from http://www.jstor.org/stable/1829263. Stiglitz, J. E. (2000). The Contributions of the Economics of Information to Twentieth
Century Economics Author ( s ): Joseph E . Stiglitz Published by : Oxford University Press THE CONTRIBUTIONS OF THE ECONOMICS OF INFORMATION TO TWENTIETH CENTURY ECONOMICS *. The Quarterly Journal of Economics, 115(4), 1441–1478. Retrieved from http://www.jstor.org/stable/2586930.
Stuart, P., Pearce, D., & Weaver, A. (2005). Tourism Distribution Channels in Peripheral
Regions: The Case of Southland, New Zealand. Tourism Geographies, 7(3), 235–256. https://doi.org/10.1080/14616680500164740.
Tabachnick, B. G., & Fidell, L. S. (2012). Using Multivariate Statistics (6th Editio).
United States of America: Pearson Education Inc. Tanzania Ministry of Transport. (2015). Traffic Records for Government Airports. Dar es
Salaam, Tanzania.

198
Telser, L. G. (1973). Searching for the Lowest Price. The American Economic Review, 63(2), 40–49. Retrieved from http://www.jstor.org/stable/1817049.
Tkaczynski, A., Rundle-Thiele, S., & Beaumont, N. (2010). Destination Segmentation: A
Recommended Two-Step Approach. Journal of Travel Research, 49(2), 139–152. https://doi.org/10.1177/0047287509336470.
Tourism Division. (2014). Tourism Statistical Bulletin 2013. Dar es Salaam, Tanzania. Tourism Division. (2015a). The 2014 International Visitors Exit Survey Report. Dar es
Salaam, Tanzania. Tourism Division. (2015b). The 2014 Tourism Statistical Bulletin (Vol. 1). Dar es
Salaam, Tanzania. Tourism Division. (2016a). The 2015 International Visitors Exit Survey Report. Dar es
Salaam, Tanzania. Tourism Division. (2016b). The 2015 Tourism Statistical Bulletin. Dar es Salaam,
Tanzania. Turner, P. (2017). Implementing Integrated Marketing Communications (IMC) Through
Major Event Ambassadors. European Journal of Marketing, 51(3), 605–626. https://doi.org/10.1108/EJM-09-2015-0631.
UNWTO. (2007). A Practical Guide to Tourism Destination Management.
https://doi.org/ISBN: 978-92-844-1243. Urbany, J. (1986). An Experimental Examination of the Economics of Information.
Journal of Consumer Research, 13(2), 257–271. Uysal, M., McDonald, C. D., & Reid, L. J. (1990). Sources of Information Used by
International Visitors to US Parks and Natural Areas. Journal of Park and Recreation Administration, 8(1), 51–59.
Vakratsas, D., & Ambler, T. (1999). How Advertising Works: What Do We Really
Know? Journal of Marketing, 63(1), 26–43. https://doi.org/10.2307/1251999.

199
Van Ryzin, G. G. (2013). An Experimental Test of the Expectancy-Disconfirmation Theory of Citizen Satisfaction. Journal of Policy Analysis and Management, 33(3), 597–614.
Vogt, C. A., & Fesenmaier, D. R. (1998). Expanding the Functional Information Search
Model. Annals of Tourism Research, 25(3), 551–578. Vroom, V. H. (1964). Work and Motivation (1st Editio). New York, USA: Wiley. Wang, C., Qu, H., & Hsu, M. K. (2016). Toward an Integrated Model of Tourist
Expectation Formation and Gender Difference. Tourism Management, 54, 58–71. https://doi.org/10.1016/j.tourman.2015.10.009.
Weaver, D., & Brickman, P. (1974). Expectancy, feedback, and disconfirmation as
independent factors in outcome satisfaction. Journal of Personality and Social Psychology, 30(3), 420–428. https://doi.org/10.1037/h0036854.
Weitzman, M. L. (1979). Optimal Search for the Best Alternative. Econometrica, 47(3),
641–654. Retrieved from http://www.jstor.org/stable/1910412. Westbrook, R. A., & Fornell, C. (1979). Patterns of Information Source Usage Among
Durable Goods Buyers. Journal of Marketing Research, 16(3), 303–312. World Economic Forum. (2015). The Travel & Tourism Competitiveness Report 2015.
Geneva. https://doi.org/10.1016/j.annals.2003.12.019. World Travel & Tourism Council. (2013). Travel & Tourism Economic Impact 2014.
The Authority on World Travel & Tourism. Retrieved from http://www.wttc.org/-/media/files/reports/economic impact research/regional reports/world2014.pdf.
Xiang, Z., & Gretzel, U. (2010). Role of Social Media in Online travel Information
Search. Tourism Management, 31(2010), 179–188. https://doi.org/10.1016/j.tourman.2009.02.016.
Young, R. (1981). The Advertising of Consumer Services and the Hierarchy of Effects.
In J. Donnelly & W. George (Eds.), Marketing of Services (pp. 196–199). Chicago, Illinois, USA: American Marketing Association.

200
Yüksel, A., & Yüksel, F. (2001). The Expectancy-Disconfirmation Paradigm: A Critique. Journal of Hospitality & Tourism Research, 25(2), 107–131.
Yuksel, A., Yuksel, F., & Bilim, Y. (2010). Destination Attachment: Effects on Customer
Satisfaction and Cognitive, Affective and Conative Loyalty. Tourism Management, 31(2010), 274–284. https://doi.org/10.1016/j.tourman.2009.03.007.
Zaichkowsky, J. L. (1986). Conceptualizing Involvement. Journal of Advertising, 15(2),
4–14. Retrieved from http://www.jstor.org/stable/4622088. Zaichkowsky, J. L. (1994). The Personal Involvement Inventory: Reduction, Revision,
and Application to Advertising. Journal of Advertising, XXIII(4), 59–70. https://doi.org/10.1080/00913367.1943.10673459.
Zehrer, A., Crotts, J. C., & Magnini, V. P. (2011). The Perceived Usefulness of Blog
Postings: An Extension of the Expectancy-Disconfirmation Paradigm. Tourism Management, 32(2011), 106–113. https://doi.org/10.1016/j.tourman.2010.06.013.
Zeithaml, V. A. (1981). How Consumer Evaluation Processes Differ for Products and
Services. In Marketing of Services (pp. 186–190).