Embed Size (px)
Citation preview

Age and Ageing 1997; 26: 445-455
Influence of dental status on dietaryintake and survival in community-dwelling elderly subjectsILDEBRANDO APPOLLONIO ' •3, CORRADO CARABELLESE2, ALESSANDRA FRATTOLA1, MARCO TRABUCCHI2
'Clinica Neurologica, Universrta di Milano, Ospedale San Gerardo, Monza, Italy2Gruppo di Rjcerca Geriatrica, via Romanino 1, 20123 Brescia, Italy3Casa di Riposo 'Mons. L Biraghi', Cemusco s/N, Milan, Italy
Address correspondence to: C. Carabellese. Fax: (+39) 30 48508. e-mail: [email protected]
AbstractObjective: to evaluate the relationships between a functional measure of dental status (FDS), the nutrients intakeprofile (NIP) and mortality in a community elderly population.Design: cross-sectional analysis for FDS and NIP and a prospective study for mortality.Setting: the central district of Brescia, northern Italy.Participants: of the entire cohort of 70-75-year-old elderly subjects living in the district (n = 1303), 1189 subjectswere interviewed and examined at baseline. Fifty-two of these were lost to follow-up; data are presented for theremaining 1137 subjects.Measurements: baseline data were collected by a door-to-door interview using a standardized questionnairewhich included a section about the dietary intake in the 24 h preceding the interview. The 24-h NIP was calculatedand compared with the US Food and Drug Administration's 1980 Recommended Dietary Allowances to obtain apercentage value of each nutrient for each respondent. The dental examination considered the direct assessment ofthe number and position of residual teeth as well as the use of dentures; subjects were classified into three groups:naturally adequate or naturally inadequate dentition and denture wearers. Association of NIP with FDS wascomputed using ANCOVA and multiple logistic regression models. Mortality data were collected over a 78-monthfollow-up period. Association of survival with FDS was estimated by Kaplan-Meier analysis and multivariate Coxproportional hazard models.Results: multiple logistic regression showed a significant and independent association between the dental statusand the intake of micronutrients, but not of macronutrients. Moreover, denture wearers had a dietary intake verysimilar to adequate dentition and substantially better than inadequate dentition. Inadequate dentition in womenwas associated with higher mortality than adequate dentition. In elderly women, both inadequate dental status andfolate intake •were significant and independent predictors of mortality in a multivariate analysis based on nutritionalparameters. However, inadequate dentition did not remain an independent predictor of mortality in a generalmultivariate model.Conclusion: in this cohort of urban elderly people, FDS is significantly associated with the NIP and indirectly withmortality.
Keywords: dental status, mortality, nutrients intake profile
Introduction Nutritional well-being plays an essential role inhealth promotion and maintenance in older people
Several studies (but not all—see [1] for an opposite [4-8]; thus, it is important to identify the mainview) have documented nutritional inadequacies (both determinants of nutritional status in the elderlydeficiencies and excesses) in older populations [2], population. Dietary habits, food intake and oralalthough the use of different measures of nutritional health changes are important factors, but theirstatus sometimes makes it difficult to compare such reciprocal effects and relationships with overall nutri-studies [3]. tional status are complex and controversial [9, 10]. In
445
Dow
nloaded from https://academ
ic.oup.com/ageing/article/26/6/445/36088 by guest on 24 N
ovember 2021

I. Appollonio et al.
addition, methodological problems and inconsisten-cies among the different studies have clouded this areaof research [9, 11].
Furthermore, the effects of food intake and oralhealth status on the general health and survival of oldpeople have received little attention. Our previousstudies suggest that most daily nutrient intakes (withsome exceptions, e.g. folates) are related to socio-economic and physical factors [12]. Furthermore,dental status is related to education, cognitive functionand a global measure of somatic health represented bythe health service utilization scale [13]. The relation-ships between dietary intake and dental status andeffects on quality of life (QOL) and survival of oldpeople have yet to be unravelled [10]. These are thereasons which prompted us to carry out the presentanalysis.
Subjects and methods
Sample and data collection
The target population was the entire cohort of 70-75-year-old subjects living in the historical centre ofBrescia. All inhabitants in this area and living at homewere considered eligible for inclusion (n = 1303). Thestudy was carried out in two phases. During the firstphase (February-June 1986), data collection wasundertaken using a door-to-door method by 10specifically trained doctors. Of the target population,1189 subjects (91-3%) agreed to answer a multidimen-sional questionnaire and to undergo a standardizedphysical examination, including a comprehensivedental assessment. The reasons for exclusions were(i) refused interview (n = 27) and/or (ii) dentalexamination (n=12); (iii) out of town (n = 65) or(iv) hospitalized (n = 10) during the period of theinquiry. Gender distribution and mean age were nodifferent between included and excluded subjects.Further details about this phase of the study have beenreported previously [14, 15].
In the second phase of the study, the names ofsubjects •who had died after 6V4 years were obtainedfrom the government registry office. The survival statusof 52 subjects (4.4% of the phase 1 sample) could notbe ascertained (mainly because they had moved to adifferent town) and they were excluded. Thus, a finalsample of 1137 elderly people (87.4% of the initialpopulation) constituted the present study. Those lostto follow-up were not statistically different from thestudy sample in terms of age, sex, functional andmental or dental status (see below).
Questionnaire
Several baseline demographic variables were recordedusing a self-report method: age, gender, educational
level, marital status, economic situation and livingconditions "were documented (Table 1).
A number of rating scales were administered cover-ing most of the health-related domains and the maincomponents of QOL [14-16]. We did not consider aspecific oral health-related QOL domain, but used anoverall health-related QOL profile and correlated thiswith a number of functional variables [17, 18], amongwhich there was a functional measure of dental status.
Briefly, the affective domain was evaluated using ascale comprising a revised version of Beck's Depres-sion Inventory plus the Anxiety and Personal Well-being scale [19]. The cognitive function was quantifiedby the Mental Status Questionnaire [20]. Functionalstatus was assessed by the Instrumental Activities ofDaily Living scale [21]. Social relationships were scoredwith linn's self-evaluation of life function (SELF) scale[22]. As both the Instrumental Activities of Daily Livingand the SELF variables (but not Beck's DepressionInventory or the Mental Status Questionnaire) arestrong predictors of mortality in the study population[23], only the former parameters were used.
Somatic health was assessed by three components:health status, health behaviours and health careutilization. In the health status component we checkedfor the presence of 13 different chronic conditions(based on self-report) and subsequently computed thetotal number of these for each respondent. In addition,a standardized list of symptoms was completed byasking about the occurrence of each of them in thepreceding month and ranking those present on a four-level scale. In the present study, we consider two ofthese symptoms, possibly influencing dietary intake—lack of appetite and dyspepsia, dichotomizing theresponses (absent + mild vs moderate + severe).
The health behaviours component incorporates theself-reported level of motor activity, alcohol intake anduse of tobacco products. These behaviours were notcombined.
The health care utilization component "was assessedthrough a scale quantifying health services referrals andphysical complaints during the month before the inter-view. The assessment of physical health status based onuse of medical services is a reasonable method forassessing the health status of elderly people in a uniformand restricted setting [24]. In the study population thisindex is the most important predictor of mortalityamong the above somatic health indicators [23].
Dietary intake
Dietary intake was evaluated by 24-h recall [25].Information was obtained about consumption of food(meals, snacks and drinks) during the day precedingthe interview.
The method is rapid and simple to administer,although it has some disadvantages: (i) it tends tounderestimate caloric intake; (ii) decreased short-term
446
Dow
nloaded from https://academ
ic.oup.com/ageing/article/26/6/445/36088 by guest on 24 N
ovember 2021

Dental status, dietary intake and survival
memory, hearing loss and poor communication skillsmay affect the validity and reliability of information;and (iii) it cannot measure day-to-day variations [26,27]. However, several researchers have reported thatthe 24-h dietary recall method is adequate for obtainingthe mean nutrient intake when the sample size issufficiently large. In addition, 24-h recall has beenfound to be valid when used to compare the dietaryintake of different groups [28-30].
The 24-h nutrient intake was calculated with acomputerized system based on data from the NationalDepartment of Nutrition of Italy [31]. Then, the datawere compared with the. 1980 Recommended DietaryAllowances (RDA), produced by the US Food and DrugAdministration [32] and a percentage value of eachnutrient for each respondent was obtained. Thepercentage dietary intake was computed for calories,proteins, vitamins A, C and B12, thiamine, riboflavin,niacin, folate and iron.
As in other studies [26, 33, 34], two-thirds of theRDA was used as the lower limit for considering
sufficient nutritional intake; although the RDA is notintended to represent individual dietary intake, it isrecommended for population studies.
Categorization of dentitionThe dental examination focused on 'ecologically'relevant impairment. Clinical functioning of teeth hasbeen classified by several indices, including thenumber of sound plus filled teeth [35-37]. However,the relationship between number and position ofretained teeth and functional relevance is uncertain[38]. For example, Leake demonstrated that theabsence of functioning opposing pairs of naturalposterior teeth was the most important factor influen-cing chewing ability [39]; however, the advent ofprocessed foods has made it possible to eat an adequatediet without chewing.
Brocklehurst [40] suggested guidelines for adequate(although not necessarily optimal) functional mastica-tory efficiency, hi particular, he reported that Jackson
Table I. Frequency distributions in the three subgroups for baseline variables
Number (and %), by group2
Variable
GenderMaleFemale
Education (years)0-5>5
Marital statusSingleMarriedWidowed/divorced
Economic conditionsSatisfactorySufficientInsufficient
Living conditionsAloneWith others)
Motor activitiesNoneOccasionalRegular
SmokingYesNoPast
A (n = 287)
96 (33.4)191 (66.6)
58 (20.2)229 (79.8)
50 (17.4)132 (46.0)105 (36.6)
69 (24.2)131 (45.6)87 (30.2)
107 (37.3)180 (62.7)
225 (78.4)49(17.1)13 (4.5)
49(17.1)183 (63.6)55 (19.2)
B (« = 687)
227 (33.0)460 (67.0)
192 (27.9)d
495 (72.1)
142 (20.7)266 (38.7)279 (40.6)
142 (20.6)316(45.9)229 (33.4)
281 (40.9)406(59.1)
568 (82.7)97(14.1)22 (3.2)
171 (24.9)d
375 (54.5)141 (20.6)
C (n = 163)
48 (29.4)115(70.6)
74 (45.4)b' c
89 (54.6)
28 (17.2)b
53 (32.5)82 (50.3)
10(6.1)bc
64 (39.3)89 (54.6)
67(41.1)96 (58.9)
147 (90.2)15 (9.2)1 (0.6)
28 (17.3)104 (636)31 (19.1)
0.9
32.6
11.5
42.2
1.2
11.5
8.8
/•-value
0.640
<0.001
0.021
<0.001
0.549
0.075
0.012
"Group A, naturally adequate dentition; group B, denture wearers; group C, inadequate dentition and no dentures.Significant post boc pair-wise comparisons: bgroup AmC; cgroup BwC; dgroup A u B .
447
Dow
nloaded from https://academ
ic.oup.com/ageing/article/26/6/445/36088 by guest on 24 N
ovember 2021

I. Appollonio et al.
and Murray [41] had set at 16 the lowest acceptablenumber of natural teeth in persons older than 60 for anadequate masticatory function, while Manson [42] hadfurther refined this to 10 teeth in the upper jaw and sixin the lower jaw.
At the end of the dental examination, our physiciansused the latter criteria to classify the elderly subjects intotwo groups (those with or without adequate naturaldentition, respectively). Furthermore, all individualswearing dentures, irrespective of the type as well asthe eventual presence and number of residual naturalteeth, were placed in a third group. This benchmarkstandard of 16 is essentially a normative clinicaljudgment rather than an empirically derived numberthat corresponds to acceptable function and well-being.
Based on the above criteria, the 1137 subjects weresubdivided into: (i) group A—287 subjects (25.2%)whose dental status was considered adequate withoutthe use of dentures; (ii) group B—687 subjects (60.4%)who were wearing dentures (either partial or com-plete); and (iif) group C—163 subjects (14.3%) with aninadequate natural dental status and not using dentures.
Of the 52 subjects lost to follow-up, the correspond-ing values were 25% (n = 13), 67.3% («= 35) and 8.3%(n — 4), respectively. These did not differ from thestudy sample (x2 = 1.952, d.f. = 2, P = 0.377).
Data analysis
The SPSS package was used [43] for statistical analysis.
Univariate analysis
The frequency distribution of all relevant ordinalvariables were examined, whereas continuous vari-ables were initially evaluated by standard descriptivemeasures (mean, SD).
Comparisons among the three groups defined on thebasis of the dental status were computed usingcontingency tables and the x2 statistics for ordinalvariables. Given that the three groups were notbalanced in terms of years of formal education andself-reported income, one-way analysis of covariance(ANCOVA) was performed for continuous variables,using the above demographic variables as covariates.Where appropriate, ANCOVA was subsequently fol-lowed by post hoc pair-wise analysis, adjusted formultiple comparisons (the least-significance differenceand the Bonferroni procedures, both embedded intoSPSS ANOVA, were employed).
In addition, crude survival by dental status wasinitially explored by the Kaplan-Meier method andoverall differences among levels were tested with thelog rank test; post hoc pair-wise comparisons weresubsequently computed.
Multivariate analysis
Dental conditions were subsequently entered into
multivariate models together with the nutritional andQOL indexes. Because of the large number of variablesconsidered, we required univariate associationsentered into multivariate models to be significant ator above the P< 0.05 level.
The values of independent variables of a categoricalnature were recoded and dummy variables created.The number of new variables required in this case isone less than the number of categories. Within SPSS,the logistic regression procedure automatically createsnew variables for variables declared as categorical andthe choice is about the type of coding scheme and thetype of contrast to apply. We used the so-called'indicator-variable' coding scheme by virtue of whichthe coefficients for the new variables represent theeffect of each category compared with a referencecategory (the coefficient for the latter is set to 0).
Using this coding scheme, the interpretation of theresulting coefficients for two-category variables, suchas sex, is straightforward because it tells the differencebetween the log odds when a case is a member of the'reference' category and when it is not. In case ofvariables that have more than two categories, the onlystatement which can be made about the effect of aparticular category is in comparison with the corre-sponding reference category. Using this codingscheme, we were able to analyse all dental categoriestogether, by transformation into a dummy variable withone subgroup as the reference category.
The backward step-wise logistic regression proce-dure was employed to arrive at the final models; theiterative maximum likelihood method was employed.Backward elimination starts with all chosen variables inthe model. Then, at each step, variables are evaluatedfor entry and removal; SPSS always uses the scorestatistic for determining whether variables should beentered into the model (at the P<0.05 level), butvarious statistics are available to select variables forremoval and for this we employed the Wald statistic (atthe P < 0.1 level). Using these relatively lax significantlevels, the final models contain all variables remainingunder the P < 0.1 level.
Regression coefficients (fc) were converted to oddsratios (ORs) for ease of reading (OR = e6). In addition,95% confidence intervals (95% CD were constructedby transformation of the asymptotic confidence inter-val about the regression coefficient (eb ~ ' •96sm>y).Apredictor was considered statistically significant whenits 95% CI excluded unity.
Cox's proportional hazard models were employed toassess differential survival by dental status withadjustment for confounders. The assumption of base-line hazard functions being proportional was checkedwith log-minus-log survival plots, where survivalcurves by dental status were linear and remarkablyparallel, indicating proportionality of hazards. Adjustedsurvival curves by dental status were graphicallyrepresented by plotting the estimated cumulative
448
Dow
nloaded from https://academ
ic.oup.com/ageing/article/26/6/445/36088 by guest on 24 N
ovember 2021

Dental status, dietary intake and survival
survival functions as computed at the mean values ofcovariates from the adjusted Cox model. The measureof association in Cox models was the relative risk (RR)and its 95% CI; significant values on Wald statistic werealso computed.
Results
Dental status and baseline variables
The overall comparisons based on the frequencydistributions among the three groups in the demo-graphic parameters and in the health behaviourcomponent of health status are reported in Table 1:education, economic situation, marital status andsmoking had a significantly different distribution. Posthoc tests revealed better education in group A than inboth other groups, a higher prevalence of marriedsubjects in group A (vs group C only) and a lowerprevalence of smoking in group A (vs group B only).Groups B and C differed significantly for number ofyears of formal education and economic conditions,with those in group B having more years of educationand better economic conditions.
Figure 1 shows the frequency distribution forgastrointestinal symptoms: the percentage of subjectsreporting low appetite or complaining of dyspepsia•was significantly higher in group C than in the othertwo groups. By contrast, frequency distribution wassimilar for groups A and B.
10
r • Q r o u p AE2 Group BEZ3 Group C
47.9*
Poor Appetite Dyspepsia
Figure I. Frequency distribution for the symptoms'poor appetite' and 'dyspepsia' in the dentate groups:A, adequate dentition; B, use of dentures; and C,inadequate dental status and no dentures. Numbersabove each bar are the corresponding percentages ofsubjects whose answers were in the moderate orsevere ranking. **P< 0.01 and ***P< 0.001 at the overallcomparison among the three groups. Post hoc pair-wise comparisons—group C vs A: for poor appetite,X2 = 955, P = 0.002; for dyspepsia, * 2 = 16.87, p<0.0001; group C vs B: for poor appetite, x2 = 10.55,P= 0.001; for dyspepsia, \2= 13.10, P < 0.001; groupB vs A: for poor appetite, x2 = 0.l4, p = 0.706; fordyspepsia, \ — 1-64. /*= 0.201.
An ANCOVA procedure considering, as covariates,the demographic variables differently distributedamong the three groups (e.g. education and income)was used for the remaining somatic health compo-nents. The score at the health care utilization scalewas significantly different (group A, 57 ± 1.6; group B,5.9 ± 1.9; group C, 6.4 ± 2.3; F= 4.3, <*/ = 2, 2, 1132;P — 0.013), whereas the mean number of reportedchronic diseases/conditions was similar in the threegroups (group A, 2.4 ± 1.4; group B, 2.4 ± 1.4; groupC, 2.7 ± 1.4; F=1.5, d.f.=2, 2, 1132; i>=0.229).Adjusted post hoc pair-wise tests showed a significantlymore frequent use of health services in group Ccompared with both the other groups (which did notdiffer from each other).
Dental status and nutritional intake
Univariate analysis
Figure 2 shows the percentage of men and womenwhose daily nutrient intakes are below two-thirds ofthe 1980 RDA. On the whole, as already reported [15],90% of the older people had an inadequate intake offolates, thiamine and vitamin B6, while 30-40% had adeficient intake of the other vitamins and iron andabout 10% had an inadequate protein intake.
The corresponding mean percentages (± SD) ofnutrient intake by dental status is reported in Table 2:with the exception of thiamine, an overall significantdifference between the three groups is present foreach nutrient at the ANCOVA (considering educationand income as covariates). Post hoc tests demonstratedthat group C differed from both the other groups in allnutrients, whereas group B had lower mean percentileintake than group A only for folates, vitamin A andvitamin C.
Calories
Iron
Foiate
Vitamin B12
Vitamin B6
Nadn
TWamtn
VitamlnC
Vitamin A
Protein
T7777777.
19.27ZZZ2\0i
148.7
l<Uft
119
iizas
—I»J?
v/vy<y<yyi40.7
1 1 1 1 1
V/S//S//n B7 J
• Women
I i I I
0 10 2 0 3 0 4 0 5 0 6 0 7 0 8 0 9 0 100Percentage
Figure 2. Percentages (numbers by each bar) of subjectswith daily intake less than two-thirds of the US Foodand Drug Administration's 1980 Recommended DietaryAllowances by gender.
449
Dow
nloaded from https://academ
ic.oup.com/ageing/article/26/6/445/36088 by guest on 24 N
ovember 2021

I. Appollonio et al.
Table 2. Mean percentage of nutrient intakes by dental status
Nutrient
Vitamin CVitamin AVitamin B6Vitamin B12NiacinThiamineProteinsCaloriesIronFolic acid
Mean ( ± SD)
Adequate(n = 287)
85.2 ± 50.691.4 ± 30.147.0 ± 13.872.4 ± 30.475.2 ± 23.346.4 ± 139
104.5 ± 27.963.5 ± 15.877.1 ± 18.920.6 ± 5.3
daily consumption*, by dentition
Denture wearer(n = 687)
74.1 ± 43.3d
82.1 ± 31.7"44.9 ± 14.372.2 ± 31.073.6 ± 24.147.2 ± 14.0
102.4 ± 30.562.5 ± 16.975.0 ± 19-519.5 ± 5.741
Inadequate(n = 163)
66.8 ± 50.2b
72.0 ± 35.3b| c
40.2 ± I6.3b | c
66.4 ± 33968.4 ± 27.5b' c
44.8 ± 16.195.8 ± 3 5 . 1 b c
57.4 ± 20.0b> c
67.5 ± 23.1bl c
17.3 ± 6.3b' c
F-ANCOVA(d.f. = 2, 2, 1132)
5.5"14.5*"7.7*"1.53.2*1.93.7'5.5"6.7"
11.3"*
"As a percentage of US Food and Drug Administration Recommended Dietary Allowances.Significant post hoc pair-wise comparisons for group A (naturally adequate dentition), group B (denture wearers) and group C (Inadequatedentition and no dentures): bgroup A vs C; cgroup BKSC; dgroup A vs B.Both overall and pair-wise comparisons have been covariate for the demographic variables (economic situation and educational level): *P < 0.05;**P < 0.01; ***P < 0.001 at the overall comparison among the three groups. All others were non-significant.
Multivariate analysis
Using the backward step-wise method, we built upthree multiple logistic regression models in order toidentify if any intake index was significantly andindependently associated with the dental status. Thefirst model (Table 3A) considers groups A and C andshows that the variables remaining significant andindependent predictors of the dental status areeducational level, economic situation, percentageintake of vitamins A and B6 and the symptom ofdyspepsia. The second model (Table 3B) takes intoaccount groups B and C and shows quite similarresults: education, economic condition, intake ofvitamin B6, niacin and folates and dyspepsia remainsignificantly and independently different between thetwo groups. The third model (Table 3C) considersgroups A and B and shows that only education andintake of vitamin A are independently differentbetween the two groups.
Dental status and survival
Univariate analysis
After 6 years 19.4% of the elderly subjects in group Awere alive, the corresponding percentages for groups Band C were 73-6 and 68.7% respectively and overallcrude association of dental status with survival, asassessed with the Kaplan-Meier method, was signifi-cant (log rank test: x2 = 6.80, d.f. = 2, P < 0.05).
However, gender played a significant role onsurvival: 80.2% of women compared with 62.5% ofmen were alive after 6 years: the crude associationbetween gender and survival was significant (log rank
test: x2 = 45.97, df. = l,P< 0.001). Furthermore, afterstratifying this association by dental status, thesignificant gender difference for survival appearedparticularly evident in the groups A and B (log ranktest: x2=13.1, d.f. = l, P<0.001 and x2 = 30.5, d.f.=1, P < 0.0001, respectively), whereas it was onlymarginally significant for group C (log rank test:X2 = 5.65, df. = 1,^ = 0.05).
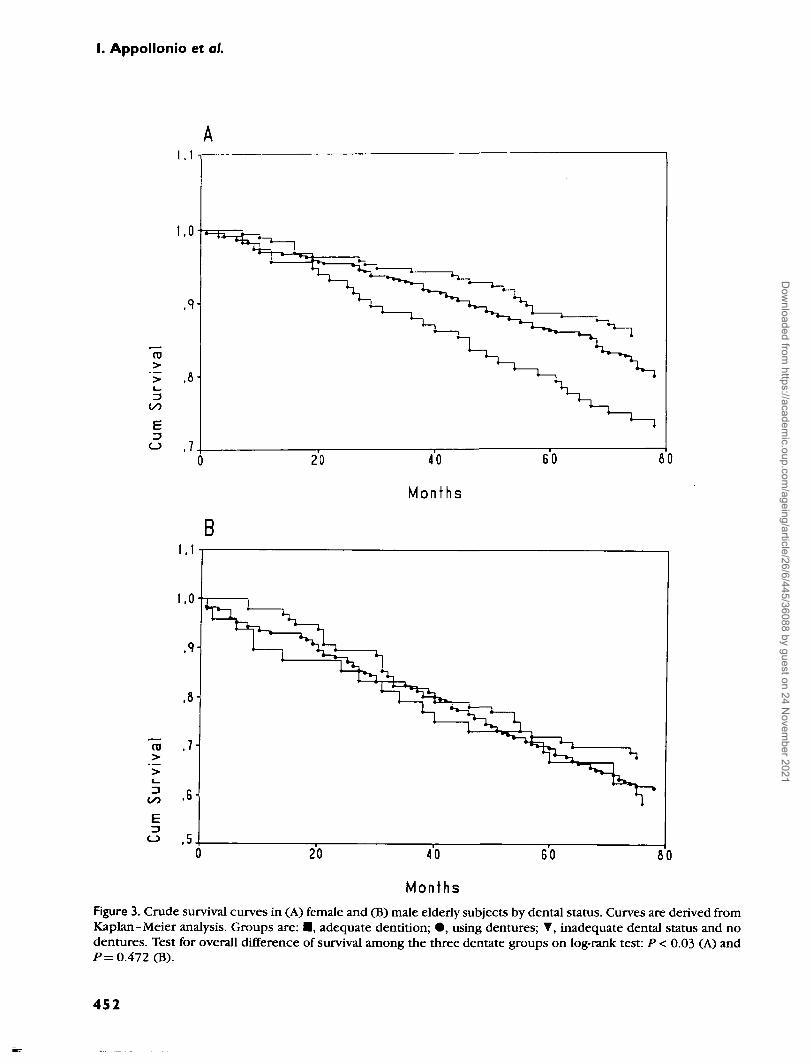
Thus, the analysis of the crude association betweendental status and survival was at this point stratified bygender (Figure 3) and survival curves were significantlydifferent in relation to the dental status in women (logrank test: x2 = 7.23; d.f. = 2; P < 0.03), but not in men(log rank test: x 2 = l -52; d.f.=2; P=O.4J). Post hocpair-wise comparisons detected a significant differencebetween female subgroups A and C (log rank test:X2 = 7.26; d.f. = \, P < 0.01) and a trend betweenfemale subgroups B and C Cog rank test: x2 — 2.80;df. = \, P=0.09), but a substantial overlap betweenfemale subgroups A and B (log rank test: x2 = 2.65;d.f = l,P=0.1O).
Multivariate analysis
Multivariate Cox regression models, including onlywomen, were done to control the role of dental statuson survival for the effects of possible confounders.Mortality was the dependent variable and the back-ward stepwise method was chosen.
In the first model, we entered the dental status (withgroup C as the reference category) and the 10nutritional parameters as independent variables. Inthis model, only two parameters remained significantlyand independently related to mortality: the dental
450
Dow
nloaded from https://academ
ic.oup.com/ageing/article/26/6/445/36088 by guest on 24 N
ovember 2021

Dental status, dietary intake and survival
Table 3. Multiple logistic regression analysis for the dentate status adjusted for the demographic and nutritionalvariables and including (a) groups A and C, (b) groups B and C and (c) groups A and B
Variable
(a) Groups A (adequateEducationEconomic situationVitamin AVitamin B6ProteinsDyspepsiaResidual \2
B
dentition) and-0.528
0.618-0.016-0.042
0.0180.392
(b) Groups B (denture wearers) and CEducationEconomic situationVitamin B6NiacinFolic acidHCU scaleDyspepsiaResidual \2
(c) Groups A (adequateEducationVitamin AResidual \2
-0.2830.632
-0.0420.022
-0.0370.0740.282
dentition) and-0.271-0.009
RR95% confidenceinterval for RR
C (inadequate dentition)"0.5901.8550.9840.9591.0181.4806.963 (d.f.= 7)
(inadequate dentition)1
0.7531.8820.9591.0230.9631.0771.3265.258 (fLf.= 7)
B (denture wearers)0
0.7620.9914.118 (<i/ = 7)
0.48-0.731.33-2.590.98-0.990.93-0.981.00-1.031.11-1.97
0.63-0.901.43-2.480.92-0.991.00-1.040.93-1.000.99-1.171.06-1.65
0.68-0.850.98-0.99
/"-value
<0.001<0.001<0.001
0.0020.0920.0070.433
0.003<0.001
0.0240.0360.0430.0680.0120.629
<0.001<0.001
0.249
HCU, health care utilization.•Variables excluded during the backward procedure: vitamin C, niacin, iron, calories, folates, HCU scale and the symptom 'lack of appetite'.'Variables excluded during the backward procedure: vitamins A and C, thiamine, iron, proteins, calories and the symptom 'poor appetite'.cVariables excluded during the backward procedure: vitamin C, folates, HCU scale and smoking.
status (specifically, group A vs group C: RR = 0.57, 95%CI = 0.34-0.95, Wald = 4.609, P= 0.032) and thefolate intake (RR = 0.96, 95% CI = 0.94-0.99, Wald =8.975, P= 0.003).
At this point, a very general survival model wascreated where the dental status and the folate intakewere entered together with the demographic, somatichealth and QOL parameters which were already knownfrom previous studies [44] to be significantly andindependently associated with mortality in our sample(e.g. smoking, functional status, social relationshipsand the health service utilization scale). Table 4presents this model.
All the entered parameters now survived the multi-variate computation, with the exceptions of the dentaland the functional status.
Discussion
The results from this study can be summarized asfollows: (i) there is a significant association betweenthe functionally defined dental status and the dietaryintake, particularly of micronutrients; (ii) amongnutritional variables, inadequate dental status andfolate intake are independent predictors of mortality
at 6 years, at least in women; (iii) in elderly people whowear dentures there is a significantly higher nutrientintake than in subjects with inadequate dental status,although they do not completely overlap with the foodintake profile shown by those with naturally adequatedentition; (iv) the relationship between dentures andmortality remains ill-denned.
Unlike older inconsistent data [45], recent studiesagree that dental status and dietary intake aresignificantly and reciprocally correlated [10, 46-48].
This is true for micronutrients (vitamins and miner-als), but less true for macronutrients and for overallenergy intake [2, 49]; accordingly, in our populationthe protein and the caloric intakes did not enter eitherone of the final regression models. Micronutrients arepresent in fruits and vegetables; thus, it is possible thatthe above correlation might be due to the preferentialchoice of predominantly soft, easy-to-chew foodsby edentulous elderly subjects. Masticatory abilitydeteriorates with the loss of teeth [10, 46, 50, 51],whereas ageing per se only slightly decreases chewingefficiency.
However the masticatory ability cannot be consid-ered to be a unique intermediate factor acting betweendental status and dietary intake. Although restorative
451
Dow
nloaded from https://academ
ic.oup.com/ageing/article/26/6/445/36088 by guest on 24 N
ovember 2021
I. Appollonio et al.
>>
O
>">
,7
B
MonthsFigure 3. Crude survival curves in (A) female and (B) male elderiy subjects by dental status. Curves are derived fromKaplan-Meier analysis. Groups are: • , adequate dentition; • , using dentures; T, inadequate dental status and nodentures. Test for overall difference of survival among the three dentate groups on log-rank test: P < 0.03 (A) andP= 0.472 (B).
452
Dow
nloaded from https://academ
ic.oup.com/ageing/article/26/6/445/36088 by guest on 24 N
ovember 2021

Dental status, dietary intake and survival
Table 4. Survival in female elderly subjects by dental status in Cox regression models.
Variable
UnadjustedDental status
Group A vs CGroup B vs C
RR
0.5000.709
Adjustment for nutrient intakeDental status
Group A vs CGroup B vs C
Folic acidOverall adjustmentDental status
Group A vs CGroup B r a C
Folic acidAssessment scale3
HCUSELFIADL
SmokingNever vs actualPrevious vs actual
0.5660.7630.961
0.6730.8270.971
1.1300.9761.574
0.5620.965
95% CI for RR
7.0550.30-0.830.47-1.06
4.6090.34-0.950.50-1.150.94-0.98
2.1010.39-1150.54-1.270.94-0.99
1.05-1.220.95-0.990.58-4.29
0.37-0.840.56-1.67
Wald statistics
0.0297.0462.752
0.0994.6091.6758.975
0.3502.0990.7674.317
11.4734.3370.788
10.4177.7380.017
P-value
0.0080.097
0.0320.1960.003
0.1470.3810.038
<0.0010.0370.3750.0050.0050.897
CI, confidence interval; RR, relative risk; /"-value: significance at the Wald statistics.The model adjusted for nutrient intake includes all the nutrient variables as covariates; apart from folates, the other nutrientvariables are not significant (data not shown)."HCU, health care utilization; IADL, Instrumental Activities of Daily Living; SELF, self-evaluation of life function.
prosthetic therapy can lead to improvement inmasticatory function, bite force in complete denturewearers remains substantially lower than in dentatesubjects [50, 52]. In addition, denture wearers perceivetheir dentures as interfering with chewing ability [53,54]. Thus, an inadequate dietary intake might beexpected in denture wearers, too; but in the presentstudy this group had a significantly more adequateintake for micronutrients than edentulous subjects.Such a result is not an isolated finding [55-58].
Food selection is influenced not only by chewingability but also by the texture of food item, changesresulting from industrial processing and the alteredtaste perception associated with ageing [50, 59-62].Moreover, dietary habits are influenced by cultural,social and medical factors [2,46]. In our population theeducational level and the economic condition played arole in influencing nutrient intake: these demographicindices entered all three final nutritional models.Finally, the connection between food intake anddental status is bi-directional. Just as poor healthstatus affects food choices, inadequate nutrition canaffect the oral health [48]: at every age, an adequatesupply of nutrients is necessary to maintain optimaloral health [47].
Given these complex interrelations between dental
status, chewing ability and dietary intake, it is notsurprising that their respective relationships withnutritional and general health status and, ultimately,with survival in elderly people are unclear.
It has been shown that food intake is correlated withmortality in community-dwelling, healthy older people[12] and in frail, nursing-home-resident subjects [63].Chewing problems have been correlated with dimin-ished protein and caloric intake [57] and, morerecently, with sensitive and specific indicators ofprotein-energy undernutrition, such as body massindex and weight loss [64].
Nutritional status is widely considered a prognosticdeterminant of health status and survival in old age[65-68]. However, studies in this field are few andhave mainly focused on nursing-home residents, ratherthan community-dwelling individuals [69, 70]. Further-more, the nutritional status cannot probably beconsidered the unique intermediate factor betweenfood intake and mortality. In fact, non-dietary factors,such as socio-economic conditions and physical health,played an important intermediate role between foodintake and mortality in the study by Magni et al. [12],while Frisoni et al found neither somatic health nornutritional assessment to be as predictive as foodintake for mortality [63].
453
Dow
nloaded from https://academ
ic.oup.com/ageing/article/26/6/445/36088 by guest on 24 N
ovember 2021

I. Appollonio et al.
It is not known how often the changes in dietaryhabits and food intake contribute to the development ofprotein-energy undemutrition in elderly people [9, 10].
Overall, data both from the present study and from aparallel [13] investigation confirm the intuitive notionof close inter-relations between a functionally denneddental status and nutrient intake. One marker forsuccessful ageing is the maintenance of a natural,healthy and functional dentition which confers bothsocial and biological benefits, including aesthetics, self-esteem, comfort and the ability to chew, taste, speakand eat.
Finally, they support the notion that any effort inproviding and using dentures is worthwhile as dentalprostheses can help improve both nutrient intake andQOL.
Thus, health professionals should consider theassociation between the oral cavity and generalhealth. Oral health issues have long been neglectedby all but specialists in gerodontology [71]. Several oralhealth assessments have recently appeared, such as theGeriatric Oral Health Assessment Index [72], the OralHealth Impact Profile [73] and the Decayed, Missing,Filled Teeth Index [74] and simple and inexpensivescreening instruments for promoting dental referrals inolder adults [75].
We urge further links between dentistry andgerontology [76]; this development is important fordental treatment, health care policy, and health andallied health care professional training.
Key points• A functionally inadequate dental status has a
detrimental impact upon the dietary intake ofcommunity-dwelling elderly subjects.
• The use of dentures is able to counteract such effectand is associated with a satisfactory dietary intake.
• Dental status is among the major nutritionalpredictors of long-term mortality, although itscontribution becomes less significant in moregeneral models.
References1. Chapman KM, Ham JO, Pearlman RA. Longitudinalassessment of the nutritional status of elderly veterans.J Gerontol 1996; 51A: B261-9.
2. Posner BM, Jette A, Smigelski C, Miller D, Mitchell PNutritional risk in New England elders. J Gerontol 1994; 49:M123-32.
3. Morgan DB, Newton HM, Jewitt MA, Hancock MR, HullinRP. Abnormal indices of nutrition in the elderly: a study ofdifferent clinical groups. Age Ageing 1986; 15: 65-76.
4. Exton-Smith AN, Stanton BR, Report of an investigationinto the dietary of elderly women living alone. London: KingEdward's Hospital Fund, 1965.
5. Stanton BR, Exton-Smith AN. Longitudinal study of thedietary of elderly women. London: King Edward's HospitalFund, 1970.
6. US Department of Health, Education and Welfare. Healthypeople: the Surgeon General's report on health promotion anddisease prevention. DHEW Publication No. (PHS) 79-55071.Washington, DC: US Government Printing Office, 1979; 71 -80.
7. US Department of Health and Human Services. PublicHealth Service, the Surgeon General's report on nutrition andhealth. Washington, DC: US Government Printing Office,1988; 616-7.
8. Potter J, Klipstein K, Reilly JJ, Roberts M The nutritionalstatus and clinical course of acute admission to a geriatricunit. Age Ageing 1985; 24: 131-8.
9. Sullivan DH, Martin W, Flaxman N, Hagen JE. Oral healthproblems and involuntary weight loss in a population of frailelderly. J Am Geriatr Soc 1993; 41: 725-31.
10. Ship JA, Duffy V, Jones JA, Langmore S. Geriatric oralhealth and its impact on eating. J Am Geriatr Soc 1996; 44:456-64.
11. Carlos JP, Wolfe MD. Methodological and nutritionalissues in assessing the oral health of aged subjects. Am J ClinNutr 1989; 50: 1210-3.
12. Magni E, Bianchetti A, Rozzini R, Trabucchi M. Influenceof nutritional intake on 6-year mortality in an Italian elderlypopulation. J Nutr Elderly 1994; 13: 25-34.
13. Appollonio I, Carabellese C, Frattola L, Trabucchi M.Dental status and the quality of life in a community elderlypopulation. A multivariate approach. J Am Geriatr Soc (inpress).
14. Rozzini R, Bianchetti A, Carabellese C, Inzoli MR,Trabucchi M. Depression, life events and somatic symptoms.Gcrontologist 1988; 28: 229-33.
15. Bianchetti A, Rozzini R, Carabellese C, Zanetti O,Trabucchi M. Nutritional intake, socioeconomic conditionsand health status in a large elderly population. J Am GeriatrSoc 1990; 38: 521-6.
16. Carabellese C, Appollonio I, Rozzini R, Frattola L,Trabucchi M. Sensory impairment and quality of life in acommunity elderly population. J Am Geriatr Soc 1993; 41:401-7.
17. Appollonio I, Carabellese C, Frattola L, Trabucchi M.Effects of sensory aids on quality of life and mortality in theelderly. A multivariate analysis. Age Ageing 1996; 25: 89-96.
18. Appollonio I, Carabellese C, Magni E, Frattola L,Trabucchi M. Sensory impairments and mortality in an elderlycommunity population: a six year follow-up study. AgeAgeing 1995; 24: 30-6.
19. Kane RL, Bell R, Riegher A, Wilson A, Kane RA. Assessingthe outcomes of nursing home patients. J Gerontol 1983; 38:385-93.20. Kahn RL, Goldfarb AI, Pollock M, Peck A. Brief objectivemeasure for the determination of mental status in the aged.AmJ Psychiatry I960; 117: 326-8.
21. Lawton MP, Brody EM. Assessment of older people: self-maintaining and instrumental activities of daily living.Gerontologist 1969; 9: 176-86.
454
Dow
nloaded from https://academ
ic.oup.com/ageing/article/26/6/445/36088 by guest on 24 N
ovember 2021

Dental status, dietary intake and survival
22. linn MW, linn BS. Selfevaluation of life function (Self)scale: a short comprehensive self-report of health for elderlyadults. J Gerontol 1984; 39: 603-12.
23. Magni E, Bianchetti A, Rozzini R, Trabucchi M. Physicalhealth indexes and mortality in a 70 to 75 year old Italianpopulation living at home: a 6 year follow -up study. J Cross-Cultural Gerontol 1994; 9: 77-85.
24. Fillenbaum GG. The well-being of the elderly.Approaches to multidimensional assessment. World HealthOrganisation Offset Publication no. 84. Geneva: World HealthOrganization, 1985.
25. National Center for Health Statistic Dietary intake sourcedata: United States, 1971-74. DHEW Publication no. (PHS)79-1221. Hyattsville, MD: National Center for HealthStatistics, 1979.
26. Berts NM, Vivian VM. Factors related to the dietaryadequacy of non-institutionalized elderly. J Nutr Elderly 1985;4: 3-10.
27. Bowman BB, Rosenberg IH. Assessment of the nutri-tional status of the elderly. Am J Clin Nutr 1982; 35: 1280-7.
28. Young CM, Hagen GC, Tuvker RE, Foster WD. Acomparison of dietary study methods, n Dietary history vsseven-day record vs 24-hour recall. J Am Diet Assoc 1952; 28:218-21.
29. Madden JP, Goodwin SJ, Guthrie H. Validity of 24-hourrecall. J Am Diet Assoc 1976; 68: 143-5.
30. Gersovits M, Madden JD, Wright HS. Validity of the24-hour recall and seven-day records for group comparisons.J Am Diet Assoc 1979; 48: 73-8.
31. Istituto Nazionale della Nutrizione. Tabelle di Composi-zione degli Alimenti. Rome: Istituto Nazionale della Nutrizione,1983.
32. Food and Nutritional Board. Recommended DietaryAllowances, 9th ed. Washington DC: National Academy ofSciences, 1980.
33- Davis MA, Randall E, Forthofer RN, Lee ES, Margen S.Living arrangements and dietary patterns of older adults inthe United States. J Gerontol 1985; 40: 434-42.
34. Kunkel ME, Chesnut CK, Hoover JLB, Roughead ZK.Nutritional and dental status of title HI meal recipients. J NutrElderly 1987; 6: 17-23.
35. Ettinger RL Oral disease and its effect on the quality oflife. Gerodontics 1987; 3: 103-6.
36. Sheiham A, Maizels JE, Maizels A. New compositeindicators of dental health. Community Dent Health 1987;4:407-14.
37. Sheiham A, Maizels JE, Cushing A. The concept of needin dentistry. Int Dent J 1982; 32: 265-70.
38. Gift HC, Atchison KA. Oral health, health and health-related quality of life. Med Care 1995; 33 (suppl): NS57-77.
39- Leake JL. An index of chewing ability. J Public HealthDent 1990; 50: 262-7.
40. Brocklehurst JC. Trattato di Geriatria e G-erontologia.(2nd Italian edition). Padova: Piccin Press, 1983.
41. Jackson D, Murray J. The loss of teeth in dentatepopulations. Dent Practr Dent Res 1972; 22: 186-9.
42. Manson JD. The elderly dental cripple. Proc R Soc Med1973; 66: 597-8.
43. SPSS Inc. Statistical Package for the Social Sciences.Release 6.0. Chicago: SPSS, 1993.
44. Magni E, Bianchetti A, Rozzini R, Trabucchi M. Predictorsof mortality in a 70 to 75 year old Italian population living athome. J Mental Health Aging (in press).
45. Geissler CA, Bates JE The nutritional effects of tooth loss.Am J Cl Nutr 1984; 39: 478-82.
46. Nordstrom G. The impact of socio-medical factors andoral status on dietary intake in the eighth decade of life. Aging1990; 2: 371-85.
47. Knapp A. Nutritional and oral health in the elderly. DentClin North Am 1989; 33: 109-25.
48. Pla GW Oral health and nutrition. Prim Care 1994; 21:121-33.
49. May H, Reader R, Murphy S, Khaw K. Self-reported toothloss and bone mineral density in older men and women. AgeAgeing 1985; 24: 217-21.
50. Wayler AH, Chauncey HH. Impact of complete denturesand impaired natural dentition on masticatory performanceand food choice in healthy aging men. J Prosthet Dent 1983;49: 427-33.
51. Ekelund R. Dental state and subjective chewing ability ofinstitutionalized elderly people. Comm Dent Oral Epidemiol1989; 17: 24-7.
52. Haraldsson T, Karlsson U, Carlsson GE. Bite force andoral function in complete denture wearers. J Oral Rehabil1979; 6: 41-8.
53. Kressin N, Jones J, Hayes C. Oral health status and qualityof life. J Dent Res (abstract) 1988; 67: 267.
54. Agerberg G, Carlsson GE. Chewing ability in relation todental and general health. Analyses of data obtained from aquestionnaire. Acta Odontol Scand 1981; 39: 147-53.
55. Ranta K, Tuominen R, Paunio I, Seppanen R. Dentalstatus and intake of food items among an adult Finnishpopulation. Gerodontics 1998; 4: 32-5.
56. Makila E. Carbohydrate and fat consumption and intakeof food and energy before and after wearing completedentures. Suom Hammaslaak Toim 1970; 66: 11-5.
57. Gordon SR, Kelley SL, Sybyl JR, Mill M, Kramer A,Jahnigen DW. Relationship in very elderly veterans ofnutritional status, self-perceived chewing ability, dentalstatus and social isolation. J Am Geriatr Soc 1985; 33: 334-9.
58. Greksa LP, Parraga IM, Clark CA. The dietary adequacy ofedentulous older adults. J Prosthet Dent 1995; 73: 142-5.
59- Kapur KK, Wallace S, Conway C. Functional taste andfood intake changes with aging. In: Toga CJ, Nandy K,Chauncey HH, eds. Geriatric Dentistry. Lexington, MA: DCHealth and Co., 1979; 147.
60. Massler M. Geriatric nutrition: the role of taste and smellin appetite [Abstract]. J Prosthet Dent 1980; 43: 247.
61. Ernest SL Dietary intake, food preferences, stimulatorysalivary flow rate and masticatory ability in older adults withcomplete dentition. Spec Care Dentist 1993; 13: 102-6.
455
Dow
nloaded from https://academ
ic.oup.com/ageing/article/26/6/445/36088 by guest on 24 N
ovember 2021

I. Appollonio et al.
62. de Graaf C, Polet P, van Staveren WA. Sensory perceptionand pleasantness of food flavors in elderly subjects. J Gerontol1994; 49: P93-9.
63. Frisoni G, Franzoni S, Rozzini R, Ferrucci L, Boffelli S,Trabucchi M. Food intake and mortality in the frail elderly.J Gerontol 1995; 50A: M2O3-1O.
64. Blaum CS, Fries BE, Fiatarone MA. Factors associatedwith low body mass index and weight loss in nursing homeresidents. J Gerontol 1995; 50A: Ml62-8.
65. Verdery RB, Goldberg AE Hypocholesterolemia as apredictor of death: a prospective study of 224 nursing homeresidents. J C-crontol 1991; 46: M84-90.
66. Rudman D, Feller AG. Protein-caloric undernutrition inthe nursing home. J Am Geriatr Soc 1989; 37: 173-83.
67. Manila K, Haavisto M, Rajala S. Body mass index andmortality in the elderly. Br Med J 1986; 292: 867-8.
68. Constants T, Bacq Y, Brechot JF, Guilmot JL, Choutet P,Lamisse F. Protein-energy malnutrition in elderly medicalpatients. J Am Geriatr Soc 1992; 40: 263-8.
69. Lewis FJ, Stacey JB. Nutritional assessment of the elderly.In: Morley JE, Glick Z, Rubenstein LZ, eds. GeriatricNutrition. New York: Raven Press, 1990; 73-87.
70. Keller HH. Malnutrition and institutionalized elderly.How and why? J Am Geriatr Soc 1993; 41: 1212-8.
71. Kalk W, De-Baat C, Meeuwissen JH. Is there a need forgerodontology? Int Dent J 1992; 42: 209-16.
72. Atchison KA, Dolan TA. Development of the GeriatricOral Health Assessment Index. J Dent Educ 1990; 54:680-686.
73. Locker D, Slade G. Oral health and the quality of lifeamong older adults: The oral health impact profile. J CanDent Assoc 1993; 59: 830-3.
74. World Health Organisation. Oral Health Surveys: basicmethods, 3rd edition. Geneva: World Health Organisation1987.
75. Bush LA, Horenkamp N, Morley JE, Spiro III A. DENTAL: arapid self-administered instrument to promote referrals forfurther evaluation in older adults. J Am Geriatr Soc 1996; 44:979-81.
76. Baum BJ. Oral health for die older patient. J Am GeriatrSoc 1996; 44: 997-8.
Received 16 January 1997
456
Dow
nloaded from https://academ
ic.oup.com/ageing/article/26/6/445/36088 by guest on 24 N
ovember 2021