Embed Size (px)
Citation preview
− 87 −
Bulletin of the Geological Survey of Japan, vol. 68 (3), p. 87–110, 2017
Influence of different sedimentary environments on multi-elemental marine geochemical maps of the Pacific Ocean and Sea of Japan, Tohoku region
Atsuyuki Ohta1,*, Noboru Imai1, Yoshiko Tachibana1, Ken Ikehara1, Hajime Katayama1 and Takeshi Nakajima2
Atsuyuki Ohta, Noboru Imai, Yoshiko Tachibana, Ken Ikehara, Hajime Katayama and Takeshi Nakajima (2017) Influence of different sedimentary environments on multi-elemental marine geochemical maps of the Pacific Ocean and Sea of Japan, Tohoku region. Bull. Geol. Surv. Japan, vol. 68 (3), p. 87–110, 9 figs, 5 tables.
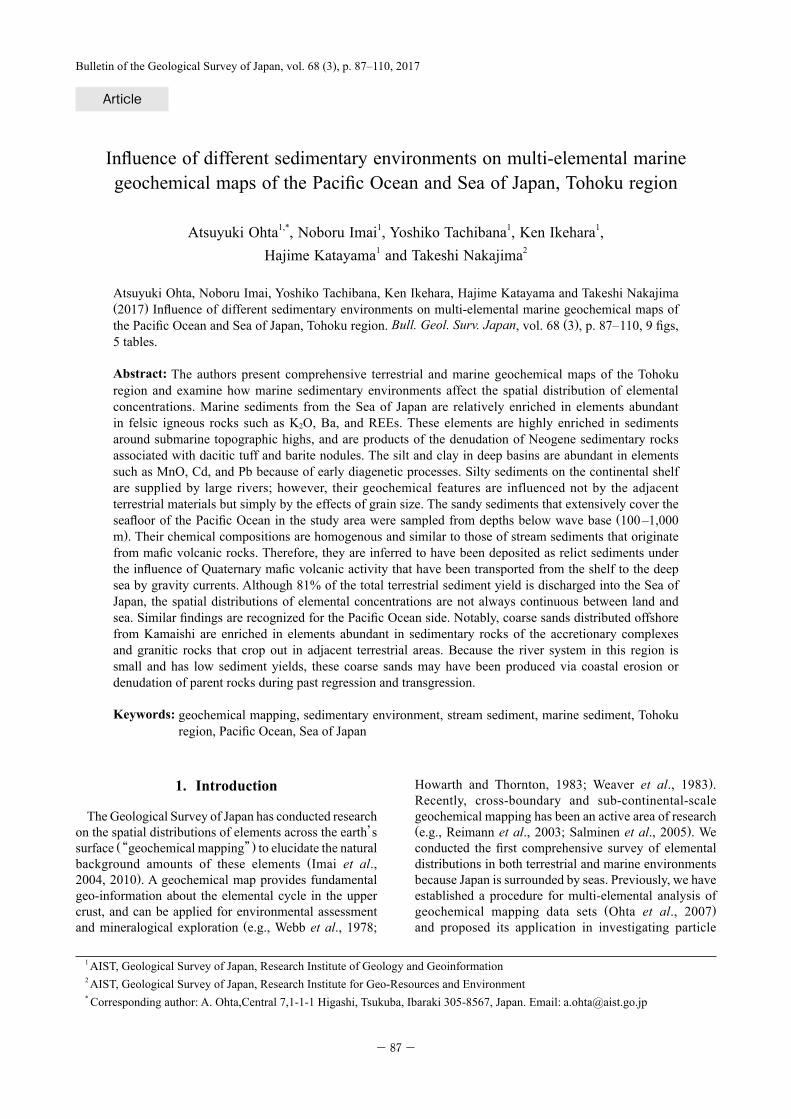
Abstract: The authors present comprehensive terrestrial and marine geochemical maps of the Tohoku region and examine how marine sedimentary environments affect the spatial distribution of elemental concentrations. Marine sediments from the Sea of Japan are relatively enriched in elements abundant in felsic igneous rocks such as K2O, Ba, and REEs. These elements are highly enriched in sediments around submarine topographic highs, and are products of the denudation of Neogene sedimentary rocks associated with dacitic tuff and barite nodules. The silt and clay in deep basins are abundant in elements such as MnO, Cd, and Pb because of early diagenetic processes. Silty sediments on the continental shelf are supplied by large rivers; however, their geochemical features are influenced not by the adjacent terrestrial materials but simply by the effects of grain size. The sandy sediments that extensively cover the seafloor of the Pacific Ocean in the study area were sampled from depths below wave base (100–1,000 m). Their chemical compositions are homogenous and similar to those of stream sediments that originate from mafic volcanic rocks. Therefore, they are inferred to have been deposited as relict sediments under the influence of Quaternary mafic volcanic activity that have been transported from the shelf to the deep sea by gravity currents. Although 81% of the total terrestrial sediment yield is discharged into the Sea of Japan, the spatial distributions of elemental concentrations are not always continuous between land and sea. Similar findings are recognized for the Pacific Ocean side. Notably, coarse sands distributed offshore from Kamaishi are enriched in elements abundant in sedimentary rocks of the accretionary complexes and granitic rocks that crop out in adjacent terrestrial areas. Because the river system in this region is small and has low sediment yields, these coarse sands may have been produced via coastal erosion or denudation of parent rocks during past regression and transgression.
Keywords: geochemical mapping, sedimentary environment, stream sediment, marine sediment, Tohoku region, Pacific Ocean, Sea of Japan
Article
1 AIST, Geological Survey of Japan, Research Institute of Geology and Geoinformation 2 AIST, Geological Survey of Japan, Research Institute for Geo-Resources and Environment * Corresponding author: A. Ohta,Central 7,1-1-1 Higashi, Tsukuba, Ibaraki 305-8567, Japan. Email: @aist.go.jp
1. Introduction
The Geological Survey of Japan has conducted research on the spatial distributions of elements across the earth’s surface (“geochemical mapping”) to elucidate the natural background amounts of these elements (Imai et al., 2004, 2010). A geochemical map provides fundamental geo-information about the elemental cycle in the upper crust, and can be applied for environmental assessment and mineralogical exploration (e.g., Webb et al., 1978;
Howarth and Thornton, 1983; Weaver et al., 1983). Recently, cross-boundary and sub-continental-scale geochemical mapping has been an active area of research (e.g., Reimann et al., 2003; Salminen et al., 2005). We conducted the first comprehensive survey of elemental distributions in both terrestrial and marine environments because Japan is surrounded by seas. Previously, we have established a procedure for multi-elemental analysis of geochemical mapping data sets (Ohta et al., 2007) and proposed its application in investigating particle
− 88 −
Bulletin of the Geological Survey of Japan, vol. 68 (3), 2017
transportation processes from land to sea and within marine environments (Ohta and Imai, 2011), as well in provenance study of marine sediments (Ohta et al., 2013).
In this paper, we describe terrestrial and marine geochemical maps for the Tohoku region of northern Japan. The geochemistry of marine sediments in the northeastern Sea of Japan have been studied in detail by Terashima and Katayama (1993), Terashima et al. (1995a, b), and Imai et al. (1997) as a pilot study for regional marine geochemical mapping. They discussed the geochemical features of heavy elements such as Cr, Mn, Fe, Ni, Cu, Zn, Hg, and Pb in marine sediments, but did not sufficiently examine the relationships between stream and marine sediments. The Pacific Ocean adjacent to the Tohoku region is located in a subduction zone characterized by the Japan Trench, and subduction earthquakes have occurred in this region. In particular, the major earthquake in 2011 caused a catastrophic disaster in the northern Japan. Therefore, scientific interest has been focused primarily on tsunami sediments in the coastal frontal zone and on the deep marine sediments of the Japan Trench. Sedimentation on the continental shelf and
slope in the Pacific Ocean near the Tohoku region has been investigated relatively little (Iijima and Kagami, 1961; Nakajima, 1973). Furthermore, the marine environment around the Tohoku region differs considerably between the Sea of Japan and the Pacific Ocean. The Tohoku region is therefore suitable for studying the effects of different sedimentary environments on elemental concentrations. The purpose of this study is to examine how various depositional environments affect the spatial distribution patterns of elements in marine sediments.
2. Study area
2. 1 Riverine systemFigure 1 displays a schematic map of the study area
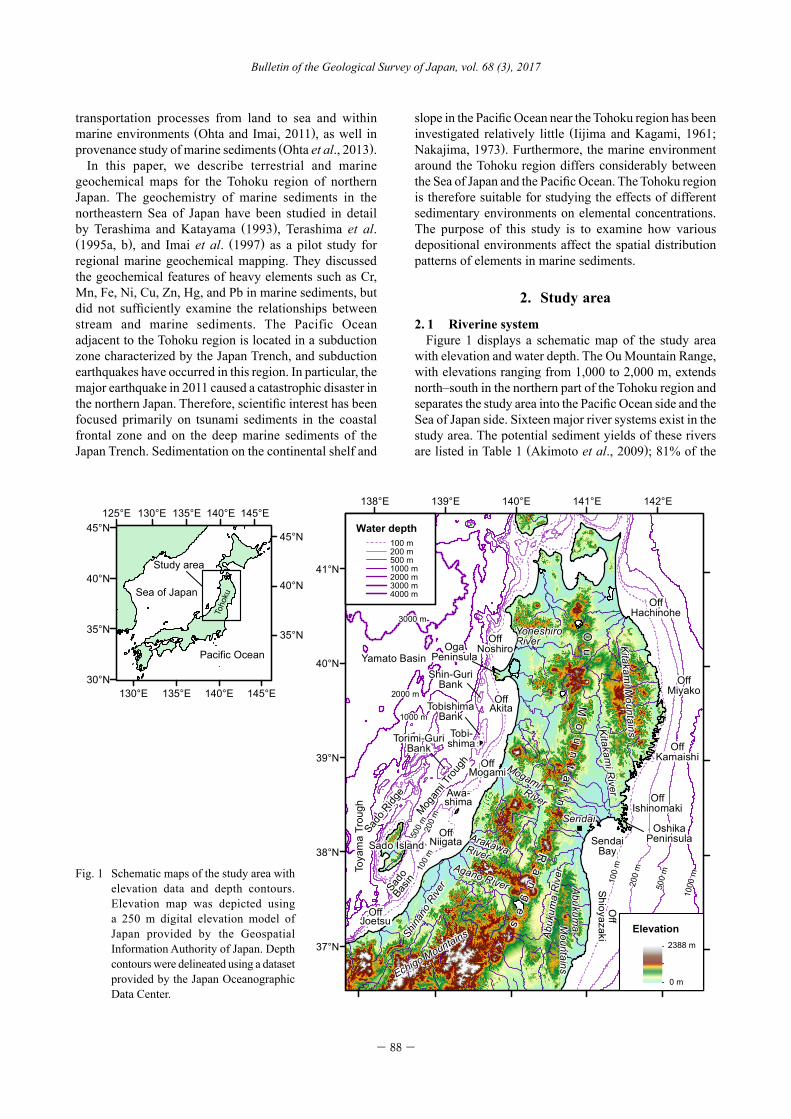
with elevation and water depth. The Ou Mountain Range, with elevations ranging from 1,000 to 2,000 m, extends north–south in the northern part of the Tohoku region and separates the study area into the Pacific Ocean side and the Sea of Japan side. Sixteen major river systems exist in the study area. The potential sediment yields of these rivers are listed in Table 1 (Akimoto et al., 2009); 81% of the
Fig. 1 Schematic maps of the study area with elevation data and depth contours. Elevation map was depicted using a 250 m digital elevation model of Japan provided by the Geospatial Information Authority of Japan. Depth contours were delineated using a dataset provided by the Japan Oceanographic Data Center.
145°E140°E135°E130°E125°E
40°N
35°N
30°N
Study area
Toho
kuSea of Japan
Pacific Ocean
45°N
40°N
35°N
45°N
145°E140°E135°E130°E
Figure 1 (Ohta et al.)
142°E141°E140°E139°E138°E
41°N
40°N
39°N
38°N
37°N
Mogam
i Tro
ugh
Sado R
idge
Japan Basin
Yamato Basin
Toya
ma
Trou
gh
SendaiBay
Sado
Basin
Sado Island
Awa-shima
Tobi-shima
OffHachinohe
OffKamaishi
OffIshinomaki
Off
Shioyazaki
SendaiOff
Niigata
Agano River
Kitakami R
iver
YoneshiroRiver
Mogami River
Abuk
uma
Riv
er
Shina
no R
iver
OffJoetsu
OffMogami
Kitakami M
ountains
Abukuma
Mountains
OffAkita
Shin-GuriBank
Torimi-GuriBank
OgaPeninsula
OshikaPeninsula
OffNoshiro
OffMiyako
Ou
Mo
un
ta
in
Ra
ng
es
Echigo Mountains
TobishimaBank
1000
m
500
m
200
m
100
m
2000 m
3000
m
200
m
500
m
2000 m
3000 m
1000 m
100
m
ArakawaRiver
Elevation2388 m
0 m
Water depth100 m200 m500 m1000 m2000 m3000 m4000 m
− 89 −
Influence of sedimentary environments on marine geochemical maps of the Tohoku region (Ohta et al.)
total terrestrial sediment yield is discharged into the Sea of Japan. The Shinano and Agano Rivers are the largest of this region; these rivers have high sediment yields to the coast of Niigata: 29% and 17%, respectively, of the total sediment discharge of this region. In contrast, the rivers flowing to the Pacific Ocean supply only 19% of the total sediment yield of the study area. Most of these rivers flow through the Sendai Plain to Sendai Bay area.
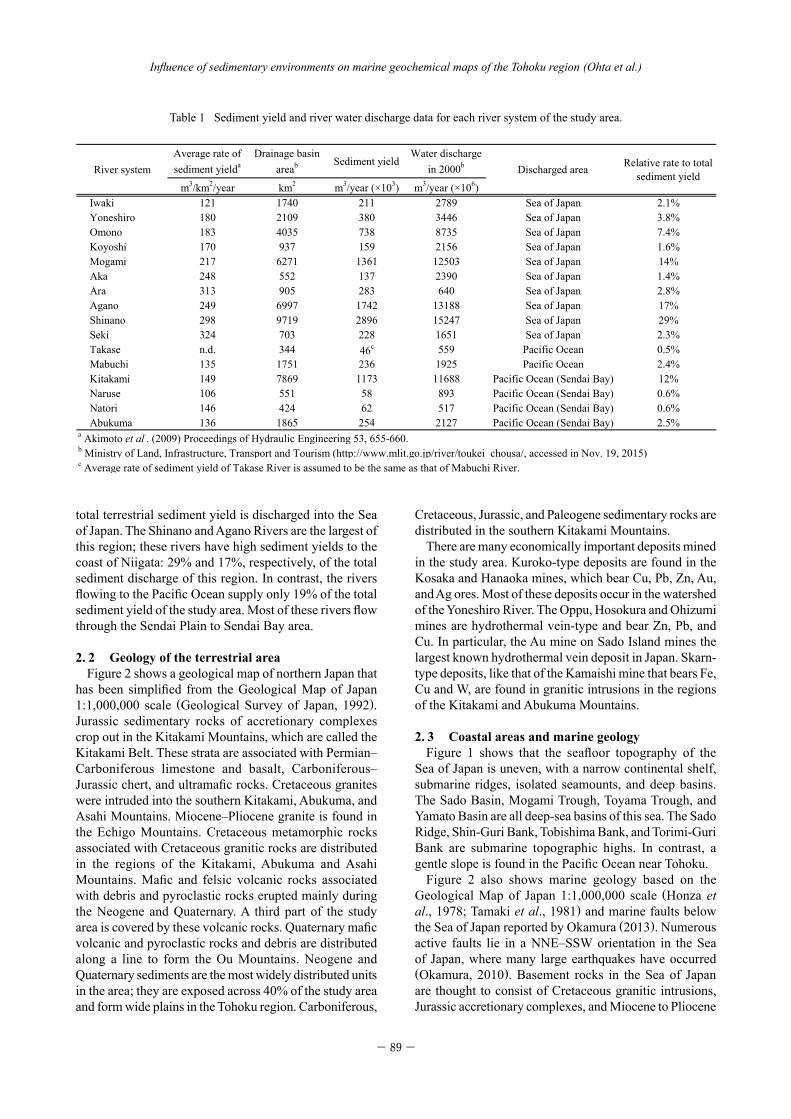
2. 2 Geology of the terrestrial areaFigure 2 shows a geological map of northern Japan that
has been simplified from the Geological Map of Japan 1:1,000,000 scale (Geological Survey of Japan, 1992). Jurassic sedimentary rocks of accretionary complexes crop out in the Kitakami Mountains, which are called the Kitakami Belt. These strata are associated with Permian–Carboniferous limestone and basalt, Carboniferous–Jurassic chert, and ultramafic rocks. Cretaceous granites were intruded into the southern Kitakami, Abukuma, and Asahi Mountains. Miocene–Pliocene granite is found in the Echigo Mountains. Cretaceous metamorphic rocks associated with Cretaceous granitic rocks are distributed in the regions of the Kitakami, Abukuma and Asahi Mountains. Mafic and felsic volcanic rocks associated with debris and pyroclastic rocks erupted mainly during the Neogene and Quaternary. A third part of the study area is covered by these volcanic rocks. Quaternary mafic volcanic and pyroclastic rocks and debris are distributed along a line to form the Ou Mountains. Neogene and Quaternary sediments are the most widely distributed units in the area; they are exposed across 40% of the study area and form wide plains in the Tohoku region. Carboniferous,
Cretaceous, Jurassic, and Paleogene sedimentary rocks are distributed in the southern Kitakami Mountains.
There are many economically important deposits mined in the study area. Kuroko-type deposits are found in the Kosaka and Hanaoka mines, which bear Cu, Pb, Zn, Au, and Ag ores. Most of these deposits occur in the watershed of the Yoneshiro River. The Oppu, Hosokura and Ohizumi mines are hydrothermal vein-type and bear Zn, Pb, and Cu. In particular, the Au mine on Sado Island mines the largest known hydrothermal vein deposit in Japan. Skarn-type deposits, like that of the Kamaishi mine that bears Fe, Cu and W, are found in granitic intrusions in the regions of the Kitakami and Abukuma Mountains.
2. 3 Coastal areas and marine geologyFigure 1 shows that the seafloor topography of the
Sea of Japan is uneven, with a narrow continental shelf, submarine ridges, isolated seamounts, and deep basins. The Sado Basin, Mogami Trough, Toyama Trough, and Yamato Basin are all deep-sea basins of this sea. The Sado Ridge, Shin-Guri Bank, Tobishima Bank, and Torimi-Guri Bank are submarine topographic highs. In contrast, a gentle slope is found in the Pacific Ocean near Tohoku.
Figure 2 also shows marine geology based on the Geological Map of Japan 1:1,000,000 scale (Honza et al., 1978; Tamaki et al., 1981) and marine faults below the Sea of Japan reported by Okamura (2013). Numerous active faults lie in a NNE–SSW orientation in the Sea of Japan, where many large earthquakes have occurred (Okamura, 2010). Basement rocks in the Sea of Japan are thought to consist of Cretaceous granitic intrusions, Jurassic accretionary complexes, and Miocene to Pliocene
Table 1 (Ohta et al .)Average rate ofsediment yielda
Drainage basinareab Sediment yield
Water dischargein 2000b
m3/km2/year km2 m3/year (×103) m3/year (×106)Iwaki 121 1740 211 2789 Sea of Japan 2.1%Yoneshiro 180 2109 380 3446 Sea of Japan 3.8%Omono 183 4035 738 8735 Sea of Japan 7.4%Koyoshi 170 937 159 2156 Sea of Japan 1.6%Mogami 217 6271 1361 12503 Sea of Japan 14%Aka 248 552 137 2390 Sea of Japan 1.4%Ara 313 905 283 640 Sea of Japan 2.8%Agano 249 6997 1742 13188 Sea of Japan 17%Shinano 298 9719 2896 15247 Sea of Japan 29%Seki 324 703 228 1651 Sea of Japan 2.3%Takase n.d. 344 46c 559 Pacific Ocean 0.5%Mabuchi 135 1751 236 1925 Pacific Ocean 2.4%Kitakami 149 7869 1173 11688 Pacific Ocean (Sendai Bay) 12%Naruse 106 551 58 893 Pacific Ocean (Sendai Bay) 0.6%Natori 146 424 62 517 Pacific Ocean (Sendai Bay) 0.6%Abukuma 136 1865 254 2127 Pacific Ocean (Sendai Bay) 2.5%
a Akimoto et al . (2009) Proceedings of Hydraulic Engineering 53, 655-660.b Ministry of Land, Infrastructure, Transport and Tourism (http://www.mlit.go.jp/river/toukei_chousa/, accessed in Nov. 19, 2015)c Average rate of sediment yield of Takase River is assumed to be the same as that of Mabuchi River.
Discharged area Relative rate to totalsediment yieldRiver system
Table 1 Sediment yield and river water discharge data for each river system of the study area.
− 90 −
Bulletin of the Geological Survey of Japan, vol. 68 (3), 2017
siltstone–mudstone (Okamura et al., 1995a). These basement rocks form exposed topographic highs. The continental shelf and deep basins are covered with thick deposits of modern sediments.
In the Pacific Ocean, Miocene volcanic rocks are distributed on the continental shelf offshore from Hachinohe (Tamaki, 1978). Basement rocks of the continental shelf off of Hachinohe and Kamaishi are composed of Cretaceous to Paleogene sedimentary rocks (Tamaki, 1978), and offshore basement rocks are Miocene–Pleistocene sedimentary rocks containing volcanic materials (Okamura and Tanahashi, 1983). Basement rocks of the continental shelf off of Shioyazaki
are composed of Pliocene sedimentary rocks. Quaternary sediments overlie these basement rocks (Arita and Kinoshita, 1978, 1984). In contrast to the Sea of Japan, there are few active faults below this region of the Pacific Ocean.
3. Materials
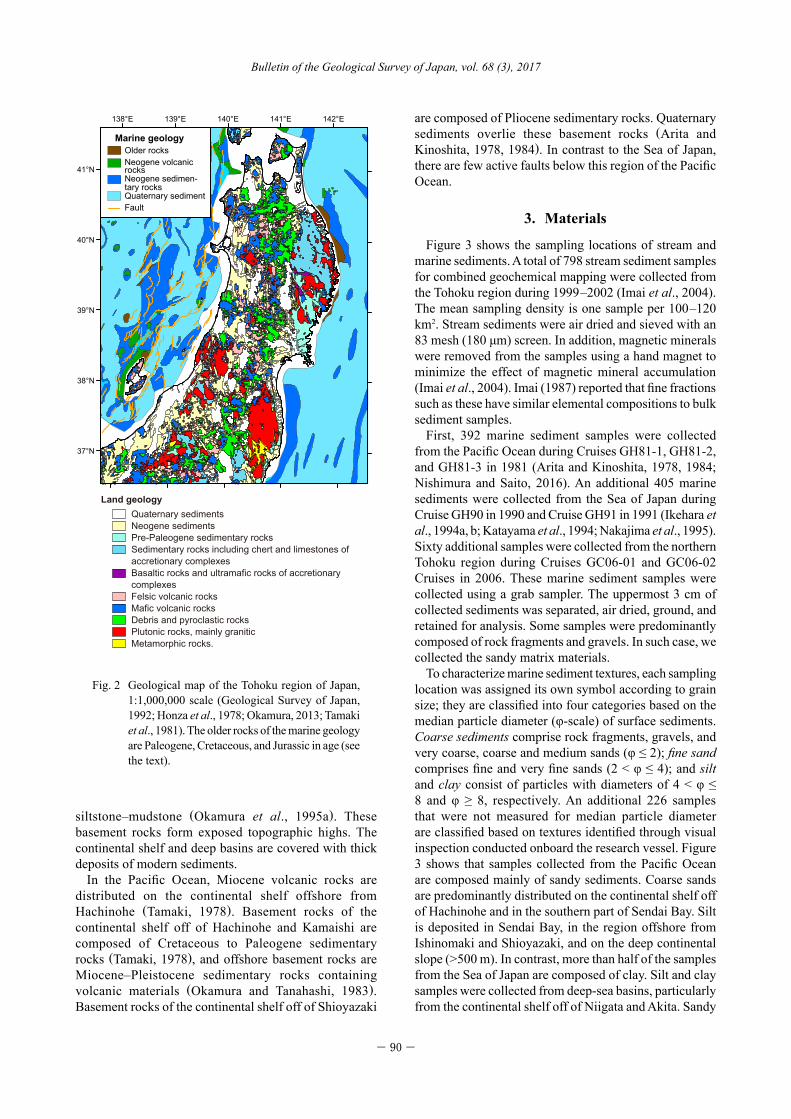
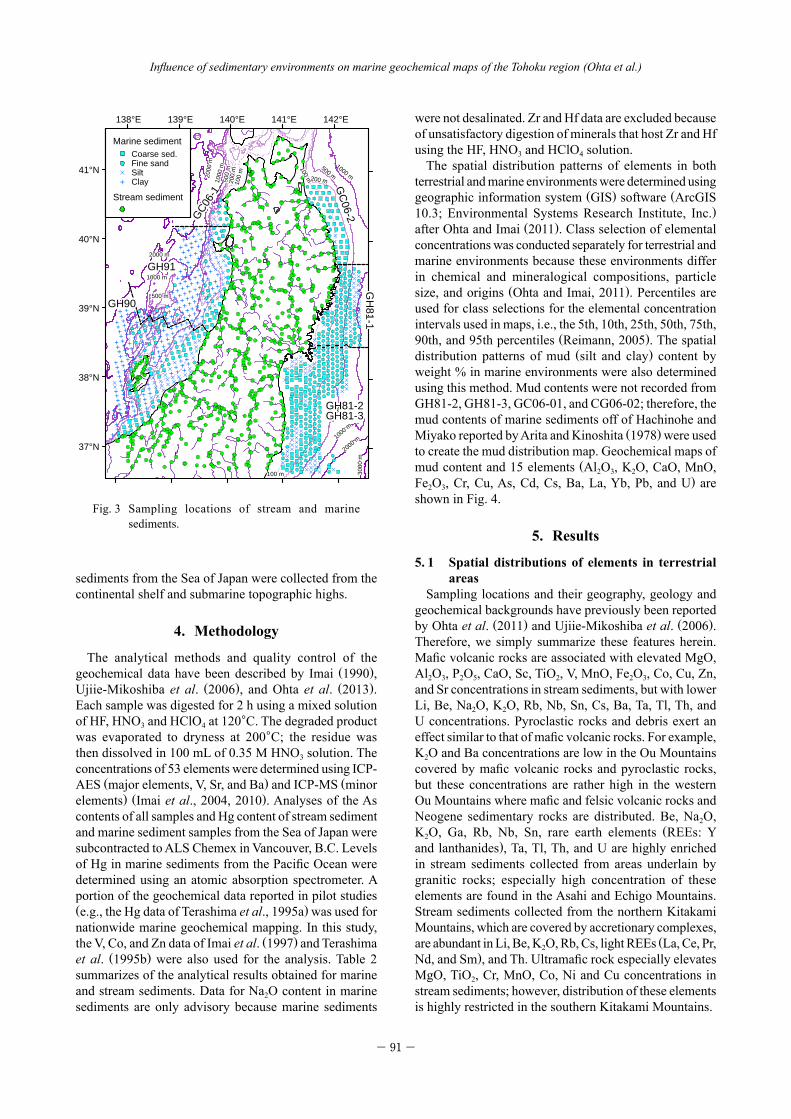
Figure 3 shows the sampling locations of stream and marine sediments. A total of 798 stream sediment samples for combined geochemical mapping were collected from the Tohoku region during 1999–2002 (Imai et al., 2004). The mean sampling density is one sample per 100–120 km2. Stream sediments were air dried and sieved with an 83 mesh (180 μm) screen. In addition, magnetic minerals were removed from the samples using a hand magnet to minimize the effect of magnetic mineral accumulation (Imai et al., 2004). Imai (1987) reported that fine fractions such as these have similar elemental compositions to bulk sediment samples.
First, 392 marine sediment samples were collected from the Pacific Ocean during Cruises GH81-1, GH81-2, and GH81-3 in 1981 (Arita and Kinoshita, 1978, 1984; Nishimura and Saito, 2016). An additional 405 marine sediments were collected from the Sea of Japan during Cruise GH90 in 1990 and Cruise GH91 in 1991 (Ikehara et al., 1994a, b; Katayama et al., 1994; Nakajima et al., 1995). Sixty additional samples were collected from the northern Tohoku region during Cruises GC06-01 and GC06-02 Cruises in 2006. These marine sediment samples were collected using a grab sampler. The uppermost 3 cm of collected sediments was separated, air dried, ground, and retained for analysis. Some samples were predominantly composed of rock fragments and gravels. In such case, we collected the sandy matrix materials.
To characterize marine sediment textures, each sampling location was assigned its own symbol according to grain size; they are classified into four categories based on the median particle diameter (φ-scale) of surface sediments. Coarse sediments comprise rock fragments, gravels, and very coarse, coarse and medium sands (φ ≤ 2); fine sand comprises fine and very fine sands (2 < φ ≤ 4); and silt and clay consist of particles with diameters of 4 < φ ≤ 8 and φ ≥ 8, respectively. An additional 226 samples that were not measured for median particle diameter are classified based on textures identified through visual inspection conducted onboard the research vessel. Figure 3 shows that samples collected from the Pacific Ocean are composed mainly of sandy sediments. Coarse sands are predominantly distributed on the continental shelf off of Hachinohe and in the southern part of Sendai Bay. Silt is deposited in Sendai Bay, in the region offshore from Ishinomaki and Shioyazaki, and on the deep continental slope (>500 m). In contrast, more than half of the samples from the Sea of Japan are composed of clay. Silt and clay samples were collected from deep-sea basins, particularly from the continental shelf off of Niigata and Akita. Sandy
142°E141°E140°E139°E138°E
41°N
40°N
39°N
38°N
37°N
Land geology
Figure 2 (Ohta et al.)
Marine geology
Fault
Older rocksNeogene volcanicrocksNeogene sedimen-tary rocksQuaternary sediment
Quaternary sedimentsNeogene sedimentsPre-Paleogene sedimentary rocksSedimentary rocks including chert and limestones of accretionary complexesBasaltic rocks and ultramafic rocks of accretionary complexesFelsic volcanic rocksMafic volcanic rocksDebris and pyroclastic rocksPlutonic rocks, mainly graniticMetamorphic rocks.
Fig. 2 Geological map of the Tohoku region of Japan, 1:1,000,000 scale (Geological Survey of Japan, 1992; Honza et al., 1978; Okamura, 2013; Tamaki et al., 1981). The older rocks of the marine geology are Paleogene, Cretaceous, and Jurassic in age (see the text).
− 91 −
Influence of sedimentary environments on marine geochemical maps of the Tohoku region (Ohta et al.)
Fig. 3 Sampling locations of stream and marine sediments.
sediments from the Sea of Japan were collected from the continental shelf and submarine topographic highs.
4. Methodology
The analytical methods and quality control of the geochemical data have been described by Imai (1990), Ujiie-Mikoshiba et al. (2006), and Ohta et al. (2013). Each sample was digested for 2 h using a mixed solution of HF, HNO3 and HClO4 at 120°C. The degraded product was evaporated to dryness at 200°C; the residue was then dissolved in 100 mL of 0.35 M HNO3 solution. The concentrations of 53 elements were determined using ICP-AES (major elements, V, Sr, and Ba) and ICP-MS (minor elements) (Imai et al., 2004, 2010). Analyses of the As contents of all samples and Hg content of stream sediment and marine sediment samples from the Sea of Japan were subcontracted to ALS Chemex in Vancouver, B.C. Levels of Hg in marine sediments from the Pacific Ocean were determined using an atomic absorption spectrometer. A portion of the geochemical data reported in pilot studies (e.g., the Hg data of Terashima et al., 1995a) was used for nationwide marine geochemical mapping. In this study, the V, Co, and Zn data of Imai et al. (1997) and Terashima et al. (1995b) were also used for the analysis. Table 2 summarizes of the analytical results obtained for marine and stream sediments. Data for Na2O content in marine sediments are only advisory because marine sediments
were not desalinated. Zr and Hf data are excluded because of unsatisfactory digestion of minerals that host Zr and Hf using the HF, HNO3 and HClO4 solution.
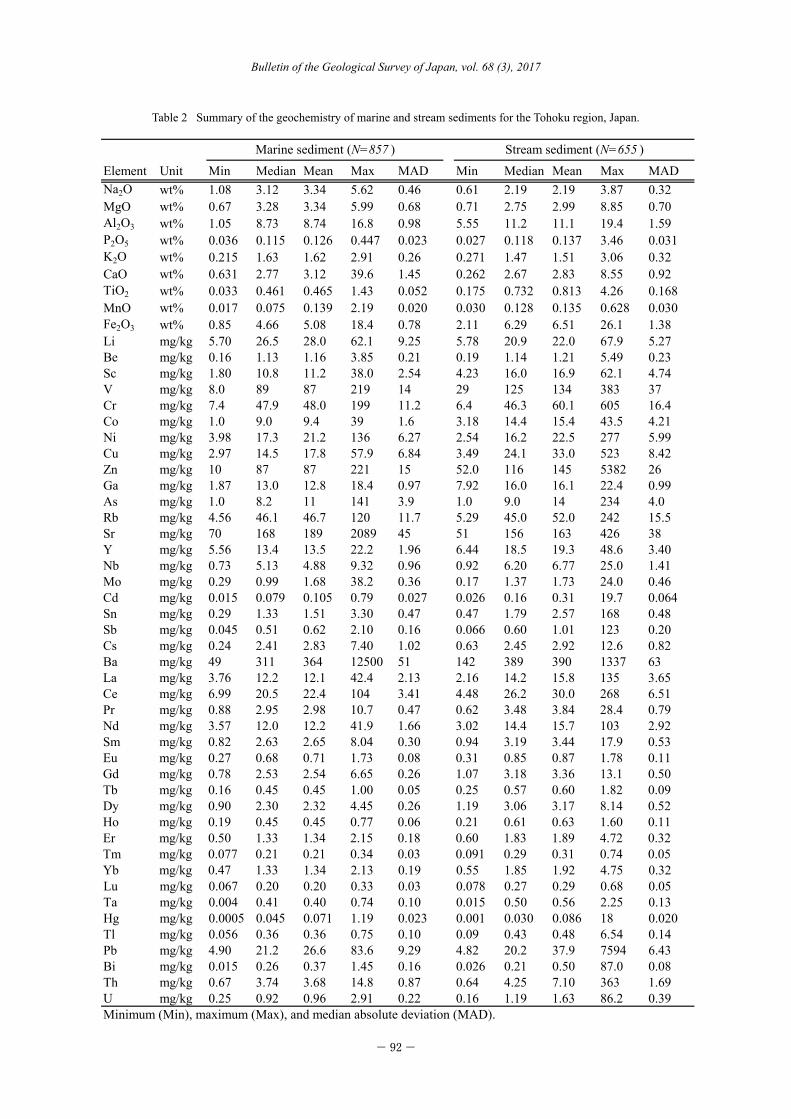
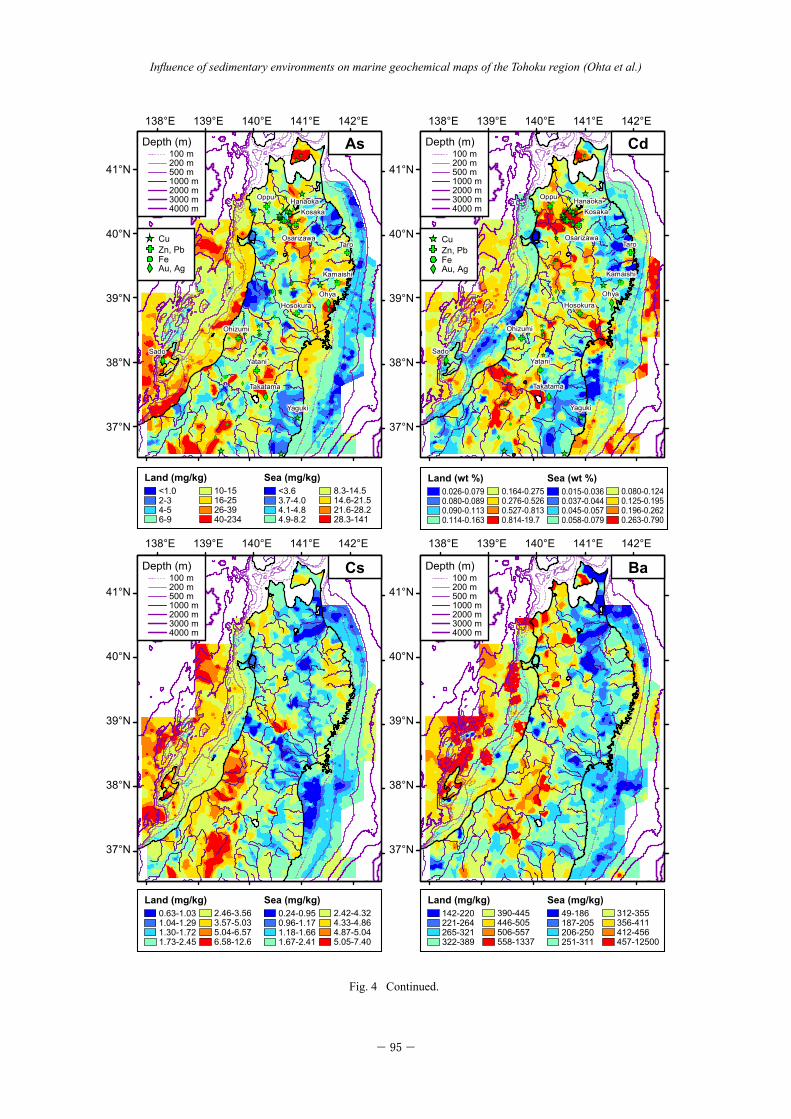
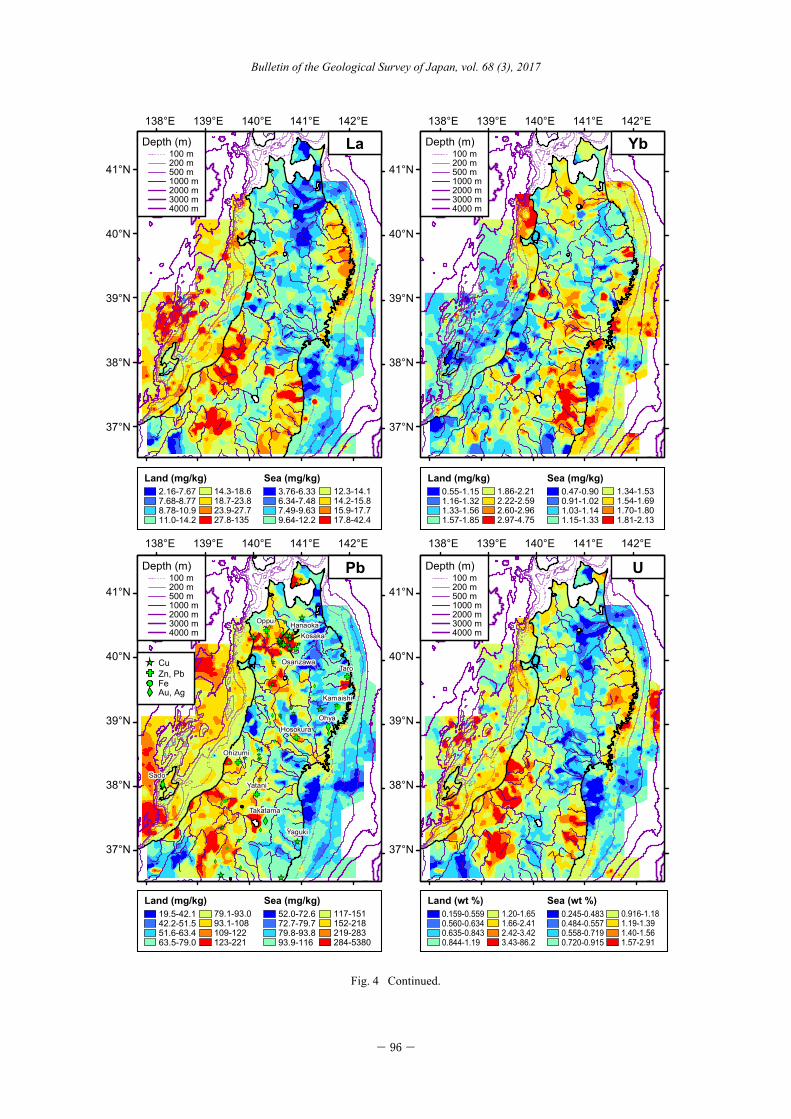
The spatial distribution patterns of elements in both terrestrial and marine environments were determined using geographic information system (GIS) software (ArcGIS 10.3; Environmental Systems Research Institute, Inc.) after Ohta and Imai (2011). Class selection of elemental concentrations was conducted separately for terrestrial and marine environments because these environments differ in chemical and mineralogical compositions, particle size, and origins (Ohta and Imai, 2011). Percentiles are used for class selections for the elemental concentration intervals used in maps, i.e., the 5th, 10th, 25th, 50th, 75th, 90th, and 95th percentiles (Reimann, 2005). The spatial distribution patterns of mud (silt and clay) content by weight % in marine environments were also determined using this method. Mud contents were not recorded from GH81-2, GH81-3, GC06-01, and CG06-02; therefore, the mud contents of marine sediments off of Hachinohe and Miyako reported by Arita and Kinoshita (1978) were used to create the mud distribution map. Geochemical maps of mud content and 15 elements (Al2O3, K2O, CaO, MnO, Fe2O3, Cr, Cu, As, Cd, Cs, Ba, La, Yb, Pb, and U) are shown in Fig. 4.
5. Results
5. 1 Spatial distributions of elements in terrestrial areas
Sampling locations and their geography, geology and geochemical backgrounds have previously been reported by Ohta et al. (2011) and Ujiie-Mikoshiba et al. (2006). Therefore, we simply summarize these features herein. Mafic volcanic rocks are associated with elevated MgO, Al2O3, P2O5, CaO, Sc, TiO2, V, MnO, Fe2O3, Co, Cu, Zn, and Sr concentrations in stream sediments, but with lower Li, Be, Na2O, K2O, Rb, Nb, Sn, Cs, Ba, Ta, Tl, Th, and U concentrations. Pyroclastic rocks and debris exert an effect similar to that of mafic volcanic rocks. For example, K2O and Ba concentrations are low in the Ou Mountains covered by mafic volcanic rocks and pyroclastic rocks, but these concentrations are rather high in the western Ou Mountains where mafic and felsic volcanic rocks and Neogene sedimentary rocks are distributed. Be, Na2O, K2O, Ga, Rb, Nb, Sn, rare earth elements (REEs: Y and lanthanides), Ta, Tl, Th, and U are highly enriched in stream sediments collected from areas underlain by granitic rocks; especially high concentration of these elements are found in the Asahi and Echigo Mountains. Stream sediments collected from the northern Kitakami Mountains, which are covered by accretionary complexes, are abundant in Li, Be, K2O, Rb, Cs, light REEs (La, Ce, Pr, Nd, and Sm), and Th. Ultramafic rock especially elevates MgO, TiO2, Cr, MnO, Co, Ni and Cu concentrations in stream sediments; however, distribution of these elements is highly restricted in the southern Kitakami Mountains.
142°E141°E140°E139°E138°E
41°N
40°N
39°N
38°N
37°N
Figure 3 (Ohta et al.)
2000 m
3000 m
1000 m
500 m
1000 m
500
m
200 m
2000 m
3000
m
1000 m500 m
100
m
500
m
1000
m20
0m
2000
m
100 m
100m
GH
81-1GH81-2GH81-3
GC
06-2GC06-
1
GH91
GH90
Marine sedimentCoarse sed.Fine sandSiltClay
Stream sediment
− 92 −
Bulletin of the Geological Survey of Japan, vol. 68 (3), 2017
Table 2 (Ohta et al .)
Element Unit Min Median Mean Max MAD Min Median Mean Max MADNa2O wt% 1.08 3.12 3.34 5.62 0.46 0.61 2.19 2.19 3.87 0.32MgO wt% 0.67 3.28 3.34 5.99 0.68 0.71 2.75 2.99 8.85 0.70Al2O3 wt% 1.05 8.73 8.74 16.8 0.98 5.55 11.2 11.1 19.4 1.59P2O5 wt% 0.036 0.115 0.126 0.447 0.023 0.027 0.118 0.137 3.46 0.031K2O wt% 0.215 1.63 1.62 2.91 0.26 0.271 1.47 1.51 3.06 0.32CaO wt% 0.631 2.77 3.12 39.6 1.45 0.262 2.67 2.83 8.55 0.92TiO2 wt% 0.033 0.461 0.465 1.43 0.052 0.175 0.732 0.813 4.26 0.168MnO wt% 0.017 0.075 0.139 2.19 0.020 0.030 0.128 0.135 0.628 0.030Fe2O3 wt% 0.85 4.66 5.08 18.4 0.78 2.11 6.29 6.51 26.1 1.38Li mg/kg 5.70 26.5 28.0 62.1 9.25 5.78 20.9 22.0 67.9 5.27Be mg/kg 0.16 1.13 1.16 3.85 0.21 0.19 1.14 1.21 5.49 0.23Sc mg/kg 1.80 10.8 11.2 38.0 2.54 4.23 16.0 16.9 62.1 4.74V mg/kg 8.0 89 87 219 14 29 125 134 383 37Cr mg/kg 7.4 47.9 48.0 199 11.2 6.4 46.3 60.1 605 16.4Co mg/kg 1.0 9.0 9.4 39 1.6 3.18 14.4 15.4 43.5 4.21Ni mg/kg 3.98 17.3 21.2 136 6.27 2.54 16.2 22.5 277 5.99Cu mg/kg 2.97 14.5 17.8 57.9 6.84 3.49 24.1 33.0 523 8.42Zn mg/kg 10 87 87 221 15 52.0 116 145 5382 26Ga mg/kg 1.87 13.0 12.8 18.4 0.97 7.92 16.0 16.1 22.4 0.99As mg/kg 1.0 8.2 11 141 3.9 1.0 9.0 14 234 4.0Rb mg/kg 4.56 46.1 46.7 120 11.7 5.29 45.0 52.0 242 15.5Sr mg/kg 70 168 189 2089 45 51 156 163 426 38Y mg/kg 5.56 13.4 13.5 22.2 1.96 6.44 18.5 19.3 48.6 3.40Nb mg/kg 0.73 5.13 4.88 9.32 0.96 0.92 6.20 6.77 25.0 1.41Mo mg/kg 0.29 0.99 1.68 38.2 0.36 0.17 1.37 1.73 24.0 0.46Cd mg/kg 0.015 0.079 0.105 0.79 0.027 0.026 0.16 0.31 19.7 0.064Sn mg/kg 0.29 1.33 1.51 3.30 0.47 0.47 1.79 2.57 168 0.48Sb mg/kg 0.045 0.51 0.62 2.10 0.16 0.066 0.60 1.01 123 0.20Cs mg/kg 0.24 2.41 2.83 7.40 1.02 0.63 2.45 2.92 12.6 0.82Ba mg/kg 49 311 364 12500 51 142 389 390 1337 63La mg/kg 3.76 12.2 12.1 42.4 2.13 2.16 14.2 15.8 135 3.65Ce mg/kg 6.99 20.5 22.4 104 3.41 4.48 26.2 30.0 268 6.51Pr mg/kg 0.88 2.95 2.98 10.7 0.47 0.62 3.48 3.84 28.4 0.79Nd mg/kg 3.57 12.0 12.2 41.9 1.66 3.02 14.4 15.7 103 2.92Sm mg/kg 0.82 2.63 2.65 8.04 0.30 0.94 3.19 3.44 17.9 0.53Eu mg/kg 0.27 0.68 0.71 1.73 0.08 0.31 0.85 0.87 1.78 0.11Gd mg/kg 0.78 2.53 2.54 6.65 0.26 1.07 3.18 3.36 13.1 0.50Tb mg/kg 0.16 0.45 0.45 1.00 0.05 0.25 0.57 0.60 1.82 0.09Dy mg/kg 0.90 2.30 2.32 4.45 0.26 1.19 3.06 3.17 8.14 0.52Ho mg/kg 0.19 0.45 0.45 0.77 0.06 0.21 0.61 0.63 1.60 0.11Er mg/kg 0.50 1.33 1.34 2.15 0.18 0.60 1.83 1.89 4.72 0.32Tm mg/kg 0.077 0.21 0.21 0.34 0.03 0.091 0.29 0.31 0.74 0.05Yb mg/kg 0.47 1.33 1.34 2.13 0.19 0.55 1.85 1.92 4.75 0.32Lu mg/kg 0.067 0.20 0.20 0.33 0.03 0.078 0.27 0.29 0.68 0.05Ta mg/kg 0.004 0.41 0.40 0.74 0.10 0.015 0.50 0.56 2.25 0.13Hg mg/kg 0.0005 0.045 0.071 1.19 0.023 0.001 0.030 0.086 18 0.020Tl mg/kg 0.056 0.36 0.36 0.75 0.10 0.09 0.43 0.48 6.54 0.14Pb mg/kg 4.90 21.2 26.6 83.6 9.29 4.82 20.2 37.9 7594 6.43Bi mg/kg 0.015 0.26 0.37 1.45 0.16 0.026 0.21 0.50 87.0 0.08Th mg/kg 0.67 3.74 3.68 14.8 0.87 0.64 4.25 7.10 363 1.69U mg/kg 0.25 0.92 0.96 2.91 0.22 0.16 1.19 1.63 86.2 0.39Minimum (Min), maximum (Max), and median absolute deviation (MAD).
Marine sediment (N=857 ) Stream sediment (N=655 )
Table 2 Summary of the geochemistry of marine and stream sediments for the Tohoku region, Japan.
− 93 −
Influence of sedimentary environments on marine geochemical maps of the Tohoku region (Ohta et al.)
142°E141°E140°E139°E138°E
41°N
40°N
39°N
38°N
37°N
142°E141°E140°E139°E138°E
41°N
40°N
39°N
38°N
37°N
142°E141°E140°E139°E138°E
41°N
40°N
39°N
38°N
37°N
142°E141°E140°E139°E138°E
41°N
40°N
39°N
38°N
37°N
Mud (silt + clay: wt%)0 - 1920 -3940 -59
60 -7980 -100
Land (wt%)5.55-7.667.67-8.228.23-9.489.49-11.1
11.2-12.512.6-13.713.8-14.314.4-19.4
Sea (wt%)1.05-6.196.20-6.706.71-7.627.63-8.72
8.73-9.629.63-10.610.7-12.012.1-16.8
Land (wt%)0.26-1.071.08-1.291.30-1.811.82-2.67
2.68-3.683.69-4.564.57-5.195.20-8.55
Sea (wt%)0.63-0.770.78-0.840.85-1.071.08-2.77
2.78-3.793.80-4.934.94-7.327.33-39.6
Land (wt%)0.27-0.750.76-0.900.91-1.171.18-1.47
1.48-1.811.82-2.152.16-2.402.41-3.06
Sea (wt%)0.22-0.980.99-1.141.15-1.411.42-1.63
1.64-1.901.91-2.022.03-2.112.12-2.91
Figure 4a (Ohta et al.)
Depth (m)100 m200 m500 m1000 m2000 m3000 m4000 m
Depth (m)100 m200 m500 m1000 m2000 m3000 m4000 m
Al2O3Mud
Depth (m)100 m200 m500 m1000 m
Depth (m)100 m200 m500 m1000 m
CaOK2O
2000 m3000 m4000 m
2000 m3000 m4000 m
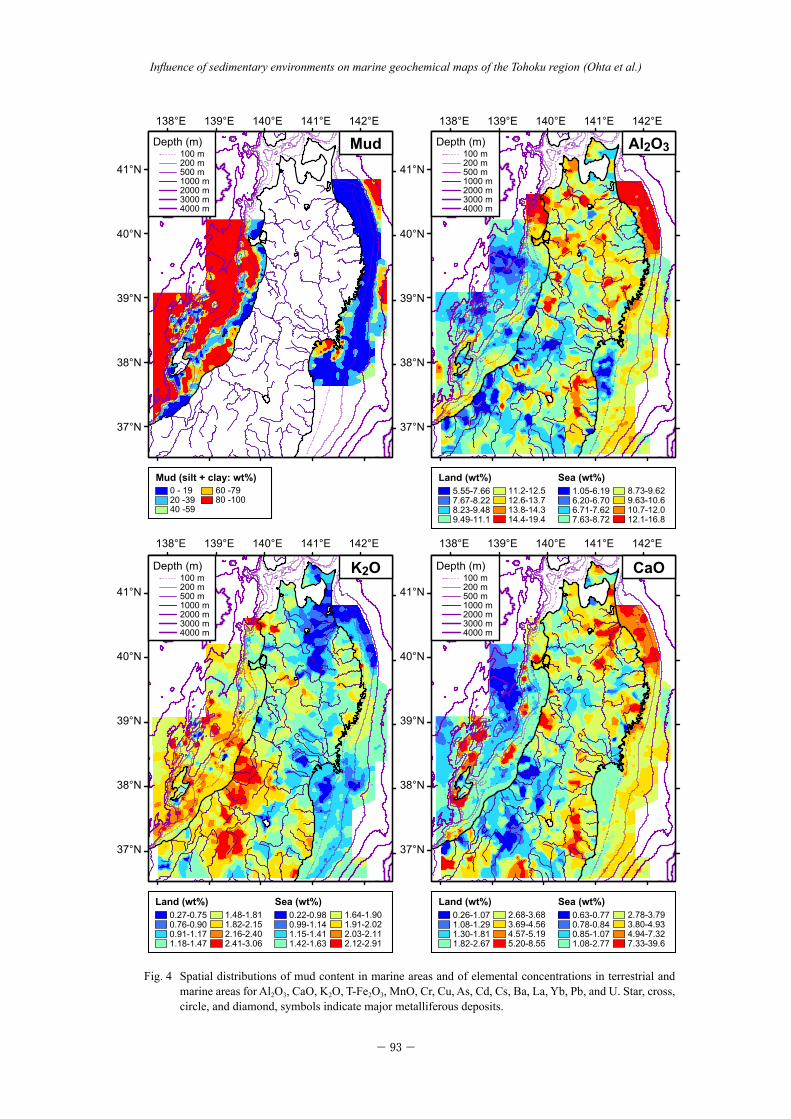
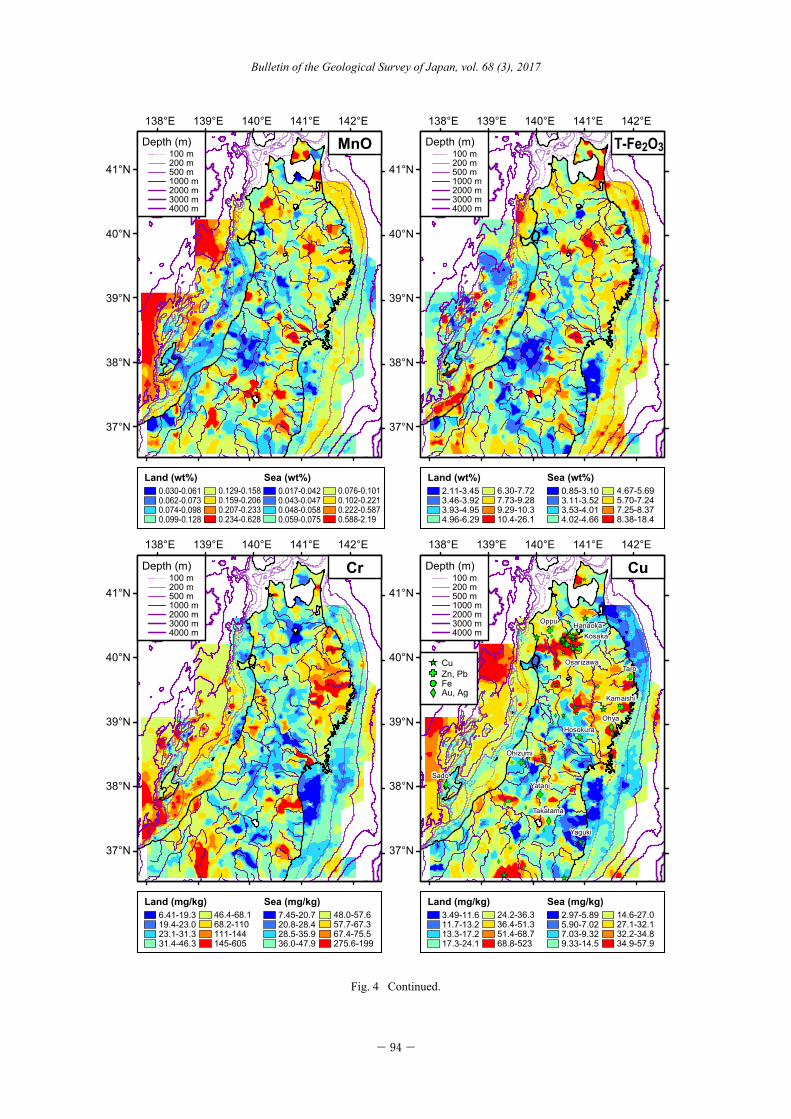
Fig. 4 Spatial distributions of mud content in marine areas and of elemental concentrations in terrestrial and marine areas for Al2O3, CaO, K2O, T-Fe2O3, MnO, Cr, Cu, As, Cd, Cs, Ba, La, Yb, Pb, and U. Star, cross, circle, and diamond, symbols indicate major metalliferous deposits.
− 94 −
Bulletin of the Geological Survey of Japan, vol. 68 (3), 2017
Osarizawa
Kosaka
Sado
Hosokura
Kamaishi
Taro
Yaguki
Ohizumi
Yatani
Ohya
Oppu Hanaoka
Takatama
142°E141°E140°E139°E138°E
41°N
40°N
39°N
38°N
37°N
142°E141°E140°E139°E138°E
41°N
40°N
39°N
38°N
37°N
Depth (m)100 m200 m500 m1000 m2000 m3000 m4000 m
142°E141°E140°E139°E138°E
41°N
40°N
39°N
38°N
37°N
142°E141°E140°E139°E138°E
41°N
40°N
39°N
38°N
37°N
T-Fe2O3MnO
Depth (m)100 m200 m500 m1000 m2000 m3000 m4000 m
Depth (m)100 m200 m500 m1000 m2000 m3000 m4000 m
CuCr
Land (wt%)2.11-3.453.46-3.923.93-4.954.96-6.29
6.30-7.727.73-9.289.29-10.310.4-26.1
Sea (wt%)0.85-3.103.11-3.523.53-4.014.02-4.66
4.67-5.695.70-7.247.25-8.378.38-18.4
Land (mg/kg)3.49-11.611.7-13.213.3-17.217.3-24.1
24.2-36.336.4-51.351.4-68.768.8-523
Sea (mg/kg)2.97-5.895.90-7.027.03-9.329.33-14.5
14.6-27.027.1-32.132.2-34.834.9-57.9
Land (mg/kg)6.41-19.319.4-23.023.1-31.331.4-46.3
46.4-68.168.2-110111-144145-605
Sea (mg/kg)7.45-20.720.8-28.428.5-35.936.0-47.9
48.0-57.657.7-67.367.4-75.5275.6-199
Figure 4b (Ohta et al.)
Land (wt%)0.030-0.0610.062-0.0730.074-0.0980.099-0.128
0.129-0.1580.159-0.2060.207-0.2330.234-0.628
Sea (wt%)0.017-0.0420.043-0.0470.048-0.0580.059-0.075
0.076-0.1010.102-0.2210.222-0.5870.588-2.19
Depth (m)100 m200 m500 m1000 m2000 m3000 m4000 m
CuZn, Pb
Au, AgFe
Fig. 4 Continued.
− 95 −
Influence of sedimentary environments on marine geochemical maps of the Tohoku region (Ohta et al.)
Osarizawa
Kosaka
Sado
Hosokura
Kamaishi
Taro
Yaguki
Ohizumi
Yatani
Ohya
Oppu Hanaoka
Takatama
Osarizawa
Kosaka
Sado
Hosokura
Kamaishi
Taro
Yaguki
Ohizumi
Yatani
Ohya
Oppu Hanaoka
Takatama
142°E141°E140°E139°E138°E
41°N
40°N
39°N
38°N
37°N
142°E141°E140°E139°E138°E
41°N
40°N
39°N
38°N
37°N
142°E141°E140°E139°E138°E
41°N
40°N
39°N
38°N
37°N
142°E141°E140°E139°E138°E
41°N
40°N
39°N
38°N
37°N
Figure 4c (Ohta et al.)
Land (mg/kg)<1.02-34-56-9
10-1516-2526-3940-234
Sea (mg/kg)<3.63.7-4.04.1-4.84.9-8.2
8.3-14.514.6-21.521.6-28.228.3-141
Land (wt %)0.026-0.0790.080-0.0890.090-0.1130.114-0.163
0.164-0.2750.276-0.5260.527-0.8130.814-19.7
Sea (wt %)0.015-0.0360.037-0.0440.045-0.0570.058-0.079
0.080-0.1240.125-0.1950.196-0.2620.263-0.790
Land (mg/kg)0.63-1.031.04-1.291.30-1.721.73-2.45
2.46-3.563.57-5.035.04-6.576.58-12.6
Sea (mg/kg)0.24-0.950.96-1.171.18-1.661.67-2.41
2.42-4.324.33-4.864.87-5.045.05-7.40
Land (mg/kg)142-220221-264265-321322-389
390-445446-505506-557558-1337
Sea (mg/kg)49-186187-205206-250251-311
312-355356-411412-456457-12500
Depth (m)100 m200 m500 m1000 m2000 m3000 m4000 m
As
CuZn, Pb
Au, AgFe
Depth (m)100 m200 m500 m1000 m2000 m3000 m4000 m
Cd
CuZn, Pb
Au, AgFe
Depth (m)100 m200 m500 m1000 m2000 m3000 m4000 m
Cs BaDepth (m)100 m200 m500 m1000 m2000 m3000 m4000 m
Fig. 4 Continued.
− 96 −
Bulletin of the Geological Survey of Japan, vol. 68 (3), 2017
Osarizawa
Kosaka
Sado
Hosokura
Kamaishi
Taro
Yaguki
Ohizumi
Yatani
Ohya
Oppu Hanaoka
Takatama
Depth (m)100 m200 m500 m1000 m2000 m3000 m4000 m
Depth (m)100 m200 m500 m1000 m2000 m3000 m4000 m
UPb
CuZn, Pb
Au, AgFe
142°E141°E140°E139°E138°E
41°N
40°N
39°N
38°N
37°N
142°E141°E140°E139°E138°E
41°N
40°N
39°N
38°N
37°N
142°E141°E140°E139°E138°E
41°N
40°N
39°N
38°N
37°N
142°E141°E140°E139°E138°E
41°N
40°N
39°N
38°N
37°N
Depth (m)100 m200 m500 m1000 m2000 m3000 m4000 m
Depth (m)100 m200 m500 m1000 m2000 m3000 m4000 m
YbLa
Land (wt %)0.159-0.5590.560-0.6340.635-0.8430.844-1.19
1.20-1.651.66-2.412.42-3.423.43-86.2
Sea (wt %)0.245-0.4830.484-0.5570.558-0.7190.720-0.915
0.916-1.181.19-1.391.40-1.561.57-2.91
Land (mg/kg)19.5-42.142.2-51.551.6-63.463.5-79.0
79.1-93.093.1-108109-122123-221
Sea (mg/kg)52.0-72.672.7-79.779.8-93.893.9-116
117-151152-218219-283284-5380
Figure 4d (Ohta et al.)
Land (mg/kg)0.55-1.151.16-1.321.33-1.561.57-1.85
1.86-2.212.22-2.592.60-2.962.97-4.75
Sea (mg/kg)0.47-0.900.91-1.021.03-1.141.15-1.33
1.34-1.531.54-1.691.70-1.801.81-2.13
Land (mg/kg)2.16-7.677.68-8.778.78-10.911.0-14.2
14.3-18.618.7-23.823.9-27.727.8-135
Sea (mg/kg)3.76-6.336.34-7.487.49-9.639.64-12.2
12.3-14.114.2-15.815.9-17.717.8-42.4
Fig. 4 Continued.
− 97 −
Influence of sedimentary environments on marine geochemical maps of the Tohoku region (Ohta et al.)
In contrast, the spatial distribution patterns of As, Cd, Sb, Hg, Pb, and Bi are strongly influenced not by geology but by mineral deposits. Certain Kuroko-type deposits, which are found at the Kosaka and Hanaoka mines within the Yoneshiro River watershed and the Taro mine in the Kitakami Mountains, greatly enhance Cu, Zn, Cd, Sb, Hg, Pb, and Bi concentrations in sediments. Skarn-type deposits, such as those of the Kamaishi and Yaoi mines, are associated with elevated Fe2O3 and Cu concentrations in sediments. The Au mine on Sado Island is the largest hydrothermal vein in Japan and shows elevated As concentrations in sediments. Therefore, geochemical maps in terrestrial areas are simply controlled by lithology and mineral deposits.
5. 2 Geochemical features of elemental concentrations in marine sediments
5. 2. 1 Spatial distributions of elements in marine environments
In the Pacific Ocean, MgO, Al2O3, CaO, Sc, TiO2, V, MnO, Fe2O3, Co, Ga, and Sr are abundant in the sandy sediments on the shelf and slope off of Hachinohe. The area offshore from Kamaishi is relatively abundant in Li, Be, P2O5, K2O, Cr, Ni, Rb, Y, Nb, Sb, Cs, Ba, REEs, Ta, Tl, Th, and U, although the areas of high enrichment in these elements are restricted to near the shore. Cu, Zn, As, Mo, Cd, Sn, Sb, Hg, Pb, and Bi are elevated in silt content on the shelf off of Ishinomaki. Coarse sediments on the shelf off of Shioyazaki and the southern part of Sendai Bay are depleted in all elements analyzed except for As and Ba. Silts collected from the continental slope have high concentrations of Li, V, Cr, Fe2O3, Ni, Cu, Zn, Nb, Mo, Cd, Sn, Sb, Cs, heavy REEs, Ta, Hg, Pb, Bi and U.
For the Sea of Japan, coarse sediments collected from the shelf and sea topographic highs are highly enriched in CaO and Sr. It is clear that these enrichments (especially in samples with CaO > 7.0 wt%) are caused by shell fragments and foraminiferal tests. Sandy sediments from the continental shelf are generally poor in almost all of the elements analyzed. However, sands on the shelf off of Noshiro are enriched in Al2O3, Sc, TiO2, Fe2O3, Co, and heavy REEs; coarse sands on the shelf off of Mogami are abundant in As and Ba; coarse and fine sands on the edge of the shelf off of Niigata are enriched in As and Fe2O3; and coarse sands on the shelf off Joetsu are rich in Al2O3, P2O5, Sc, Fe2O3, Co, As, REEs, and Th. Silts and clays on the continental shelf off of Niigata are abundant in Li, P2O5, TiO2, Cr, Ni, Cu, Nb, Cd, Sn, Cs, heavy REEs, Ta, Hg, Pb, Bi, and U. Sandy and silty sediments collected from the Sado Ridge have high concentrations of K2O, Rb, and Cs, and especially of Be, Ba and light REEs. Clays from the Yamato Basin and the Toyama Trough are abundant in Li, MgO, P2O5, TiO2, Cr, MnO, Co, Ni, Cu, As, Rb, Cs, Mo, Sn, Sb, Pb, Bi, and Tl. Thus, marine geochemical maps differ by area, and patterns are strongly associated with sediment grain sizes.
5. 2. 2 Variation of elemental concentrations in marine sediments with water depth
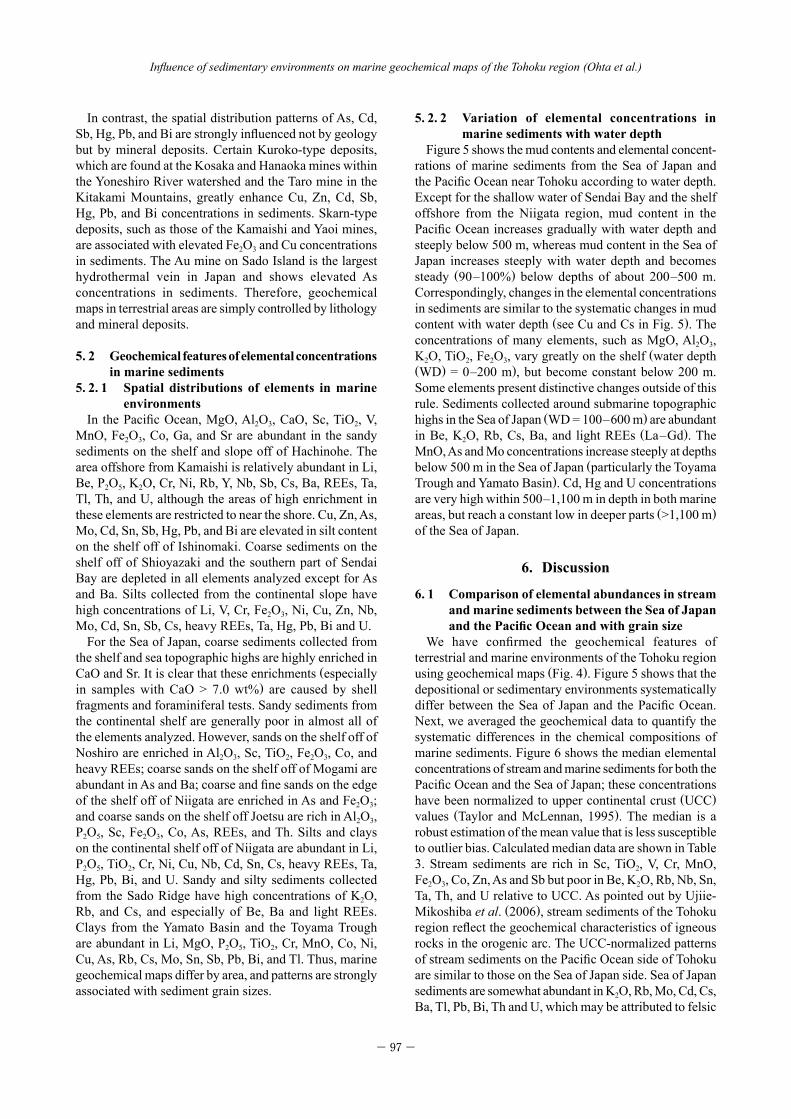
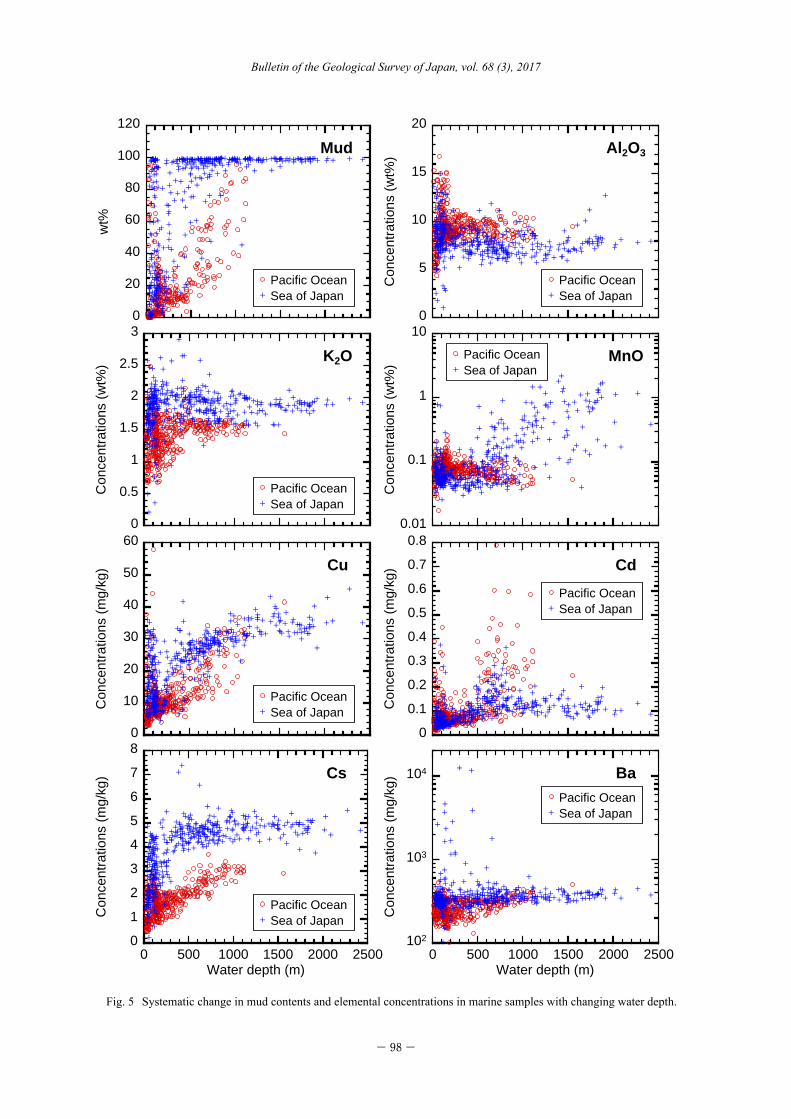
Figure 5 shows the mud contents and elemental concent-rations of marine sediments from the Sea of Japan and the Pacific Ocean near Tohoku according to water depth. Except for the shallow water of Sendai Bay and the shelf offshore from the Niigata region, mud content in the Pacific Ocean increases gradually with water depth and steeply below 500 m, whereas mud content in the Sea of Japan increases steeply with water depth and becomes steady (90–100%) below depths of about 200–500 m. Correspondingly, changes in the elemental concentrations in sediments are similar to the systematic changes in mud content with water depth (see Cu and Cs in Fig. 5). The concentrations of many elements, such as MgO, Al2O3, K2O, TiO2, Fe2O3, vary greatly on the shelf (water depth (WD) = 0–200 m), but become constant below 200 m. Some elements present distinctive changes outside of this rule. Sediments collected around submarine topographic highs in the Sea of Japan (WD = 100–600 m) are abundant in Be, K2O, Rb, Cs, Ba, and light REEs (La–Gd). The MnO, As and Mo concentrations increase steeply at depths below 500 m in the Sea of Japan (particularly the Toyama Trough and Yamato Basin). Cd, Hg and U concentrations are very high within 500–1,100 m in depth in both marine areas, but reach a constant low in deeper parts (>1,100 m) of the Sea of Japan.
6. Discussion
6. 1 Comparison of elemental abundances in stream and marine sediments between the Sea of Japan and the Pacific Ocean and with grain size
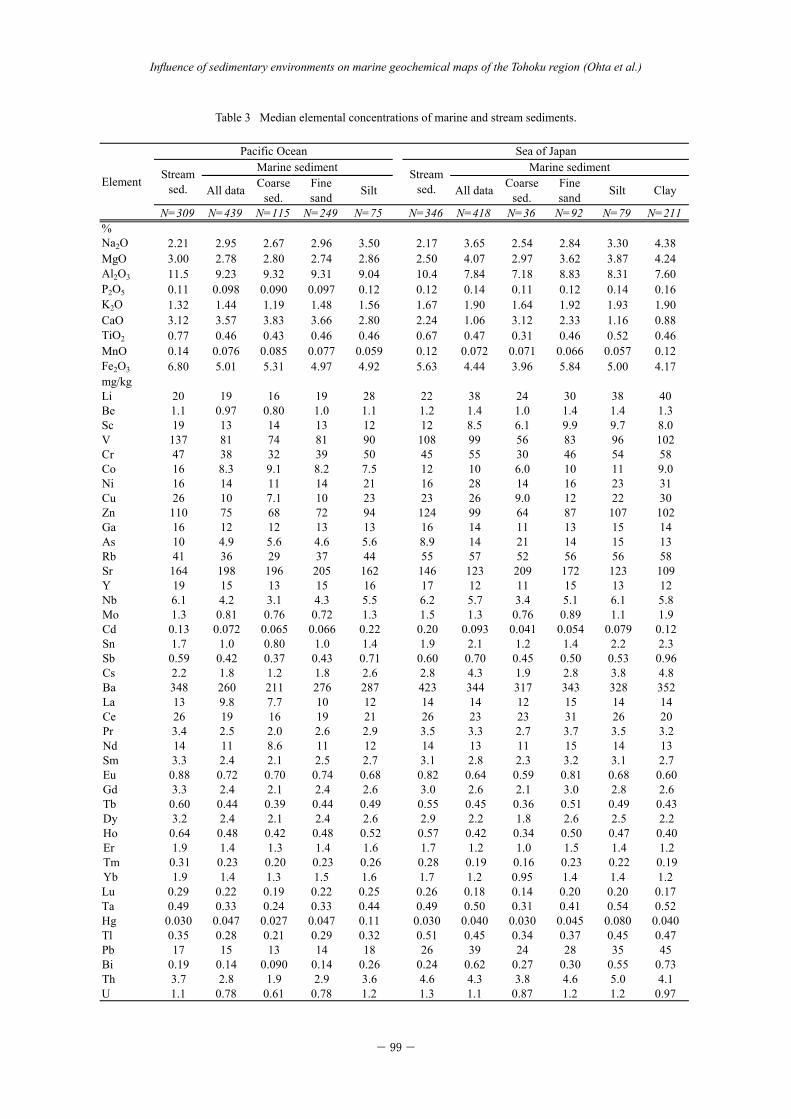
We have confirmed the geochemical features of terrestrial and marine environments of the Tohoku region using geochemical maps (Fig. 4). Figure 5 shows that the depositional or sedimentary environments systematically differ between the Sea of Japan and the Pacific Ocean. Next, we averaged the geochemical data to quantify the systematic differences in the chemical compositions of marine sediments. Figure 6 shows the median elemental concentrations of stream and marine sediments for both the Pacific Ocean and the Sea of Japan; these concentrations have been normalized to upper continental crust (UCC) values (Taylor and McLennan, 1995). The median is a robust estimation of the mean value that is less susceptible to outlier bias. Calculated median data are shown in Table 3. Stream sediments are rich in Sc, TiO2, V, Cr, MnO, Fe2O3, Co, Zn, As and Sb but poor in Be, K2O, Rb, Nb, Sn, Ta, Th, and U relative to UCC. As pointed out by Ujiie-Mikoshiba et al. (2006), stream sediments of the Tohoku region reflect the geochemical characteristics of igneous rocks in the orogenic arc. The UCC-normalized patterns of stream sediments on the Pacific Ocean side of Tohoku are similar to those on the Sea of Japan side. Sea of Japan sediments are somewhat abundant in K2O, Rb, Mo, Cd, Cs, Ba, Tl, Pb, Bi, Th and U, which may be attributed to felsic
− 98 −
Bulletin of the Geological Survey of Japan, vol. 68 (3), 2017
0
20
40
60
80
100
120w
t%
Pacific OceanSea of Japan
0
5
10
15
20
Con
cent
ratio
ns (w
t%)
0
0.5
1
1.5
2
2.5
3
Con
cent
ratio
ns (w
t%)
0.01
0.1
1
10
Con
cent
ratio
ns (w
t%)
0
10
20
30
40
50
60
Con
cent
ratio
ns (m
g/kg
)
0
0.1
0.2
0.3
0.4
0.5
0.6
0.7
0.8
Con
cent
ratio
ns (m
g/kg
)
0
1
2
3
4
5
6
7
8
0 500 1000 1500 2000 2500
Con
cent
ratio
ns (m
g/kg
)
Water depth (m)
102
103
104
0 500 1000 1500 2000 2500
Mud Al2O3
K2O MnO
Cu Cd
Cs Ba
Con
cent
ratio
ns (m
g/kg
)
Water depth (m)
Pacific OceanSea of Japan
Pacific OceanSea of Japan
Pacific OceanSea of Japan
Pacific OceanSea of Japan
Pacific OceanSea of Japan
Pacific OceanSea of Japan
Pacific OceanSea of Japan
Figure 5 (Ohta et al.)Fig. 5 Systematic change in mud contents and elemental concentrations in marine samples with changing water depth.
− 99 −
Influence of sedimentary environments on marine geochemical maps of the Tohoku region (Ohta et al.)
Table 3 (Ohta et al .)
All data Coarsesed.
Finesand Silt All data Coarse
sed.Finesand Silt Clay
N=309 N=439 N=115 N=249 N=75 N=346 N=418 N=36 N=92 N=79 N=211%Na2O 2.21 2.95 2.67 2.96 3.50 2.17 3.65 2.54 2.84 3.30 4.38MgO 3.00 2.78 2.80 2.74 2.86 2.50 4.07 2.97 3.62 3.87 4.24Al2O3 11.5 9.23 9.32 9.31 9.04 10.4 7.84 7.18 8.83 8.31 7.60P2O5 0.11 0.098 0.090 0.097 0.12 0.12 0.14 0.11 0.12 0.14 0.16K2O 1.32 1.44 1.19 1.48 1.56 1.67 1.90 1.64 1.92 1.93 1.90CaO 3.12 3.57 3.83 3.66 2.80 2.24 1.06 3.12 2.33 1.16 0.88TiO2 0.77 0.46 0.43 0.46 0.46 0.67 0.47 0.31 0.46 0.52 0.46MnO 0.14 0.076 0.085 0.077 0.059 0.12 0.072 0.071 0.066 0.057 0.12Fe2O3 6.80 5.01 5.31 4.97 4.92 5.63 4.44 3.96 5.84 5.00 4.17mg/kgLi 20 19 16 19 28 22 38 24 30 38 40Be 1.1 0.97 0.80 1.0 1.1 1.2 1.4 1.0 1.4 1.4 1.3Sc 19 13 14 13 12 12 8.5 6.1 9.9 9.7 8.0V 137 81 74 81 90 108 99 56 83 96 102Cr 47 38 32 39 50 45 55 30 46 54 58Co 16 8.3 9.1 8.2 7.5 12 10 6.0 10 11 9.0Ni 16 14 11 14 21 16 28 14 16 23 31Cu 26 10 7.1 10 23 23 26 9.0 12 22 30Zn 110 75 68 72 94 124 99 64 87 107 102Ga 16 12 12 13 13 16 14 11 13 15 14As 10 4.9 5.6 4.6 5.6 8.9 14 21 14 15 13Rb 41 36 29 37 44 55 57 52 56 56 58Sr 164 198 196 205 162 146 123 209 172 123 109Y 19 15 13 15 16 17 12 11 15 13 12Nb 6.1 4.2 3.1 4.3 5.5 6.2 5.7 3.4 5.1 6.1 5.8Mo 1.3 0.81 0.76 0.72 1.3 1.5 1.3 0.76 0.89 1.1 1.9Cd 0.13 0.072 0.065 0.066 0.22 0.20 0.093 0.041 0.054 0.079 0.12Sn 1.7 1.0 0.80 1.0 1.4 1.9 2.1 1.2 1.4 2.2 2.3Sb 0.59 0.42 0.37 0.43 0.71 0.60 0.70 0.45 0.50 0.53 0.96Cs 2.2 1.8 1.2 1.8 2.6 2.8 4.3 1.9 2.8 3.8 4.8Ba 348 260 211 276 287 423 344 317 343 328 352La 13 9.8 7.7 10 12 14 14 12 15 14 14Ce 26 19 16 19 21 26 23 23 31 26 20Pr 3.4 2.5 2.0 2.6 2.9 3.5 3.3 2.7 3.7 3.5 3.2Nd 14 11 8.6 11 12 14 13 11 15 14 13Sm 3.3 2.4 2.1 2.5 2.7 3.1 2.8 2.3 3.2 3.1 2.7Eu 0.88 0.72 0.70 0.74 0.68 0.82 0.64 0.59 0.81 0.68 0.60Gd 3.3 2.4 2.1 2.4 2.6 3.0 2.6 2.1 3.0 2.8 2.6Tb 0.60 0.44 0.39 0.44 0.49 0.55 0.45 0.36 0.51 0.49 0.43Dy 3.2 2.4 2.1 2.4 2.6 2.9 2.2 1.8 2.6 2.5 2.2Ho 0.64 0.48 0.42 0.48 0.52 0.57 0.42 0.34 0.50 0.47 0.40Er 1.9 1.4 1.3 1.4 1.6 1.7 1.2 1.0 1.5 1.4 1.2Tm 0.31 0.23 0.20 0.23 0.26 0.28 0.19 0.16 0.23 0.22 0.19Yb 1.9 1.4 1.3 1.5 1.6 1.7 1.2 0.95 1.4 1.4 1.2Lu 0.29 0.22 0.19 0.22 0.25 0.26 0.18 0.14 0.20 0.20 0.17Ta 0.49 0.33 0.24 0.33 0.44 0.49 0.50 0.31 0.41 0.54 0.52Hg 0.030 0.047 0.027 0.047 0.11 0.030 0.040 0.030 0.045 0.080 0.040Tl 0.35 0.28 0.21 0.29 0.32 0.51 0.45 0.34 0.37 0.45 0.47Pb 17 15 13 14 18 26 39 24 28 35 45Bi 0.19 0.14 0.090 0.14 0.26 0.24 0.62 0.27 0.30 0.55 0.73Th 3.7 2.8 1.9 2.9 3.6 4.6 4.3 3.8 4.6 5.0 4.1U 1.1 0.78 0.61 0.78 1.2 1.3 1.1 0.87 1.2 1.2 0.97
Element
Pacific Ocean Sea of JapanMarine sediment Marine sedimentStream
sed.Stream
sed.
Table 3 Median elemental concentrations of marine and stream sediments.
−100−
Bulletin of the Geological Survey of Japan, vol. 68 (3), 2017
igneous rocks and metalliferous deposits associated with Neogene felsic volcanic rocks. UCC-normalized values for marine sediments are systematically lower than those of stream sediments, although they have fundamentally similar geochemical features. Marine sediments of the Sea of Japan are relatively abundant in Li, MgO, P2O5, K2O, Cr, Ni, Cu, Zn, As, Rb, Mo, Sn, Cs, Ba, light REEs, Tl, Pb, Bi, Th and U, but scarce in CaO, Sc, and Sr compared to those of the Pacific Ocean.
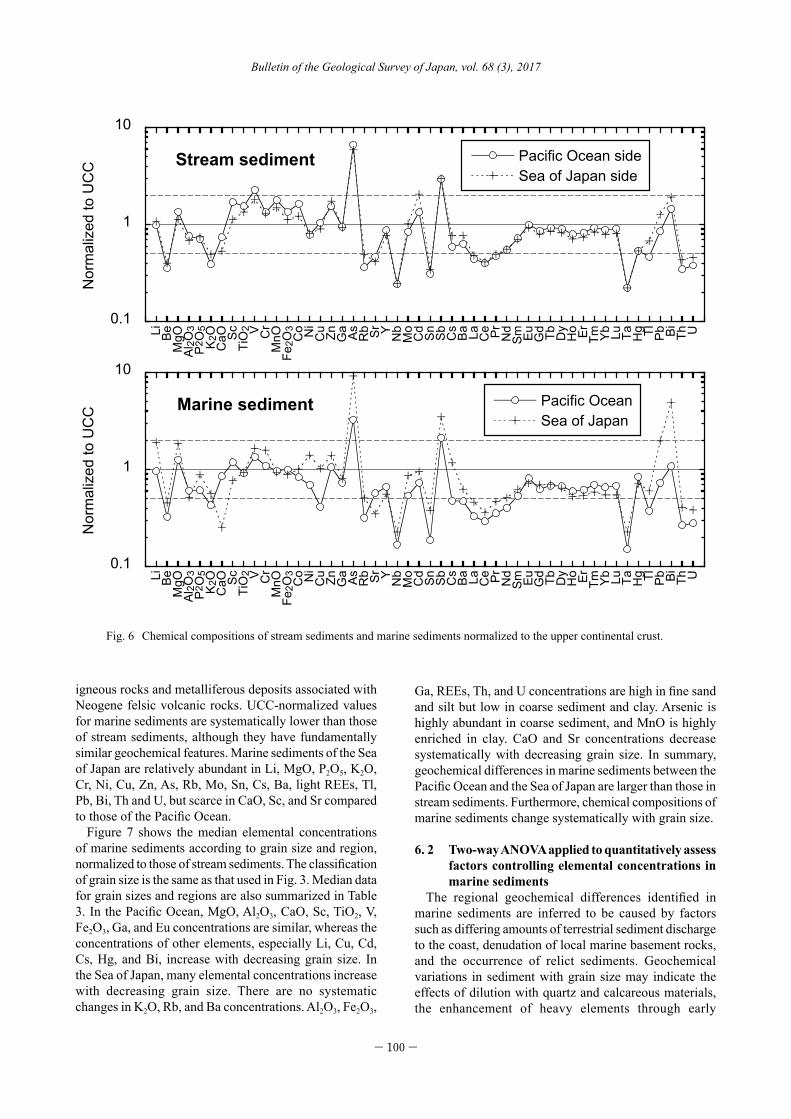
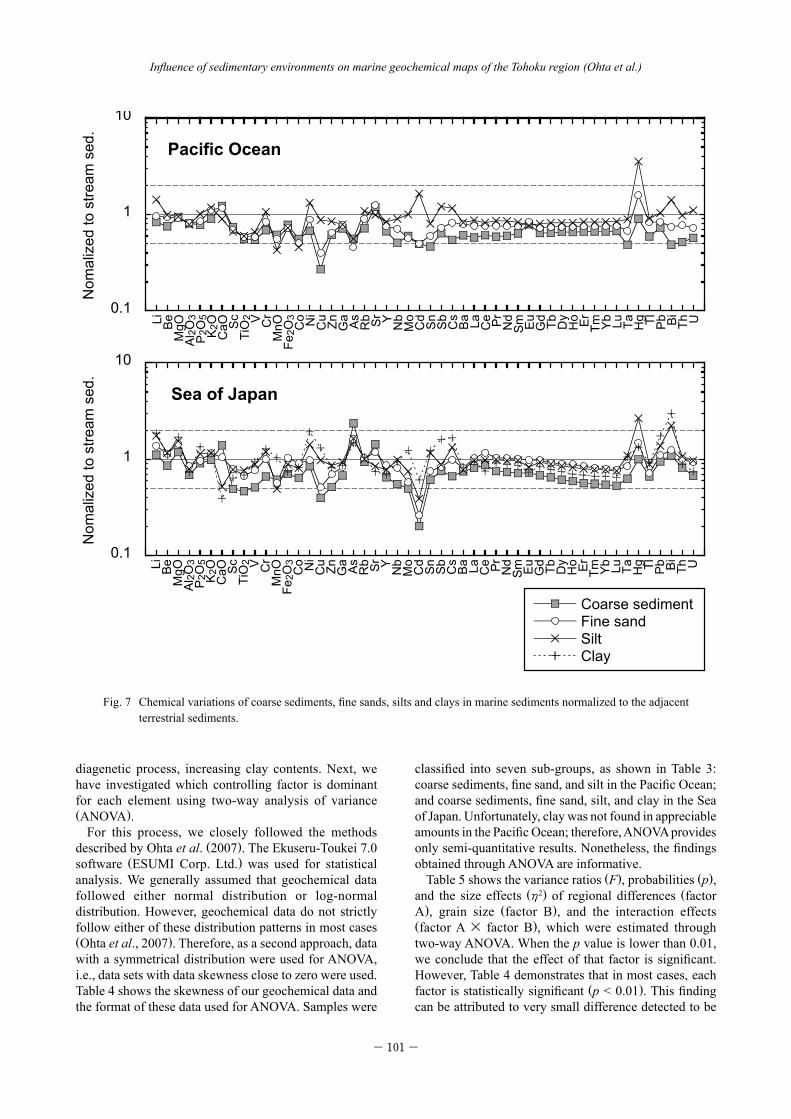
Figure 7 shows the median elemental concentrations of marine sediments according to grain size and region, normalized to those of stream sediments. The classification of grain size is the same as that used in Fig. 3. Median data for grain sizes and regions are also summarized in Table 3. In the Pacific Ocean, MgO, Al2O3, CaO, Sc, TiO2, V, Fe2O3, Ga, and Eu concentrations are similar, whereas the concentrations of other elements, especially Li, Cu, Cd, Cs, Hg, and Bi, increase with decreasing grain size. In the Sea of Japan, many elemental concentrations increase with decreasing grain size. There are no systematic changes in K2O, Rb, and Ba concentrations. Al2O3, Fe2O3,
Ga, REEs, Th, and U concentrations are high in fine sand and silt but low in coarse sediment and clay. Arsenic is highly abundant in coarse sediment, and MnO is highly enriched in clay. CaO and Sr concentrations decrease systematically with decreasing grain size. In summary, geochemical differences in marine sediments between the Pacific Ocean and the Sea of Japan are larger than those in stream sediments. Furthermore, chemical compositions of marine sediments change systematically with grain size.
6. 2 Two-way ANOVA applied to quantitatively assess factors controlling elemental concentrations in marine sediments
The regional geochemical differences identified in marine sediments are inferred to be caused by factors such as differing amounts of terrestrial sediment discharge to the coast, denudation of local marine basement rocks, and the occurrence of relict sediments. Geochemical variations in sediment with grain size may indicate the effects of dilution with quartz and calcareous materials, the enhancement of heavy elements through early
0.1
1
10
Li BeM
gOA
l 2O
3P
2 O5
K2O
CaO Sc
TiO
2 V Cr
MnO
Fe2O
3C
o Ni
Cu Zn Ga As Rb Sr Y Nb
Mo
Cd Sn Sb Cs
Ba La Ce Pr Nd
Sm Eu Gd Tb Dy
Ho Er Tm Yb Lu Ta Hg Tl Pb Bi Th U
Nor
mal
ized
to U
CC
0.1
1
10
Li BeM
gOA
l 2O
3P
2 O5
K2O
CaO Sc
TiO
2 V Cr
MnO
Fe2O
3C
o Ni
Cu Zn Ga As Rb Sr Y Nb
Mo
Cd Sn Sb Cs
Ba La Ce Pr Nd
Sm Eu Gd Tb Dy
Ho Er Tm Yb Lu Ta Hg Tl Pb Bi Th U
Nor
mal
ized
to U
CC
Figure 6 (Ohta et al.)
Stream sediment Pacific Ocean sideSea of Japan side
Marine sediment Pacific OceanSea of Japan
Fig. 6 Chemical compositions of stream sediments and marine sediments normalized to the upper continental crust.
− 101 −
Influence of sedimentary environments on marine geochemical maps of the Tohoku region (Ohta et al.)
0.1
1
10
Li BeM
gOA
l 2O
3P
2O5
K2O
CaO Sc
TiO
2 V Cr
MnO
Fe2O
3C
o Ni
Cu Zn Ga As Rb Sr Y Nb
Mo
Cd Sn Sb Cs
Ba La Ce Pr Nd
Sm Eu Gd Tb Dy
Ho Er Tm Yb Lu Ta Hg Tl Pb Bi Th U
Pacific Ocean
Nom
aliz
ed to
stre
am s
ed.
0.1
1
10
Li BeM
gOA
l 2O
3P
2O5
K2O
CaO Sc
TiO
2 V Cr
MnO
Fe2O
3C
o Ni
Cu Zn Ga As Rb Sr Y Nb
Mo
Cd Sn Sb Cs
Ba La Ce Pr Nd
Sm Eu Gd Tb Dy
Ho Er Tm Yb Lu Ta Hg Tl Pb Bi Th U
Sea of Japan
Nom
aliz
ed to
stre
am s
ed.
Coarse sedimentFine sandSiltClay
Figure 7 (Ohta et al.)Fig. 7 Chemical variations of coarse sediments, fine sands, silts and clays in marine sediments normalized to the adjacent
terrestrial sediments.
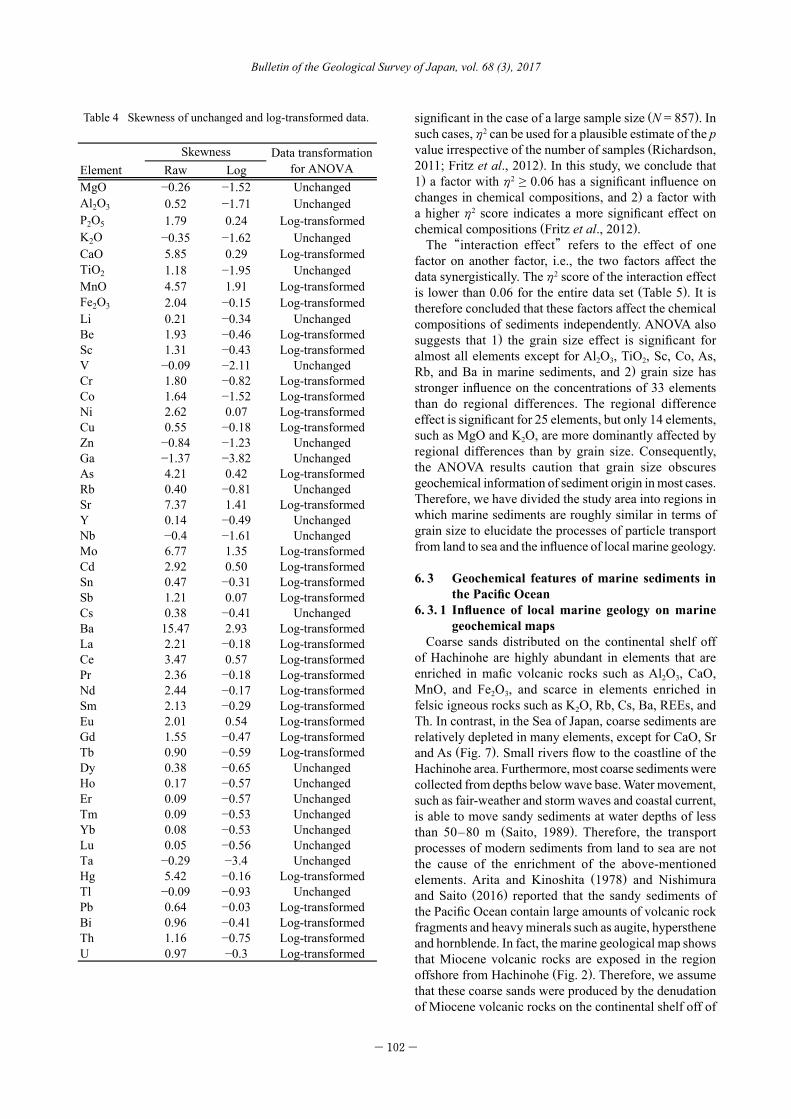
diagenetic process, increasing clay contents. Next, we have investigated which controlling factor is dominant for each element using two-way analysis of variance (ANOVA).
For this process, we closely followed the methods described by Ohta et al. (2007). The Ekuseru-Toukei 7.0 software (ESUMI Corp. Ltd.) was used for statistical analysis. We generally assumed that geochemical data followed either normal distribution or log-normal distribution. However, geochemical data do not strictly follow either of these distribution patterns in most cases (Ohta et al., 2007). Therefore, as a second approach, data with a symmetrical distribution were used for ANOVA, i.e., data sets with data skewness close to zero were used. Table 4 shows the skewness of our geochemical data and the format of these data used for ANOVA. Samples were
classified into seven sub-groups, as shown in Table 3: coarse sediments, fine sand, and silt in the Pacific Ocean; and coarse sediments, fine sand, silt, and clay in the Sea of Japan. Unfortunately, clay was not found in appreciable amounts in the Pacific Ocean; therefore, ANOVA provides only semi-quantitative results. Nonetheless, the findings obtained through ANOVA are informative.
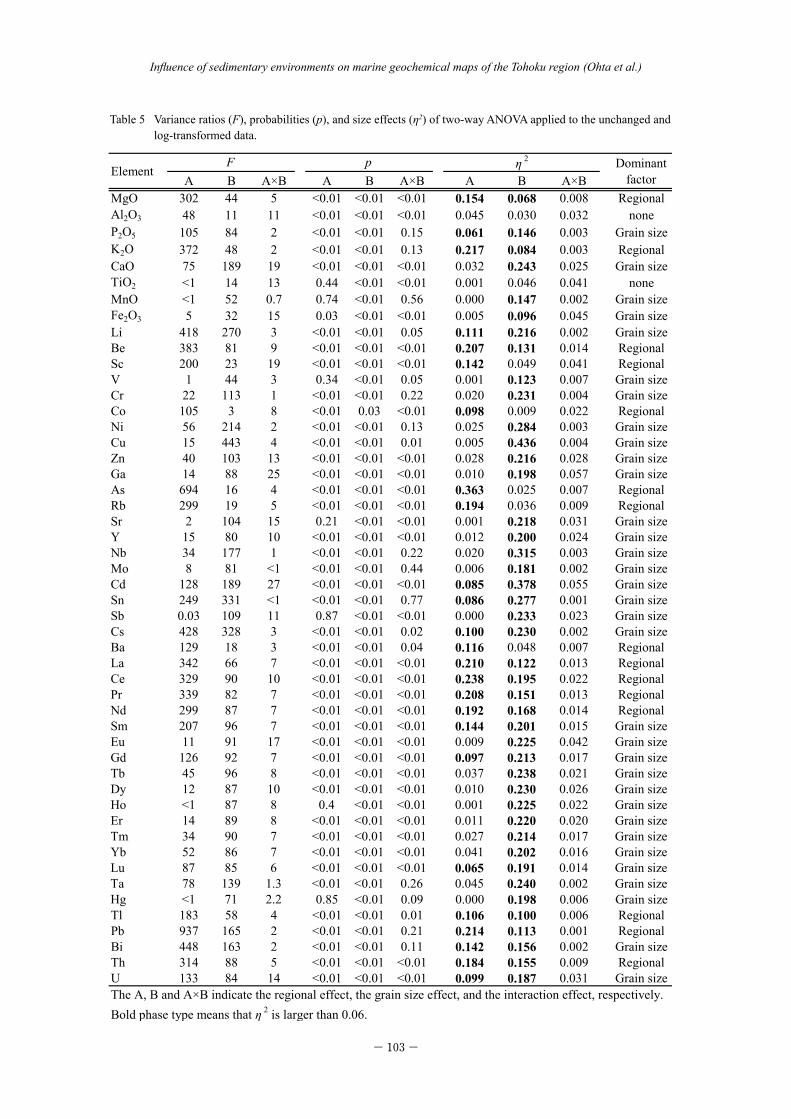
Table 5 shows the variance ratios (F), probabilities (p), and the size effects (η2) of regional differences (factor A), grain size (factor B), and the interaction effects (factor A × factor B), which were estimated through two-way ANOVA. When the p value is lower than 0.01, we conclude that the effect of that factor is significant. However, Table 4 demonstrates that in most cases, each factor is statistically significant (p < 0.01). This finding can be attributed to very small difference detected to be
−102−
Bulletin of the Geological Survey of Japan, vol. 68 (3), 2017
significant in the case of a large sample size (N = 857). In such cases, η2 can be used for a plausible estimate of the p value irrespective of the number of samples (Richardson, 2011; Fritz et al., 2012). In this study, we conclude that 1) a factor with η2 ≥ 0.06 has a significant influence on changes in chemical compositions, and 2) a factor with a higher η2 score indicates a more significant effect on chemical compositions (Fritz et al., 2012).
The “interaction effect” refers to the effect of one factor on another factor, i.e., the two factors affect the data synergistically. The η2 score of the interaction effect is lower than 0.06 for the entire data set (Table 5). It is therefore concluded that these factors affect the chemical compositions of sediments independently. ANOVA also suggests that 1) the grain size effect is significant for almost all elements except for Al2O3, TiO2, Sc, Co, As, Rb, and Ba in marine sediments, and 2) grain size has stronger influence on the concentrations of 33 elements than do regional differences. The regional difference effect is significant for 25 elements, but only 14 elements, such as MgO and K2O, are more dominantly affected by regional differences than by grain size. Consequently, the ANOVA results caution that grain size obscures geochemical information of sediment origin in most cases. Therefore, we have divided the study area into regions in which marine sediments are roughly similar in terms of grain size to elucidate the processes of particle transport from land to sea and the influence of local marine geology.
6. 3 Geochemical features of marine sediments in the Pacific Ocean
6. 3. 1 Influence of local marine geology on marine geochemical maps
Coarse sands distributed on the continental shelf off of Hachinohe are highly abundant in elements that are enriched in mafic volcanic rocks such as Al2O3, CaO, MnO, and Fe2O3, and scarce in elements enriched in felsic igneous rocks such as K2O, Rb, Cs, Ba, REEs, and Th. In contrast, in the Sea of Japan, coarse sediments are relatively depleted in many elements, except for CaO, Sr and As (Fig. 7). Small rivers flow to the coastline of the Hachinohe area. Furthermore, most coarse sediments were collected from depths below wave base. Water movement, such as fair-weather and storm waves and coastal current, is able to move sandy sediments at water depths of less than 50–80 m (Saito, 1989). Therefore, the transport processes of modern sediments from land to sea are not the cause of the enrichment of the above-mentioned elements. Arita and Kinoshita (1978) and Nishimura and Saito (2016) reported that the sandy sediments of the Pacific Ocean contain large amounts of volcanic rock fragments and heavy minerals such as augite, hypersthene and hornblende. In fact, the marine geological map shows that Miocene volcanic rocks are exposed in the region offshore from Hachinohe (Fig. 2). Therefore, we assume that these coarse sands were produced by the denudation of Miocene volcanic rocks on the continental shelf off of
Element Raw LogMgO −0.26 −1.52 UnchangedAl2O3 0.52 −1.71 UnchangedP2O5 1.79 0.24 Log-transformedK2O −0.35 −1.62 UnchangedCaO 5.85 0.29 Log-transformedTiO2 1.18 −1.95 UnchangedMnO 4.57 1.91 Log-transformedFe2O3 2.04 −0.15 Log-transformedLi 0.21 −0.34 UnchangedBe 1.93 −0.46 Log-transformedSc 1.31 −0.43 Log-transformedV −0.09 −2.11 UnchangedCr 1.80 −0.82 Log-transformedCo 1.64 −1.52 Log-transformedNi 2.62 0.07 Log-transformedCu 0.55 −0.18 Log-transformedZn −0.84 −1.23 UnchangedGa −1.37 −3.82 UnchangedAs 4.21 0.42 Log-transformedRb 0.40 −0.81 UnchangedSr 7.37 1.41 Log-transformedY 0.14 −0.49 UnchangedNb −0.4 −1.61 UnchangedMo 6.77 1.35 Log-transformedCd 2.92 0.50 Log-transformedSn 0.47 −0.31 Log-transformedSb 1.21 0.07 Log-transformedCs 0.38 −0.41 UnchangedBa 15.47 2.93 Log-transformedLa 2.21 −0.18 Log-transformedCe 3.47 0.57 Log-transformedPr 2.36 −0.18 Log-transformedNd 2.44 −0.17 Log-transformedSm 2.13 −0.29 Log-transformedEu 2.01 0.54 Log-transformedGd 1.55 −0.47 Log-transformedTb 0.90 −0.59 Log-transformedDy 0.38 −0.65 UnchangedHo 0.17 −0.57 UnchangedEr 0.09 −0.57 UnchangedTm 0.09 −0.53 UnchangedYb 0.08 −0.53 UnchangedLu 0.05 −0.56 UnchangedTa −0.29 −3.4 UnchangedHg 5.42 −0.16 Log-transformedTl −0.09 −0.93 UnchangedPb 0.64 −0.03 Log-transformedBi 0.96 −0.41 Log-transformedTh 1.16 −0.75 Log-transformedU 0.97 −0.3 Log-transformed
Table 4 (Ohta et al .)Data transformation
for ANOVASkewness
Table 4 Skewness of unchanged and log-transformed data.
− 103 −
Influence of sedimentary environments on marine geochemical maps of the Tohoku region (Ohta et al.)
A B A×B A B A×B A B A×BMgO 302 44 5 <0.01 <0.01 <0.01 0.154 0.068 0.008 RegionalAl2O3 48 11 11 <0.01 <0.01 <0.01 0.045 0.030 0.032 noneP2O5 105 84 2 <0.01 <0.01 0.15 0.061 0.146 0.003 Grain sizeK2O 372 48 2 <0.01 <0.01 0.13 0.217 0.084 0.003 RegionalCaO 75 189 19 <0.01 <0.01 <0.01 0.032 0.243 0.025 Grain sizeTiO2 <1 14 13 0.44 <0.01 <0.01 0.001 0.046 0.041 noneMnO <1 52 0.7 0.74 <0.01 0.56 0.000 0.147 0.002 Grain sizeFe2O3 5 32 15 0.03 <0.01 <0.01 0.005 0.096 0.045 Grain sizeLi 418 270 3 <0.01 <0.01 0.05 0.111 0.216 0.002 Grain sizeBe 383 81 9 <0.01 <0.01 <0.01 0.207 0.131 0.014 RegionalSc 200 23 19 <0.01 <0.01 <0.01 0.142 0.049 0.041 RegionalV 1 44 3 0.34 <0.01 0.05 0.001 0.123 0.007 Grain sizeCr 22 113 1 <0.01 <0.01 0.22 0.020 0.231 0.004 Grain sizeCo 105 3 8 <0.01 0.03 <0.01 0.098 0.009 0.022 RegionalNi 56 214 2 <0.01 <0.01 0.13 0.025 0.284 0.003 Grain sizeCu 15 443 4 <0.01 <0.01 0.01 0.005 0.436 0.004 Grain sizeZn 40 103 13 <0.01 <0.01 <0.01 0.028 0.216 0.028 Grain sizeGa 14 88 25 <0.01 <0.01 <0.01 0.010 0.198 0.057 Grain sizeAs 694 16 4 <0.01 <0.01 <0.01 0.363 0.025 0.007 RegionalRb 299 19 5 <0.01 <0.01 <0.01 0.194 0.036 0.009 RegionalSr 2 104 15 0.21 <0.01 <0.01 0.001 0.218 0.031 Grain sizeY 15 80 10 <0.01 <0.01 <0.01 0.012 0.200 0.024 Grain sizeNb 34 177 1 <0.01 <0.01 0.22 0.020 0.315 0.003 Grain sizeMo 8 81 <1 <0.01 <0.01 0.44 0.006 0.181 0.002 Grain sizeCd 128 189 27 <0.01 <0.01 <0.01 0.085 0.378 0.055 Grain sizeSn 249 331 <1 <0.01 <0.01 0.77 0.086 0.277 0.001 Grain sizeSb 0.03 109 11 0.87 <0.01 <0.01 0.000 0.233 0.023 Grain sizeCs 428 328 3 <0.01 <0.01 0.02 0.100 0.230 0.002 Grain sizeBa 129 18 3 <0.01 <0.01 0.04 0.116 0.048 0.007 RegionalLa 342 66 7 <0.01 <0.01 <0.01 0.210 0.122 0.013 RegionalCe 329 90 10 <0.01 <0.01 <0.01 0.238 0.195 0.022 RegionalPr 339 82 7 <0.01 <0.01 <0.01 0.208 0.151 0.013 RegionalNd 299 87 7 <0.01 <0.01 <0.01 0.192 0.168 0.014 RegionalSm 207 96 7 <0.01 <0.01 <0.01 0.144 0.201 0.015 Grain sizeEu 11 91 17 <0.01 <0.01 <0.01 0.009 0.225 0.042 Grain sizeGd 126 92 7 <0.01 <0.01 <0.01 0.097 0.213 0.017 Grain sizeTb 45 96 8 <0.01 <0.01 <0.01 0.037 0.238 0.021 Grain sizeDy 12 87 10 <0.01 <0.01 <0.01 0.010 0.230 0.026 Grain sizeHo <1 87 8 0.4 <0.01 <0.01 0.001 0.225 0.022 Grain sizeEr 14 89 8 <0.01 <0.01 <0.01 0.011 0.220 0.020 Grain sizeTm 34 90 7 <0.01 <0.01 <0.01 0.027 0.214 0.017 Grain sizeYb 52 86 7 <0.01 <0.01 <0.01 0.041 0.202 0.016 Grain sizeLu 87 85 6 <0.01 <0.01 <0.01 0.065 0.191 0.014 Grain sizeTa 78 139 1.3 <0.01 <0.01 0.26 0.045 0.240 0.002 Grain sizeHg <1 71 2.2 0.85 <0.01 0.09 0.000 0.198 0.006 Grain sizeTl 183 58 4 <0.01 <0.01 0.01 0.106 0.100 0.006 RegionalPb 937 165 2 <0.01 <0.01 0.21 0.214 0.113 0.001 RegionalBi 448 163 2 <0.01 <0.01 0.11 0.142 0.156 0.002 Grain sizeTh 314 88 5 <0.01 <0.01 <0.01 0.184 0.155 0.009 RegionalU 133 84 14 <0.01 <0.01 <0.01 0.099 0.187 0.031 Grain size
Bold phase type means that η 2 is larger than 0.06.
Element
The A, B and A×B indicate the regional effect, the grain size effect, and the interaction effect, respectively.
Table 5 (Ohta et al .)F p η 2 Dominant
factor
Table 5 Variance ratios (F), probabilities (p), and size effects (η2) of two-way ANOVA applied to the unchanged and log-transformed data.
−104−
Bulletin of the Geological Survey of Japan, vol. 68 (3), 2017
Hachinohe during regression and transgression.
6. 3. 2 Particle transport from land to sea and within the marine environment in the Pacific Ocean
The distribution of silts in Sendai Bay is evidence for the input of modern sediments from rivers because major rivers that drain into the Pacific Ocean flow into Sendai Bay (Table 1). The concentrations of many elements, such as Cu, As, Cd, Yb, and Pb, in silt from Sendai Bay are higher than those in near-shore sandy sediments because of the grain size effect. Silts on the deep continental slope of the Pacific Ocean also have high concentrations of Li, Cr, Ni, Cu, Nb, Mo, Cd, Sn, Sb, Cs, Ta, Hg, Bi, and U, which can be explained by the same effect. The concentrations of many elements in silt both in Sendai Bay and on the continental slope are similar. However, the Zn, As, Hg, and Pb concentrations of silts in Sendai Bay are half as high as those of silts on the continental slope. Their enrichment may be attributed to anthropogenic activity or the supply of ore minerals from the Hosokura Mine.
The coarse sediments distributing on the continental shelf off of Shioyazaki are remarkably depleted in most elements except for As and Ba. Dilution effects caused by preferential enrichment in quartz and feldspar, which may be supplied from granitic rocks of the nearby Abukuma Mountains, may be the cause. The same phenomenon is observed on the continental shelf off of the Atsumi Peninsula of the Tokai Region (Ohta et al., 2007). Quartz and feldspar generally do not become small grains because of their resistance to physical weathering processes (e.g., Goldich, 1938). Consequently, these minerals are not transported by water movement to the degree that small grains of minerals such as mica, biotite, and amphibole are, and selectively accumulate on the continental shelf. This important mineralogical fractionation obscures sediment origin information.
The spatial distributions of many elements, such as K2O, Rb, Nb, REEs, and Th, are continuous between the Kitakami Mountains and the nearby the coast off of Kamaishi (e.g., K2O, La, and U in Fig. 4). As explained above, marine sediments in the Pacific Ocean in this region are influenced by mafic volcanic rocks (Nishimura and Saito, 2016), which are associated with lower Li, K2O, Rb, Cs, Ba, Nb, REEs, Ta, and Th concentrations in sediments. Therefore, the influence of sediments that originated from granitic intrusions and accretionary complexes becomes apparent. However, the rivers that flow through the Kitakami Mountains to the coast near Kamaishi are small, and their sediment yields are low. In addition, most of the marine sediments sampled were collected from water depths of 50–150 m, below wave base. Accordingly, these samples are interpreted as relict sediments that originated from coastal erosion and/or denudation of granitic rocks and accretionary complexes during regression and transgression.
The wide distribution of fine sands on the continental shelf and slope off of Kamaishi is clearly explained by
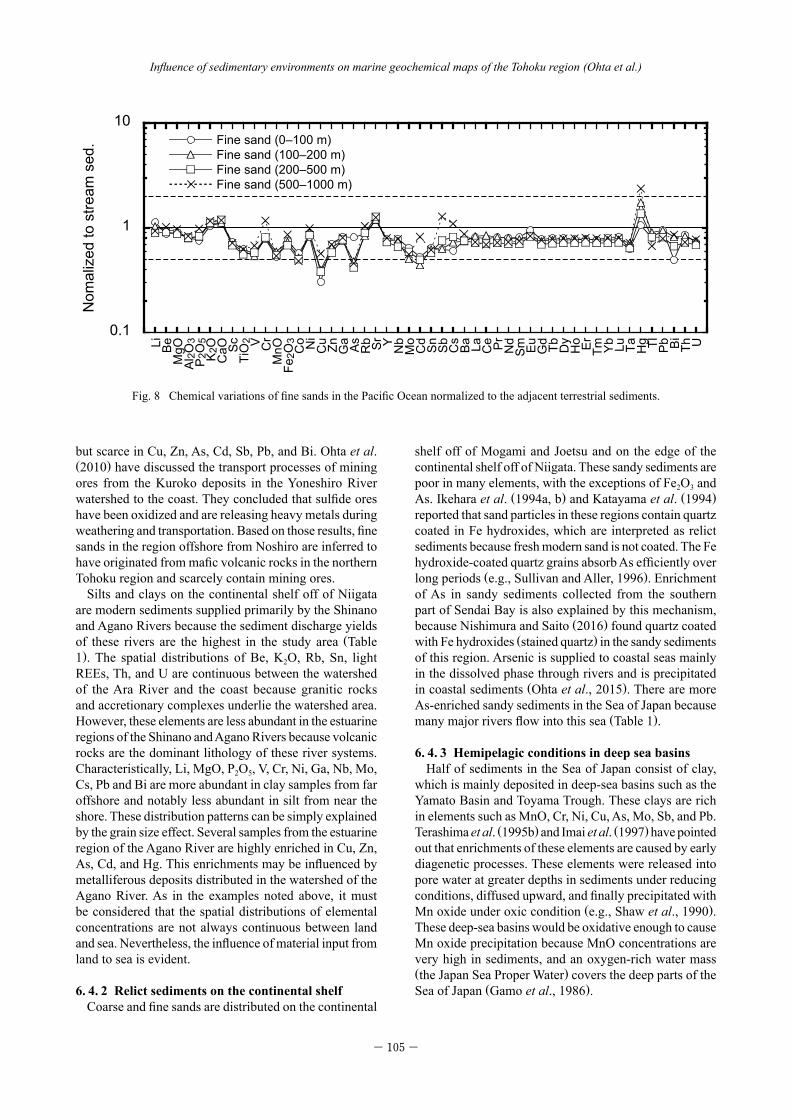
the deposition of relict sediments because most of these samples were deposited below the depth of wave base and away from the shore (Fig. 3). Noda and TuZino (2007) reported that sandy sediments on the edge of the continental shelf and on the continental slope are transported gradually by a gravity to a deeper area offshore from Nemuro, Hokkaido, Japan, which results in the formation of numerous gullies on the slope. However, there are few submarine canyons in the Pacific Ocean near the Tohoku region except for in the region off of Kamaishi (Yashima et al., 1982; Shimamura, 2008). Therefore, sediments may be conveyed to deeper areas via massive submarine landslides or sheet flows. Otherwise, these sediments may be produced by denudation of basement rocks such as Neogene sedimentary rocks (Fig. 2). Figure 8 shows that the median concentrations of elements in fine sands are classified with water depths, which are normalized to stream sediments on the Pacific Ocean side. We followed the convention of dividing the samples into four groups: the shelf (WD = 0–100 m), the edge of the shelf (WD = 100–200 m), the upper slope (WD = 200–500 m), and the lower slope (WD = 500–1,000 m). The shelf was an erosional region during regression and subsequently shifted to a depositional environment during transgression. The edge of the shelf was under depositional conditions even during transgression. The upper slope has thin Quaternary sediments overlying Miocene sediments (Okamura and Tanahashi, 1983). The lower slope is a deep-sea terrace. Figure 8 shows that normalized patterns of fine sediments in the Pacific Ocean are fairly consistent; their mean chemical compositions are similar to those of terrestrial areas influenced by orogenic belt volcanism, as explained above. Furthermore, no significant differences are apparent among samples; marine sediments in the Pacific Ocean have very homogenous geochemical features. Enrichment in Cr, Fe2O3, Cu, Cd, Sb, Cs, and Hg in sandy sediments collected from sea-floor depth of over 500 m (Fig. 3) is explained by the increase in the proportion of silts. These results suggest that fine sands were deposited on the continental shelf under the influence of volcanic activity during a regression/transgression and have been transported from the continental shelf to the deep sea by gravity currents. From geochemical mapping of the Pacific Ocean, we observe two kinds of particle transport, i.e., present and past particle transportation, from land to sea.
6. 4 Geochemical features of marine sediments in the Sea of Japan
6. 4.1 Particle transport processes from land to marine environments in the Sea of Japan
Sediments on the continental shelf off of Noshiro are expected to be influenced by Kuroko deposits because there are many geochemical anomalies found in the watershed area of the Yoneshiro River (Cu, Cd, and Pb in Fig. 4). Fine sands in the region off of Noshiro are abundant in Al2O3, Sc, TiO2, Fe2O3, Co, and heavy REEs,
− 105 −
Influence of sedimentary environments on marine geochemical maps of the Tohoku region (Ohta et al.)
Figure 8 (Ohta et al.)
0.1
1
10
Li BeM
gOA
l 2O
3P
2O5
K2O
CaO Sc
TiO
2 V Cr
MnO
Fe2O
3C
o Ni
Cu Zn Ga As Rb Sr Y Nb
Mo
Cd Sn Sb Cs
Ba La Ce Pr Nd
Sm Eu Gd Tb Dy
Ho Er Tm Yb Lu Ta Hg Tl Pb Bi Th U
Nom
aliz
ed to
stre
am s
ed. Fine sand (0–100 m)
Fine sand (100–200 m)Fine sand (200–500 m)Fine sand (500–1000 m)
Fig. 8 Chemical variations of fine sands in the Pacific Ocean normalized to the adjacent terrestrial sediments.
but scarce in Cu, Zn, As, Cd, Sb, Pb, and Bi. Ohta et al. (2010) have discussed the transport processes of mining ores from the Kuroko deposits in the Yoneshiro River watershed to the coast. They concluded that sulfide ores have been oxidized and are releasing heavy metals during weathering and transportation. Based on those results, fine sands in the region offshore from Noshiro are inferred to have originated from mafic volcanic rocks in the northern Tohoku region and scarcely contain mining ores.
Silts and clays on the continental shelf off of Niigata are modern sediments supplied primarily by the Shinano and Agano Rivers because the sediment discharge yields of these rivers are the highest in the study area (Table 1). The spatial distributions of Be, K2O, Rb, Sn, light REEs, Th, and U are continuous between the watershed of the Ara River and the coast because granitic rocks and accretionary complexes underlie the watershed area. However, these elements are less abundant in the estuarine regions of the Shinano and Agano Rivers because volcanic rocks are the dominant lithology of these river systems. Characteristically, Li, MgO, P2O5, V, Cr, Ni, Ga, Nb, Mo, Cs, Pb and Bi are more abundant in clay samples from far offshore and notably less abundant in silt from near the shore. These distribution patterns can be simply explained by the grain size effect. Several samples from the estuarine region of the Agano River are highly enriched in Cu, Zn, As, Cd, and Hg. This enrichments may be influenced by metalliferous deposits distributed in the watershed of the Agano River. As in the examples noted above, it must be considered that the spatial distributions of elemental concentrations are not always continuous between land and sea. Nevertheless, the influence of material input from land to sea is evident.
6. 4. 2 Relict sediments on the continental shelfCoarse and fine sands are distributed on the continental
shelf off of Mogami and Joetsu and on the edge of the continental shelf off of Niigata. These sandy sediments are poor in many elements, with the exceptions of Fe2O3 and As. Ikehara et al. (1994a, b) and Katayama et al. (1994) reported that sand particles in these regions contain quartz coated in Fe hydroxides, which are interpreted as relict sediments because fresh modern sand is not coated. The Fe hydroxide-coated quartz grains absorb As efficiently over long periods (e.g., Sullivan and Aller, 1996). Enrichment of As in sandy sediments collected from the southern part of Sendai Bay is also explained by this mechanism, because Nishimura and Saito (2016) found quartz coated with Fe hydroxides (stained quartz) in the sandy sediments of this region. Arsenic is supplied to coastal seas mainly in the dissolved phase through rivers and is precipitated in coastal sediments (Ohta et al., 2015). There are more As-enriched sandy sediments in the Sea of Japan because many major rivers flow into this sea (Table 1).
6. 4. 3 Hemipelagic conditions in deep sea basinsHalf of sediments in the Sea of Japan consist of clay,
which is mainly deposited in deep-sea basins such as the Yamato Basin and Toyama Trough. These clays are rich in elements such as MnO, Cr, Ni, Cu, As, Mo, Sb, and Pb. Terashima et al. (1995b) and Imai et al. (1997) have pointed out that enrichments of these elements are caused by early diagenetic processes. These elements were released into pore water at greater depths in sediments under reducing conditions, diffused upward, and finally precipitated with Mn oxide under oxic condition (e.g., Shaw et al., 1990). These deep-sea basins would be oxidative enough to cause Mn oxide precipitation because MnO concentrations are very high in sediments, and an oxygen-rich water mass (the Japan Sea Proper Water) covers the deep parts of the Sea of Japan (Gamo et al., 1986).
−106−
Bulletin of the Geological Survey of Japan, vol. 68 (3), 2017
6. 4. 4 Influence of local marine geology on marine geochemical maps: particularly extreme enrichment of Ba caused by barite deposition
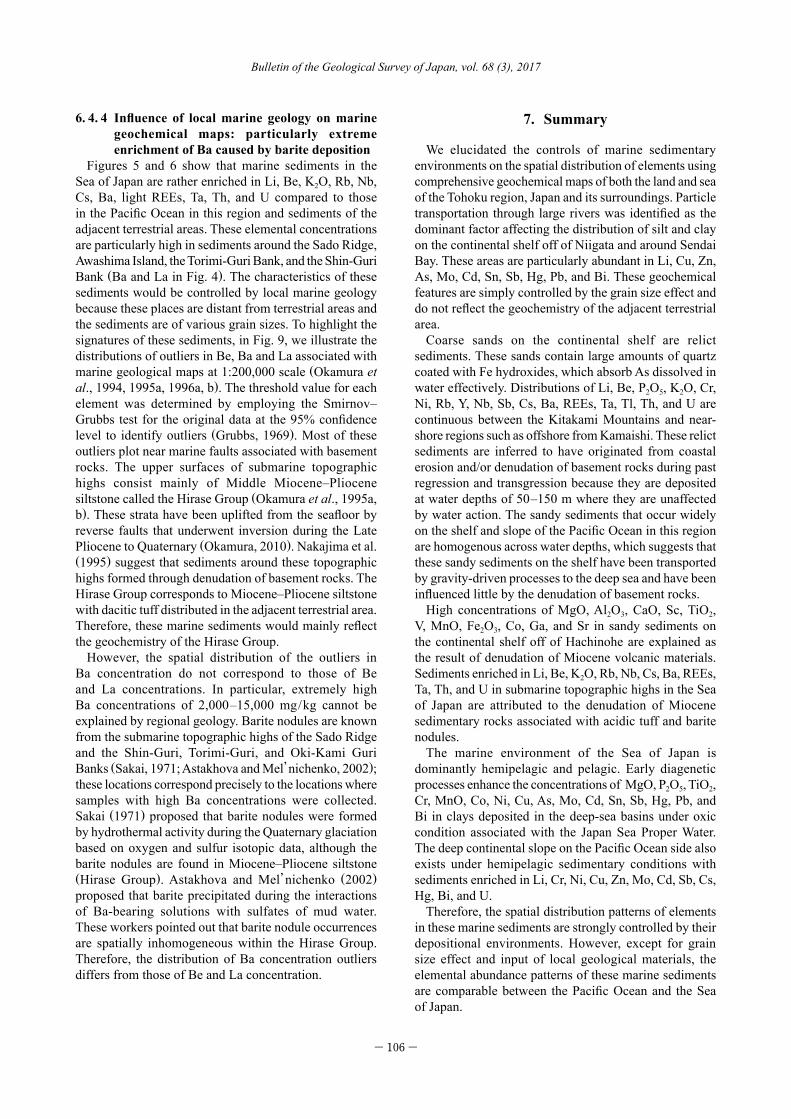
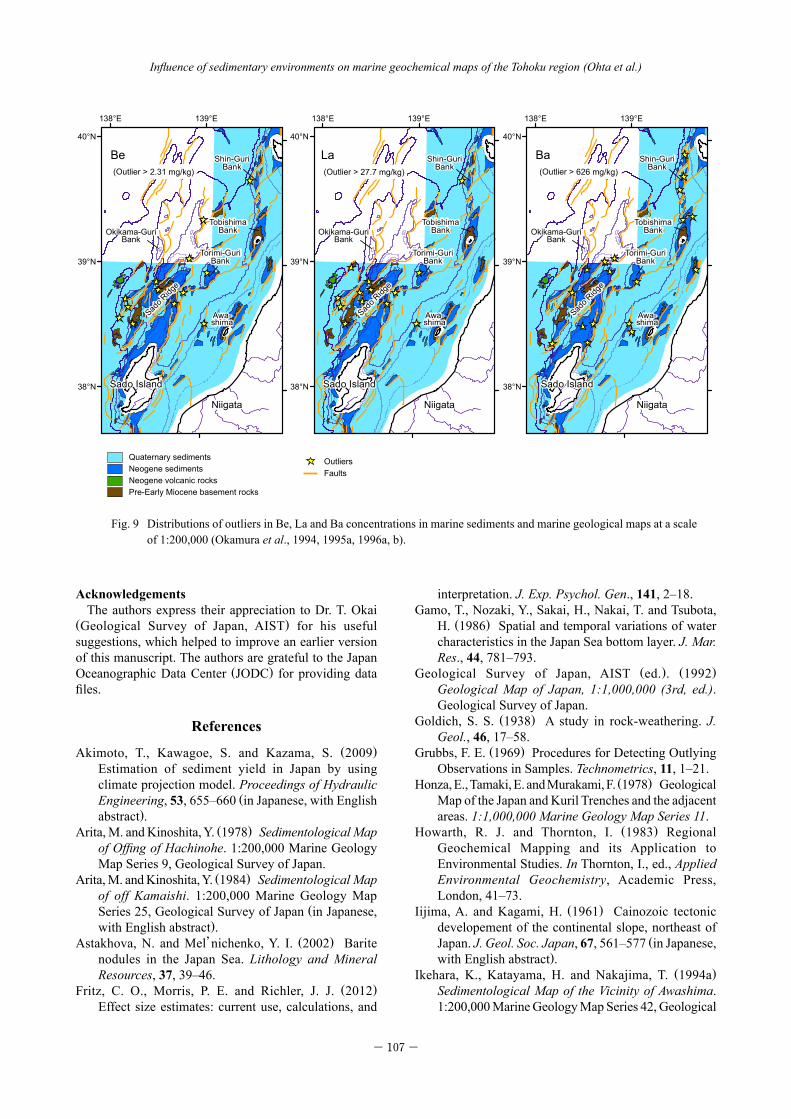
Figures 5 and 6 show that marine sediments in the Sea of Japan are rather enriched in Li, Be, K2O, Rb, Nb, Cs, Ba, light REEs, Ta, Th, and U compared to those in the Pacific Ocean in this region and sediments of the adjacent terrestrial areas. These elemental concentrations are particularly high in sediments around the Sado Ridge, Awashima Island, the Torimi-Guri Bank, and the Shin-Guri Bank (Ba and La in Fig. 4). The characteristics of these sediments would be controlled by local marine geology because these places are distant from terrestrial areas and the sediments are of various grain sizes. To highlight the signatures of these sediments, in Fig. 9, we illustrate the distributions of outliers in Be, Ba and La associated with marine geological maps at 1:200,000 scale (Okamura et al., 1994, 1995a, 1996a, b). The threshold value for each element was determined by employing the Smirnov–Grubbs test for the original data at the 95% confidence level to identify outliers (Grubbs, 1969). Most of these outliers plot near marine faults associated with basement rocks. The upper surfaces of submarine topographic highs consist mainly of Middle Miocene–Pliocene siltstone called the Hirase Group (Okamura et al., 1995a, b). These strata have been uplifted from the seafloor by reverse faults that underwent inversion during the Late Pliocene to Quaternary (Okamura, 2010). Nakajima et al. (1995) suggest that sediments around these topographic highs formed through denudation of basement rocks. The Hirase Group corresponds to Miocene–Pliocene siltstone with dacitic tuff distributed in the adjacent terrestrial area. Therefore, these marine sediments would mainly reflect the geochemistry of the Hirase Group.
However, the spatial distribution of the outliers in Ba concentration do not correspond to those of Be and La concentrations. In particular, extremely high Ba concentrations of 2,000–15,000 mg/kg cannot be explained by regional geology. Barite nodules are known from the submarine topographic highs of the Sado Ridge and the Shin-Guri, Torimi-Guri, and Oki-Kami Guri Banks (Sakai, 1971; Astakhova and Mel’nichenko, 2002); these locations correspond precisely to the locations where samples with high Ba concentrations were collected. Sakai (1971) proposed that barite nodules were formed by hydrothermal activity during the Quaternary glaciation based on oxygen and sulfur isotopic data, although the barite nodules are found in Miocene–Pliocene siltstone (Hirase Group). Astakhova and Mel’nichenko (2002) proposed that barite precipitated during the interactions of Ba-bearing solutions with sulfates of mud water. These workers pointed out that barite nodule occurrences are spatially inhomogeneous within the Hirase Group. Therefore, the distribution of Ba concentration outliers differs from those of Be and La concentration.
7. Summary
We elucidated the controls of marine sedimentary environments on the spatial distribution of elements using comprehensive geochemical maps of both the land and sea of the Tohoku region, Japan and its surroundings. Particle transportation through large rivers was identified as the dominant factor affecting the distribution of silt and clay on the continental shelf off of Niigata and around Sendai Bay. These areas are particularly abundant in Li, Cu, Zn, As, Mo, Cd, Sn, Sb, Hg, Pb, and Bi. These geochemical features are simply controlled by the grain size effect and do not reflect the geochemistry of the adjacent terrestrial area.
Coarse sands on the continental shelf are relict sediments. These sands contain large amounts of quartz coated with Fe hydroxides, which absorb As dissolved in water effectively. Distributions of Li, Be, P2O5, K2O, Cr, Ni, Rb, Y, Nb, Sb, Cs, Ba, REEs, Ta, Tl, Th, and U are continuous between the Kitakami Mountains and near-shore regions such as offshore from Kamaishi. These relict sediments are inferred to have originated from coastal erosion and/or denudation of basement rocks during past regression and transgression because they are deposited at water depths of 50–150 m where they are unaffected by water action. The sandy sediments that occur widely on the shelf and slope of the Pacific Ocean in this region are homogenous across water depths, which suggests that these sandy sediments on the shelf have been transported by gravity-driven processes to the deep sea and have been influenced little by the denudation of basement rocks.
High concentrations of MgO, Al2O3, CaO, Sc, TiO2, V, MnO, Fe2O3, Co, Ga, and Sr in sandy sediments on the continental shelf off of Hachinohe are explained as the result of denudation of Miocene volcanic materials. Sediments enriched in Li, Be, K2O, Rb, Nb, Cs, Ba, REEs, Ta, Th, and U in submarine topographic highs in the Sea of Japan are attributed to the denudation of Miocene sedimentary rocks associated with acidic tuff and barite nodules.
The marine environment of the Sea of Japan is dominantly hemipelagic and pelagic. Early diagenetic processes enhance the concentrations of MgO, P2O5, TiO2, Cr, MnO, Co, Ni, Cu, As, Mo, Cd, Sn, Sb, Hg, Pb, and Bi in clays deposited in the deep-sea basins under oxic condition associated with the Japan Sea Proper Water. The deep continental slope on the Pacific Ocean side also exists under hemipelagic sedimentary conditions with sediments enriched in Li, Cr, Ni, Cu, Zn, Mo, Cd, Sb, Cs, Hg, Bi, and U.
Therefore, the spatial distribution patterns of elements in these marine sediments are strongly controlled by their depositional environments. However, except for grain size effect and input of local geological materials, the elemental abundance patterns of these marine sediments are comparable between the Pacific Ocean and the Sea of Japan.
− 107 −
Influence of sedimentary environments on marine geochemical maps of the Tohoku region (Ohta et al.)
139°E138°E
40°N
39°N
38°N
Be La
139°E138°E
40°N
39°N
38°N
Ba
139°E138°E
40°N
39°N
38°N
Quaternary sedimentsNeogene sedimentsNeogene volcanic rocksPre-Early Miocene basement rocks
OutliersFaults
Figure 9 (Ohta et al.)
(Outlier > 2.31 mg/kg) (Outlier > 626 mg/kg)(Outlier > 27.7 mg/kg)Shin-Guri
Bank
Torimi-GuriBank
TobishimaBank
Awa-shima
Sado R
idge
Sado Island
Okikama-GuriBank
Shin-GuriBank
Torimi-GuriBank
TobishimaBank
Awa-shima
Sado R
idge
Sado Island
Shin-GuriBank
Torimi-GuriBank
TobishimaBank
Awa-shima
Sado R
idge
Sado Island
NiigataNiigata Niigata
Okikama-GuriBank
Okikama-GuriBank
AcknowledgementsThe authors express their appreciation to Dr. T. Okai
(Geological Survey of Japan, AIST) for his useful suggestions, which helped to improve an earlier version of this manuscript. The authors are grateful to the Japan Oceanographic Data Center (JODC) for providing data files.
References
Akimoto, T., Kawagoe, S. and Kazama, S. (2009) Estimation of sediment yield in Japan by using climate projection model. Proceedings of Hydraulic Engineering, 53, 655–660 (in Japanese, with English abstract).
Arita, M. and Kinoshita, Y. (1978) Sedimentological Map of Offing of Hachinohe. 1:200,000 Marine Geology Map Series 9, Geological Survey of Japan.
Arita, M. and Kinoshita, Y. (1984) Sedimentological Map of off Kamaishi. 1:200,000 Marine Geology Map Series 25, Geological Survey of Japan (in Japanese, with English abstract).
Astakhova, N. and Mel’nichenko, Y. I. (2002) Barite nodules in the Japan Sea. Lithology and Mineral Resources, 37, 39–46.
Fritz, C. O., Morris, P. E. and Richler, J. J. (2012) Effect size estimates: current use, calculations, and
Fig. 9 Distributions of outliers in Be, La and Ba concentrations in marine sediments and marine geological maps at a scale of 1:200,000 (Okamura et al., 1994, 1995a, 1996a, b).
interpretation. J. Exp. Psychol. Gen., 141, 2–18.Gamo, T., Nozaki, Y., Sakai, H., Nakai, T. and Tsubota,
H. (1986) Spatial and temporal variations of water characteristics in the Japan Sea bottom layer. J. Mar. Res., 44, 781–793.
Geological Survey of Japan, AIST (ed.). (1992) Geological Map of Japan, 1:1,000,000 (3rd, ed.). Geological Survey of Japan.
Goldich, S. S. (1938) A study in rock-weathering. J. Geol., 46, 17–58.
Grubbs, F. E. (1969) Procedures for Detecting Outlying Observations in Samples. Technometrics, 11, 1–21.
Honza, E., Tamaki, E. and Murakami, F. (1978) Geological Map of the Japan and Kuril Trenches and the adjacent areas. 1:1,000,000 Marine Geology Map Series 11.
Howarth, R. J. and Thornton, I. (1983) Regional Geochemical Mapping and its Application to Environmental Studies. In Thornton, I., ed., Applied Environmental Geochemistry, Academic Press, London, 41–73.
Iijima, A. and Kagami, H. (1961) Cainozoic tectonic developement of the continental slope, northeast of Japan. J. Geol. Soc. Japan, 67, 561–577 (in Japanese, with English abstract).
Ikehara, K., Katayama, H. and Nakajima, T. (1994a) Sedimentological Map of the Vicinity of Awashima. 1:200,000 Marine Geology Map Series 42, Geological
−108−
Bulletin of the Geological Survey of Japan, vol. 68 (3), 2017
Survey of Japan (in Japanese, with English abstract).Ikehara, K., Nakajima, T. and Katayama, H. (1994b)
Sedimentological Map West of Akita. 1:200,000 Marine Geology Map Series 41, Geological Survey of Japan (in Japanese, with English abstract).
Imai, N. (1987) Multielement analysis of stream sediment by ICP-AES. Bunseki Kagaku, 36, T41–T45 (in Japanese, with English abstract).
Imai, N. (1990) Multielement analysis of rocks with the use of geological certified reference material by inductively coupled plasma mass spectrometry. Anal. Sci., 6, 389–395.
Imai, N., Terashima, S., Katayama, H., Nakajima, T., Ikehara, K. and Taniguchi, M. (1997) Geochemical behavior of heavy metals in coastal marine sediments from the eastern margin of the Japan Sea. Bull. Geol. Surv. Japan, 48, 511–530 (in Japanese, with English abstract).
Imai, N., Terashima, S., Ohta, A., Mikoshiba, M., Okai, T., Tachibana, Y., Togashi, S., Matsuhisa, Y., Kanai, Y., Kamioka, H. and Taniguchi, M. (2004) Geochemical map of Japan. Geological Survey of Japan, AIST, 209p (in Japanese, with English abstract).
Imai, N., Terashima, S., Ohta, A., Mikoshiba, M., Okai, T., Tachibana, Y., Togashi, S., Matsuhisa, Y., Kanai, Y. and Kamioka, H. (2010) Geochemical Map of Sea and Land of Japan. Geological Survey of Japan, AIST, Tsukuba, 207p (in Japanese, with English abstract). Database available from https://gbank.gsj.jp/geochemmap/ (accessed 2016-07-12).
Katayama, H., Nakajima, T. and Ikehara, K. (1994) Sedimentological Map South of Sado Island. 1:200,000 Marine Geology Map Series 44, Geological Survey of Japan (in Japanese, with English abstract).
Nakajima, T. (1973) Submarine topography off the southern part of Sanriku district. J. Geogr. (Chigaku Zasshi), 82, 136–147 (in Japanese, with English abstract).
Nakajima, T., Katayama, H. and Ikehara, K. (1995) Sedimentological Map North of Sado Island. 1:200,000 Marine Geology Map Series 45, Geological Survey of Japan (in Japanese, with English abstract).
Nishimura, A. and Saito, Y. (2016) Sedimentological Map off Kinkasan. 1:200,000 Marine Geology Map Series, no. 87 (CD), Geological Survey of Japan, AIST (in Japanese, with English abstract).
Noda, A. and TuZino, T. (2007) Characteristics of sediments and their dispersal systems along the shelf and slope of an active forearc margin, eastern Hokkaido, northern Japan. Sediment. Geol., 201, 341–364.
Ohta, A. and Imai, N. (2011) Comprehensive Survey of Multi-Elements in Coastal Sea and Stream Sediments in the Island Arc Region of Japan: Mass Transfer from Terrestrial to Marine Environments. In El-Amin, M., ed., Advanced Topics in Mass Transfer, InTech, Croatia, 373–398.
Ohta, A., Imai, N., Terashima, S., Tachibana, Y., Ikehara, K., Okai, T., Ujiie-Mikoshiba, M. and Kubota, R. (2007) Elemental distribution of coastal sea and stream sediments in the island-arc region of Japan and mass transfer processes from terrestrial to marine environments. Appl. Geochem., 22, 2872–2891.
Ohta, A., Imai, N., Terashima, S., Tachibana, Y., Ikehara, K., Katayama, H. and Noda, A. (2010) Factors controlling regional spatial distribution of 53 elements in coastal sea sediments in northern Japan: Comparison of geochemical data derived from stream and marine sediments. Appl. Geochem., 25, 357–376.
Ohta, A., Imai, N., Terashima, S. and Tachibana, Y. (2011) Regional geochemical mapping in eastern Japan including the nation’s capital, Tokyo. Geochem.-Explor. Environ. Anal., 11, 211–223.
Ohta, A., Imai, N., Terashima, S., Tachibana, Y. and Ikehara, K. (2013) Regional spatial distribution of multiple elements in the surface sediments of the eastern Tsushima Strait (southwestern Sea of Japan). Appl. Geochem., 37, 43–56.
Ohta, A., Imai, N., Terashima, S., Tachibana, Y., Ikehara, K. and Katayama, H. (2015) Elemental distribution of surface sediments around Oki Trough including adjacent terrestrial area: Strong impact of Japan Sea Proper Water on silty and clayey sediments. Bull. Geol. Surv. Japan, 66, 81–101.
Okamura, Y. (2010) Relationships between geological structure and earthquake source faults along the eastern margin of the Japan Sea. J. Geol. Soc. Japan, 116, 582–591 (in Japanese, with English abstract).
Okamura, Y. (2013) Active Faults in Japan Sea revealed by topography and geology. Reports of seismic crusutal and activities in Japan discussed in the 198th, 199th meetings are recorded., 90, p. 530–536. The coordinating Commitee for Earthquake Prediction, Japan (in Japanese).
Okamura, Y. and Tanahashi, M. (1983) Geological Map off Kamaishi. 1:200,000 Marine Geology Map Series 22, Geological Survey of Japan (in Japanese, with English abstract).
Okamura, Y., Takeuchi, K., Joshima, M. and Satoh, M. (1994) Geological Map South of Sado Island. 1:200,000 Marine Geology Map Series 43, Geological Survey of Japan (in Japanese, with English abstract).
Okamura, Y., Takeuchi, K., Joshima, M. and Satoh, M. (1995a) Geological Map North of Sado Island. 1:200,000 Marine Geology Map Series 46, Geological Survey of Japan (in Japanese, with English abstract).
Okamura, Y., Watanabe, M., Morijiri, R. and Satoh, M. (1995b) Rifting and basin inversion in the eastern margin of the Japan Sea. Isl. Arc., 4, 166–181.
Okamura, Y., Morijiri, R. and Satoh, M. (1996a) Geological Map West of Akita. 1:200,000 Marine Geology Map Series 48, Geological Survey of Japan (in Japanese, with English abstract).
Okamura, Y., Morijiri, R., Tsuchiya, N. and Satoh, M.
− 109 −
Influence of sedimentary environments on marine geochemical maps of the Tohoku region (Ohta et al.)
(1996b) Geological Map of the Vicinity of Awashima. 1:200,000 Marine Geology Map Series 47, Geological Survey of Japan (in Japanese, with English abstract).
Reimann, C. (2005) Geochemical mapping: technique or art? Geochem.: Explor. Environ. Anal., 5, 359–370.
Reimann, C., Siewers, U., Tarvainen, T., Bityukova, L., Eriksson, J., Gilucis, A., Gregorauskiene, V., Lukashev, V., Matinian, N. and Pasieczna, A. (2003) Agricultural Soils in Northern Europe: A Geochemical Atlas. E. Schweizerbart’sche Verlagsbuchhandlung, Stuttgart, Germany, 279p.
Richardson, J. T. (2011) Eta squared and partial eta squared as measures of effect size in educational research. Educational Research Review, 6, 135–147.
Saito, Y. (1989) Classification of shelf sediments and their sedimentary facies in the storm-dominated shelf: A review. J. Geogr. (Chigaku Zasshi), 98, 350–365.
Sakai, H. (1971) Sulfur and oxygen isotopic study of barite concretions from banks in the Japan Sea off the Northeast Honshu, Japan. Geochem. J., 5, 79–93.
Salminen, R., Batista, M. J., Bidovec, M., Demetriades, A., B., D. V., De Vos, W., Duris, M., Gilucis, A., Gregorauskiene, V., Halamic, J., Heitzmann, P., Lima, A., Jordan, G., Klaver, G., Klein, P., Lis, J., Locutura, J., Marsina, K., Mazreku, A., O’Connor, P. J., Olsson, S. Å., Ottesen, R.-T., Petersell, V., Plant, J. A., Reeder, S., Salpeteur, I., Sandström, H., Siewers, U., Steenfelt, A. and Tarvainen, T. (2005) Geochemical atlas of Europe. Part 1 —Background Information, Methodology and Maps. Geological Survey of Finland, Espoo, Finland, 526p.
Shaw, T. J., Gieskes, J. M. and Jahnke, R. A. (1990) Early diagenesis in differing depositional environments: The response of transition metals in pore water. Geochim. Cosmochim. Acta, 54, 1233–1246.
Shimamura, K. (2008) Revised chart of the submarine canyon and valley systems around the Japanese Islands —on their topographic features and their unsettled questions. J. Geol. Soc. Japan, 114, 560–576 (in Japanese, with English abstract).
Sullivan, K. A. and Aller, R. C. (1996) Diagenetic cycling of arsenic in Amazon shelf sediments. Geochim. Cosmochim. Acta, 60, 1465–1477.
Tamaki, K. (1978) Geological Map off Hachinohe. 1:200,000 Marine Geology Map Series 10, Geological Survey of Japan.
Tamaki, K., Honza, E., Yuasa, M., Nishimura, K. and Murakami, F. (1981) Geological Map of the Central Japan Sea. 1:1,000,000 Marine Geology Map Series 15.
Taylor, S. R. and McLennan, S. M. (1995) The geochemical evolution of the continental crust. Rev. Geophys., 33, 241–265.
Terashima, S. and Katayama, H. (1993) Geochemical behavior of twelve elements in marine sediments from of Niigata, Japan. Bull. Geol. Surv. Japan, 44, 55–74 (in Japanese, with English abstract).
Terashima, S., Katayama, H., Nakajima, T. and Ikehara, K. (1995a) Geochemical behavior of mercury in coastal marine sediments off Niigata, southeastern margin of the Japan Sea. Chikyukagaku (Geochemistry), 29, 25–36 (in Japanese, with English abstract).
Terashima, S., Nakajima, T., Katayama, H., Ikehara, K., Imai, N. and Taniguchi, M. (1995b) Geochemical behavior of heavy metals in marine sediments from the off Akita-Yamagata, Japan Sea. Bull. Geol. Surv. Japan, 46, 153–176 (in Japanese, with English abstract).
Ujiie-Mikoshiba, M., Imai, N., Terashima, S., Tachibana, Y. and Okai, T. (2006) Geochemical mapping in northern Honshu, Japan. Appl. Geochem., 21, 492–514.
Weaver, T. A., Broxton, D. E., Bolivar, S. L. and Freeman, S. H. (1983) The Geochemical Atlas of Alaska: Compiled by the Geochemistry Group, Earth Sciences Division, Los Alamos National Laboratory. GJBX-32(83), Los Alamos, 141p.
Webb, J. S., Thornton, I., Thompson, M., Howarth, R. J. and Lowenstein, P. L. (1978) The Wolfson Geochemical Atlas of England and Wales. Clarendon Press, Oxford, 69p.
Yashima, K., Imai, K. and Nishizawa, K. (1982) 1:1,000,000 Bathymetric Charts “Hokkaido”, “North-east Nippon” and Submarine Topography. Report of Hydrographic and Oceanographic Researches, 17, 93–162 (in Japanese, with English abstract).
Recieved July 12, 2016Accepted December 21, 2016
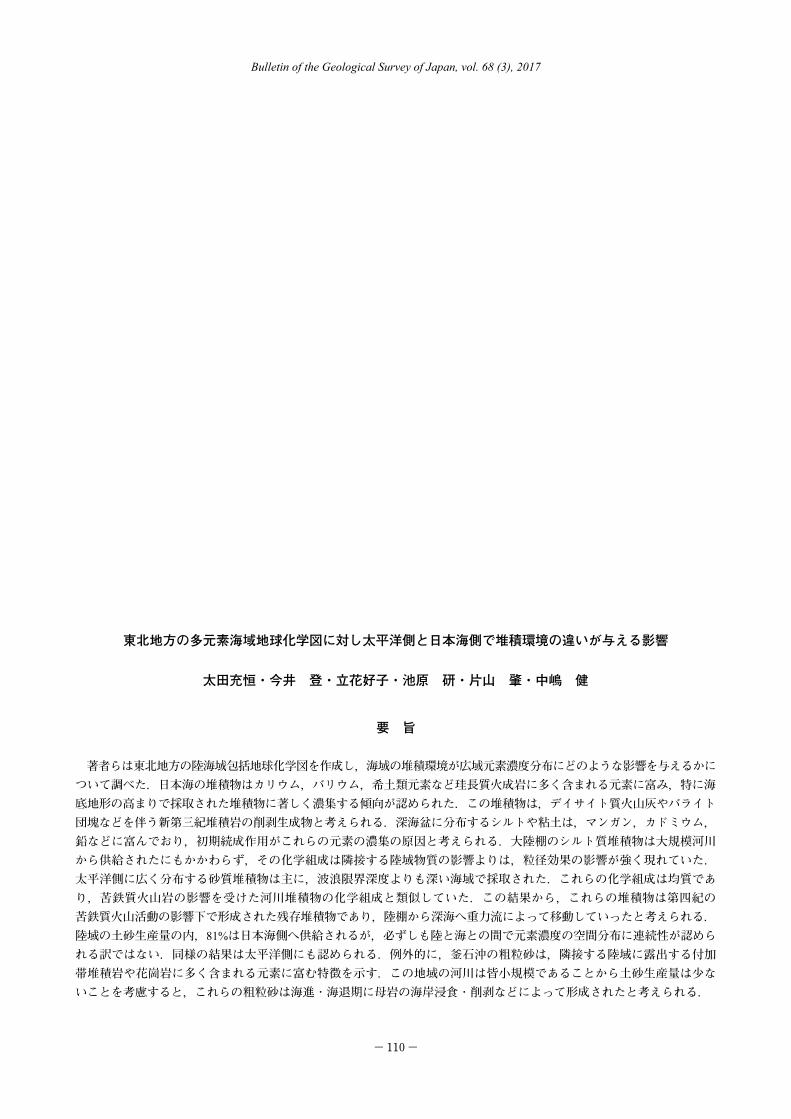
−110−
Bulletin of the Geological Survey of Japan, vol. 68 (3), 2017
東北地方の多元素海域地球化学図に対し太平洋側と日本海側で堆積環境の違いが与える影響
太田充恒・今井 登・立花好子・池原 研・片山 肇・中嶋 健
要 旨
著者らは東北地方の陸海域包括地球化学図を作成し,海域の堆積環境が広域元素濃度分布にどのような影響を与えるかについて調べた.日本海の堆積物はカリウム,バリウム,希土類元素など珪長質火成岩に多く含まれる元素に富み,特に海底地形の高まりで採取された堆積物に著しく濃集する傾向が認められた.この堆積物は,デイサイト質火山灰やバライト 団塊などを伴う新第三紀堆積岩の削剥生成物と考えられる.深海盆に分布するシルトや粘土は,マンガン,カドミウム,鉛などに富んでおり,初期続成作用がこれらの元素の濃集の原因と考えられる.大陸棚のシルト質堆積物は大規模河川 から供給されたにもかかわらず,その化学組成は隣接する陸域物質の影響よりは,粒径効果の影響が強く現れていた. 太平洋側に広く分布する砂質堆積物は主に,波浪限界深度よりも深い海域で採取された.これらの化学組成は均質であり,苦鉄質火山岩の影響を受けた河川堆積物の化学組成と類似していた.この結果から,これらの堆積物は第四紀の 苦鉄質火山活動の影響下で形成された残存堆積物であり,陸棚から深海へ重力流によって移動していったと考えられる.陸域の土砂生産量の内,81%は日本海側へ供給されるが,必ずしも陸と海との間で元素濃度の空間分布に連続性が認められる訳ではない.同様の結果は太平洋側にも認められる.例外的に,釜石沖の粗粒砂は,隣接する陸域に露出する付加帯堆積岩や花崗岩に多く含まれる元素に富む特徴を示す.この地域の河川は皆小規模であることから土砂生産量は少ないことを考慮すると,これらの粗粒砂は海進・海退期に母岩の海岸浸食・削剥などによって形成されたと考えられる.