Embed Size (px)
Citation preview
Influence of displays parameters on digital pathology systems
Cédric Marchessoux

Resolution
� Chest x-ray:
▫ #2000x2000 pixels
� Pathology image:
▫ #100000x100000 pixels
2
Source: University of Leeds – Darren Treanor
Comparison between a radiographicimage and a digital slide

Resolution for Digital Pathology
� We have up to 12 Million Pixels for radiology with last Barco technology display:
� And for Digital Pathology less pixels? whereas in Digital pathology images are 20 times bigger?
3

Interview of a Pathologist in UK in 2015
“Pathologists need even better displays than radiologists and not the contrary, higher resolution because of the resolution of a slide and a good color representation”
4

Comparison study of the impact of the display resolution for digital pathology
� C. Marchessoux, A. Naves-Dufour, K. Espig, S. Monaco, A. Palekar and L. Pantanowitz
� Barco and UPMC Pittsburgh
� Work done not in the context of the Aidpath project
5

Protocol
� 3 Displays:
▫ Same maximum luminance: 400cd/m²
▫ Same brand: Barco
▫ 3 different resolutions: 2MP, 4MP, 12MP
� 3 pathologists from UPMC
� 1 session per display:
▫ 70 images in total
▫ 10 1st images used for training
▫ 60 last images for the statistical analysis
6

Images
� 70 images with wide variety of histological and cytological diagnoses
7

Viewing software and scanner
� Aperio Scanscope v1 scanner
� Barco internal GPU optimized viewer for digital pathology
� Any interaction such as a click, a zoom or a panning action is recorded in an output log file for running automatic analysis
8

Viewer
9
MiniMap
Main Window
Scoring WindowWith description

The task
� Each case has be visualized on each monitor by each observer
� Each observer had to score each case with a scale from 0 to 3+
▫ 0: negative
▫ +: positive with degree of severity
� There was no control of the environment
10

Analysis
� Number of pans
� Number of zooms
� Efficiency with the definition of a new metric
� Simple statistics with boxplots
� 2D and 3D plots
11
average
median
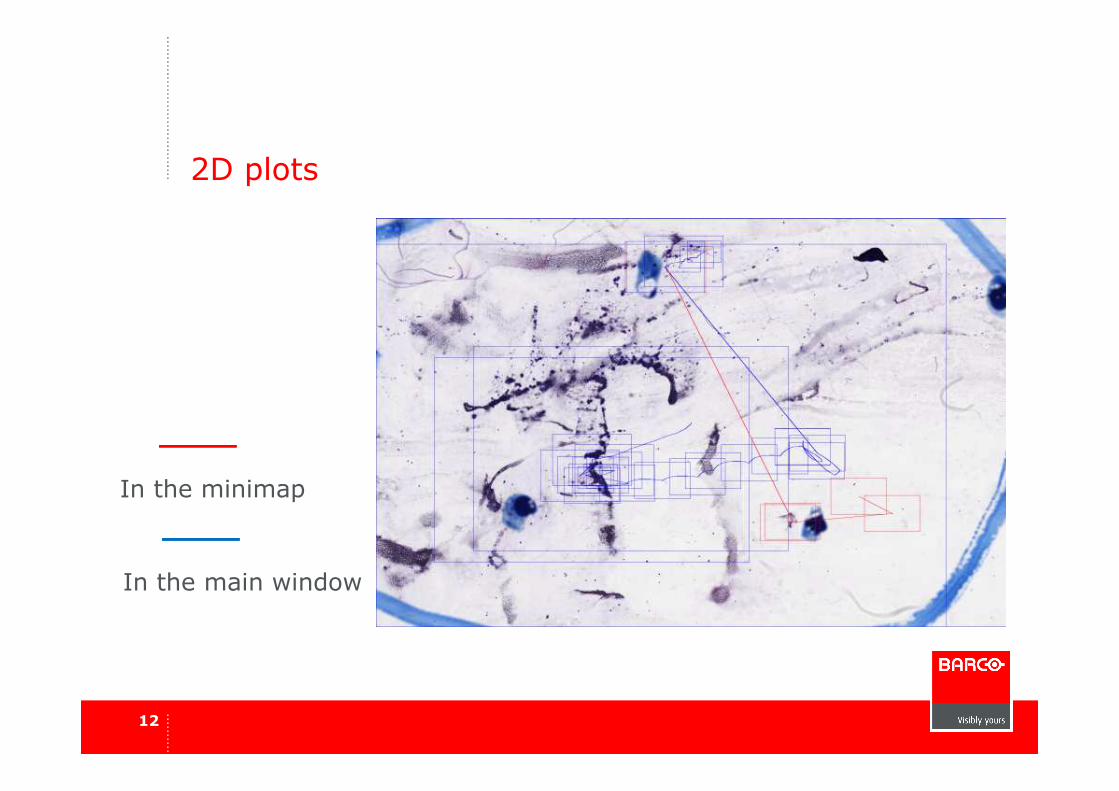
2D plots
12
In the minimap
In the main window

3D plots
13
In the minimap
In the main window

Video generation
� By reproducing exactly the navigation of the pathologists
14
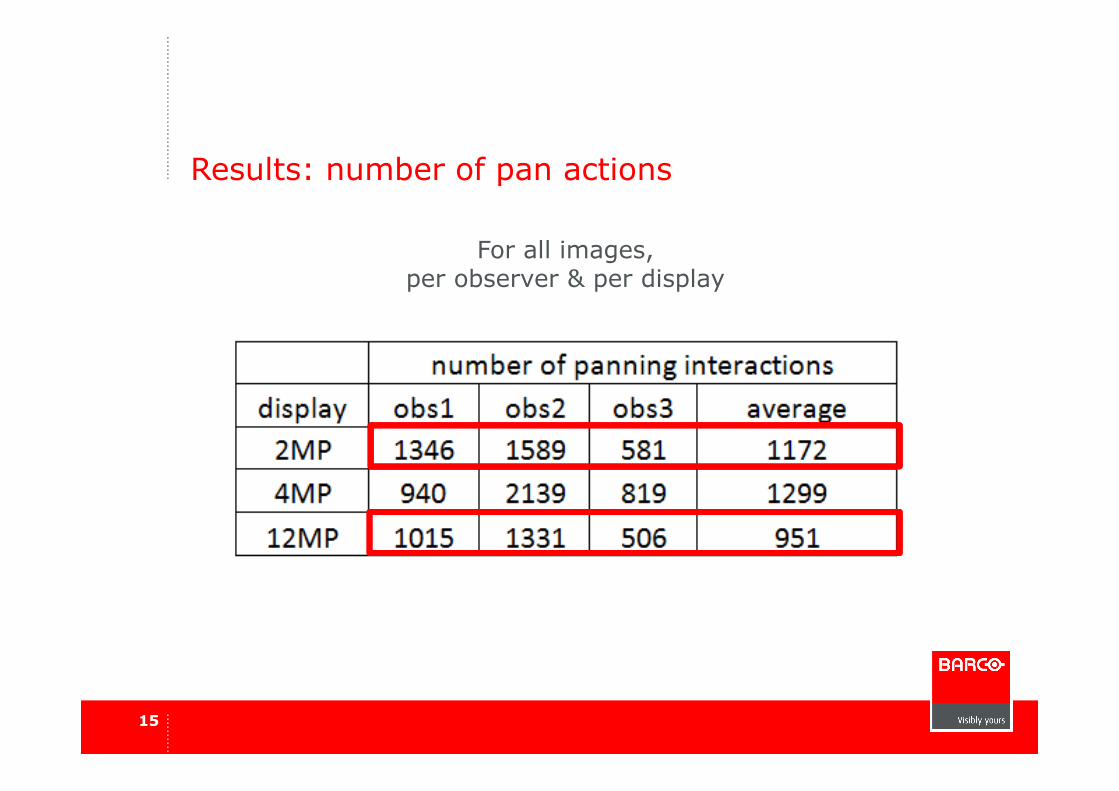
Results: number of pan actions
15
For all images, per observer & per display

Results: number of zoom actions
16
For all images, per observer & per display

Grid: 3x3: 3 observers x 3 monitors
17
The row = observer numberThe column = monitor number from 2MP to 12MP
Mon12MP
Mon24MP
Mon312MP
Obs1
Obs2
Obs3

Results: zoom box plots
18

19

Results: zoom box plots
20
2MP 4MP 12MP
Trend with higher resolution to go to “1” as zoom value, More pixels at natural scale 1:1 with higher resolution displays

Results: 3D navigation graph
21
2MP 4MP 12MP

Results: efficiency
22
How to judgeefficiency?

Results: efficiency
23
How to judgeefficiency?
2MP
obs1
obs2
obs3
4MP 12MP

Results: efficiency
24
ComplexNavigation
But for the 8 otherhow to rank them?

Metric Efficiency: definition
25

Metric Efficiency: results
26

Metric Efficiency: results
27

Conclusion
� Less interaction and more time spent on the image with higher resolution displays for digital pathology
� Resolution (number of pixels) seems to play a major role in digital pathology
� Study should be redone with more observers
� (all analysises and plot generations done in python (oriented object)
� python is free, cross platform and so what: it is Magick!
28

www.twitter.com/Barco
www.facebook.com/Barco
www.youtube.com/BarcoTV