Embed Size (px)
Citation preview
ARTICLE
Influence of elevation and site productivity on coniferdistributions across Alaskan temperate rainforestsJ.P. Caouette, E.A. Steel, P.E. Hennon, P.G. Cunningham, C.A. Pohl, and B.A. Schrader
Abstract: We investigated the influence of landscape factors on the distribution and life stage stability of coastal tree speciesnear the northern limit of their ranges. Using data from 1465 forest inventory plots, we estimated probability of occurrence andbasal area of six common conifer species across three broad latitudinal regions of coastal Alaska. By also comparing modelsacross life stages of each species (seedlings, saplings, mature trees, and dead trees), we explored trends in population stability atthis leading edge of climate change. Elevation had a stronger influence on the probability of tree species occurrence than onbasal area; site productivity impacted both estimated odds of presence and estimated basal area for most species in at least someregions. Interestingly, there were fairly dramatic differences across species in the degree to which the modeled probability ofoccurrence differed across the four life stages. Western redcedar (Thuja plicata Donn ex D. Don), for example, showed relativelystable distributions but other species appear to be in flux, e.g., yellow-cedar (Callitropsis nootkatensis (D. Don) D.P. Little), which hasexperienced widespread mortality at low elevations. Differential effects of elevation on live versus dead basal area suggest thatmountain hemlock (Tsuga mertensiana (Bong.) Carrière) and yellow-cedar are shifting upslope in some regions and that Sitkaspruce (Picea sitchensis (Bong.) Carrière) is shifting downslope in the Northwest region.
Key words: landscape, elevation, species distribution models, climate, biogeography.
Résumé : Nous avons étudié l'influence des caractéristiques du paysage sur la distribution et la stabilité des étapes de vie desespèces côtières arborescentes a proximité de la limite septentrionale de leur aire de répartition. À l'aide de données provenantde 1465 placettes d'inventaire forestier, nous avons estimé la probabilité d'occurrence et la surface terrière de six espècescommunes de conifère a travers trois vastes régions latitudinales de la zone côtière de l'Alaska. En comparant aussi des modèlesdes étapes de vie de chaque espèce (semis, gaule, arbre mature et arbre mort), nous avons exploré les tendances de la stabilitédes populations la où le changement climatique est le plus prononcé. L'altitude avait une plus forte influence que la surfaceterrière sur la probabilité d'occurrence d'une espèce; la productivité de la station avait un impact a la fois sur les chances estiméesde présence et sur la surface terrière estimée de la plupart des espèces au moins dans certaines régions. Il est intéressant de noterqu'il y avait des différences assez marquées parmi les espèces dans l'ampleur avec laquelle la probabilité modélisée d'occurrencedifférait pour l'ensemble des quatre étapes de vie. À titre d'exemple, la distribution du thuya géant (Thuja plicata Donn ex D. Don)était relativement stable mais d'autres espèces semblaient être en pleine évolution : le cyprès de Nootka (Callitropsis nootkatensis(D. Don) D.P. Little) par exemple qui a connu une mortalité généralisée a faible altitude. Les différents effets de l'altitude sur lasurface terrière vivante versus morte indiquent que la pruche subalpine (Tsuga mertensiana (Bong.) Carrière) et le cyprès de Nootkamigrent vers le haut des pentes dans certaines régions et que l'épicéa de Sitka (Picea sitchensis (Bong.) Carrière) migre vers le basdes pentes dans la région du nord–ouest. [Traduit par la Rédaction]
Mots-clés : paysage, altitude, modèles de distribution des espèces, climat, biogéographie.
IntroductionConifer forests in coastal Alaska at the current northern extent
of temperate rainforests in North America are experiencing avariety of landscape-scale pressures related to global climatechange, expanding human development, and increasing recre-ation demands (Haufler et al. 2010). Understanding resiliency ofthese forests in the face of these pressures is critical; yet, ourknowledge of landscape dynamics within these forests is limited.
Emerging issues in this region include maintaining ecosystemintegrity, protecting cultural resources and values, and providingfunctioning wildlife habitats, as well as identifying potential com-modity uses of forestlands (Oakes et al. 2015). An understanding ofmacroscale physical and climatic predictors of species distribu-tion and productivity is essential for managing these unique andimportant forests. Comparisons of realized species niches acrosslife stages provide a first indication of whether and in what waysspecies distributions may already be shifting. Such macroscale
Received 15 July 2015. Accepted 25 October 2015.
J.P. Caouette.* The Nature Conservancy, 416 Harris Street #301, Juneau, AK, USA.E.A. Steel. Pacific Northwest Research Station, USDA Forest Service, 400 N 34th Street, Seattle, WA 98103, USA.P.E. Hennon. Pacific Northwest Research Station, USDA Forest Service, 11175 Auke Lake Way, Juneau, AK 99801, USA.P.G. Cunningham. Pacific Northwest Research Station, USDA Forest Service, 3200 SW Jefferson Way, Corvallis, OR 97331, USA.C.A. Pohl. Catherine Pohl Biological Consulting, P.O. Box 21168, Juneau, AK 99802, USA.B.A. Schrader. Alaska Region, USDA Forest Service, 709 W 9th Street, Juneau, AK 99801, USA.Corresponding author: Paul Hennon (email: [email protected]).*In memorium. This study was initiated by the late John Caouette (1964–2010) of The Nature Conservancy. John's tireless efforts to synthesize and gathersupport for the idea, to find, organize, and clean the data, and to provide early reports has been an inspiration to the co-workers and collaborators he leftbehind. John's enthusiasm and drive for this project provided the co-authors of this report with the motivation to carry his work forward in the wake ofhis untimely death in October 2010.
249
Can. J. For. Res. 46: 249–261 (2016) dx.doi.org/10.1139/cjfr-2015-0283 Published at www.nrcresearchpress.com/cjfr on 30 November 2015.
Can
. J. F
or. R
es. D
ownl
oade
d fr
om w
ww
.nrc
rese
arch
pres
s.co
m b
y U
SDA
NA
LB
F on
02/
17/1
6Fo
r pe
rson
al u
se o
nly.
models can also provide a first step toward a more comprehensivemodeling framework that might eventually untangle mechanisticrelationships at finer scales (Pearson and Dawson 2003).
Of the various resource management objectives that requiredetailed spatial information on tree species, perhaps none is ascompelling as understanding climate effects and how species areor are not adapting to change. There is growing appreciation ofhow climate has shaped forests historically and concern for howexisting forests will be impacted by a rapidly changing climate.Because climate change is likely to affect each tree species in aunique manner, it is essential to understand the distribution andhabitat requirements of individual tree species in addition tocomposite plant communities (Iverson et al. 2008; Woodall et al.2009). Methods for predicting future responses in forests such asbioclimatic envelopes or climate profiles (e.g., Hamann and Wang2006; Rehfeldt et al. 2006) are founded on current factors influ-encing the spatial distributions of forest tree species.
Species distribution models (SDMs) are frequently used to pre-dict occurrence and abundance of organisms in landscapes whereground plot data are incomplete or where remote sensing cannotadequately identify species. SDMs are used in forest managementto estimate species ranges and distributional limits, prioritize res-toration and management activities, quantify available resourcesin a particular area, or identify regions of active management,e.g., where species diversity might be particularly high or where anative species might be particularly vulnerable to competitionfrom an invasive species (Peterson 2003). Models range in com-plexity from bioclimatic envelopes that are typically constructedon the relationships between coarse species distributions and cli-mate variables to fine-scale species distribution models, whichmay include disturbances, soils, and other available information(Booth et al. 1988). Biotic factors such as interspecies competition,
herbivory, and pathogens are rarely explicitly included because ofthe intricacy of interactions (Elith and Leathwick 2009); however,these biotic factors are often implicitly included via effects on plotdata (Schroeder et al. 2010).
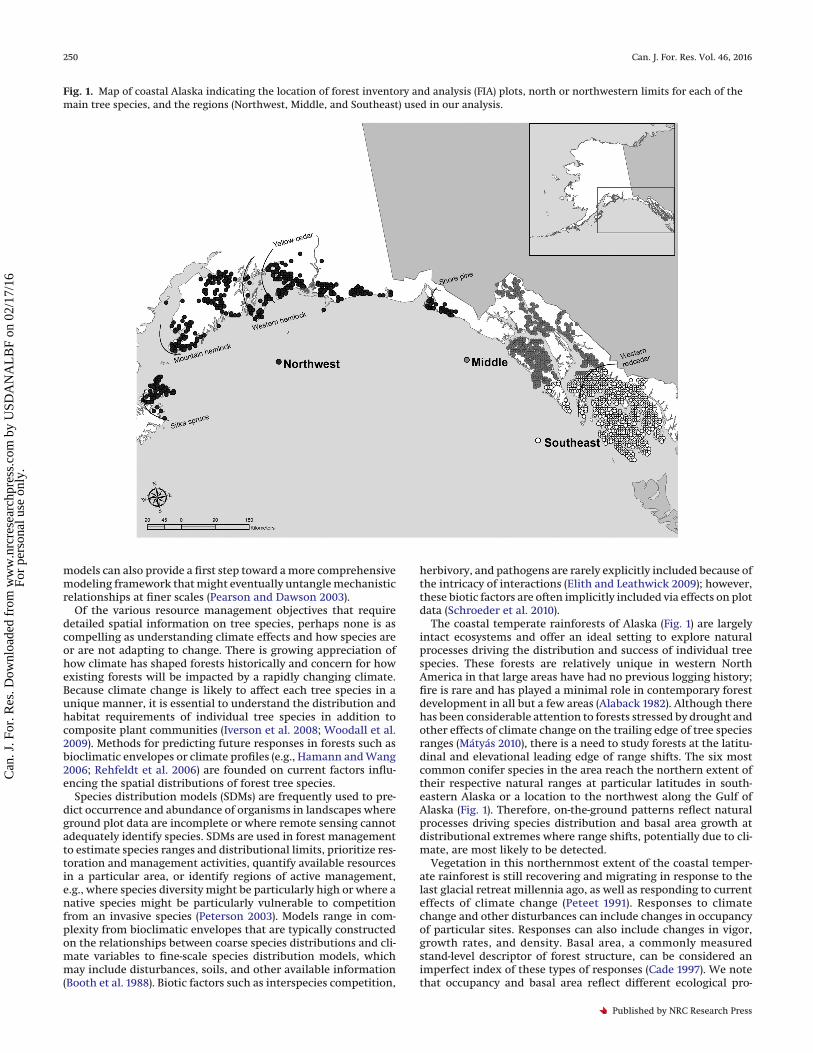
The coastal temperate rainforests of Alaska (Fig. 1) are largelyintact ecosystems and offer an ideal setting to explore naturalprocesses driving the distribution and success of individual treespecies. These forests are relatively unique in western NorthAmerica in that large areas have had no previous logging history;fire is rare and has played a minimal role in contemporary forestdevelopment in all but a few areas (Alaback 1982). Although therehas been considerable attention to forests stressed by drought andother effects of climate change on the trailing edge of tree speciesranges (Mátyás 2010), there is a need to study forests at the latitu-dinal and elevational leading edge of range shifts. The six mostcommon conifer species in the area reach the northern extent oftheir respective natural ranges at particular latitudes in south-eastern Alaska or a location to the northwest along the Gulf ofAlaska (Fig. 1). Therefore, on-the-ground patterns reflect naturalprocesses driving species distribution and basal area growth atdistributional extremes where range shifts, potentially due to cli-mate, are most likely to be detected.
Vegetation in this northernmost extent of the coastal temper-ate rainforest is still recovering and migrating in response to thelast glacial retreat millennia ago, as well as responding to currenteffects of climate change (Peteet 1991). Responses to climatechange and other disturbances can include changes in occupancyof particular sites. Responses can also include changes in vigor,growth rates, and density. Basal area, a commonly measuredstand-level descriptor of forest structure, can be considered animperfect index of these types of responses (Cade 1997). We notethat occupancy and basal area reflect different ecological pro-
Fig. 1. Map of coastal Alaska indicating the location of forest inventory and analysis (FIA) plots, north or northwestern limits for each of themain tree species, and the regions (Northwest, Middle, and Southeast) used in our analysis.
250 Can. J. For. Res. Vol. 46, 2016
Published by NRC Research Press
Can
. J. F
or. R
es. D
ownl
oade
d fr
om w
ww
.nrc
rese
arch
pres
s.co
m b
y U
SDA
NA
LB
F on
02/
17/1
6Fo
r pe
rson
al u
se o
nly.
cesses and likely respond to different suites of environmentalvariables (Nielson et al. 2005). Conservation and management offorested ecosystems responding to a changing climate rely onaccurate descriptions of current tree species distributions acrosslarge spatial extents, fine-scale estimates, and estimates of howthose geographic patterns may be changing over time. As a primeexample, yellow-cedar (Callitropsis nootkatensis (D. Don) D.P. Little)has experienced intense mortality in the region related tochanges in snow cover with climate change (Hennon et al. 2012).Broadscale models involving life stages of each of the tree speciescan help inform how their distributions may be changing.
With changing climates, temperature can be a driving factor indetermining treeline (Grace et al. 2002) and is a contributing fac-tor at the trailing edge of species ranges (Mátyás 2010). Across thecoastal Alaskan temperate rain forest, tree species compositionalso appears to be controlled at a finer scale by site productivity,which is primarily related to soil drainage in this region (Neiland1971; Alaback 1982; Hennon et al. 1990). For example, shore pine(Pinus contorta var. contorta Douglas ex Loudon) is known to be com-mon in less productive wet, boggy soils, the cedars and mountainhemlock (Tsuga mertensiana (Bong.) Carrière) are most competitiveat intermediate drainage, and western hemlock (Tsuga heterophylla(Raf.) Sarg.) and Sitka spruce (Picea sitchensis (Bong.) Carrière) dom-inate the most productive, well drained sites. These tendencies aswell as the mixed composition of most forests are recognized inlocal plant association guides (e.g., DeMeo et al. 1992; Develiceet al. 1999) but have not been interpreted across broad spatialextents in the context of latitude, elevation, and climate change.
Acquiring empirical data on shifts in tree species distributionsat the leading edge of climate change is difficult. Accurate fine-scale data for many drivers of vegetation dynamics (e.g., seasonaltemperature extremes, water availability, and soils) are generallyunavailable across the range of coastal Alaskan landscapes. Fortu-nately, the USDA Forest Service's Forest Inventory and Analysis(FIA) program collects data from a large systematic sample offorested plots across the region (Barrett and Christensen 2011).These data include species presence and absence, basal area byspecies, number of seedlings and saplings (as judged from sizeclass data) by species, and a simple site productivity classification(productive versus unproductive soils). Elevation data are alsowidely available. Elevation and site productivity are static and donot change over time, at least not on time scales of managementrelevance. Changes in the relationships between trees and thesestatic, landscape features are therefore potential descriptors ofchanges in realized species distributions.
In this study, we take a simple, transparent, and easily compa-rable approach to quantifying landscape-scale factors that influ-ence tree species distributions across the temperate rainforests ofcoastal Alaska. We address the following questions:
(i) How is elevation, a stationary surrogate for climatic con-ditions, related to the distribution and basal area of sixcommon coastal Alaskan tree species and does that rela-tionship differ across three major geographic regions?
(ii) Does site productivity have an additional impact on eitheroccupancy or basal area for the six tree species or acrossthe three geographic regions?
(iii) By comparing models for live trees, dead trees, and regen-eration, can we see a shift in the relationship of stationaryfactors to species distributions over time? Are there indi-cations that some species' relationship to elevation may bechanging?
We focused on only two stationary predictors of tree species oc-cupancy and basal area over a vast geographic area, namely eleva-tion and site productivity. By modeling presence versus absenceindependently of basal area, we distinguished between factorsassociated with these two distinct life history stages: seedlingestablishment and tree growth. Independent models for each of
six species and across each of three geographic regions allowedexplicit comparisons of the effects of our two stationary predic-tors on multiple species and areas within the leading edge ofclimate change. Independent models for different life stages ofeach tree species provided a quantitative estimate of how relation-ships between observed tree distributions and stationary land-scape conditions may be shifting.
Methods
RegionWe segregated the coastal rainforest in Alaska into three re-
gions (Fig. 1). Forests along the Gulf of Alaska west to Kodiak Islandwere considered to be in the Northwest region. This region is thecoldest and has historically had the most snowfall. Weather sta-tions here (station numbers: 509685 and 509941) report meanannual maximum temperatures in 1949–2012 of 6.0 and 7.8 °C andmean annual snowfalls of 4702 and 5664 mm. Forests on theupper panhandle were classified as being in the Middle region.Weather stations in this region (station numbers: 503490, 503695,and 504092) report mean annual maximum temperatures of 8.8,9.1, and 9.3 °C and mean annual snowfalls of 3081, 2210, and1892 mm in 1949–2012. Forests on the lower panhandle were clas-sified as being in the Southeast region. Weather stations in theSoutheast region (station numbers: 509919, 504590, and 502227)reported mean annual maximum temperatures as high as 9.7–10.6 °C and mean annual snowfalls of only 572–1473 mm in 1949–2012. The northern or northwest limits of tree species are knownto extend differentially into these regions.
Moderated by the Pacific Ocean that delivers year-round precip-itation (Harris et al. 1974; Alaback 1982), a hypermaritime climatehas influenced forest structure and composition of coastal Alaska.Terrain is mountainous and has had an active glacial history.These are conifer-dominated ecosystems of low tree species diver-sity. We studied the six most abundant tree species, with westernhemlock as the most common species and lesser amounts of Sitkaspruce, yellow-cedar, western redcedar (Thuja plicata Donn exD. Don), mountain hemlock, and shore pine. Other conifer treespecies occur but are either less common or distributed aroundthe fringes of coastal Alaska.
Vegetation dataWe used 1465 vegetation plots in unmanaged stands: 376 in the
Northwest region, 388 in the Middle region, and 701 in the South-east region. These did not include plots identified as being intimber harvest areas, which were omitted to avoid direct effects offorest management on species composition and existing basalarea. Plots used were distributed fairly well across all three broadgeographic regions (Fig. 1). Any large geographic gaps withoutplots were generally in a national park or in USDA Forest Servicewilderness areas.
Live and dead standing trees >12.7 cm (5 inches) in diameterwere recorded from 0.017 ha (1/24 acre) circular plots from 1995 to2003 (Barrett and Christensen 2011). Saplings (diameter, 2.5–12.7 cm) and seedlings (diameter, <2.5 cm but >15 cm tall) wererecorded from 0.0013 ha (1/300 acre) nested microplots. Note thatthese are size class distinctions and do not necessarily reflect lifestages. Designation of site productivity was made by evaluationsof tree heights and site index. Plots judged to have the ability toproduce 1.4 m3·ha−1 of wood or more annually were labeled “pro-ductive”, and those that did not meet this threshold were labelled“unproductive” (USDA Forest Service 1972). Individual plots thatwere designated with “mixed productivity” were omitted fromanalyses where productivity class was a bivariate independentvariable. Shore pine and another subspecies (lodgepole pine, Pinuscontorta var latifolia Engelm. ex S. Watson) are not distinguished inFIA data; however, shore pine is by far the more common andwidespread.
Caouette et al. 251
Published by NRC Research Press
Can
. J. F
or. R
es. D
ownl
oade
d fr
om w
ww
.nrc
rese
arch
pres
s.co
m b
y U
SDA
NA
LB
F on
02/
17/1
6Fo
r pe
rson
al u
se o
nly.
Statistical analysisWe built independent models of tree distribution and basal
area as a function of landscape-scale stationary predictors (eleva-tion and site productivity) for each of the six primary tree specieslisted above and across each of the three regions of coastal Alaskadescribed above. This data-partitioning approach enabled simpleinterpretation of results and comparisons across regions and spe-cies despite extreme natural imbalances in design; some speciesare not present in some regions. Because of the large number ofzeros in the data and because the factors influencing early seed-ling establishment (probability of presence) may be different fromthose influencing later tree responses to climate (basal area wherepresent), we modeled distribution and basal area of each treespecies separately using a two-step modeling process akin to ahurdle model. Hurdle models have been successfully used on awide range of problems (e.g., Steel et al. 2012). In the first step, we
built a logistic regression model to explain presence–absence pat-terns or distribution of tree species. In the second step, we mod-eled the basal area of each species.
To examine relationships between elevation and species distri-bution, we constructed logistic models in which tree presence wasa function of elevation. Coefficients from logistic models weretransformed for display to show the change in the odds of pres-ence for a 100 m gain in elevation. Models to predict basal areaused a log-transformed response and a normal distribution. Forthese models, the raw regression coefficient is displayed, whichdoes not have a simple ecological definition but can be inter-preted as a general positive or negative change with increasingelevation. To explore the effects of site productivity, we elimi-nated sites with mixed productivity classification and refit themodels. We then added an indicator variable of site productivity(unproductive versus productive) to the above models and also an
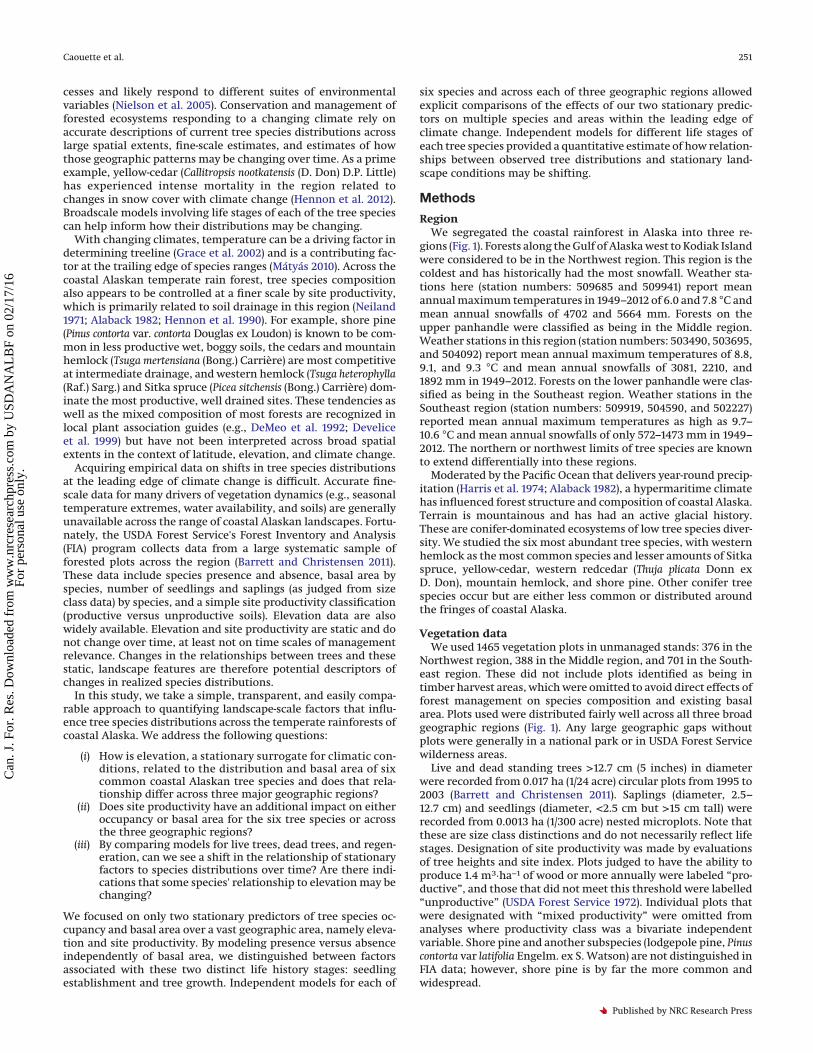
Fig. 2. Distribution of elevation (m) for plots in which each of six tree species was present versus absent by region. The solid line indicatesthe median value, boxes identify the center quartiles of the data, and whiskers designate 1.5 times the interquartile range. Presence data werenot plotted for a particular region and species if there were less than five plots in which the species was present in that region.
252 Can. J. For. Res. Vol. 46, 2016
Published by NRC Research Press
Can
. J. F
or. R
es. D
ownl
oade
d fr
om w
ww
.nrc
rese
arch
pres
s.co
m b
y U
SDA
NA
LB
F on
02/
17/1
6Fo
r pe
rson
al u
se o
nly.

interaction term (elevation × productivity). We note that the indi-cator variable denotes a change in site classification from unpro-ductive to productive. Again, coefficients for the logistic modelare transformed to display the change in odds when consideringan unproductive site versus a productive site. Raw coefficients aredisplayed for the log linear model. To explore the third questionof indications that the relationship to elevation may be changingover time for some species, we used additional information onpresence and absence of seedlings, saplings, and dead trees ineach plot, as well as basal area of dead trees in each plot. Wecreated independent models of presence–absence for live trees,dead trees, seedlings, and saplings, as well as independent modelsof log(basal area) for dead trees and live trees. Life stage modelswere built using the original data set with all site productivityclasses included.
Because of the large sample size and the exploratory nature ofthese analyses, we did not test for significance in a formal man-ner. We instead compared parameter estimates and their associ-ated confidence intervals. Where confidence intervals overlappedwith zero, we note that the relationship was indistinguishablefrom zero, and where confidence intervals did not overlap withzero, we conclude that a relationship likely exists. Where confi-dence intervals failed to overlap with each other or with zero, weconclude that observed relationships are different from one an-other.
ResultsThe presence of tree species in FIA plots in the three regions
corresponded well to previously published natural informationon ranges of four of the species (Fig. 1). For example, inventoryplots detected western redcedar as being restricted to the South-east region (it occurred on four plots just north of this border),which marks its northern extent (Andersen 1953). Small popula-tions of shore pine and yellow-cedar are known to extend far intothe Northwest region (Peteet (1991) and Hennon and Trummer(2001), respectively); however, these species were not detected inFIA plots included in our analyses in this region.
Relationship of elevation with distribution and basal areaof six common Alaska tree species
Looking across all FIA plots in a region, the patterns of occu-pancy as a function of elevation differed across species and acrossregions (Fig. 2). The percentage of plots in which a particularspecies was present varied dramatically with elevation for mostspecies (Fig. 3).
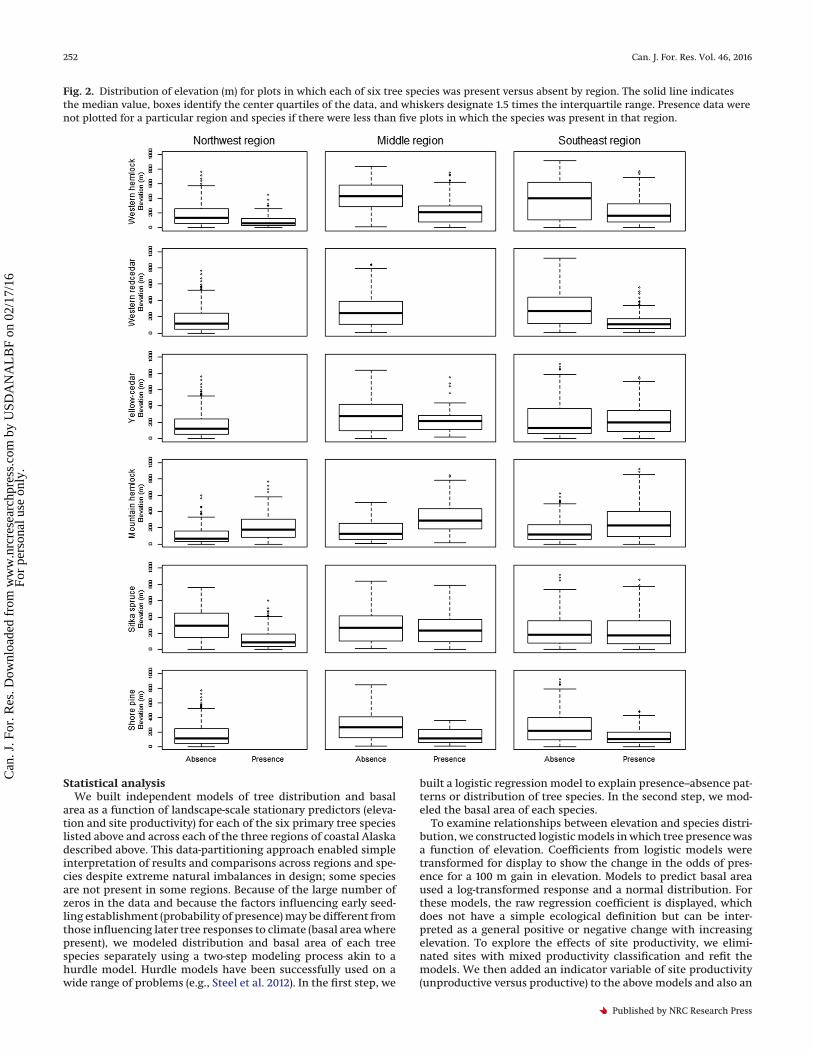
Western hemlock, western redcedar, and shore pine were morelikely to be present in plots at lower elevations and absent in plotsat higher elevations in those regions where the species occurred(Fig. 2). Mountain hemlock followed the opposite tendency. It wasgenerally found at higher elevations across all regions (Figs. 2 and3). Presence of Sitka spruce was unrelated to elevation in theMiddle and Southeast regions in our sample, suggesting that itwas similarly present across the elevation range. It was, however,more common at low elevations in the Northwest region (Fig. 2).Basal area of each species (where present) did not vary by eleva-tion (Fig. 4). The only exception was mountain hemlock in theMiddle region, where there was an indication of greater basal areaat higher elevations.
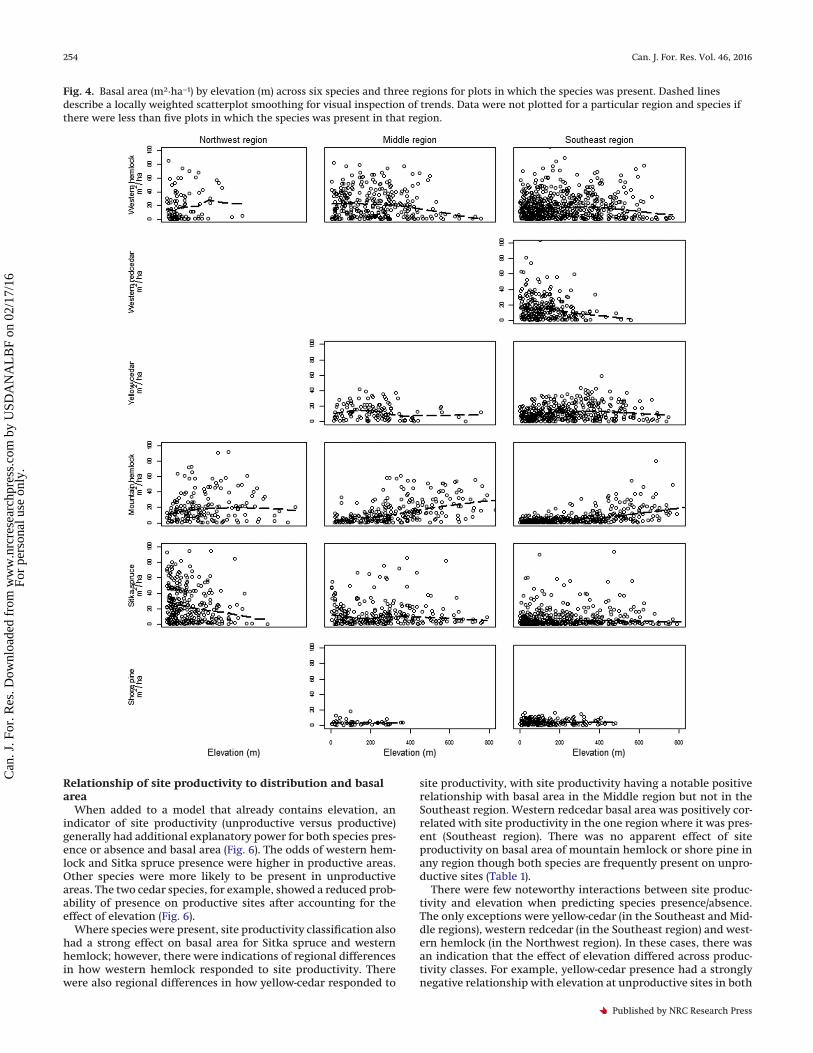
Model coefficients describe how either probability of speciespresence or basal area differs as a function of elevation. Theysupported and quantified what we observed in Figs. 2–4. Mostelevation coefficients were significantly different from zero whenpredicting presence–absence (Fig. 5). For most species, the coeffi-cient for the presence–absence model was negative, indicatingreduced odds of being present as elevation increases. The excep-tion was mountain hemlock, which had a large positive coeffi-cient for elevation in all regions; the odds of this species beingpresent in an FIA plot increased with elevation. In the Middle
region, for example, we estimate that the odds of mountain hem-lock presence nearly double for every increase in 100 m of eleva-tion over the observed range. Sitka spruce was the one species toshow a dramatic interaction with region. The transformed eleva-tion coefficient was effectively one, indicating no effect of eleva-tion on the odds of presence in a particular FIA plot for both theMiddle and Southeast regions, but it was strongly negative in theNorthwest region.
There were fewer strong relationships between elevation andbasal area (where a species was present) (Fig. 5). Western hemlockand mountain hemlock again had opposite relationships withelevation; basal area of western hemlock was reduced as elevationincreased and basal area of mountain hemlock increased withincreasing elevation, though model coefficients for the Northwestregion were indistinguishable from zero (Fig. 5). There was againan interaction between elevation and region for Sitka spruce witha negative effect of elevation on basal area only in the Northwestregion. There was an indication that basal area of western redce-dar tends to be lower at higher elevations.
Fig. 3. Percentage of sites with species present across 150 melevation classes for each of the six common conifer species andeach of the three regions. TSHE, western hemlock; THPL, westernredcedar; CANO, yellow-cedar; TSME, mountain hemlock; PISI, Sitkaspruce; PICO, shore pine.
Caouette et al. 253
Published by NRC Research Press
Can
. J. F
or. R
es. D
ownl
oade
d fr
om w
ww
.nrc
rese
arch
pres
s.co
m b
y U
SDA
NA
LB
F on
02/
17/1
6Fo
r pe
rson
al u
se o
nly.
Relationship of site productivity to distribution and basalarea
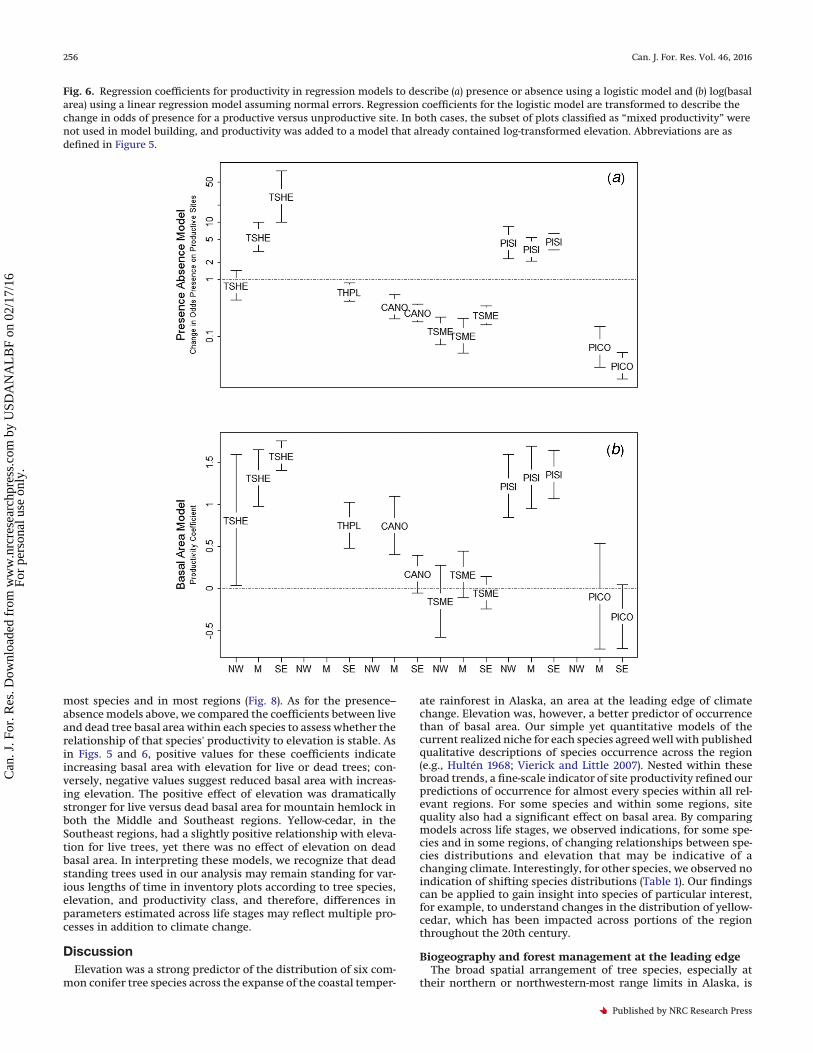
When added to a model that already contains elevation, anindicator of site productivity (unproductive versus productive)generally had additional explanatory power for both species pres-ence or absence and basal area (Fig. 6). The odds of western hem-lock and Sitka spruce presence were higher in productive areas.Other species were more likely to be present in unproductiveareas. The two cedar species, for example, showed a reduced prob-ability of presence on productive sites after accounting for theeffect of elevation (Fig. 6).
Where species were present, site productivity classification alsohad a strong effect on basal area for Sitka spruce and westernhemlock; however, there were indications of regional differencesin how western hemlock responded to site productivity. Therewere also regional differences in how yellow-cedar responded to
site productivity, with site productivity having a notable positiverelationship with basal area in the Middle region but not in theSoutheast region. Western redcedar basal area was positively cor-related with site productivity in the one region where it was pres-ent (Southeast region). There was no apparent effect of siteproductivity on basal area of mountain hemlock or shore pine inany region though both species are frequently present on unpro-ductive sites (Table 1).
There were few noteworthy interactions between site produc-tivity and elevation when predicting species presence/absence.The only exceptions were yellow-cedar (in the Southeast and Mid-dle regions), western redcedar (in the Southeast region) and west-ern hemlock (in the Northwest region). In these cases, there wasan indication that the effect of elevation differed across produc-tivity classes. For example, yellow-cedar presence had a stronglynegative relationship with elevation at unproductive sites in both
Fig. 4. Basal area (m2·ha−1) by elevation (m) across six species and three regions for plots in which the species was present. Dashed linesdescribe a locally weighted scatterplot smoothing for visual inspection of trends. Data were not plotted for a particular region and species ifthere were less than five plots in which the species was present in that region.
254 Can. J. For. Res. Vol. 46, 2016
Published by NRC Research Press
Can
. J. F
or. R
es. D
ownl
oade
d fr
om w
ww
.nrc
rese
arch
pres
s.co
m b
y U
SDA
NA
LB
F on
02/
17/1
6Fo
r pe
rson
al u
se o
nly.
the Southeast and Middle regions; at productive sites, there wasa marginally negative relationship with elevation in the Middleregion and a fairly positive relationship with elevation in theSoutheast region. Western redcedar presence probability in theSoutheast region and western hemlock presence probability inthe Northwest region were also more negatively associated withelevation at unproductive than at productive sites. There were nosignificant interactions when predicting the logarithm of basalarea. Due to the limited number of coefficients that could bedistinguished from zero, these results are not displayed.
Stability in relationships with elevation across life stagesAnalysis of the relationships between elevation and presence
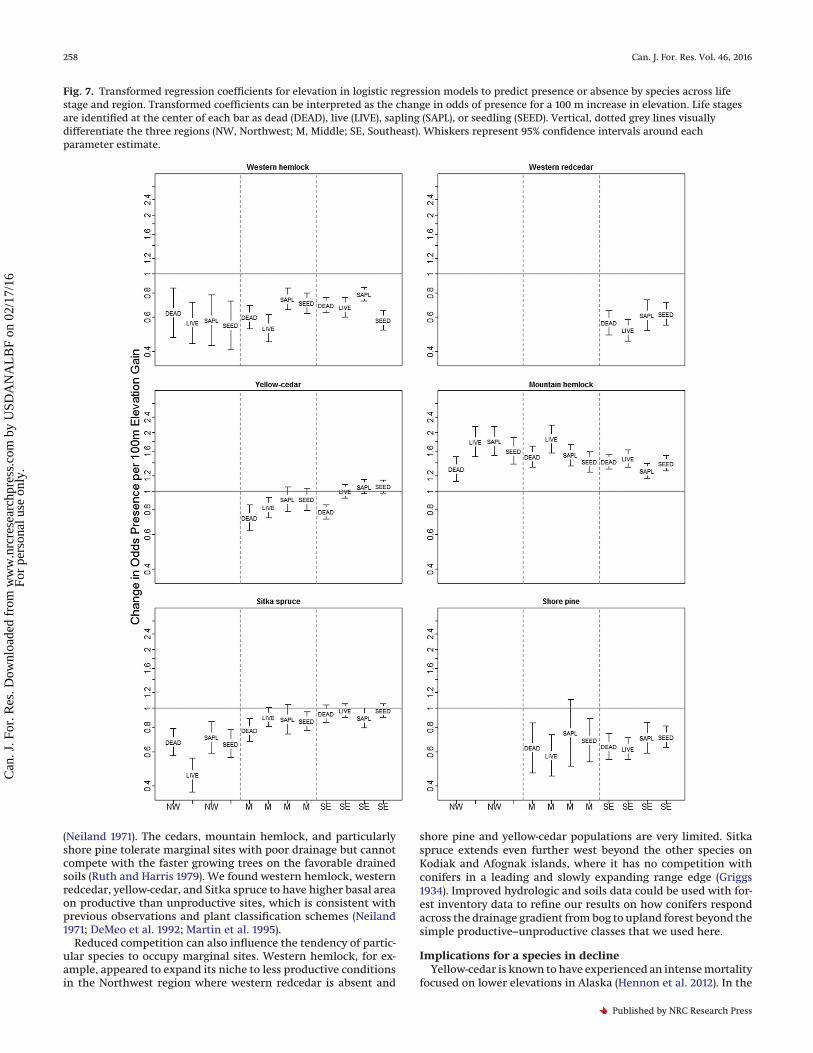
of live trees, dead trees, saplings, and seedlings for each speciesrevealed patterns of distributional stability or change for the sixtree species (Fig. 7). The coefficient values can be interpreted asthe change in the odds of a species being present for every 100 mincrease in elevation by live trees, dead trees, saplings, and seed-lings and for each species. Where the coefficients differ across lifestages, it is an indication that the relationship of that species'
distribution to elevation is shifting over time (Fig. 7). Westernhemlock had relatively similar relationships with elevation acrosslife stages in the Northwest and Southeast regions. In the Middleregion, smaller trees were more likely to be present at higherelevations than mature and dead trees. In the Southeast region,seedlings of western hemlock were present at somewhat lowerelevations than the other life stages. There was a trend for deadyellow-cedar to be found at lower elevations and for live trees andsaplings and seedlings to be found at progressively higher eleva-tions; the strongest relationship with elevation was for the deadtrees and the weakest relationship with elevation was for seed-lings and saplings. Dead mountain hemlock occurred at some-what lower elevations than other life stages in the Northwestregion. The odds of Sitka spruce and shore pine presence as afunction of elevation indicated relative stability for the four lifestages, except that the odds of live Sitka spruce tree presence wasreduced at low elevations in the Northwest region (Fig. 7).
The relationship between basal area and elevation was not dra-matically different for dead versus live trees (where present) for
Fig. 5. Effects of elevation on species presence or absence and on basal area, where present. (a) For presence and absence, transformedcoefficients representing the change in odds of species presence for a 100 m gain in elevation are presented. (b) For basal area, coefficientsdescribe the effect of a change in elevation on log(basal area) using a linear regression model assuming normal errors. Species: TSHE, westernhemlock; THPL, western redcedar; CANO, yellow-cedar; TSME, mountain hemlock; PISI, Sitka spruce; PICO, shore pine. Whiskers describe 95%confidence intervals around each parameter estimate. Regions: NW, Northwest; M, Middle; SE, Southeast.
Caouette et al. 255
Published by NRC Research Press
Can
. J. F
or. R
es. D
ownl
oade
d fr
om w
ww
.nrc
rese
arch
pres
s.co
m b
y U
SDA
NA
LB
F on
02/
17/1
6Fo
r pe
rson
al u
se o
nly.
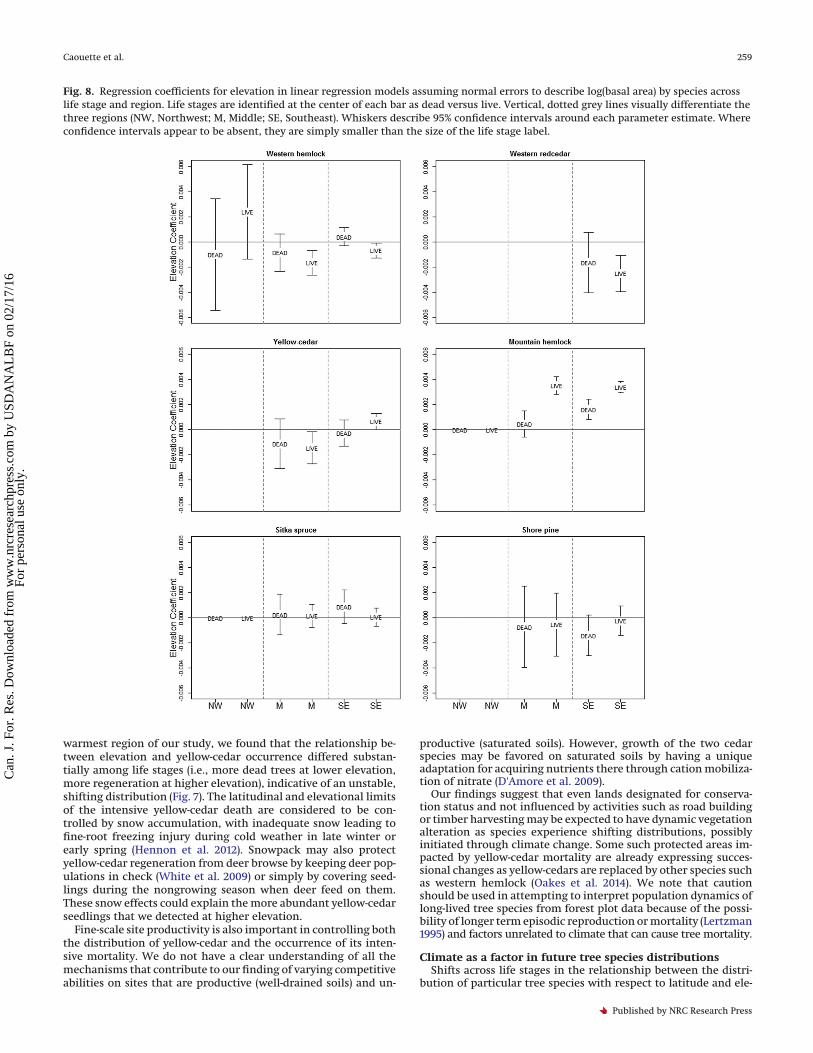
most species and in most regions (Fig. 8). As for the presence–absence models above, we compared the coefficients between liveand dead tree basal area within each species to assess whether therelationship of that species' productivity to elevation is stable. Asin Figs. 5 and 6, positive values for these coefficients indicateincreasing basal area with elevation for live or dead trees; con-versely, negative values suggest reduced basal area with increas-ing elevation. The positive effect of elevation was dramaticallystronger for live versus dead basal area for mountain hemlock inboth the Middle and Southeast regions. Yellow-cedar, in theSoutheast regions, had a slightly positive relationship with eleva-tion for live trees, yet there was no effect of elevation on deadbasal area. In interpreting these models, we recognize that deadstanding trees used in our analysis may remain standing for var-ious lengths of time in inventory plots according to tree species,elevation, and productivity class, and therefore, differences inparameters estimated across life stages may reflect multiple pro-cesses in addition to climate change.
DiscussionElevation was a strong predictor of the distribution of six com-
mon conifer tree species across the expanse of the coastal temper-
ate rainforest in Alaska, an area at the leading edge of climatechange. Elevation was, however, a better predictor of occurrencethan of basal area. Our simple yet quantitative models of thecurrent realized niche for each species agreed well with publishedqualitative descriptions of species occurrence across the region(e.g., Hultén 1968; Vierick and Little 2007). Nested within thesebroad trends, a fine-scale indicator of site productivity refined ourpredictions of occurrence for almost every species within all rel-evant regions. For some species and within some regions, sitequality also had a significant effect on basal area. By comparingmodels across life stages, we observed indications, for some spe-cies and in some regions, of changing relationships between spe-cies distributions and elevation that may be indicative of achanging climate. Interestingly, for other species, we observed noindication of shifting species distributions (Table 1). Our findingscan be applied to gain insight into species of particular interest,for example, to understand changes in the distribution of yellow-cedar, which has been impacted across portions of the regionthroughout the 20th century.
Biogeography and forest management at the leading edgeThe broad spatial arrangement of tree species, especially at
their northern or northwestern-most range limits in Alaska, is
Fig. 6. Regression coefficients for productivity in regression models to describe (a) presence or absence using a logistic model and (b) log(basalarea) using a linear regression model assuming normal errors. Regression coefficients for the logistic model are transformed to describe thechange in odds of presence for a productive versus unproductive site. In both cases, the subset of plots classified as “mixed productivity” werenot used in model building, and productivity was added to a model that already contained log-transformed elevation. Abbreviations are asdefined in Figure 5.
256 Can. J. For. Res. Vol. 46, 2016
Published by NRC Research Press
Can
. J. F
or. R
es. D
ownl
oade
d fr
om w
ww
.nrc
rese
arch
pres
s.co
m b
y U
SDA
NA
LB
F on
02/
17/1
6Fo
r pe
rson
al u
se o
nly.

probably a result of distinct adaptations to particular climate fac-tors, as well as differing migration histories. Therefore, patternsat this leading edge provide a unique opportunity to observerange shifts as a result of climate change and other disturbances.Each of our six tree species has natural ranges that extend farsouth of Alaska along the Pacific Coast to California (Burns andHonkala 1990). Moisture deficits, possibly combined with fire,may pose the greatest risk of potential range retractions at thetrailing edge of climate change in California, as none of thesespecies is tolerant to drought or fire. However, precipitation is nottypically limiting at low elevation in the northern portions ofthese species' ranges. Here, climate may influence the elevationalpatterns of these trees by affecting their reproductive success andcompetitive ability more than by imposing heat or drought toexceed their physiological limits.
At this leading edge of the climate envelope, elevation was aclear surrogate for latitude. The occurrence of several tree speciesshowed a strong association with elevation. Two of the three spe-cies (western redcedar and shore pine) that were most often foundat lower elevation also have natural ranges that did not extend farto the northwest into Alaska. The third species, Sitka spruce,which has the most extensive range, had a tendency to occur atlow elevations, but this pattern was only present in the mostnortherly region. Mountain hemlock was most common at higherelevations in all three regions in Alaska. The weaker relationshipbetween basal area and elevation suggests that climate and otherfactors related to elevation do not substantially affect tree growth,either number or size of stems, in the same way as they affectseedling initiation. The greater basal area of mountain hemlock athigher elevation combined with the negative coefficient for prob-ability of presence on productive sites is consistent with the ob-servation that mountain hemlock is only competitive on lowproductivity sites at low elevations (Martin et al. 1995).
Given more detailed knowledge of range limits and occurrenceby elevation and productivity class, various forest management
strategies in coastal Alaska may be employed to favor tree specieson particular sites. However, adapting forest management prac-tices at species range edges is in the early stages of development(Milad et al. 2013). With robust distribution models of tree speciesfocusing on patterns at the limits of current species ranges, forestmanagement strategies could be developed for favoring regener-ation and competition of species at their current northern orupper elevational limits. Conservation methods might be em-ployed to protect trees at these limits, but various harvestingstrategies could also be used to encourage natural regenerationor, in combination with artificial regeneration (planting), to en-hance migration (Pedlar et al. 2012). The role of natural distur-bance such as windthrow, landslides, and glacial rebound infavoring migration of tree species needs to be investigated andrelated to active forest management. High-resolution species dis-tribution models and associated GIS layers will undoubtedly be afoundation for developing conservation and management strate-gies. Our results can serve as inputs to these models, estimatingoccurrence and abundance where there are no on-the-grounddata.
Fine-scale effects of site qualitySite quality or productive potential is tied closely to soil mois-
ture, a function of climate, soils, and microtopography. Sitequality, therefore, operates at a fine spatial scale, nested withinelevation and climate, to influence the distribution and abun-dance of tree species. Forest productivity is positively correlatedwith soil moisture in many forests of the world where water isoften limiting (Gholz et al. 1990). The opposite relationship isfound in coastal Alaska, where there is abundant year-round pre-cipitation and droughts are relatively rare (Stephens et al. 1969). Incoastal Alaska, bogs and other forested peatlands that have devel-oped on gentle slopes or in soils with restricted drainage supportless live conifer biomass, more open canopy conditions, and aunique and diverse composition of tree and understory species
Table 1. A summary of modeled tree distributions by species, region (NW, Northwest; M, Middle; SE, Southeast), and life stage.
Westernhemlock(TSHE)
Westernredcedar(THPL)
Yellow-cedar
(CANO)
Mountainhemlock(TSME)
Sitkaspruce(PISI)
Shorepine
(PICO)
NW M SE SE M SE NW M SE NW M SE M SE
Effect of increasing elevationon probability of presence
Effect of elevation on BAwhere present (by region)
Effect of higher site qualityon probability of presence
Effect of higher site qualityon BA where present
Interaction between sitequality and elevation
PA PA PA
Effect of elevation onprobability of presenceby life stage
Deadlower
Deadlower
Livelower
Effect of elevation on BAby life stage
Deadlower
Deadlower
Note: The regional presence is defined as presence in more than five plots within the region. Arrows describe parameters for which the 95% confidence intervalsdo not overlap zero. Grey indicates that the 95% confidence interval is extremely close to zero. The direction of the arrow indicates the effect of increasing elevationor of productive site classification. The effect of site productivity classification was assessed in models that already contained elevation. The effects of interactions aresummarized simply as presence of a significant interaction between elevation and site productivity in models to predict presence or absence of the species (PA) or basalarea (BA). There were no significant interaction effects in models of BA. Results of models describing the effects of elevation on probability of presence by life stagewere summarized by describing the life stage that differed from the others.
Caouette et al. 257
Published by NRC Research Press
Can
. J. F
or. R
es. D
ownl
oade
d fr
om w
ww
.nrc
rese
arch
pres
s.co
m b
y U
SDA
NA
LB
F on
02/
17/1
6Fo
r pe
rson
al u
se o
nly.
(Neiland 1971). The cedars, mountain hemlock, and particularlyshore pine tolerate marginal sites with poor drainage but cannotcompete with the faster growing trees on the favorable drainedsoils (Ruth and Harris 1979). We found western hemlock, westernredcedar, yellow-cedar, and Sitka spruce to have higher basal areaon productive than unproductive sites, which is consistent withprevious observations and plant classification schemes (Neiland1971; DeMeo et al. 1992; Martin et al. 1995).
Reduced competition can also influence the tendency of partic-ular species to occupy marginal sites. Western hemlock, for ex-ample, appeared to expand its niche to less productive conditionsin the Northwest region where western redcedar is absent and
shore pine and yellow-cedar populations are very limited. Sitkaspruce extends even further west beyond the other species onKodiak and Afognak islands, where it has no competition withconifers in a leading and slowly expanding range edge (Griggs1934). Improved hydrologic and soils data could be used with for-est inventory data to refine our results on how conifers respondacross the drainage gradient from bog to upland forest beyond thesimple productive–unproductive classes that we used here.
Implications for a species in declineYellow-cedar is known to have experienced an intense mortality
focused on lower elevations in Alaska (Hennon et al. 2012). In the
Fig. 7. Transformed regression coefficients for elevation in logistic regression models to predict presence or absence by species across lifestage and region. Transformed coefficients can be interpreted as the change in odds of presence for a 100 m increase in elevation. Life stagesare identified at the center of each bar as dead (DEAD), live (LIVE), sapling (SAPL), or seedling (SEED). Vertical, dotted grey lines visuallydifferentiate the three regions (NW, Northwest; M, Middle; SE, Southeast). Whiskers represent 95% confidence intervals around eachparameter estimate.
258 Can. J. For. Res. Vol. 46, 2016
Published by NRC Research Press
Can
. J. F
or. R
es. D
ownl
oade
d fr
om w
ww
.nrc
rese
arch
pres
s.co
m b
y U
SDA
NA
LB
F on
02/
17/1
6Fo
r pe
rson
al u
se o
nly.
warmest region of our study, we found that the relationship be-tween elevation and yellow-cedar occurrence differed substan-tially among life stages (i.e., more dead trees at lower elevation,more regeneration at higher elevation), indicative of an unstable,shifting distribution (Fig. 7). The latitudinal and elevational limitsof the intensive yellow-cedar death are considered to be con-trolled by snow accumulation, with inadequate snow leading tofine-root freezing injury during cold weather in late winter orearly spring (Hennon et al. 2012). Snowpack may also protectyellow-cedar regeneration from deer browse by keeping deer pop-ulations in check (White et al. 2009) or simply by covering seed-lings during the nongrowing season when deer feed on them.These snow effects could explain the more abundant yellow-cedarseedlings that we detected at higher elevation.
Fine-scale site productivity is also important in controlling boththe distribution of yellow-cedar and the occurrence of its inten-sive mortality. We do not have a clear understanding of all themechanisms that contribute to our finding of varying competitiveabilities on sites that are productive (well-drained soils) and un-
productive (saturated soils). However, growth of the two cedarspecies may be favored on saturated soils by having a uniqueadaptation for acquiring nutrients there through cation mobiliza-tion of nitrate (D'Amore et al. 2009).
Our findings suggest that even lands designated for conserva-tion status and not influenced by activities such as road buildingor timber harvesting may be expected to have dynamic vegetationalteration as species experience shifting distributions, possiblyinitiated through climate change. Some such protected areas im-pacted by yellow-cedar mortality are already expressing succes-sional changes as yellow-cedars are replaced by other species suchas western hemlock (Oakes et al. 2014). We note that cautionshould be used in attempting to interpret population dynamics oflong-lived tree species from forest plot data because of the possi-bility of longer term episodic reproduction or mortality (Lertzman1995) and factors unrelated to climate that can cause tree mortality.
Climate as a factor in future tree species distributionsShifts across life stages in the relationship between the distri-
bution of particular tree species with respect to latitude and ele-
Fig. 8. Regression coefficients for elevation in linear regression models assuming normal errors to describe log(basal area) by species acrosslife stage and region. Life stages are identified at the center of each bar as dead versus live. Vertical, dotted grey lines visually differentiate thethree regions (NW, Northwest; M, Middle; SE, Southeast). Whiskers describe 95% confidence intervals around each parameter estimate. Whereconfidence intervals appear to be absent, they are simply smaller than the size of the life stage label.
Caouette et al. 259
Published by NRC Research Press
Can
. J. F
or. R
es. D
ownl
oade
d fr
om w
ww
.nrc
rese
arch
pres
s.co
m b
y U
SDA
NA
LB
F on
02/
17/1
6Fo
r pe
rson
al u
se o
nly.
vation may suggest population expansion or contraction inresponse to a changing climate. We observed indications of suchshifts not only for yellow-cedar, but also for mountain hemlockand Sitka spruce (Table 1), and similar results have been found byothers. For example, by comparing the geographic distribution ofseedlings and tree biomass from inventory plots in the eastern US,Woodall et al. (2009) found the mean latitude of seedlings to be20 km north of tree biomass for northern species but southernspecies appeared static. As in our study, results on life stagesshould be interpreted cautiously because seedlings and saplingsrepresented size classes and not necessarily recent regeneration.Coldest mean temperature of the month, growing degree days,and moisture indices are useful in predicting vegetation ranges innorthern Europe (Sykes and Prentice 1996) and western NorthAmerica (Shafer et al. 2001). For coastal Alaska, we would addsnow accumulation (or snowpack) as an important controllingclimate factor of conifer occurrence and abundance.
The climate of coastal Alaska is expected to become warmer andslightly wetter in the next century (Wolken et al. 2011). Forest treeswill experience warmer winters, longer growing seasons, and, asthe mean winter temperature warms above freezing, consider-ably reduced snow accumulation in some areas. The region ispredicted to have the greatest loss of days below freezing of anyarea of North America in the 21st century (Meehl et al. 2004)because current winter mean temperatures hover close to the 0 °Cfreezing threshold. Species reliant on snow for either greater com-petitive status (mountain hemlock) or protection from directweather injury (yellow-cedar) are likely to experience diminishedsuitable habitat. We found both of these species to be associatedwith higher elevations in Alaska, especially for mountain hem-lock. Both tree species have also been projected to lose habitat inBritish Columbia, as other conifer species from lower elevationwould be expected to shift upward (Hamann and Wang 2006). Ourstudy found western hemlock, Sitka spruce, western redcedar,and shore pine to be associated with low elevations in Alaska andhave extensive ranges to the south, suggesting that they may befavored by the projected climate during the next century. Thesetree species may benefit directly by warmer conditions but socould individual insects (e.g., spruce aphid, Powell and Parry(1976)), pathogens (e.g., dwarf mistletoe, Barrett et al. (2012)), andherbivores (e.g., deer, White et al. (2009)) to offset gains in produc-tivity.
The current distributions of forest trees reflect the realized eco-logical niche of each species, the culmination of their adaptationto environmental factors, competition with other tree species,interaction with other biotic factors, and migration from historicdistributions. Untangling these complex interactions will be chal-lenging; however, our quantification of their associations withseveral stationary factors should form a basis for understandingedaphic and climate niche requirements of coastal conifers. Bycomparing live versus dead tree basal areas and occupancy acrossmultiple life stages, we revealed possible maladaptation to cli-mate and possible distribution contraction or expansion for somespecies and not others. Our results provide a convenient glimpseof fluctuating populations across latitude, elevation, and site pro-ductivity. Our analysis suggests instability of yellow-cedar, moun-tain hemlock, and Sitka spruce distributions, whereas westernhemlock, western redcedar, and shore pine species appear to havemore stable distributions (Table 1). Each of our tree species arefound in mixed-species communities, but they are likely to re-spond individually to climate change, as is suggested by the fossilrecord (Davis and Shaw 2001). Our models of each independenttree species enable us to begin imagining how communitiesacross whole landscapes might shift and re-arrange under achanging climate.
AcknowledgementsWe wish to thank Tara Barrett and Ken Winterburger for guid-
ance with forest inventory plot data, Rob Develice and RobertPattison for help in interpreting the northwest limits of tree spe-cies, Melinda Lamb who produced Fig. 1, and Tara Barrett andLauren Oakes who made helpful suggestions on an early manu-script draft. We appreciate the financial assistance from the USFSRegion 10 Regional Office and oversight by The Nature Conser-vancy for their support to John Caouette.
ReferencesAlaback, P.B. 1982. Dynamics of understory biomass in Sitka spruce–western
hemlock forests of southeast Alaska. Ecology, 63: 1932–1948. doi:10.2307/1940131.
Andersen, H.E. 1953. Range of western redcedar (Thuja plicata) in Alaska. USDAForest Service, Juneau, Alaska, Technical Note No. 22.
Barrett, T., Latta, G., Hennon, P.E., Eskelson, B.N.I., and Ternesgen, H. 2012.Modeling host–parasite distributions under changing climate: Tsugaheterophylla and Arceuthobium tsugense in Alaska. Can. J. For. Res. 42(4): 642–656. doi:10.1139/x2012-016.
Barrett, T.M., and Christensen, G.A. 2011. Forests of southeast and south–centralAlaska, 2004–2008: five year forest inventory and analysis report. USDA For-est Service, Pacific Northwest Research Station, Portland, Oregon, GeneralTechnical Report PNW-GTR-835.
Booth, T.H., Nix, H.A., Hutchinson, M.F., and Jovanovic, T. 1988. Niche analysisand tree species introduction. For. Ecol. Manage. 23: 47–59. doi:10.1016/0378-1127(88)90013-8.
Burns, R.M., and Honkala, B.H. 1990. Silvics of North America. Vol. 1, conifers.USDA Forest Service, Washington, DC, Agriculture Handbook 654.
Cade, B.S. 1997. Comparison of tree basal area and canopy cover in habitatmodels: subalpine forest. J. Wildl. Manage. 61: 326–336. doi:10.2307/3802588.
D'Amore, D.V., Hennon, P.E., Schaberg, P.G., and Hawley, G. 2009. Adaptation toexploit nitrate in surface soils predisposes yellow-cedar to climate change-induced decline while enhancing the survival of redcedar: a new hypothesis.For. Ecol. Manage. 258: 2261–2268. doi:10.1016/j.foreco.2009.03.006.
Davis, M.B., and Shaw, R.G. 2001. Range shifts and adaptive responses to quater-nary climate change. Science, 292: 673–679. doi:10.1126/science.292.5517.673.
DeMeo, T., Martin, J., and West, R.A. 1992. Forest plant association managementguide, Ketchikan Area, Tongass National Forest. USDA Forest Service, AlaskaRegion, Juneau, Alaska, R10-MB-210.
DeVelice, R.L., Hubbard, C.J., Boggs, K., Boudreau, S., Potkin, M., Boucher, T., andWertheim, C. 1999. Plant community types of the Chugach National Forest:southcentral Alaska. USDA Forest Service, Chugach National Forest, AlaskaRegion, Anchorage, Technical Publication R10-TP-76.
Elith, J., and Leathwick, J.R. 2009. Species distribution models: ecological expla-nation and predictions across space and time. Annu. Rev. Ecol. Syst. 40:677–697. doi:10.1146/annurev.ecolsys.110308.120159.
Gholz, H.L., Ewel, K.C., and Teskey, R.O. 1990. Water and forest productivity.Forest Ecology and Management, 30: 1–18.
Grace, J., Berninger, F., and Nagy, L. 2002. Impacts of climate change on the treeline. Ann. Bot. 90: 537–544. doi:10.1093/aob/mcf222.
Griggs, R.F. 1934. The edge of the forest in Alaska and the reasons for its position.Ecology, 15: 80–96. doi:10.2307/1932778.
Hamann, A., and Wang, T. 2006. Potential effects of climate change on ecosys-tem and tree species distribution in British Columbia. Ecology, 87: 2773–2786. doi:10.1890/0012-9658(2006)87[2773:PEOCCO]2.0.CO;2.
Harris, A.S., Hutchison, O.K., Meehan, W.R., Swanston, D.N., Helmers, A.E.,Hendee, J.C., and Collins, T.M. 1974. The forest ecosystem of southeast Alaska.1. The Setting. USDA Forest Service, Pacific Northwest Forest and Range Ex-periment Station, Juneau, Alaska, General Technical Report PNW-GTR-12.
Haufler, J.B., Mehl, C.A., and Yeats, S. 2010. Climate change: anticipated effectson ecosystem services and potential actions by the Alaska Region, U.S. ForestService. Ecosystem Management Research Institute, Seeley Lake, Montana,U.S.A.
Hennon, P.E., and Trummer, L.M. 2001. Yellow-cedar (Chamaecyparis nootkatensis)at the northwest limits of its range in Prince William Sound, Alaska. North-west Sci. 75: 61–72.
Hennon, P.E., Hansen, E.M., and Shaw, C.G., III. 1990. Dynamics of decline andmortality of Chamaecyparis nootkatensis in southeast Alaska. Can. J. Bot. 68(3):651–662. doi:10.1139/b90-085.
Hennon, P.E., D'Amore, D.V., Schaberg, P.G., Wittwer, D.T., and Shanley, C.S.2012. Shifting climate, altered niche, and a dynamic conservation strategy foryellow-cedar in the North Pacific coastal rainforest. BioScience, 63: 147–158.doi:10.1525/bio.2012.62.2.8.
Hultén, E. 1968. Flora of Alaska and neighboring territories. Stanford Press,Stanford, California.
Iverson, L.R., Prasad, A.M., Mathews, S.N., and Peters, M. 2008. Estimating po-tential habitat for 134 eastern US tree species under six climate scenarios.For. Ecol. Manage. 254: 390–406. doi:10.1016/j.foreco.2007.07.023.
Lertzman, K.P. 1995. Forest dynamics, differential mortality and recruitmentprobabilities. J. Veg. Sci. 6: 191–204. doi:10.2307/3236214.
260 Can. J. For. Res. Vol. 46, 2016
Published by NRC Research Press
Can
. J. F
or. R
es. D
ownl
oade
d fr
om w
ww
.nrc
rese
arch
pres
s.co
m b
y U
SDA
NA
LB
F on
02/
17/1
6Fo
r pe
rson
al u
se o
nly.

Martin, J.R., Trull, S.J., Brady, W.W., West, R.A., and Downs, J.M. 1995. Forestplant association management guide, Chatham Area, Tongass National For-est. USDA Forest Service, Alaska Region, Juneau, Alaska, Leaflet R10-TP-57.
Mátyás, C. 2010. Forecasts needed for retreating forests. Nature, 464: 1271. doi:10.1038/4641271a.
Meehl, G.H., Tebaldi, C., and Nychka, D. 2004. Changes in frost day simulationsof 21st century climate. Clim. Dyn. 12: 495–511. doi:10.1007/s00382-004-0442-9.
Milad, M., Schaich, H., and Konold, W. 2013. How is adaptation to climate changereflected in current practice of forest management and conservation? Biodiv-ers. Conserv. 22: 1181–1202. doi:10.1007/s10531-012-0337-8.
Neiland, B.J. 1971. The forest-bog complex in Southeast Alaska. Vegetatio, 22:1–63. doi:10.1007/BF01955719.
Nielson, S.E., Johnson, C.J., Heard, D.C., and Boyce, M.S. 2005. Can models ofpresence–absence be used to scale abundance? Two case studies consideringextremes in life history. Ecography, 28: 197–208. doi:10.1111/j.0906-7590.2005.04002.x.
Oakes, L., Hennon, P., O'Hara, K., and Dirzo, R. 2014. Long-term changes in atemperate forest impacted by climate change. Ecosphere, 5: art135. doi:10.1890/ES14-00225.1.
Oakes, L.E., Hennon, P.E., Ardoin, N.M., D'Amore, D.V., Ferguson, A.J., Steel, E.A.,Wittwer, D.T., and Lambin, E.F. 2015. Conservation in a social–ecologicalsystem experiencing climate-induced tree mortality. Biol. Conserv. 192: 276–285. doi:10.1016/j.biocon.2015.09.018.
Pearson, R.G., and Dawson, T.P. 2003. Predicting the impacts of climate changeon the distribution of species: are bioclimate envelope models useful? Glob.Ecol. Biogeogr. 12: 361–371. doi:10.1046/j.1466-822X.2003.00042.x.
Pedlar, J.H., McKenney, D.W., Audin, I., Beardmore, T., Beaulieu, J., Iverson, L.,O'Neill, G.A., Winder, R.S., and Ste-Marie, C. 2012. Placing forestry in theassisted migration debate. BioScience, 62: 835–842. doi:10.1525/bio.2012.62.9.10.
Peteet, D.M. 1991. Postglacial migration history of lodgepole pine near Yakutat,Alaska. Can. J. Bot. 69(4): 786–796. doi:10.1139/b91-102.
Peterson, A.T. 2003. Predicting the geography of species' invasions via ecologicalniche modeling. Q. Rev. Biol. 78: 419–433. doi:10.1086/378926.
Powell, W., and Parry, W.H. 1976. Effects of temperature on overwintering pop-ulations of the green spruce aphid Elatobium abietinum. Ann. Appl. Biol. 82:209–219. doi:10.1111/j.1744-7348.1976.tb00555.x.
Rehfeldt, G.E., Crookston, N.L., Warwell, M.V., and Evans, J.S. 2006. Empirical
analyses of plant–climate relationships for the western United States. Int. J.Plant Sci. 167: 1123–1150. doi:10.1086/507711.
Ruth, R.H., and Harris, A.S. 1979. Management of western hemlock–Sitka spruceforests for timber production. USDA Forest Service, Pacific Northwest Forestand Range Experiment Station, Portland, Oregon, General Technical Re-port PNW-88.
Schroeder, T.A., Hamann, A., Wang, T., and Coops, N.C. 2010. Occurrence anddominance of six Pacific Northwest conifer species. J. Veg. Sci. 21: 586–596.doi:10.1111/j.1654-1103.2009.01163.x.
Shafer, S.L., Bartlein, P.J., and Thompson, R.S. 2001. Potential changes in thedistributions of western North America tree and shrub taxa under futureclimate scenarios. Ecosystems, 4: 200–215. doi:10.1007/s10021-001-0004-5.
Steel, E.A., Jensen, D.W., Burnett, K.W., Christiansen, K., Firman, J.C., Feist, B.E.,Anlauf, K., and Larsen, D.P. 2012. Landscape characteristics and coho salmon(Oncorhynchus kisutch) distributions: explaining abundance versus occupancy.Can. J. Fish. Aquat. Sci. 69(3): 457–468. doi:10.1139/f2011-161.
Stephens, F.R., Gass, C.R., Billings, R.F., and Paulson, D.E. 1969. Soils and associ-ated ecosystems of the Tongass. USDA Forest Service, Alaska Region report,Juneau, Alaska.
Sykes, M.T., and Prentice, I.C. 1996. Climate change, tree species distributionsand forest dynamics: a case study in the mixed conifer/northern hardwoodszone of northern Europe. Clim. Change, 34: 161–177. doi:10.1007/BF00224628.
USDA Forest Service. 1972. Forest survey handbook FSH 4809.11. US GovernmentPrinting Office, Washington, DC.
Vierick, L.A., and Little, E.L. 2007. Alaska trees and shrubs. Second edition.University of Alaska Press, Fairbanks, Alaska.
White, K.S., Pendleton, G.W., and Hood, E. 2009. Effects of snow on Sitka black-tailed deer browse availability and nutritional carrying capacity in southeast-ern Alaska. J. Wildl. Manage. 73: 481–487. doi:10.2193/2007-499.
Wolken, J.M., Hollingsworth, T.N., Rupp, S.T., Chapin, F.S., Trainor, S.F.,Barrett, T.M., Beever, E.A., Sullivan, P.F., McGuire, A.D., Euskirchen, E.S.,Hennon, P.E., Beever, E.A., Conn, J.S., Crone, L.K., D'Amore, D.V., Fresco, F.,Hanley, T.A., Kielland, K., Kruse, J.J., Patterson, T., Schuur, E.A.G.,Verbyla, D.L., and Yarie, J. 2011. Evidence and implications of recent andprojected climate change on Alaska's forest ecosystems. Ecosphere, 2(11):art124. doi:10.1890/ES11-00288.1.
Woodall, C.W., Oswalt, C.M., Westfall, J.A., Perry, J.A., Perry, C.H., Nelson, M.D.,and Finley, A.O. 2009. An indicator of tree migration in forests of the easternUnited States. For. Ecol. Manage. 257: 1434–1444. doi:10.1016/j.foreco.2008.12.013.
Caouette et al. 261
Published by NRC Research Press
Can
. J. F
or. R
es. D
ownl
oade
d fr
om w
ww
.nrc
rese
arch
pres
s.co
m b
y U
SDA
NA
LB
F on
02/
17/1
6Fo
r pe
rson
al u
se o
nly.