Embed Size (px)
Citation preview

1 | P a g e
Ayoade M. Adetoye1 and Dare Akerele2
1Environmental and Economic Resource Centre, EERC, Abeokuta, Ogun State, Nigeria 2Department of Agricultural Economics and Farm Management, Federal University of Agriculture Abeokuta, PMB 2240, Alabata Road, Abeokuta, Ogun State, Nigeria
Acknowledgements The authors express their appreciation in respect of the grant support provided by the African Economic Research Consortium (AERC) to conduct the study.
Influence of Farm Production Diversity and Land Use Patterns on Food Security and
Nutrition among Farm Households In Nigeria

2 | P a g e
Influence of Farm Production Diversity and Land Use Patterns on
Food Security and Nutrition among Farm Households In Nigeria
Author
Ayoade M., ADETOYE
Environmental and Economic Resource Centre
EERC Building, Opposite Federal University of Agriculture Abeokuta
Ogun State, Nigeria
Email: [email protected]
Tel: +2347031557937
Dare AKERELE
Senior Lecturer
Department of Agricultural Economics and Farm Management,
Federal University of Agriculture, Abeokuta, Nigeria.
PMB 2240, Alabata Road,
Abeokuta Ogun State, Nigeria
Acknowledgement
The author gladly expresses his profound gratitude for the fund support received from the
African Economic Research Consortium (AERC) towards the course of the research.

3 | P a g e
Acronyms
CBN – Central Bank of Nigeria
DDS – Dietary Diversity Score
DFH – Department of Family Health
DHS – Demographic and Health Survey
DQI – Dietary Quality Index
FAO – Food and Agriculture Organization
FEWS NET – Family Earning Warning System Network
FOS – Federal Office of Statistics
FVS – Food Variety Score
GDP – Gross Domestic Product
ICF – International Classification of Functioning, Disability and Health
IFAD – International Fund for Agricultural Development
IFPRI – International Food Policy Research Institute
LGA – Local Government Area
MDAT – Mozambican Diet Assessment Tool
NBS – National Bureau of Statistics
NFMH – Nigeria Federal Ministry of Health
NII – Nutrient Intake Index
NPC – National Population Commission
NPC – National Population Commission
PRB – Population Reference Bureau
UN – United Nations
UNICEF – United Nation Children Education Fund
USAID – United State Agency for International Development
WFP – World Food Programme
WHO – World Health Organization

4 | P a g e
1.0 Introduction
Although substantial milestones have been made to ensure improvements in the global food
and nutrition security, hunger and malnutrition are still in common place, and a complex global
problem (Sibhatu, 2015). Even though substantial progresses (millstones) have been achieved
at the global level towards food insecurity, malnutrition and hunger reduction over the past few
decades, however, the proportion of food insecure and malnourished population are still
unacceptably high, especially in Asian and African countries (Godfray et al, 2010; Dubé et al,
2012; IFPRI, 2014). Close to 800 million people are still classified as chronically hungry,
meaning that they do not have enough access to calories (FAO, IFAD, WFP, 2015). Africa
alone houses more than 25% of the world’s hungry and undernourished population (FAO,
2015). Approximately 2 billion people worldwide suffer from micronutrient malnutrition
(hidden hunger), mostly due to low intakes of essentials vitamins and minerals (IFPRI, 2014).
Nutritional deficiencies are responsible for a large health burden in terms of lost productivity,
impaired physical and mental human development, susceptibility to various diseases, and
premature deaths especially among children (Lim et al, 2012).
Global statistics indicate that approximately 795 million people are hungry and chronically
undernourished with over 25% of them located in sub-Saharan Africa (FAO, IFAD, WFP
2015). African alone houses more than one-third of stunted children under 5 years of age, and
approximately 28% of wasted children under 5 years of age (UNICELF 2015). Nutritional
deficiencies are not only the result of low food quantities consumed, but also of poor dietary
quality and diversity. In fact, the level of dietary diversity was shown to be a good indicator of
people’s broader nutritional status in many situations (Ruel, 2003; Headey, 2013). The above
food deprivation and nutritional concerns, including high susceptibility to sickness and
diseases, premature death, impaired physical human development and cognitive functioning,
reduced productivity at adulthood, loss of gross domestic product (GDP) and inter-generational
poverty transmission, among others, (Bain et al. 2013) are closely connected to food insecurity
and nutritional deficiencies.
The problem of food security and nutritional deficiencies in African does not only result from
inadequate consumption of food quantities, but also of consumption of monotonous or less
varied diets. Consumption of more varied diets has been hypothesized/conceptualized, and
documented in some empirical studies, to be positively related to dietary quality (Ruel, 2002),

5 | P a g e
and food quantity in terms of access or availability dimensions of food security as well as
reduction of chronic under-nutrition and a plethora of nutrition-related diseases (Arimond and
Ruel 2004; Mallard et al. 2014). This therefore situates dietary diversity at the epicentre of the
linkage between food security, nutrition and health.
Available studies have shown that the majority of households in Nigeria are poor, consuming
relatively cheap, energy dense foods and low-quality monotonous diets derived largely from
cereals or tubers (Akerele, 2015) - a situation that has contributed to the slow progress in food
insecurity and malnutrition reduction in the country. Most food insecure and malnourished
households in Nigeria reside in the rural areas. Issues of monotonous diet is also commonly
reported among the rural poor, particularly among farm households. Moreover, of all the farm
household member, children have been reported to experience severe food insecurity (Nnakwe
and Onyemaobi, 2013).
More diverse diets tend to be associated also with lower rates of overweight, obesity, and other
nutritional problems of rising magnitude in many parts of the world (Popkin and Slining, 2013).
Increasing dietary diversity is therefore an important strategy to improve nutrition and health.
This implies that agricultural production also needs to be diversified, so that a wide range of
different types of foods are available and accessible also to poor population segments (Pingali,
2015). It thus implies that diversification of agricultural production among farm households is
often perceived as a useful approach to improve dietary diversity and nutrition (Khouryet al,
2014; Pinstrup-Andersen, 2007; Jone et al, 2014). Several recent development initiatives have
promoted smallholder diversification through introducing additional crop and livestock species
with the intention to improve household nutrition (Burlingame, 2012; Fanzo, 2103). In
addition, farm diversity can help to increase agrobiodiversity too, this approach is also welcome
from environmental perspectives (Frison, 2006; Deckelbaum, 2006; Burlingame, 2012;
Sibhatu et al, 2015).
Although farm level diversity is being projected as a way of improving nutrition and the quality
of diets, the preponderance of food insecurity and malnutrition that is experienced even among
farm households including those who diversified seems to challenge this submission. This
therefore, raises an important question of whether agricultural transformation that prioritises
farm production diversity can be a veritable pathway for enhancing dietary diversity (quality)
and nutrition among farm households. Also, market price situation (dynamics) and whether the

6 | P a g e
farmer is a net-food consumer, operates in autarky or is a net-food seller and whether a farmer
more oriented towards farm diversity or specialization also play important role in food security
and nutrition. Consequently, this study would seek to examine whether food surplus farmers
(taking advantage of price signal to increase farm income), or those with more diverse farm
production are well-off in terms of diet quality/diversity and nutrition as well as what a trade-
off between farm diversity and specialisation holds for food security will need more unpacking.
Even though encouragement of agricultural production diversity is increasingly being
recognised as a possible avenue to reduce food insecurity and malnutrition through increased
supply of varied foods, and, by extension consumption of more diverse diets, some other
complexities (challengers) need to be addressed. The livelihoods of rural dwellers depend
greatly on (land-based) agricultural production. Most of these farmers make little or no
conscious efforts to enhance land quality and sustainability and there also seems to be limited
government actions to help them to maintain the quality of their farm land (soil condition). The
start points to addressing this problem is to empirically examine whether the existing land
use/cropping patterns being adopted by farm households can enhance soil nutrient in a way that
will guarantee sustainable food production. Another issue that is closely connected to land use
sustainability and food security /nutrition relates to land tenure security and property right of
the farmers and other socio-economic or cultural factors. When ownership and property on
land secure, farmers may be more likely to adopt practices/land use patterns that enrich soil
fertility, all else equal. One of the key questions this study would seeks to answer would relate
the influence of land tenure security and other socio economic/cultural on sustainable land use
patterns and draw implication for household food security.
Against this background, this study seeks to provide answer to the following questions:
1. What is the food security status of the farm households?
2. Aside the overall food security status of the households, what is the nutritional status
of children among farm households i.e. are they malnourished?
3. Would farm production diversity have significant influence on household food security
and the nutritional status of children among farm households?
4. What influence would farm specialisation have on food security and nutrition compared
to more diverse farms?
5. Would increases in food prices translate to improved diets and nutrition among farm
households?

7 | P a g e
6. Are the existing land use/cropping patterns adopted by farm households suitable for
sustainability of food production?
7. What influence would land tenure security and socioeconomic characteristics, among
others, have on sustainable cropping patterns?
1.2 General Objectives
The broad objective of the study is to examine the influence of diversified farm systems and
land use/cropping patterns on household food security status and nutritional wellbeing of
children among farm households in Nigeria.
Specific Objectives
1. To examine the food insecurity status of farm households in terms of food quality
(dietary diversity) and food quantity (measured by food calorie consumption).
2. To assess the nutritional status of children among farm households
3. To examine, having controlled for other relevant variables, the influence of farm
production diversity, food prices and land use/cropping patterns on food security
(dietary diversity and calorie intake adequacy) and child nutrition among farm
households. What influence would farm specialisation have on food security and
nutrition compared to more diverse farms?
4. To examine how sustainable is the existing farm households' land use/cropping
behavioural practices. That is, to assess whether land use/cropping patterns currently
being adopted by farm households are adequate to improve soil fertility, nutrient
recycling and promote sustainable food production.
5. To examine, having controlled for other confounding factors, the relationship between
sustainable land use/cropping patterns and aggregate crop output in rural Nigeria. The
understanding here is to link farmers' land use/cropping behavioural practices to food
security in terms of sustainable food production
6. To examine the influence of land tenure security, socioeconomic factors and farmers'
perception about climate change on sustainable land use/cropping patterns.
1.3 Definition of Key Concepts
Food Security: this is a situation when all people, always, have physical, social and economic
access to enough, safe and nutritious food which meets their dietary needs and food preferences
for an active and healthy life (FAO, 2003). Household food security is the application of this
concept to the family level, with individuals within households as the focused of concern.

8 | P a g e
Food Diversity: this implies how diverse the food consumption basket of the household in
terms of different foods or food group consumed. A more diverse diet is highly correlated with
adequacy of intake of calories, macro and micro nutrients.
Food Quality: this could also be used as a proxy for quality of diet consumed.
Farm Household: this refer to households whose occupation are predominantly farming. Their
main livelihoods revolve around farm production activities.
Land Use Pattern: this refers to system of land modification which is determine by physical
attributes of a landscape and socioeconomic factors.

9 | P a g e
2.0 Literature Review
Farm households in developing countries strive to achieve food security by consuming and
then selling surplus household produce (Govereh and Jayne, 2003). This is typical of farm
households in Nigeria who experience issues of food insecurity especially during the dry
season. Further this challenge, integrated crop–livestock farming has been identified as an
important mechanism to address rural household food insecurity and poverty in developing
economies (Herrero et al., 2007; FAO, 2010). Globally, this type of integrated farming system
produces about half the world’s food (Herrero et al., 2010). In addition, it reduces the cost of
total farm production by exploiting economies of scope (Chavas and Di Falco, 2012). For
instance, cost savings of 14% have been identified from joint crop and livestock production
rather than producing crops and livestock separately (Wu and Prato, 2006; Asante et al, 2015).
2.1 Food Insecurity in Nigeria
Food security has been defined in various ways by different scholars. According FAO, et al.
(2013) food security is always access to the food needed by all people to enable them to live a
healthy life. A country is said to be food secured when there is always access to food of
acceptable quantity and quality consistent with decent existence for most of the population
(Idachaba, 2004). This means that food must be available to the people to meet the basic
nutritional standard needed by the body. But it should be noted that availability of food does
not mean accessibility to food. Availability depends on production, consumer prices,
information flows and the market dynamics. Abudullahi (2008) defined food security as when
people have physical and economic access to enough food to meet their dietary needs for a
productive healthy life at present as well as in the future. This definition outlines some indices
for measuring the extent or degree of food security to be achieved by any country and the
indices are adequate national food supply, nutritional content, accessibility, affordability and
environmental protection. Absence of food security is food insecurity; food insecurity on the
other hand represents lack of access to enough food and can either be chronic or temporary.
FAO (2010) refers to food insecurity as the consequences of inadequate consumption of
nutritious food bearing in mind that the physiological use of food is within the domain of
nutrition and health. When individuals cannot provide enough food for their families, it leads
to hunger and poor health. Poor health reduces one’s ability to work and live a productive
healthy life. Poor human development destabilizes a country’s potential for economic
development for generations to come (Otaha, 2013). According to FAO, et al. (2013), the core
determinants of food security are availability, accessibility, utilization and stability.

10 | P a g e
Food Availability: - Availability of food plays a conspicuous role in food security. Having
enough food in a nation is necessary but not adequate to ensure that people have satisfactory
access to food. Over the years, population has increased faster than the supply of food thus
resulting in food unavailability per person.
Food Accessibility: - The ability to have access to food depends on two major conditions: -
Economic access and physical access. Economic access depends on one’s income, the price of
food and the purchasing power of the people. Physical access depends on the availability and
quality of infrastructure needed for the production and distribution of food. Lack of economic
access to food is because of the increase in the rate of poverty.
Food Utilization: - Food utilization is measured by two outcomes indicators which reflect the
impact of inadequate food intake and utilization. The first outcome is measured by under-five
years of age nutrition level while second measurement is quality of food, health and hygiene.
According to FAO measuring the nutritional status of under-five years of age is an effective
approximation for the entire population. The indicators for the measurement of under-five years
of age are wasting (weight for height); underweight (weight for age) and stunting (height for
age). Most times, progress in terms of having accessed to food is not always accompanied by
progress in the utilization of the food. A more direct indicator of food utilization is underweight
because it shows improvement more promptly than stunting and wasting whose improvement
can take a longer time to be noticeable.
Stability: it has to do with exposure to short-term risks which have a way of endangering long-
term progress. Key indicators for exposure to risk include climate shocks such as droughts,
erosion and volatility in the prices of inputs for food production. The world price shocks lead
to domestic price instability which is a threat to domestic food producers as they stand the
chance of losing invested capital.
Nigerian farmers are mainly smallholders farming mainly for subsistence, this makes it difficult
for them to cope with changes in the prices of inputs, and it also lowers their ability to adopt
new technologies thereby resulting in reduced overall production. Changing weather patterns
as a result of climate change have played a part in reducing food supply, for instance flood in
the southern parts of the country and drought in the northern parts leads to substantial losses in
production and income. The interplay of all these variables determines whether an individual,
household, state or nation is food secured or not. This is because sustainable food security at
the household level does not guarantee sustainable food security at the state or national level.

11 | P a g e
2.2 Food Insecurity
Food insecurity exists when people lack sustainable physical or economic access to enough
safe, nutritious, and socially acceptable food for a healthy and productive life. Food insecurity
may be chronic, seasonal, or temporary. Food insecurity and malnutrition result in catastrophic
amounts of human suffering. The World Health Organization estimates that approximately 60
percent of all childhood deaths in the developing world are associated with chronic hunger and
malnutrition. In developing countries, persistent malnutrition leaves children weak, vulnerable,
and less able to fight such common childhood illnesses as diarrhoea, acute respiratory
infections, malaria, and measles.
The root cause of food insecurity in developing countries is the inability of people to gain
access to food due to poverty. While the rest of the world has made significant progress towards
poverty alleviation, Africa, Sub-Saharan Africa continues to lag. Projections show that there
will be an increase in this tendency unless preventive measures are taken. Food security on the
continent has worsened since 1970 and the proportion of the malnourished population has
remained within the 33 to 35 percent range in Sub-Saharan Africa. The prevalence of
malnutrition within the continent varies by region. It is lowest in Northern Africa with 4 percent
and highest in Central Africa with 40 percent. (Angela, 2006).
Categories of Food Insecurity
There are three main categories of food insecurity as classified by the Food and Agricultural
Organization of the United Nations.
Acute: Sever hunger and malnutrition to the point that lives are threatened immediately (e.g.
famine)
Occasional: When food insecurity occurs due to a specific temporary circumstance.
Chronic: Ability to meet food needs is consistently or permanently under threat.
2.3 Malnutrition in Nigeria
Malnutrition has many adverse consequences for child survival and long-term well-being. It
also has far-reaching consequences for human capital, economic productivity, and national
development overall. These consequences of malnutrition should be a significant concern for
policy makers in Nigeria, which has the highest number of children under 5 years with chronic
malnutrition (stunting or low height-for-age) in sub-Saharan Africa at more than 11.7 million,
according to the most recent DHS report (NPC and ICF International 2014).

12 | P a g e
Nigeria is the most populous nation in Africa with almost 186 million people in 2016 (UNICEF
2017). It has a high fertility rate of 5.38 children per woman, the population is growing at an
annual rate of 2.6 percent, worsening overcrowded conditions. By 2050, Nigeria’s population
is expected to grow to a staggering 440 million, which will make it the third most populous
country in the world, after India and China (Population Reference Bureau 2013). In Nigeria,
37 percent of children under 5 years are stunted. The prevalence of stunting increases with age,
peaking at 46 percent among children 24–35 months. While stunting prevalence has improved
since 2008 (41 percent), the extent of acute malnutrition (wasting or low weight-for-height)
has worsened, from 14 percent in 2008 to 18 percent in 2013 among children under 5 years
(NPC and ICF International 2009 and 2014). Women’s nutrition is also of concern in Nigeria,
facing the double burden of malnutrition: prevalence of undernutrition is 11 percent and
prevalence of overweight/obesity is 25 percent (NPC and ICF International 2014). One driver
of Nigeria’s high rate of growth is that childbearing begins early in Nigeria. By age 19, 41
percent of adolescent girls had begun childbearing in 2013, which is an increase from 38
percent in 2008. This has serious consequences because, relative to older mothers, adolescent
girls are more likely to be malnourished and have a low birth weight baby, who is more likely
to become malnourished and be at increased risk of illness and death than those born to older
mothers (National Population Commission and ICF International 2014). The risk of stunting is
33 percent higher among first-born children of girls under 18 years, and as such, early
motherhood is a key driver of malnutrition (Fink et al. 2014). Children in rural areas are more
likely to be stunted (43 percent) than those in urban areas (26 percent), and the pattern is similar
for severe stunting (26 percent in rural areas and 13 percent in urban areas). The North West
has the highest proportion of children who are stunted (55 percent), followed by the North East
(42 percent) and North Central (29 percent). At the state level, Kebbi has the highest proportion
of stunted children (61 percent), while Enugu has the lowest proportion (12 percent). A
mother’s level of education generally has an inverse relationship with stunting: stunting ranges
from a low of 13 percent among children whose mothers have a higher education to a high of
50 percent among those whose mothers have no education. A similar inverse relationship is
observed between household wealth and stunting. Children in the poorest households are three
times as likely to be stunted (54 percent) as children in the wealthiest households (18 percent)
(NPC and ICF International 2014). Prevalence of early initiation of breastfeeding decreased
from 38 percent in 2008 to 33 percent in 2013, while children who received a pre-lacteal feed
increased from 56 percent in 2008 to 59 percent in 2013. In addition, prevalence of breastfed

13 | P a g e
children 6–23 months receiving a minimum acceptable diet decreased from 9 percent in 2008
to 4 percent in 2013 (NPC and ICF International 2014). The causes of malnutrition and food
insecurity in Nigeria are multifaceted and include poor infant and young child feeding
practices, which contribute to high rates of illness and poor nutrition among children under 2
years; lack of access to healthcare, water, and sanitation; armed conflict, particularly in the
north; irregular rainfall; high unemployment; and poverty (Nigeria Federal Ministry of Health,
Family Health Department 2014). Although chronic and seasonal food insecurity occurs
throughout the country, and is exacerbated by volatile and rising food prices, the impact of
conflict and other shocks has resulted in acute levels of food insecurity in the North East zone
(FEWS NET, 2017). An estimated 3.1 million people in the states of Borno, Yobe, and
Adamawa received emergency food assistance or cash transfers in the first half of 2017 but,
because much of the North East zone has been inaccessible to aid agencies, the number who
need assistance is likely much greater (FEWS NET, 2017). Diet-related non-communicable
diseases are also on the rise in Nigeria due to globalization, urbanization, lifestyle transition,
socio-cultural factors, and poor maternal, fatal, and infant nutrition (NFMH, Family Health
Department 2014).
2.3.1 Primary Causes of Undernutrition and Possible Solutions in Nigeria
Poor infant Feeding Practices: Two-thirds of all new-borns do not receive breast milk within
one hour of birth, only 13% of infants under six months are exclusively breastfed and during
the important transition period to a mix of breast milk and solid foods between six and nine
months of age, one-quarter of infants are not fed appropriately with both breast milk and other
foods (UNICEF 2009). To prevent poor infant feeding practices in Nigeria, women and their
families should be supported to practice optimal breastfeeding and ensure timely and adequate
complementary feeding. Breast milk fulfils all nutritional needs of infants up to six months of
age, boosts their immunity, and reduces exposure to infections (WHO, 2009).
High Disease Burden: 13% of child deaths under five are due to diarrhoea, undernutrition
increases the likelihood of falling sick and severity of disease. Moreover, undernourished
children who fall sick are much more likely to die from illness than well-nourished children.
Parasitic infestation diverts nutrients from the body and can cause blood loss and anaemia
(UNICEF 2009). Incidence of high disease burden can be reduced by preventing and treating

14 | P a g e
childhood infection and other disease. Hand-washing, deworming, zinc supplements during
and after diarrhoea, and continued feeding during illness are important.
Limited Access to Nutritious Food: Fewer than 10% of households are food insecure as
defined by available calories per capita, Achieving food security, however, means ensuring
quality and continuity of food access, in addition to quantity, for all household members,
dietary diversity is essential for food security, high rates of micronutrient deficiencies in
Nigeria indicate that dietary diversity may be low (FAO 2009). Possible solution includes
involving multiple sectors agriculture, education, transport, gender, the food industry, health
and other sectors, to ensure that diverse, nutritious diets are available and accessible to all
household members.
2.4 Farm Production Diversity among Households in Nigeria
Farm production diversity is concerned with the switch from subsistence food production to
commercial agriculture which is applicable to both crop and livestock production. Crop
diversification refers to growing many crops at the same time. Many households in developing
countries have been found to diversify their income sources allowing them to spread their risk
and smoothen consumption. This is often necessary in agricultural based peasant economies
because of risk of such variability in soil quality, household and crop diseases, price shocks,
unpredictable rainfall and other weather-related events (Ibrahim et al., 2009).
In Nigeria, crop and livestock production systems are practiced by 75% of smallholders.
However, the choices available to farmers are limited by the availability of resources such as
land, labour and capital. In recent years, the options for farmers have also been limited by
climatic conditions, especially erratic rainfall, drought, high temperatures and floods
(Agyemang-Bonsu et al., 2008; Griebenow and Kishore, 2009; Ellis-Jones et al., 2012). These
result in low crop yields and, in extreme cases, crop failure. This has a cascading debilitating
effect on livestock production (Ellis-Jones et al., 2012; Ndamani and Watanabe, 2015), because
pasture and crop residue, which play important roles as livestock feed in most rural settings,
become limited. This leaves resource-poor farm households suffering from income instability,
inadequate food availability and increased poverty. The relevance of agricultural
diversification in reducing production and marketing risks, as well as household income
instability and its implications for food security and poverty has long been acknowledged
(Ellis, 1998; Little et al., 2001; Joshi et al., 2004; Mainik and Rüschendorf, 2010; Yan et al.,

15 | P a g e
2010; Chavas and Di Falco, 2012; Kim et al., 2012; Tasie et al., 2012; Ogundari, 2013; Sibhatu,
2015).
Nigeria’s Agriculture at present is characterized by weak and inefficient production system,
decade infrastructure and risk and uncertainty. Thus, rural household are therefore constrained
to develop strategies to cope with vulnerability of agriculture production system through
livelihood diversification (Ellis, 2000). Although, most rural households are involved in
agricultural activities such as animal and crop production as their primary source of livelihood,
they also engage in non-farming and income generating activities to improve their primary
source of income. In other words, only very few rural households are involved in just one
activity therefore livelihood diversification plays a very significant role in the socio-economic
life of the rural households (Barrett et al., 2001).
Diversification decisions seem to be driven to a large extent by desperation rather than new
opportunities, especially among the migrants. The share of income from non-agricultural
sources increases considerably and, in fact, drives income growth of the poorest, whose income
from agriculture stagnates. While diversification seems to be beneficial to the poor from this
static perspective, analysis may also give reasons to be concerned. High non-farm growth rates
are achieved through allocating more labour to the local non-farm sector as well as migration
and not by improved ‘diversification productivity’ (Ijaiya et al., 2011). Probably, this does not
imply that diversification cannot provide a pathway out of poverty. Overall, there is still a
positive correlation between income per capita and diversification despite the dichotomy of
diversification. Yet, there are signs that diversification is increasingly desperation-led, which
is why this positive correlation tends to become weaker. Migration seems to be an important
driver of local non-farm diversification, most likely through remittances and returning
migrants. In addition, the expansion of education has certainly enabled or motivated more
individuals to engage in local non-farm activities. These factors may indeed allow some
household to escape poverty through diversification (Lay and Schuler, 2007). The adopted
strategies in diversification of income include non-farm income sources, most importantly
those obtained from other than unskilled labour. These are associated with increased income
and enormous income mobility especially upward earnings mobility. In contrast, those
households that have neither access to non-farm activities nor enough productive non-labour
assets to devote themselves entirely to on-farm agricultural production, typically must rely on
a low return strategy of complete dependence on the agricultural sector and often find

16 | P a g e
themselves caught in a dynamic stochastic poverty trap (Barrett et al., 2001). Reardon et al.
(2001) suggested that policies aimed at the rural sector which must be oriented towards
providing incentives that stimulate households to participate in rural non-farm jobs, as well as
the capacity of households to respond to such incentives. The challenge that was encountered
was the share of income from non-farm enterprises which tends to be greater among higher
income rural households (International Food Policy Research Institute, IFPRI, 2003).
Therefore, programs to develop existing non-farm rural enterprises will be probably directed
to assist higher-income households more than the poor. Occupational diversification challenges
conventional wisdoms about poverty reduction in rural areas of low-income countries (Ellis,
2004). The problem of diversification decisions seems to be driven to a large extent by
desperation rather than new opportunities, about migration (Lay and Schuler, 2007). If trend of
these problems continues, the farmers will have less money to carter for their household, and
generally remaining in the ultimate vicious cycle of poverty (Olarinde and Kuponiyi, 2005).
According to Ibrahim and Umar (2008), the diversification of income source of the farming
household heads can help to reduce the risk associated with income from a single source
especially a very risky enterprise such as agriculture. Poor infrastructure will continue to be a
disincentive to farmers diversifying in other activities due to high transaction costs coupled
with other constraints such as poor assets base, lack of credit facilities, lack of awareness and
training (Wanyama et al., 2010; Khatun and Roy, 2012). Babatunde and Quaim (2009) revealed
that entry barriers for households disadvantaged to participate in higher-payment off-farm
activities need to be overcome and the dire need to promote crop and livestock activities, which
currently benefit the poor more than the rich. Obayelu and Awoyemi (2010) showed that
majority of the rural household heads are engaged in farming activities as the major source of
income with attendant low income and this is expected to enhance increased access to credit in
the rural areas where most of the poor reside. Adepoju and Obayelu (2013) showed that non-
farm income plays a very important role in augmenting farm-income as almost three-quarters
of the respondents adopted a combination of farm and nonfarm strategy. This is an indication
that farming alone is not an adequate source of revenue for the rural households. Schwarze
(2004) posited that poor households tend to have more income sources and a more evenly
distribution of the income between these sources. This has less momentum as most rural
households diversified income sources (Babatunde and Quaim, 2009). According to Amare
and Belaineh (2013), despite the high level of participation in non/off-farm activities, the
contribution of non/off-farm income to total household income is small compared to farm
income.

17 | P a g e
Apart from livelihood Diversification, Off-farm work offers an alternative approach towards
reducing income variability. Off-farm income refers to that portion of household income that
is generated outside the farm. It is classified into three categories: the agricultural wage
employment involving labour supply to other farm, non-agricultural wage employment
including formal and informal non-farm activities and self-employment such as own business
(Babatunde et al., 2010). There has been a substantial growth in household participation in off-
farm work in recent time ad as a result, activities in the off-farm sector have witnessed a boom
in the manufacturing, agro-based and service sectors (Ibekwe et al., 2010). The reasons for this
boom attributed for the growth in off-farm engagement include: declining farm incomes and
the desire to insure against agricultural production risks, off-farm work has traditionally been
viewed by operators and their spouses as an action necessary to save the farm by providing
resource to pay farm bills or to repay debt (Mishra et al., 2002). The growth of off-farm income
has reduced the income inequality in agriculture and contributed to the catch-up of farmer’s
income with those of non-farm population.
In addition, the key benefits of agricultural diversification can then be classified into three
categories: economic, social and agronomic (Johnston et al., 1995). Economic benefits include
seasonal stabilization of farm income to meet other basic needs such as education, household
food security and mitigating risk. Indeed, most farms are involved in multi-output diversified
enterprises due to the presence of the significant uncertainty that is inherent in agriculture (Lin
et al., 1974; Chavas and Di Falco, 2012). In such cases, agricultural diversification can reduce
the risk exposure of farm households by optimizing income from a range of activities that are
subject in different ways to varying weather and market conditions. The social benefits include
more stable employment for farm workers and resources throughout the year. This can result
in sustainable incomes through efficient use of resources and exploitation of comparative
advantage, for example, in India (Joshi et al., 2004). Conservation of soil and water resources,
reduced disease, weed and insect infestation, reduced erosion, increased soil fertility and
increased yields are key determinants among the agronomic benefits of diversification
(Caviglia‐Harris and Sills, 2005; Iiyama et al., 2007; Mainik and Rüschendorf, 2010; Assante,
2015).
Despite the significant contribution of agricultural diversification in developing countries in
Asia and some parts of Africa in managing production risks, studies on agricultural
diversification in Nigeria are minimal and have largely focused on incomes and livelihoods
(Knudsen, 2007; Lay and Schüler, 2008; Aneani et al., 2011; Fausat, 2012; Senadza, 2012;

18 | P a g e
Akerele, 2013). Studies on diversification of farm production purposely to ensure food security
are still very few with exception of such study in Nigeria as at now. Diversification studies on
livestock are also minimal, particularly in sub-Saharan Africa (Devendra and Ibrahim, 2004;
Ibrahim et al., 2009) and non-existent in Nigeria. However, given that crop production is highly
correlated with livestock production in sub-Saharan Africa, with nearly 60% of crops produced
with livestock, this study extends the literature on diversification by examining influence of
farm diversification on food security and land use patterns among farm households in Nigeria.
2.5 Land Tenure and Property Right Issues
Land tenure security exists when landowners and users including smallholder farmers in Sub
Saharan Africa enjoy clearly defined and enforceable rights to land, whether such rights are
based on formal law or customary practices.
Land tenure is an important part of social, political and economic structures. It is
multidimensional, bringing into play social, technical, economic, institutional, legal and
political aspects that are often ignored but must be considered. Land tenure relationships may
be well-defined and enforceable in a formal court of law or through customary structures in a
community. Alternatively, they may be relatively poorly defined with ambiguities open to
exploitation.
Land tenure constitutes a web of intersecting interests which include:
a. Overriding interests: when a sovereign power (for instance a nation or community has
the powers to allocate or reallocate land through expropriation among other factors)
b. Overlapping interests: when several parties are allocated different rights to the same
parcel of land (e.g., one party may have lease rights, another may have a right of way,
etc.)
c. Complementary interests: when different parties share the same interest in the same
parcel of land (e.g., when members of a community share common rights to grazing
land, etc.)
d. Competing interests: when different parties contest the same interests in the same parcel
(e.g., when two parties independently claim rights to exclusive use of a parcel of
agricultural land, Land disputes arise from competing claims.)
Land tenure is often categorized as:

19 | P a g e
i. Private: the assignment of rights to a private party who may be an individual, a married
couple, a group of people, or a corporate body such as a commercial entity or non-profit
organization. For example, within a community, individual families may have
exclusive rights to residential parcels, agricultural parcels and certain trees. Other
members of the community can be excluded from using these resources without the
consent of those who hold the rights.
ii. Communal: a right of commons may exist within a community where each member of
the community has a right to use independently the holdings of the community. For
example, members of a community may have the right to graze cattle on a common
pasture. Non-members of the community are excluded from using the common areas.
iii. Open access: specific rights are not assigned to anyone and no-one can be excluded.
This typically includes marine tenure where access to the high seas is generally open to
anyone; it may include rangelands, forests, where there may be free access to the
resources for all.
iv. State: property rights are assigned to some authority in the public sector. For example,
in some countries, forest lands may fall under the mandate of the state, whether at a
central or decentralized level of government.
In practice, most forms of holdings may be found within a given society, for example, common
grazing rights, private residential and agricultural holdings, and state ownership of forests.
Customary tenure typically includes communal rights to pastures and exclusive private rights
to agricultural and residential parcels. In some countries, formally recognized rights to such
customary lands are vested in the nation state or the President “in trust” for the citizens.
2.6 Land tenure and Food Security
Availability, access, and utilization of food depend on land tenure security of farmers this
implies that for food to be consistently available in markets and for people to have the financial
means to access safe and nutritious food, there must be an enabling environment for sustained
agricultural growth for smallholders and large-scale investors alike. as seen in today’s high-
income countries, such an environment includes land tenure security. The United States agency
for international development (USAID) has noted that: “Without squarely addressing tenure
security and property rights issues, investments in food security programming may be
compromised and, indeed, be undermined.” (USAID. 2013)

20 | P a g e
Vulnerability to food insecurity in rural areas is higher when there is no security of land tenure.
Moreover, in countries with mixed tenure systems, whether statutory and/or customary, user
rights (including access/use and management of natural resources) are often neither recognized
nor respected. Governments and public agencies whose mandate it is to promote investments,
frequently consider land as unoccupied and therefore, as being transferrable to national or
foreign investors. Such land is, in most cases, collectively utilized and essential for people´s
access to food. Pastoralists, indigenous peoples and fishermen are some of the people most
affected by the lack of recognition of their rights over such resources. From a right to food
approach, guaranteeing access to natural resources for the most vulnerable populations is the
first essential step for realizing this human right. To ensure such access, government, policies
and legal frameworks should address territorial rights over natural resources. Furthermore, it
is crucial that participatory mapping of rural areas is a recognized government priority in order
to identify: i) the effective use and management of land and ii) the populations that are the most
vulnerable to food insecurity. Land titling schemes have often been considered the best option
for providing security of tenure. It is evident, however, that land titling does not always provide
the most appropriate solution (IFAD, 2008). Private ownership can exclude some segments of
the population, thereby obstructing the collective use of such land. Additionally, in some
contexts land titling schemes can be a source of conflict. Ultimately, participatory community
land delimitation and public registry of those rights might constitute an adequate way for
communities to decide on land use to ensure their livelihoods and have a stronger footing in
dealing directly with outside investors. Uncompensated forced eviction commonly occurs
because of the State’s desire to satisfy the aims of national or foreign investors, and particularly
in countries where governance is weak. Since forced eviction strongly affects peoples’ access
to food, it should be considered only in exceptional cases and should be strictly compliant with
the conditions established by law. In cases of arbitrary evictions affecting peoples’ access to
natural resources and food, individuals should be able to claim justice, remedial action and
effective reparation through adequate mechanisms of recourse.
2.7 Research Findings on Food Security and Land Rights in Africa
Recent research highlights the critical relationship between food security and security over
land. There is a growing body of evidence suggesting that securing land and resource rights for
men and women has a positive impact on food security and broader development outcomes,
such as household investment, agricultural productivity, women’s empowerment, nutrition,

21 | P a g e
and more robust rental markets for farmland. The existing literature highlighting the positive
impact of strengthened land tenure on food security outcomes is discussed below.
Studies in Malawi of a pilot land redistribution program based on a willing buyer/willing seller
model illustrate the substantial increase in food availability, and thus food security, when
formerly landless or near landless households acquire land or substantially more land. An early
study of the pilot found that beneficiary households: Invested a greater proportion of their land
in hybrid crops (24 percentage points more); and Had a higher yield for maize, the staple crop
(yield was twice as much) (Chirwa, 2008). These figures are in comparison to nearby
households that did not receive land from the pilot. at the end of the pilot, an independent
impact evaluation found that, among 15,000 beneficiary households, there were significant
increases in the production of all food crops, particularly a 236 percent increase in maize yields
(per hectare), increasing household food availability (Simtowe, et al., 2011). Household food
security (measured by meals eaten in the lean season and months of reserve food) and income
from agricultural activities continued to increase after the pilot.
A study in Ethiopia also bridges the two disciplines, measuring how land tenure security and
land tenure reforms affect and are affected by household food security (Hagos and Holden
2013). That study assessed the impacts of how a regional land registration and certification
program contributed to increased food availability and, thus to food security in a food deficit
region of northern Ethiopia. Comparing child nutrition impacts 8 to 12 years after
implementation of the land program, the study found that land certification appears to have
contributed to increased caloric intake and more so within female-headed households either
through enhanced participation in land rental markets or increased owner investment in land
and productivity. Results also showed that those households who accessed additional land
through rental markets (made possible in part through widespread land certification) had a
significantly higher body mass index.
Meanwhile, a study from Zambia that compared caloric intake among children whose families
had access to land and those that did not revealed dramatic impacts. researchers found that
children under 10 in households who lost access to agricultural land within the previous 5 years
received fewer daily calories (a decrease of 243 calories, or 11 percent of the average daily
calorie intake) compared to same-aged children whose households did not lose access to
agricultural land within the same period.

22 | P a g e
However, a full-scale land program need not be the only type of land tenure intervention that
can contribute to improved food security. advocacy and public education around land rights
can also make a difference. For example, SNV supported a national farmers’ advocacy program
in Mali, empowering and providing tools for farmers to engage in the national land policy
process, where there are significant commercial demands for agricultural land (Traore, 2012)
2.8 Land Rights, Household Investments, And Agricultural Productivity
Secure land and resource rights provide positive incentives to invest in and conserve valuable
resources, including land, pastures, and forests. Conversely, when these rights are insecure,
people have more limited incentives to invest labour and capital to improve soil, plant perennial
crops, manage rangelands, and invest in irrigation. The relationship between tenure security
and land related agricultural investment is widely documented. (Bodnar and Hilhorst 2014).
2.8.1 When land rights are secure, farmers invest more in their land and agricultural
productivity improves.
In Thailand, land titling increased investment, input use, and yields (Feder and Onchan 1987).
In Ethiopia, land certification led to land productivity increases of 40 to 45 percent in the Tigray
Region, and soil and water conservation investments rose by 30 percent in the Amhara Region
(Deininger et al., 2008). In Rwanda, investment doubled in farmers’ soil conservation (Ali et
al., 2011). In rural Benin, communities that participated in a process to map and recognize land
rights, were 39 to 43 percent more likely to shift their crop investments from subsistence to
long-term and perennial cash crops, and tree planting (Goldstein et al., 2015) Additional studies
from Nicaragua, Peru, Cambodia, and Vietnam found statistically significant effects of land
titling interventions on agricultural investment and productivity (Lawry et al., 2016).
2.8.2 When land rights are insecure, investment, productivity, and yields fall.
In Uganda, when plot ownership and control was disputed, yields were 20 percent lower; with
eviction risk, yields were 37 percent lower (Mwesigye and Matsumoto 2016). In Burkina Faso,
productivity dropped 40 percent when households had concerns regarding land disputes
(Linkow, 2016). In Malawi, the probability of investing in conservation was approximately 14
percent lower on informally rented plots where tenure was less secure than on inherited or
purchased plots (Lovo, 2016).
23 | P a g e
2.8.3 When land rights are secure, household participation in land markets increases.
Research has shown that better functioning land markets including rental markets positively
impact agricultural productivity and food security by allocating land more efficiently to the
most productive users and allowing less productive farmers to migrate or work in other sectors.
In Ethiopia, household land certification increased participation in the leasing and amount of
land rented out (Deininger et al., 2011). Another study from Ethiopia found that female-headed
households with access to formal land rights are more likely to engage in land rental activities
as landlords (Holden et al., 2011). In the Dominican Republic, insecure property rights
decreased land rental activity. The same study suggests that improving tenure security would
increase the total area rented to the poor by 63 percent (Macours et al., 2010)
2.8.4 Women’s land rights and food security.
Women make up approximately 43 percent of the agricultural labour force and produce a
significant portion of the food grown in the developing world. While land is the most important
resource for those dependent on agriculture for their livelihoods, women consistently have less
access to land than men, and women’s land rights are less secure. At the same time, research
shows that if women had the same access to resources for agricultural production as men, they
could increase yields on their farms by 20 to 30 percent; this could raise total agricultural output
in developing countries by 2.5 to 4 percent, and in turn reduce the number of undernourished
people in the world by 12 to 17 percent (FAO, 2011). This and other evidence support the
global consensus that closing the gender gap in secure access to land for women is fundamental
to food security and women’s empowerment (Van den Bold et al., 2013).
2.8.5 When women have secure land rights, agricultural investment and production
increase.
In Rwanda, women whose land rights were formalized were 19 percent more likely to engage
in soil conservation, compared to 10 percent among men (Ali et al., 2014). In rural Benin,
women were historically unlikely to invest in soil fertility by leaving their land fallow; but this
gender gap disappeared in communities where female-headed households mapped and
documented their parcel boundaries. In these communities, female-headed households were
just as likely as male-headed households to leave their land fallow (Goldstein et al., 2015).
Gender-sensitive allocation of micro-gardens in India increased use of credit and inputs like
fertilizer (Santos et al., 2013). In Ethiopia, land certification led to increased productivity on
plots owned by women (Bezabih and Holden 2010).

24 | P a g e
2.8.6 When women have secure access to land, nutrition outcomes improve.
In Ethiopia, an increase in land allocated to women decreased household food insecurity by 36
percent (Espinosa, 2014). Studies from Nicaragua and Honduras have found that increases in
female landholdings are associated with increases in household food expenditure and child
educational attainment (Katz and Chamorro 2002). In Vietnam, children in households where
women own land are up to 10 percent less likely to be sick (Menon, 2014). In Nepal, in
households where women own land, children are 33 percent less likely to be severely
underweight (Allendorf, 2006).
2.8.7 Secure land tenure provides solid ground for food security
Land tenure arrangements create incentives for investing labour and resources over the long
term and adopting and using new technologies and sustainable land management practices.
When rights to land are secure, there is:
• Greater incentive to manage and conserve the land;
• Greater incentive to make long-term improvements to the land and other land-related
investments;
• Less potential for conflict and arbitrary eviction;
• Opportunity for land rental and sales markets to transfer land to more productive uses
and users; and
• If combined with cost-effective systems of land administration, opportunity to reduce
the cost of credit by leveraging the land as collateral.vi in addition, land tenure security
builds household resilience to climate, environmental, financial, and health shocks by
providing families a safety net.
2.9 Land Use/Cropping Patterns and Soil Quality
Drought, desertification and other types of land degradation currently affect more than 2 billion
people in the world (Gabathuler et al., 2009). The situation might worsen due to unsustainable
use of soil and water under present scenarios of climate change (Gabathuler et al., 2009;
Muluneh et al., 2014). Soil loss is a worldwide risk and adversely affects the productivity of
all-natural ecosystems as well as agricultural, forest and rangeland ecosystems (Pimentel, 2006;
Perkins et al., 2013; Lemenih et al., 2014; Van Leeuwen et al., 2015). Changes in soil quality
affected by accelerated erosion are significant and have resulted in decreased production and
land abandonment (Pimentel et al., 1995).

25 | P a g e
In Nigeria, the demand for agricultural produce is continuously rising due to the geometric rise
in population; this has resulted in the intensification of cultivable land in an attempt to increase
agricultural productivity (Akinbile and Adekunle, 2000). Nigeria like most developing
countries is an agrarian society where vast percentage of the population is involved in several
agricultural activities. The rural population in the country represents a strong and virile
productive force in subsistence agriculture. They play an important role in the management of
land, agricultural forestry and water resource. Agricultural production in the developing
economies depends on land use intensity and resource allocation (Raufu, 2010). Efficient land
utilization and management practices ensure achievement of farm level objectives in term of
economic viability, food security and risk aversion (Pinstrup et al., 1995; Krusemen et al, 1996;
and Udoh and Akintola, 2002). With the ever-increasing Nigeria’s population, the pressure on
land has become so prominent that land which was initially regarded as a free-gift of nature
tends to be most highly priced factor of production (Gomez, 1993). The alternative features to
this, are the intensive use of the few plots of land which usually would result in land nutrient
exhaustion or degradation, low yield restricted farms and continuous poverty following low
productivity.
In recognition of the important of land as a farm resource, most agricultural policies and
programmes in Nigeria were aimed at improving accessibility to fertile land by farmers through
provision of irrigated lands, land reclamation and development of Fadama. For instance, the
River Basin Development Authority was mandated to increase land size in the country through
extensive irrigation programme. The on-going Fadama development programme in the country
is an attempt to increase crop productivity through improvement in marginal or less productive
lands. Thus, the availability and productivity as well as utilization of land have become priority
objectives of most recent agricultural policy in the country.
The accessibility of most agricultural lands especially in the southern part of the country
depends largely on land tenure system and the extent of competition by non-agricultural land
uses (Udoh 2000). Land as a factor of production is a critical input in agricultural production.
The criticality is imposed by its availability, accessibility, quantity and quality. In Nigeria’s
agriculture, the quality factor stands out as a major determinant of land productivity. This is
due to the problems associated with sourcing artificial amendments that can improve the
productivity of land especially by majority poor subsistent farmers that dominate the arable
crop production landscape (Raufus, 2010).

26 | P a g e
The results of exploiting land-use systems without consideration of the consequences on soil
quality have been environmental degradation. Agricultural use and management systems have
been generally adopted without recognizing consequences on soil conservation and
environmental quality, and therefore significant decline in agricultural soil quality has occurred
worldwide (Imeson et al., 2006). Soil erosion and diffuse soil contamination are the major
degradation processes on agricultural lands because of expansion and intensification of
agriculture. Other non-agricultural uses, such as industrial and urban uses, also have important
negative consequences on soil quality, due to local contamination, soil sealing, and changes in
the dynamics of the landscape systems. The concept of soil quality (Doran and Jones, 1996;
Karlen et al., 1997) is useful to assess the condition and sustainability of soil and to guide soil
research, planning, and conservation policy. However, some authors (Sojka and Upchurch,
1999; Davidson (2000) noted that soil quality is a valid and important concept that is not
amenable to a simple and universal definition, and that will make a distinctive and crucial
contribution to soil management. The importance of soil quality lies in achieving sustainable
land use and management systems, to balance productivity and environmental protection.
Unlike water and air quality, simple standards for individual soil-quality indicators do not
appear to be enough because numerous interactions and trade-offs must be considered. For
assessing soil quality, a complex integration of static and dynamic chemical, physical, and
biological factors need to be defined in order to identify different management and
environmental scenarios. Also, the consequences of any decline in soil quality may not be
immediately experienced. The soil system does not necessarily change because of changing
external conditions or use, because soil has the capacity of resistance (or resilience) to the
effects of potentially damaging conditions or misuse or to filter out harmful materials added to
it. In part, this capacity of the soil in buffering the consequences of inputs and changes in
external conditions arises because the soil is an exceedingly complex and varied material with
many diverse properties and interactions between soil properties. It is this complex dynamic
nature which often makes it difficult to distinguish between changes as a result of natural
development and changes due to non-natural external influences. Soil-quality assessment,
based on inherent soil factors and focusing on dynamic aspects of soil system, is an effective
method for evaluating the environmental sustainability of land use and management activities
(Nortcliff, 2002).
Therefore, the sustainability of soils is key to addressing the pressures of a growing population,
the sustainable management of soils can contribute to healthy soils and thus to a food-secure

27 | P a g e
world and to stable and sustainably used ecosystems, good land management is of economic
and social significance, and this includes soil management, particularly for its contribution
towards economic growth, biodiversity, sustainable agriculture and food security, which in turn
are key to eradicating poverty and allowing women’s empowerment, it is urgent to address
issues such as climate change, water availability, desertification, land degradation and drought,
as they pose global challenges
2.10 Dietary Diversity in Nigeria
Dietary diversity can be measured as the number of foods consumed across and within food
groups over a reference period- is widely recognized as being a key dimension of diet quality.
It reflects the concept that increasing the variety of foods and food groups in the diet helps to
ensure adequate intake of essential nutrients and promotes good health. There is ample
evidence from developed countries showing that dietary diversity is indeed strongly associated
with nutrient adequacy, and thus is an essential element of diet quality (Foote, et.al., 2004).
Food consumption pattern not only affect an individuals’ wellbeing but also have implications
for the society (Henry-Unaeze and Okonkwo 2011). It is documented that the choice of which
food to eat, where to eat and when to eat are intensely personal and influenced by several
factors which in turn influence an individual’s needs (Harwalin, 2002). Young adults have
special nutrients needs for growth and have been shown not to meet the dietary
recommendation for their age (Bonnie et al., 2004). Globally, there is evidence that
approximately two billion people suffering hidden hunger which has devastating effects and
significantly contributes to the global burden of disease (Kraemer, 2010). Anthropometric
measurements are vital tools used for proper monitoring and management of human health and
also useful in the determination of the relationship between various body measurements and
medical outcomes (Krishan, 2008). The few studies that have validated dietary diversity against
nutrient adequacy in developing countries confirm the well-documented positive relationship
observed in developed countries. A consistent positive association between dietary diversity
and child growth is also found in several countries. Finally, recent evidence from a multicounty
analysis suggests that household-level dietary diversity is strongly associated with per capita
consumption (a proxy for income) and energy availability, suggesting that dietary diversity
could be a useful indicator of household food security (defined in relation to energy
availability).
28 | P a g e
The rationale for emphasizing dietary diversity in developing countries stems mainly from a
concern related to nutrient deficiency and the recognition of the importance of increasing food
and food group variety to ensure nutrient adequacy. Lack of dietary diversity is a particularly
severe problem among poor populations in the developing world, because their diets are
predominantly based on starchy staples and often include little or no animal products and few
fresh fruits and vegetables. These plant-based diets tend to be low in several micronutrients,
and the micronutrients they contain are often in a form that is not easily absorbed. Although
other aspects of dietary quality, such as high intakes of fat, salt, and refined sugar, have not
typically been a concern in developing countries, recent shifts in global dietary and activity
patterns resulting from increases in income and urbanization are making these problems
increasingly relevant for countries in transition as well (WHO/FAO 1996).
2.10.1 Dietary Diversity Measure
Dietary diversity is usually measured by summing the number of foods or food groups
consumed over a reference period. The reference period usually ranges from one to three days,
but seven days is also often used, and periods of up to 15 days have been reported (Drewnowski
et al. 1997). Common measures of dietary diversity used in developed countries include
measures based on a simple count of foods or food groups (Krebs-Smith et al. 1987; Lwik, et
al., 1999), while others take into consideration the number of servings of different food groups
in conformity with dietary guidelines. Examples of this latter approach include the dietary score
developed by Guthrie and Scheer (1981), which allocates equal weights to each of four food
groups consumed in the previous 24 hours: milk products and meat/meat alternatives receive
two points for each of two recommended servings, and fruits/vegetables and bread/cereals
receive one point for each of four recommended servings (total = 16 points). A modification
of this approach developed by Kant et al. (1991, 1993) evaluates the presence of a desired
number of servings from five food groups (two servings each from the dairy, meat, fruit, and
vegetable groups and four servings from the grain group) over a period of 24 hours. This score,
called the serving score, allocates a maximum of four points to each food group for a total score
of 20. The authors also use a simple five-point scale called the food group score, which is a
simple count of food groups consumed in one day (using the same five food groups). Finally,
Krebs-Smith et al. (1987) used and compared three different types of dietary diversity measures
(which they refer to as dietary variety): (1) an overall variety score (simple count of food items),
(2) a variety score among major food groups (six food groups), (3a) a variety score within
29 | P a g e
major food groups, counting separate foods, and (3b) a variety score within major food groups,
counting minor food groups. All dietary measures are based on a three-day recall period.
However, in developing Countries, Single food or food group counts have been the most
popular measurement approaches for dietary diversity in developing countries, probably
because of their simplicity. The number of servings based on dietary guidelines was not
considered in any of the developing country studies reviewed. In China (Taren and Chen 1993),
Ethiopia (Arimond and Ruel 2002), and Niger (Tarini, et.al., 1999), researchers used food
group counts, while in studies in Kenya (Onyango, et.al., 1998), and in Ghana and Malawi
(Ferguson et al. 1993), they used the number of individual foods consumed. Studies in Mali
(Hatloy, et.al., 1998), and Viet Nam (Ogle, et.al., 2001) used both single food counts (Food
Variety Score) and a food group count (Dietary Diversity Score).
Also, studies done at the household level also used dietary diversity indicators that included
either individual foods or food groups (Hoddinott and Yohannes 2002; Hatloy et al. 2000). A
study in Mozambique used a weighting system, which scored foods and food groups according
to their nutrient density, the bioavailability of the nutrients they contain, and typical portion
sizes (Rose et al. 2002). For example, foods that were usually consumed in small amounts
(condensed milk) were given a lower score than foods with similar nutrient content that were
consumed in larger amounts (fluid milk).
2.10.2 Association Between Dietary Diversity and Nutrient Intake in Developing Countries
A study in Mali specifically validated dietary diversity against nutrient adequacy (Hatloy, et.al.,
1998). The study used two types of diversity scores: one based on a simple count of number of
foods (food variety score [FVS]) and one based on eight food groups (dietary diversity score
[DDS]). Both measures were computed from a quantitative dietary assessment using direct
weighing for two three days. Nutrient adequacy was measured using the NAR/MAR method
described previously (Schuette, et.al.,1996). This carefully conducted study documents a
significant association between nutrient adequacy (MAR) and both measures of dietary
diversity: the correlation coefficients between nutrient adequacy and FVS and DDS were 0.33
and 0.39, respectively.
A useful contribution of this study is the comparison of the two diversity measures in a
regression analysis, which shows that DDS (based on food groups) is a stronger determinant

30 | P a g e
of nutrient adequacy than FVS (based on individual foods). Thus, in this context, increasing
the number of food groups has a greater impact on nutrient adequacy than increasing the
number of individual foods in the diet.
An additional methodological contribution of the study is the sensitivity specificity analysis
carried out to identify best cut-off points to predict nutrient adequacy for both diversity
indicators. In this sample, the cut-off points of six for food-group diversity and for food variety
provided the best sensitivity and specificity combinations to predict nutrient adequacy.
Although these findings are highly context specific, they provide useful methodological
guidance for similar studies to be conducted in other populations.
The study in Viet Nam, which included adult women, used a similar methodology to validate
the same diversity measures (FVS and DDS) against nutrient intake and nutrient density (Ogle
et.al 2001). FVS and DDS were derived from a seven-day food frequency questionnaire and
included more than 120 foods and 12 food groups, respectively. The findings confirm a positive
association between the two measures of diversity and intake of a variety of nutrients. Women
in the highest tercile of FVS those who had consumed 21 or more different foods in 7 days had
a significantly higher intake of most nutrients studied than those from the lowest tercile who
had consumed 15 or fewer foods. Similarly, women with a food group diversity greater or equal
to eight (out of a maximum of 12 groups) had significantly higher nutrient adequacy ratios for
energy, protein, niacin, vitamin C, and zinc than women with lower food group diversity ( The
authors also measured a variety of nutritional status indicators anthropometry, haemoglobin,
serum ferritin, retinol, retinol binding protein and C-reactive proteins and reported only weak
associations between women’s nutritional status and the dietary diversity measures).
Two other studies that have looked at the association between diversity measures and nutrient
intakes confirm the positive association between dietary diversity and intake of a variety of
nutrients (Onyango, et al., 1998; Tarini, et al., 1999). An additional study, conducted in Ghana
and Malawi, is probably the only one that documents only weak, and in some cases negative,
associations between diversity and certain nutrients (Ferguson et al. 1993). In this study,
analysis of the association between diversity and nutrient intakes was not a primary objective,
and the findings are reported only briefly.
Although, a study in Mozambique evaluated a rapid assessment tool named the Mozambican
Diet Assessment Tool (MDAT) to determine whether households could be classified accurately
into three categories of dietary quality (defined in this study as synonymous to dietary

31 | P a g e
diversity). The tool was applied at the household level and gathered information on all
individual foods consumed by all household members in one day. Each food received a score
of 14, based on its nutrient density, the bioavailability of the nutrients it contains, and typical
portion sizes (foods received a lower score if consumed in small amounts compared to foods
of similar nutrient value consumed in larger amounts). Total scores below 12 points were
considered very low dietary quality (term used by authors), 1219, average, and 20 or higher,
adequate. The association between this rapid assessment tool and a Diet Quality Index (DQI)
score was computed from data from a quantitative household-level 24-hour recall was tested.
Findings show that households classified by the rapid assessment tool as having acceptable
diets had higher mean intakes of energy, protein, and iron than those qualified as having poor
or very poor diets. Findings for vitamin A intakes, however, were in the opposite direction.
However, Akerele and Odeniyi (2015) examined the extent of food consumption diversity and
the factors influencing demand for diverse foods in Nigeria using micro-data on 18191
households. The transformed versions (logistic transformation) of Berry and Entropy measures
of dietary diversity were used as regressands in the econometrics models employed for
analysis. They found out that low-income households and households whose heads are females
or without formal education have lower than the norm in terms of diversity in food
consumption. Also, income, food prices (captured by food price index), access to remittance,
educational attainment up to secondary school, sex of household head and spatial factors are
important determinants of demand for varied diets. Income improvement strategy, renewed
emphasis on nutrition education especially in secondary schools, efforts to curtail food price
inflation and sensitively-guided gender-based interventions are advocated, among others.
Findings call for evaluation of the extent to which policy actions in agriculture and other
relevant sectors weaken or advance diet diversity in order to devise holistic strategies for
nutrition and health.
Ukegbu (2014) assessed nutritional status of lactating women in Umuahia, Nigeria This study
was conducted on 240 randomly selected women attending post-natal clinics with their infants
(0-6 months) in four health facilitates in Umuahia North Local Government Area (LGA) of
Abia State, Nigeria using structured, validated and pre-tested questionnaire. Body Mass Index
(BMI) was used to assess nutritional status by taking height and weight measurements using
standard procedures. Dietary intake was assessed using 24-hour recall and a validated food
frequency questionnaire. Mean nutrient intake was calculated and expressed as percentages of

32 | P a g e
FAO/WHO recommended values. Data was analysed using descriptive statistics and Pearson
correlation coefficient was used to determine association between BMI and nutrient intake. She
found out that the prevalence of overweight and obesity were 52.10 and 18.30%, respectively.
Cereals/cereal based dishes (1430) and leafy/non-leafy vegetables (1079) were consumed more
frequently while legumes were less frequently consumed daily. Energy (2279.01±446.79kcal),
protein (50.02±12.23g), calcium (339.21±186.35mg) and vitamin A (698.52±615.50 µgRE)
intake were lower than recommendations. However, there was no significant correlation was
found between BMI and energy intake (p=0.793). She concluded that intake of some essential
nutrients was lower than recommendations. Intervention programs such as nutrition education
and dietary diversity should be emphasized during antenatal and lactation period to improve
better health and nutrition outcomes.
2.11 The Concept and Determinants of Agricultural Diversification
Agricultural diversification refers to the shift from the dominance of one crop to production of
several crops on a farm or in a region, to meet the ever-increasing demand for food (Petit and
Barghouti, 1992). In other words, agricultural diversification has meant that the farmers now
concentrate on new areas of agriculture, growing alternative crops, rearing new breeds of
livestock and adopting a new farming system (Joshi et al., 2006).
Chaplin (2000) and Vyas (2006) perceived diversification as consisting of three stages. The
first stage reflects a cropping system that shifts away from monoculture. The second stage
involves the cultivation of more than one enterprise producing a variety of crops to meet the
market at different times of the year. The third stage is mixed farming involving a shift of
resources from one crop (or livestock) to a larger mix of crops (or livestock) or a mix of crops
and livestock. For this reason, Joshi et al. (2006) described agricultural diversification as
connoting crop mix, enterprise mix and activity mix at the household level aimed at increasing
household income and profit. This study focuses on the second and third stages in
diversification, as defined here, as mean of achieving food security among farm households in
Nigeria. Thus, crop diversification refers to the cultivation of two or more crops with the
available productive resources. Similarly, livestock diversification is the rearing of two or more
livestock types by the farmers given their available resources. Crop–livestock diversification
is defined as the production of one or more crops and livestock with the available resources.
The determinants of diversification can largely be classified into demand- and supply-side
categories. Specifically, such a classification includes per capita income, urbanization and

33 | P a g e
population growth (Chand, 1996; Ryan and Spencer, 2001; Smith et al., 2001; Joshi et al.,
2007), on the demand-side, whereas, on the supply-side, there are farm-level factors,
household-level factors, biophysical factors, risk factors, infrastructure or institutions,
technology and resource endowments. The characteristics of the decision-making households
are largely determined by household-level factors such as age, gender, education, household
dependency ratio, capital and off-farm income activities (Guvele, 2001; Shezongo, 2005;
Birthal et al., 2007; Van den Berg et al., 2007; Ashfaq et al., 2008; Rahman, 2008; Ibrahim et
al., 2009; Abro, 2012; Tasie et al., 2012; Sichoongwe et al., 2014; Asante et al, 2017). Relevant
farm-level factors include the number of crops cultivated and the livestock managed by farm
households, the total land area cultivated, total value of outputs, types of crops cultivated, hired
and family labour, use of complementary technologies and quantity of fertilizer used (Weiss
and Briglauer, 2000; Benin et al., 2004; Rahman, 2008; De and Chattopadhyay, 2010; Dzanku
and Sarpong, 2010; Mesfin et al., 2011; Senadza, 2012; Sichoongwe et al., 2014).
Diversification could also be influenced by other socioeconomic variables like farmers’ access
to markets, distance to markets, access to extension, access to credit, membership of
associations and proximity to research and extension institutions and availability of advice
(Chand, 1996; Smith et al., 2001; Estache, 2003; Joshi et al., 2007; Kankwamba et al., 2012).
Several techniques have been employed to explain specialization or diversification of
commodities or activities in a given time and space by a single indicator with unique strengths
and weaknesses. Common among these are: the index of maximum proportion, the Berry index
(BI), Herfindahl index (HI) and its related transformations, Simpson’s index, the Ogive index
and the Entropy index and its associated modifications (Kelley et al., 1995; Chand, 1996;
Pandey and Sharma, 1996; Joshi et al., 2006). However, among these techniques, the Simpson
index of diversity, the BI, HI and the Ogive index have been widely employed in estimating
agricultural diversification (Mekhora and Fleming, 2004; Joshi et al., 2006; Ashfaq et al., 2008;
Ibrahim et al., 2009; Fausat, 2012; Ogundari, 2013).
2.12 Theory/Concepts and Measures of Food Diversity
This empirical study derives from the traditional demand theory as extended by Jackson (1984)
in his work on the hierarchy demand and Engel's curve for commodity variety. He argued that
the homothetic preferences implicit in the traditional consumer choice model, as reflected by
smooth indifference curves that are convex to the origin (Lancaster, 1990), presumes that
diverseness in consumption is only influenced by prices and that income increase has no impact

34 | P a g e
on demand for variety. This traditional theoretical approach is unsuitable for modelling
consumer demand for diversity as diverseness in consumption cannot alone be ascribed to price
changes. Consequently, Jackson, drawing on Maslow hierarchy of needs, proposed a
hierarchical model of consumer demand (model of hierarchy of purchase) by which income
effect could be expected on diversity. In Jackson conception, consumer behaviour is
characterised by the following: at low level of income, only a limited number of foods is
bought; and as income grows, the range of purchased foods expands. It is also presumed that
variety increases independently of consumer's level of income such that no food leaves the
consumption bundle set at any given time. These attributes lay the groundwork for the utility
maximisation problem. Assuming separability between food and non-food items, Jackson
conceptual approach to food consumption diversity began by specifying utility maximization
problem for food items 𝑐𝑖 as follows:
𝑉(𝑐)𝑖 = 𝑣(𝑐1, 𝑐2, 𝑐3, ………………. 𝑐𝑁); 𝑠. 𝑡. ∑ 𝑝𝑖𝑁𝑖=1 𝑐𝑖 = 𝑌 𝑎𝑛𝑑 𝑐𝑖 ≥ 0 (1)
where 𝑐𝑖 is the quantity of food item 𝑖 and; 𝑝𝑖 represents the price of 𝑖𝑡ℎ food commodity;
Y is the total food expenditure and N is the total number of food items. The Lagrangian function
(L) can be stated as:
𝐿 = 𝑣(𝑐1, 𝑐2, 𝑐3, ………………. 𝑐𝑁) + 𝝀(𝒀 − ∑ 𝑝𝑖𝑁𝑖=1 𝑐𝑖) (2)
where λ is the Lagrangian multiplier. Using the Karush-Kuhn-Tucker (KKT) conditions, L is
first maximized with respect to all the choice variables 𝑐𝑖, and the related KKT conditions are:
𝜕𝐿
𝜕𝑐𝑖=
𝜕𝑣
𝜕𝑐𝑖− 𝜆𝑝𝑖 ≤ 0 (3)
𝑐𝑖(𝜕𝑣
𝜕𝑐𝑖− 𝜆𝑝𝑖) = 0 (4)
and 𝑐𝑖 ≥ 0 (5)
Then L is minimized with respect to λ with the related KKT conditions stated as
(6)
(7)
and
λ ≥ 0 (8)
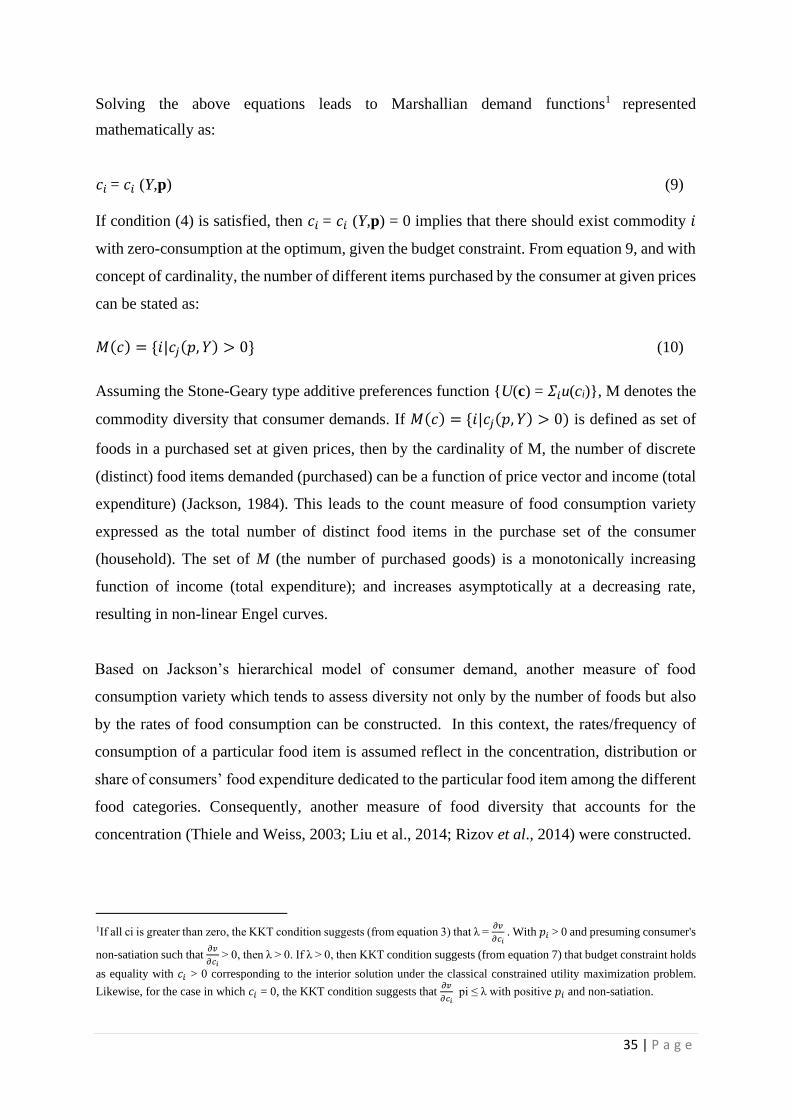
35 | P a g e
Solving the above equations leads to Marshallian demand functions1 represented
mathematically as:
𝑐𝑖 = 𝑐𝑖 (Y,p) (9)
If condition (4) is satisfied, then 𝑐𝑖 = 𝑐𝑖 (Y,p) = 0 implies that there should exist commodity 𝑖
with zero-consumption at the optimum, given the budget constraint. From equation 9, and with
concept of cardinality, the number of different items purchased by the consumer at given prices
can be stated as:
𝑀(𝑐) = {𝑖|𝑐𝑗(𝑝, 𝑌) > 0} (10)
Assuming the Stone-Geary type additive preferences function {U(c) = 𝛴𝑖u(ci)}, M denotes the
commodity diversity that consumer demands. If 𝑀(𝑐) = {𝑖|𝑐𝑗(𝑝, 𝑌) > 0) is defined as set of
foods in a purchased set at given prices, then by the cardinality of M, the number of discrete
(distinct) food items demanded (purchased) can be a function of price vector and income (total
expenditure) (Jackson, 1984). This leads to the count measure of food consumption variety
expressed as the total number of distinct food items in the purchase set of the consumer
(household). The set of M (the number of purchased goods) is a monotonically increasing
function of income (total expenditure); and increases asymptotically at a decreasing rate,
resulting in non-linear Engel curves.
Based on Jackson’s hierarchical model of consumer demand, another measure of food
consumption variety which tends to assess diversity not only by the number of foods but also
by the rates of food consumption can be constructed. In this context, the rates/frequency of
consumption of a particular food item is assumed reflect in the concentration, distribution or
share of consumers’ food expenditure dedicated to the particular food item among the different
food categories. Consequently, another measure of food diversity that accounts for the
concentration (Thiele and Weiss, 2003; Liu et al., 2014; Rizov et al., 2014) were constructed.
1If all ci is greater than zero, the KKT condition suggests (from equation 3) that λ =
𝜕𝑣
𝜕𝑐𝑖 . With 𝑝𝑖 > 0 and presuming consumer's
non-satiation such that 𝜕𝑣
𝜕𝑐𝑖 > 0, then λ > 0. If λ > 0, then KKT condition suggests (from equation 7) that budget constraint holds
as equality with 𝑐𝑖 > 0 corresponding to the interior solution under the classical constrained utility maximization problem.
Likewise, for the case in which 𝑐𝑖 = 0, the KKT condition suggests that 𝜕𝑣
𝜕𝑐𝑖 pi ≤ λ with positive 𝑝𝑖 and non-satiation.

36 | P a g e
The two mostly employed methods of such food diversity measures is Berry index and Entropy
index. The higher the values, the greater the degree of diversity in food consumption for the
two indices. If a household consumes a single food item or a classified food-group, the Berry
diversity index is zero and comes close to unity if the household spread food spending equally
among several foods (Liu et al., 2014). The Berry Index (BI) (Berry, 1971) for a given
household is specified as:
𝐵𝐼 = 1 − ∑ 𝑤𝑖2𝑁
𝑖=1 (11)
where 𝑤𝑖 is the expenditure share of food commodity 𝑖. 𝑤𝑖 = 𝑝𝑖𝑐𝑖
∑ 𝑝𝑖𝑐𝑖𝑁𝑖=1
and 𝑝𝑖𝑐𝑖 is the expenditure
on food commodity 𝑖 over the reference period. N is the total number of food items. Berry
index is equal to one less the Harfindahl index (∑ 𝑤𝑖2𝑁
𝑖=1 ). Likewise, the Relative Entropy Index
(𝑅𝐸𝐼𝑗)2 for each household is as stated as:
𝑅𝐸𝐼𝑗 = − ∑ 𝑤𝑖𝑗ln (𝑤𝑖𝑗
𝑁𝑖=1 )
ln (𝑁) (12)
The Relative Entropy index derives from the Entropy Index − ∑ 𝑤𝑖𝑗ln (𝑤𝑖𝑗𝑁𝑖=1 ) (Shannon,
1948).

37 | P a g e
3.0 Methodology
3.1 Data and Sources of Data
The data used for this study were extracted from two main sources. The first data set was the
household level panel data for 2012/2013 and 2015/2016 post-planting and post-harvest
agricultural seasons. The data were collected by the World Bank in collaboration with the
National Bureau of Statistics (NBS), Nigeria. The panel survey was targeted to cover a total of
4,481 households selected from rural and urban areas of the 36 states of the country. The data
covered different aspects of household livelihoods2. Included data are the socioeconomic
characteristics of the household and household head such as household size, age, sex, marital
status, education of household head, location (rural-urban), season (post-planting or post-
harvest seasons), whether or not a household engages in agriculture as main source of income,
quantity of different foods consumed by the households, quantity of food purchased, value of
each food purchased, and expenditure on specific non-food items, and safety nets (this include
cash transfers and free food distribution), land use systems, land security, soil characteristic,
cropping systems/land use pattern, farm level characteristics (like irrigation systems, land
preparation), input used (fertilizer, cost of seeds, labour), among others. Also, data on food
consumption and purchases (expenditures) were collected over a recall of period of 7 days,
expenditure data on some non-food items either were reported on weekly and monthly basis
(frequent non-food purchases), or over a period of 6 months or 1 year (non-frequent non-food
purchases). The value of each of the food consumed by a household was extrapolated from the
corresponding value of the food purchased3.
The second aspect of the data used include the retail price of some specific foods collected by
the NBS across the 36 states of the country, and in months and years corresponding to the
household panel survey. The food items included in the data are imported rice, local rice, maize,
sorghum, millet, beef (meat), fish, egg, yam, garri, beans, and palm oil. These specific food
items are very critical to household food security in the country as they constitute important
components of household diets. However, the study chose to consider the direct influence of
average price of some of the food groups (7 of them) considered the most commonly consumed
food groups among households, other than the food price index. In order to construct a measure
of dietary diversity, food items were grouped into twelve (12): cereals, root and tubers, milk
2More details about the dataset and information therein can be accessed via http://econ.worldbank.org/WBSITE/EXTERNAL/EXT DEC/EXTRESEARCH/EXTLSMS/0, contentMDK:23512353~pagePK:64168445~piPK:64168309~theSitePK: 335899700.html. 3 Extrapolation for the value of each food item consumed involved multiplying the value of food purchased by the quantity of food consumed and then dividing the product (outcome) by the quantity of food purchased.
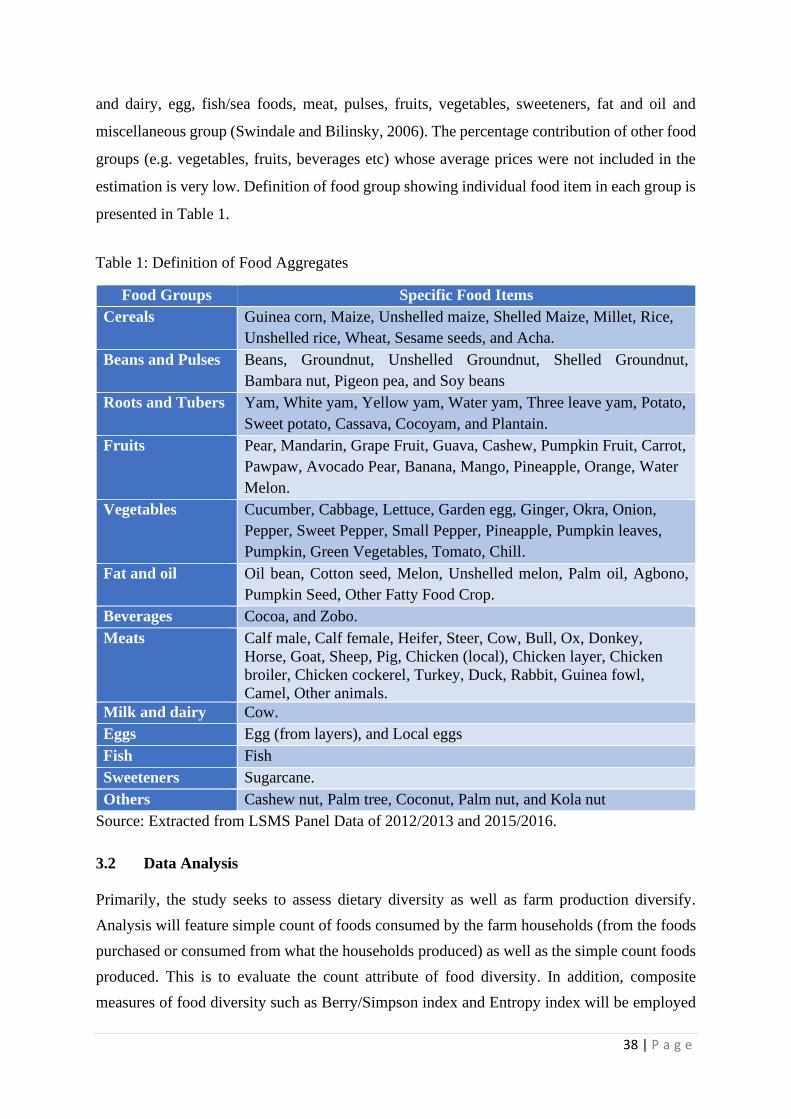
38 | P a g e
and dairy, egg, fish/sea foods, meat, pulses, fruits, vegetables, sweeteners, fat and oil and
miscellaneous group (Swindale and Bilinsky, 2006). The percentage contribution of other food
groups (e.g. vegetables, fruits, beverages etc) whose average prices were not included in the
estimation is very low. Definition of food group showing individual food item in each group is
presented in Table 1.
Table 1: Definition of Food Aggregates
Food Groups Specific Food Items
Cereals Guinea corn, Maize, Unshelled maize, Shelled Maize, Millet, Rice,
Unshelled rice, Wheat, Sesame seeds, and Acha.
Beans and Pulses Beans, Groundnut, Unshelled Groundnut, Shelled Groundnut,
Bambara nut, Pigeon pea, and Soy beans
Roots and Tubers Yam, White yam, Yellow yam, Water yam, Three leave yam, Potato,
Sweet potato, Cassava, Cocoyam, and Plantain.
Fruits Pear, Mandarin, Grape Fruit, Guava, Cashew, Pumpkin Fruit, Carrot,
Pawpaw, Avocado Pear, Banana, Mango, Pineapple, Orange, Water
Melon.
Vegetables Cucumber, Cabbage, Lettuce, Garden egg, Ginger, Okra, Onion,
Pepper, Sweet Pepper, Small Pepper, Pineapple, Pumpkin leaves,
Pumpkin, Green Vegetables, Tomato, Chill.
Fat and oil Oil bean, Cotton seed, Melon, Unshelled melon, Palm oil, Agbono,
Pumpkin Seed, Other Fatty Food Crop.
Beverages Cocoa, and Zobo.
Meats Calf male, Calf female, Heifer, Steer, Cow, Bull, Ox, Donkey,
Horse, Goat, Sheep, Pig, Chicken (local), Chicken layer, Chicken
broiler, Chicken cockerel, Turkey, Duck, Rabbit, Guinea fowl,
Camel, Other animals.
Milk and dairy Cow.
Eggs Egg (from layers), and Local eggs
Fish Fish
Sweeteners Sugarcane.
Others Cashew nut, Palm tree, Coconut, Palm nut, and Kola nut
Source: Extracted from LSMS Panel Data of 2012/2013 and 2015/2016.
3.2 Data Analysis
Primarily, the study seeks to assess dietary diversity as well as farm production diversify.
Analysis will feature simple count of foods consumed by the farm households (from the foods
purchased or consumed from what the households produced) as well as the simple count foods
produced. This is to evaluate the count attribute of food diversity. In addition, composite
measures of food diversity such as Berry/Simpson index and Entropy index will be employed
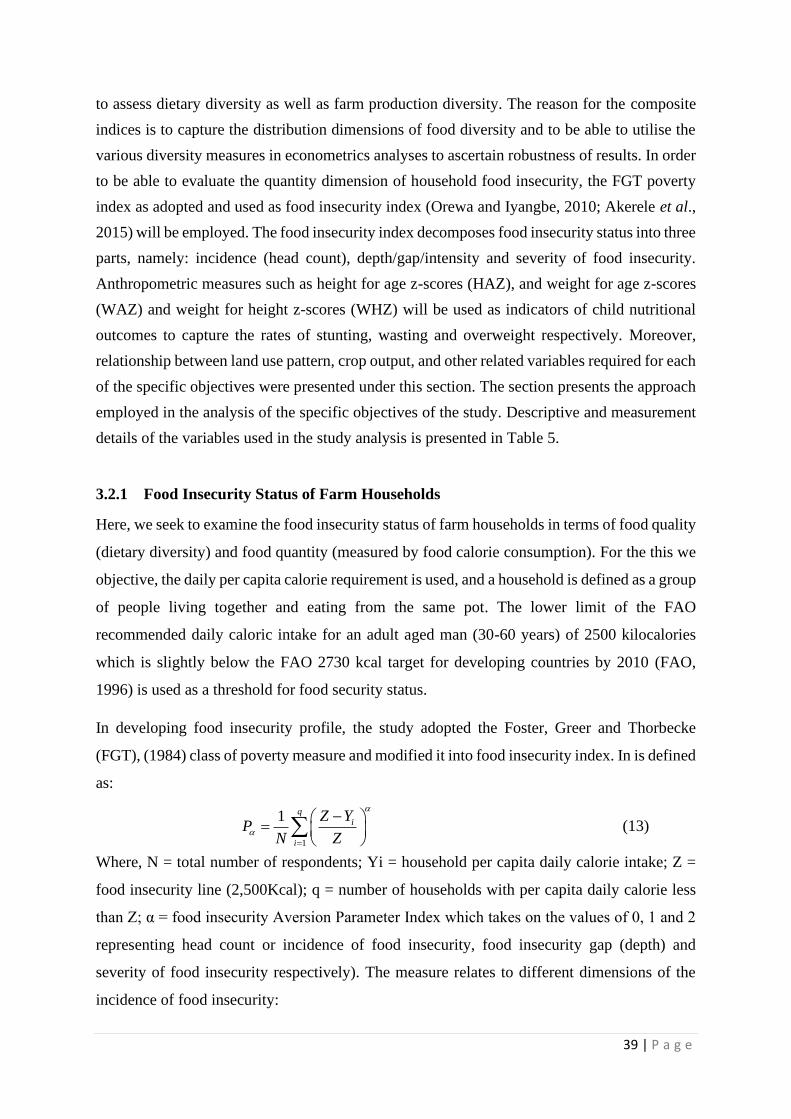
39 | P a g e
to assess dietary diversity as well as farm production diversity. The reason for the composite
indices is to capture the distribution dimensions of food diversity and to be able to utilise the
various diversity measures in econometrics analyses to ascertain robustness of results. In order
to be able to evaluate the quantity dimension of household food insecurity, the FGT poverty
index as adopted and used as food insecurity index (Orewa and Iyangbe, 2010; Akerele et al.,
2015) will be employed. The food insecurity index decomposes food insecurity status into three
parts, namely: incidence (head count), depth/gap/intensity and severity of food insecurity.
Anthropometric measures such as height for age z-scores (HAZ), and weight for age z-scores
(WAZ) and weight for height z-scores (WHZ) will be used as indicators of child nutritional
outcomes to capture the rates of stunting, wasting and overweight respectively. Moreover,
relationship between land use pattern, crop output, and other related variables required for each
of the specific objectives were presented under this section. The section presents the approach
employed in the analysis of the specific objectives of the study. Descriptive and measurement
details of the variables used in the study analysis is presented in Table 5.
3.2.1 Food Insecurity Status of Farm Households
Here, we seek to examine the food insecurity status of farm households in terms of food quality
(dietary diversity) and food quantity (measured by food calorie consumption). For the this we
objective, the daily per capita calorie requirement is used, and a household is defined as a group
of people living together and eating from the same pot. The lower limit of the FAO
recommended daily caloric intake for an adult aged man (30-60 years) of 2500 kilocalories
which is slightly below the FAO 2730 kcal target for developing countries by 2010 (FAO,
1996) is used as a threshold for food security status.
In developing food insecurity profile, the study adopted the Foster, Greer and Thorbecke
(FGT), (1984) class of poverty measure and modified it into food insecurity index. In is defined
as:
1
1 q
i
i
Z YP
N Z
=
− =
(13)
Where, N = total number of respondents; Yi = household per capita daily calorie intake; Z =
food insecurity line (2,500Kcal); q = number of households with per capita daily calorie less
than Z; α = food insecurity Aversion Parameter Index which takes on the values of 0, 1 and 2
representing head count or incidence of food insecurity, food insecurity gap (depth) and
severity of food insecurity respectively). The measure relates to different dimensions of the
incidence of food insecurity:

40 | P a g e
If α = 0, FGT is reduced toH
PN
= ,
which is the proportion of the population that falls below the food insecurity line. This is called
the head count or incidence of food insecurity. If α = 1, FGT becomes:
(14)
Which is the depth of food insecurity. It is the percentage of income required to bring everyone
below the food insecurity line up to the poverty line. If α = 2, FGT becomes:
2
1
1 q
i
i
Z YP
N Z
=
− =
(15)
Which is the severity of food insecurity. It is indicated by giving longer weight to the extremely
(core) food insecure. It is achieved by squaring the gap between their calories and the food
insecurity line to increase its weight in the overall food insecurity measure.
3.2.2 Dietary Diversity Measures and Model Specification
As earlier mentioned, the Berry index and Relative Entropy measure are used in evaluating the
degree of diversity in food consumption. The values of both Berry and relative Entropy index
range between zero and unity. The higher the value of the index, the greater the degree of
diversity in food consumption. If a household consumes a single food item or a classified food-
group, the Berry diversity index is zero and comes close to unity if the household's total food
spending is spread equally among several foods. Likewise, the Relative Entropy index yields a
score of zero if household consumes a single food item and becomes higher with greater levels
of food diversification. The Berry Index (𝐵𝐼𝑗) (Berry, 1971) for each household
is specified as:
𝐵𝐼𝑗 = 1 − ∑ 𝑤𝑖𝑗2
𝑁
𝑖=1
(16)
Where 𝑤𝑖𝑗 is the expenditure share of food commodity i consumed by household j. 𝑤𝑖𝑗 =
𝑇𝑖𝑗
∑ 𝑇𝑖𝑗𝑛𝑖=1
and 𝑇𝑖𝑗 is the amount on money (in Naira) spent on food commodity 𝑖 by household 𝑗
over the reference period. N is the total number of food items. For this study, N=133 if index
is constructed from individual foods or 13 if constructed from food-groups. The Relative
Entropy Index (𝑅𝐸𝐼𝑗)2 for each household is as stated as:
2
1
1 q
i
i
Z YP
N Z
=
− =

41 | P a g e
𝑅𝐸𝐼𝑗 = − ∑ 𝑤𝑖𝑗ln (𝑤𝑖𝑗
𝑁𝑖=1 )
ln (𝑁) (17)
The Relative Entropy index derives from the Entropy Index − ∑ 𝑤𝑖𝑗ln (𝑤𝑖𝑗𝑁𝑖=1 ) (Shannon,
1948). The Entropy Index has an undesirable feature in that it is undefined when there are zero
food expenditures. For this limitation, the index cannot be estimated directly. Rather, it is
computed by replacing the zero expenditures with discretionary (very small) expenditures.
However, if zero expenditures are replaced with very small arbitrary values, the Entropy Index
approaches its maximum value of ln(𝑁) (Bellù and Liberati, 2006). The maximum value ln(𝑁)
is therefore used as the denominator in the Relative Entropy Index formulation (equation 13)
to obtain an index whose value ranges between zero and 1. The ratio of the entropy of a source
to the maximum value it could have while still restricted to the same symbols will be called its
relative entropy (Shannon, 1948). Given that the values of the dietary diversity measures fall
within zero and unity, one may be doubtful of the normality assumption. In addition, one may
be interested in an estimator that ensures the predicted values for the measures (Berry and
Relative Entropy Index) are within the interval of zero and one. The study follows the
conventional logistic (logit model) transformation (Greene, 1997, p.227) of the Berry and
Relative Entropy as used by Thiele and Weiss (2003). Consequently, the transformed measures
(variable) become 𝑇𝐵𝐼𝑗 = ln (𝐵𝐼𝑗
1−𝐵𝐼𝑗) and 𝑅𝐸𝐼𝑗 = ln (
𝑅𝐸𝐼𝑗
1−𝑅𝐸𝐼𝑗) for Berry and Entropy measures
respectively. Where TBI is the transformed Berry Index and TREI is the transformed Relative
Entropy Index. TBI and TREI (for individual foods and on food-group basis) are used as
response variables in the econometric models employed, and the statistical test (independent
sample t-test3) of difference of means between the dietary diversity of some selected vulnerable
households and other household groups conducted in this study. Whether the between-
household variations in the degree of food consumption variety can be explained by some key
economic decision variables, household demographic characteristics and community/spatial
factors are analysed using a panel data logistic regression model was considered with the final
choice of fixed effects variants of the binary outcome models selected based on econometrics
Hausman and Likelihood ratio tests.
3.2.3 Econometrics Estimation Procedure for the Dietary Diversity
Food Count Index

42 | P a g e
For the simple food counts index of food consumption diversity, specification of empirical
(econometrics) model beings with a supposition that a count (outcome) variable 𝑦𝑗 is random
in a given time interval, having a Poisson distribution with probability density specified as:
𝑃(𝑦𝑗 = 𝑚𝑗) =𝑒𝑥𝑝𝜆𝑗𝜆𝑗
𝑚𝑗
𝑚𝑗 𝑚 = 1,2,3, … … … … . 𝑁 (14)
where 𝑚𝑗 is the realized value (outcome) of the random variable. In its empirical realization,
𝑦𝑗 represents the number of food groups consumed/purchased by household j out of N=12 food
groups. The list of food item included in each of the food groups is presented in Table 1.
Poisson model is a one-parameter distribution with mean and variance of 𝑦𝑗 equalling 𝜆𝑗. To
include a set of regressors (𝑋𝑗) into the analysis, and to fend-off negativity of mean 𝑦𝑗, the
parameter 𝑦𝑗 of the Poisson model is stated as:
𝐵𝐼𝑗 = 𝛼 + 𝛽1𝑋1𝑗 + 𝛽2𝑋2𝑗 … … . + 𝛽𝑘𝑋𝑘𝑗 + 𝜀𝑗 (16)
The standard error robust option was selected during model estimation to correct for possible
over-dispersion in the data (Cameron and Trivedi, 2010).
Berry Index and Entropy Index Measure
The BI was used as response variables in the econometrics (regression) models employed for
analysis. The dietary diversity model is specified for the Berry Index as:
𝑇𝐵𝐼𝑗𝑣 = 𝐸(𝑦𝑖|𝑋𝑖 = 𝜆𝑗 = exp(𝛼 + 𝛽1𝑋1𝑗 + 𝛽2𝑋2𝑗 + ⋯ + 𝛽𝑘𝛽𝑘𝑗) (17)
and for the transformed Relative Entropy Index as
𝑇𝑅𝐸𝐼𝑗𝑣 = 𝐸(𝑦𝑖|𝑋𝑖 = 𝜆𝑗 = exp(𝛼 + 𝛽1𝑋1𝑗 + 𝛽2𝑋2𝑗 + ⋯ + 𝛽𝑘𝛽𝑘𝑗) (18)
where α and β1 to βk are parameters to be estimated, 𝑋1 to 𝐾𝑘 are the explanatory variables while
𝜀𝑖 is the error term assumed to be normally distributed with zero mean and constant variance.
Similarly, the regression models were estimated using the fixed effects model while correcting
for potential heteroskedasticity using the robust standard error option in the STATA (14.2)
software that was used for the analysis. List and description of the dependent variables (food
count, berry index, and entropy index), and explanatory variables (farm production diversity:
crop diversification index, livestock diversification index, and crop-livestock diversification
index; socioeconomic characteristics, and food prices) in the (random effects and panel

43 | P a g e
Poisson) regression models are indicated in Table 2. Likewise, the detail approach to farm
production diversification index estimation: crop, livestock and crop-livestock diversification
indices is also presented as follows:
3.2.5 Farm Production Diversification Computation
The Harfindahl Index (HI) is employed to compute the crop diversification index (CDI), the
livestock diversification index (LDI) and the crop–livestock diversification index (CLDI).
These indices are obtained by subtracting the estimated HI from one. Accordingly, the indices
have direct relationships with diversification and make the interpretation of the empirical
results straightforward, such that a zero value indicates specialization and a value greater than
zero signifies some measure of diversification. For standardization, the revenues (which are
influenced by quantities produced, quantities sold, prices, the weather and transaction costs)
from each crop or livestock enterprise were used to compute the HI. To compute the HI, we
first calculate the revenue shares of the crops and/or livestock involved in the total crop and/or
livestock revenue for each sample farmer. The revenue share is expressed as:
𝑆𝑘 =𝑅𝑘
∑ 𝑅𝑘𝑛𝑘=1
(19)
where 𝑆𝑘 denotes the revenue share occupied by the kth crop or livestock in the total revenue
for a farm’s crops, the livestock and/or the crop–livestock enterprises, respectively; 𝑅𝑘 denotes
the revenue from the kth crop or livestock enterprise for a farmer; ∑ 𝑅𝑘𝑛𝑘=1 denotes the total
farm revenue for the crops, the livestock and/or the crop–livestock enterprises, respectively; k
= 1,2,…, n (number of enterprises involved in all farmers’ farming operations).
The Herfindahl index is specified as:
𝐻𝐼𝑘 = ∑ 𝑆𝑘2
𝑛
𝑘=1
(20)
The value ranges from zero to one. A value approaching 1.0 indicates specialization whereas
smaller values reflect increasing diversification, stability of income and sustainability of land
use pattern (Spio, 1996; Udoh, 2000). For a high level of diversification, the value of the HI is
likely to be small. For the special case of equal revenue shares among a total of n enterprises
for a sample farmer, the values of the revenue shares would be equal to 1/n and the value of

44 | P a g e
the HI would also be 1/n. The HI is computed for crops (𝐻𝐼𝐶), livestock (𝐻𝐼𝐿) and crop–
livestock (𝐻𝐼𝐶𝐿) farming systems. It follows that CDI, LDI and CLDI are then obtained as:
CDI = 1 – 𝐻𝐼𝐶; LDI = 1 – 𝐻𝐼𝐿; and CLDI = 1 – 𝐻𝐼𝐶𝐿.
The data consists of farmers who diversified farm production and those who did not. Farmers
are said to be diversified in crops, livestock and integrated crop–livestock farming systems
when they obtain a CDI, LDI and CLDI > 0.5, respectively. Hence, to examine the causal
relationship between agricultural production diversity and the dietary diversity (in terms of
quantity dimension of food security evaluated in terms food calorie adequacy, and dietary
diversity), panel data regression models expressed in equation 16 – 18 was considered with the
final choice of random effects variants, selected based on econometrics Hausman and
Likelihood ratio tests.
3.2.6 Analysis of the Land Use/Cropping Patterns among Farm Households
In order to examine how sustainable is the existing farm households' land use/cropping
behavioural practices, Soil Nutrient Intake Index employed by Udoh (2000) and Lawal et al.
(2009) was proposed to be used to assess the sustainability of land use/cropping patterns among
the farming households. However, the data did not provide information on crops that were
intercropped but rather provided information on the cropping systems adopted by the individual
farm household.
According to Udoh (2000), the Nutrient Intake Index (NII) was estimated to reflect how crop
diversity pattern can affect nutrient depletion and sustainability of farmland. In his work, he
measured NII as a ratio of crop configuration to number of crops in combination. He further
estimated the crop configuration which was derived by assigning different weights to different
classes of crop in combination and summing the weighted value for each farm and then dividing
the value by the number of crops in such combination. The assigned weights to the respective
classes were based on nutrient depletion ability of crops in an environment where nutrient
augmenting input like fertilizer is inadequate (Fageria and Baligar, 1993). It is expected that
the yield of crops in combination would be affected if the combined crops were mostly of the
same class of crops (Fageria and Baligar, 1993; Ali, 1996; Udoh, 2000). For instance, a
combination of melon/maize/yam would not deplete soil nutrient as the case of
cassava/yam/cocoyam mixture.

45 | P a g e
The index is expected to reflect how patterns of crop diversity can affect nutrient depletion and
sustainability of farmland. The higher the value of the Nutrient Intake Index, the higher the
probability that crop combinations can affect nutrient depletion, land degradation and
sustainability of farmland (Fageria and Baligar, 1993; Ali, 1996; Udoh, 2000; Lawal et al.,
2009). Nutrient intake index is meant to capture the vulnerability of farm total output to
different crop combination. The index value ranges between 1 and 4. The higher the NII the
more the likelihood that crop combinations can affect nutrient depletion, land degradation and
sustainability of farmland (Fageria and Baligar, 1993; Ali, 1996; Udoh, 2000).
However, the LSMS data only reports the type of cropping system engaged by individual
households across different crops. Although the data indicates the type of cropping system
employed but the crop combination in each system was not reported. Furthermore, it was
observed in the data, that the most households employ almost similar cropping system for all
the crop grown with exception in some cases. Hence, we capture land use intensity (a proxy to
nutrient intake intensity) based on each of the identified cropping system. The identified
cropping system was scored based on their agronomic history to soil nutrient consumption.
Table 3 show the summary of the classification and the attached weight based nutrient
consumption of the land use/cropping system. Since land use intensity (LUI) is also a function
of density of crop combination, a final measure of the land use intensity by the individual farm
household was determined as the product of the number crop in combination and the weight
assigned to each of the classified cropping system.
𝐿𝑈𝐼 = 𝐶𝑆 ∗ 𝑁 (21)
The weight of the cropping systems ranges from 1 to 4. This is in consonance with the NII
computed by index, but it does not reflect truly reflect the LUI of the individual farm plot.
Thus, multiplying the value by the number of crops in combination gives a true reflection of
the LUI. The higher the value, the more the likelihood that crop combinations can affect
nutrient depletion, land degradation and sustainability of farmland (Fageria and Baligar, 1993;
Ali, 1996; Udoh 2000). This approach enables us to capture land use intensity among farmers
particularly when only the data on number of crops combine is known but the specific crop in
combination is not known. Although, the situation is not likely to occur when a primary data
is involved. However, for multiple cropping like strip, mixed and intercropping, the Multiple
Cropping Index or Multiple Cropping Intensity (MCI) was used for their estimation. The MCI
was proposed by Dalrymple (1971). It is the ratio of total area cropped in a year to the land

46 | P a g e
area available for cultivation and expressed in percentage (sum of area planted to different
crops and harvested in a single year divided by total cultivated area times 100).
𝑀𝐶𝐼 =∑ 𝑎𝑖
𝑁𝑖=1
𝐴∗ 100 (22)
Where, n is total number of crops, 𝑎𝑖 is area occupied by ith crop and A is total land area
available for cultivation.
Table 2: Land Use Pattern/Cropping System Classification
Cropping System Weight Remarks/Rationale
Alley 1 Usually, alley cropping system revitalizes the soil
through conversion of tree litres into organic nutrient.
(Rana and Rana, 2011)
Monocropping 2 Monocropping poses less intensity on the soil. Usually,
it is less nutrient consuming (Fageria and Baligar, 1993)
Relay cropping 3 This is used to make up nutrient depletion rate. Hence, it
is generally nutrient consuming. (Rana & Rana, 2011)
Strip cropping, mixed,
and intercropping
4 Nutrient uptake is generally more in intercropping
system compared o other forms (Dalrymple, 1971)
3.2.7 Relationship Between Crop Output and Land Use/Copping Patterns
One of the specific objectives of the study is to examine, having controlled for other
confounding factors, the relationship between sustainable land use/cropping patterns and
aggregate crop output in rural Nigeria. The understanding here is to link farmers' land
use/cropping behavioural practices to food security in terms of sustainable food production. In
order to examine such relationship, crop outputs were first converted to the grain equivalent
metric (a composite index for the aggregate crop outputs). Grain or Cereals equivalent for crop
products as indicated by the FAO is presented on Table 3. The cereals (CE) was used as the
dependent variable while the nutrient intake index, and other farm level and socioeconomic
determinants were used as independent variables in a linear panel data econometrics analyses
with fixed effect model, selected as the final choice model for the estimation based on
econometrics tests such as Hausman, Lagrange Multiplier tests, among others. The empirical
model specification is presented as follows:
The 𝐺𝐸 was used as response variables in the econometrics (regression) models employed for
analysis. The final model structure specified for the estimation is as follows:

47 | P a g e
𝐺𝐸𝑗 = 𝐸(𝑦𝑖|𝑋𝑖 = 𝜆𝑗 = exp(𝛼 + 𝛽1𝑋1𝑗 + 𝛽2𝑋2𝑗 + ⋯ + 𝛽𝑘𝛽𝑘𝑗) (22)
where α and β1 to βk are parameters to be estimated, 𝑋1 to 𝐾𝑘 are the explanatory variables while
𝜀𝑖 is the error term assumed to be normally distributed with zero mean and constant variance.
The regression models were estimated using the fixed effects model while correcting for
potential heteroskedasticity using the robust standard error option in the STATA (14.2)
software that was used for the analysis. List and description of the dependent variables (farm
level characteristics, and the socioeconomic characteristics can be found in Table 4.
Table 3: Grain/Cereals Equivalent Conversion Factor for Crop Products
Crop products Food item C. Factor
Cereals Guinea corn, Maize, Unshelled maize, Shelled Maize,
Millet, Rice, Unshelled rice, Wheat, Sesame seeds, and
Acha.
1.00
Fruits Pear, Mandarin, Grape Fruit, Guava, Cashew, Pumpkin
Fruit, Carrot, Pawpaw, Avocado Pear, Banana, Mango,
Pineapple, Orange, Water Melon.
0.14
Pulses Beans, Groundnut, Unshelled Groundnut, Shelled
Groundnut, Bambara nut, Pigeon pea, and Soy beans
1.06
Starchy roots Yam, White yam, Yellow yam, Water yam, Three leave
yam, Potato, Sweet potato, Cassava, Cocoyam, and
Plantain.
0.25
Sugar, sweeteners Sugarcane 1.08
Tree nuts Cashew nut, Palm tree, Coconut, Palm nut, and Kola nut 0.77
Vegetable oils Oil bean, Cotton seed, Melon, Unshelled melon, Palm oil,
Agbono, Pumpkin Seed, Other vegetable oil foods.
2.72
Vegetables Cucumber, Cabbage, Lettuce, Garden egg, Ginger, Okra,
Onion, Pepper, Sweet Pepper, Small Pepper, Pineapple,
Pumpkin leaves, Pumpkin, Green Vegetables, Tomato,
Chill.
0.08
CE = Cereal equivalent /Grain equivalent. Extracted from Rask and Rask (2014).

48 | P a g e
Table 4: Definition and Descriptive Statistics of the Variable Used for Analysis (N = 10,719, Panel Group = 4,482)
Variables and Their Definition Mean Standard Deviation Minimum Maximum
Age of the Household head 51.19 15.96 0.00 112.0
Urban farm households dummy (1 if farm household lives in the urban area, 0 otherwise) 0.203 0.402 0.00 1.00
Households size reported by the household head (number of people eating from the same pot) 6.978 3.279 1.00 35.00
Gender of the household head (1 if female, 0 if male). 0.840 0.366 0.00 1.00
Marital status of the household head (1 if the household head is married) 0.604 0.489 0.00 1.00
Spouse living with the household head dummy (1 if household head is living with the spouse) 0.761 0.426 0.00 1.00
Household head that attained higher Degree (MSc/PhD) (1 if yes, 0 otherwise) 0.007 0.860 0.00 1.00
Household head that attained a full Degree (HND/BSc) (1 if yes, 0 otherwise) 0.015 0.125 0.00 1.00
Household head that attained OND/NCE dummy (1 if yes, 0 otherwise) 0.194 0.138 0.00 1.00
Household head that attained Secondary school education dummy (1 if yes, 0 otherwise) 0.090 0.286 0.00 1.00
Household head that attained Primary school education, dummy (1 if yes, 0 otherwise) 0.117 0.321 0.00 1.00
Natural log of average price of cereals 4.914 0.158 4.41 5.67
Natural log of average price of roots and tubers 5.446 0.184 5.02 6.52
Natural log of average price of pulses 5.677 0.122 5.26 6.00
Natural log of average price of fat and oil 5.090 0.143 4.92 5.27
Natural log of average price of vegetable 5.840 0.851 4.83 6.08
Natural log of average price of egg 5.644 0.735 3.91 6.97
Natural log of average price of beef 7.310 0.221 5.75 8.87
Natural log of average price of other food group 5.076 0.129 4.92 5.24
Crop diversification Index 0.850 0.356 2e-07 1.00
Animal diversification Index 0.606 0.488 2e-07 1.00
Harvest season/surplus season, Dummy (1 if yes, 0 otherwise) 0.507 0.499 0.00 1.00
Soil slope dummy (1 if the soil slope is flat, 0 otherwise) 0.121 0.326 0.00 1.00
Farmers’ perception of soil quality (1 if the said the soil is good, 0 otherwise) 0.126 0.332 0.00 1.00
Land ownership status dummy (1 if the land is owned by the farm household, 0 otherwise) 0.367 0.482 0.00 1.00
Land use pattern dummy (1 if the farmer practice alley cropping, 0 otherwise) 2.383 4.789 0.00 32.00
Irrigation dummy (1 if the farm is irrigated, 0 otherwise) 0.005 0.073 0.00 1.00
Tractor used dummy (1 if the farmer used tractor for land preparation, 0 otherwise) 0.003 0.57 0.00 1.00
Value of fertilizer used during production (Naira) 18.89 417.24 0.00 15,000
Amount spent on hired labour (Naira) 16,381 772,370 0.00 6e+07
Farm size (area of the farm plot measured with GPS). The unit was measured in square meter 133.80 3228.95 0 301,800
Source: Computed from the LSMS Panel Data

49 | P a g e
3.2.8 Analytical Procedure for Land Use/Cropping Pattern and Land Tenure Security
The last specific objective of the study is to examine the influence of land tenure security,
socioeconomic factors and farmers' perception about climate change on sustainable land
use/cropping patterns. Again, a linear panel data econometrics model will be employed with
Hausman, Lagrange Multiplier tests performed to select between fixed and random effects
model. To achieve this objective, the nutrient intake index (which a proxy measure of
sustainable land use patterns) will be used as dependent variable while land tenure security,
other variables will be included as regressors. Likewise, a seasonal dummy (1 for post-harvest,
0 for planting) will be introduced as part of the covariates for explaining the nutritional
outcome.
𝐿𝑈𝐼𝑗 = 𝐸(𝑦𝑖|𝑋𝑖 = 𝜆𝑗 = exp(𝛼 + 𝛽1𝑋1𝑗 + 𝛽2𝑋2𝑗 + ⋯ + 𝛽𝑘𝛽𝑘𝑗) (23)
3.3 Pros and Cons of the Outcome Variables
On food security, dietary diversity/quality and nutrition: the outcome variables for this study
are calories consumption which is used as a proxy for the food quantity dimension of household
food insecurity. The advantage of using this method is that it can be a conservative measure of
acute food insecurity especially among poor households. Since food insecurity is counted
through (by counting) food calories. It does not account for the quality of household diets.
Hence, measure of food diversity/quality is needed to appraise the quality dimension of food
security. This necessitate measurement of dietary diversity. Both calories and food
consumption diversity measure are unable to address the aspect of chronic food insecurity. To
capture this, anthropometric measures such as the HAZ, WAZ and other anthropometric
measure are required. The limitation of the outcome variables on food security and nutrition
are that they may not be able to fully account for the food stability dimensions of food security.
On land uses pattern/sustainability: although the Land Use Intensity maybe used to assess the
sustainability of land use/cropping patterns among the farming households, however, it only
reflects how patterns of crop diversity can potentially affect nutrient depletion and
sustainability of farmland. It cannot better ascertain the level of soil nutrient
capability/depletion compared to a situation involving soil nutrient test.
50 | P a g e
Results and Discussions
Results of the factors influencing dietary diversity (food count) among households are
presented in Table 5. The results indicate a positive relationship between the measures of farm
diversity and that of dietary diversity. This implies farm households’ who have a higher
diversity index in crop and animal productions have a better chance of having a diverse diet.
This is due to the subsistence nature of these farming households who produce different crops
or animals; they end up consuming a greater part of it within the household. This finding is in
line with that reported by Akerele and Shittu (2017) and Dillion et al. (2015) in Nigeria.
Similarly, other findings outside the Nigeria such as Kopmair et al. (2016), Sibhatu et al.
(2015) and Jones et al. (2014). This therefore could mean that encouraging farming households
to diversify into different crop and animal production could help in improving their nutrient
intake.
Urban households were also found to consume more diverse foods than rural households. This
finding agrees to what Akerele and Odeniyi (2015) reported in Nigeria. This can be explained
in terms of the advantage that urban households enjoy in terms of access to larger markets
where they can easily get all their food needs and also the fact that urban farming households
are closer to larger urban markets where they can easily sell their farm produce thereby
enhancing their income earning ability. Although increase in household size may raise
consumption of more varied foods in the households, it has a depressing effect on the relative
abundance (distribution) of the various food varieties. This shows that farming households may
have the required number of food groups in their daily consumption but the relative
contribution of each of the food group to the total diet may be low. This has noted by Powell
et al. (2017) and kumar et al. (2017) may be due to challenges farming households may face
in getting enough of a particular food due to low income therefore they are forced to take only
what they can afford from each food group or resort to low quality diet.
Similar findings hold for the gender of household head as male headed household have a better
chance of eating diverse food groups however its relative abundance favour their female
counterpart. This underscores the role women play in household food distribution and therefore
they tend to allocate more of their income to food consumption within the household compared
to a household headed by a male. This supports the findings of Ochieng et al. (2017) in Malawi
in terms of food count but contradicts the findings of Akerele and Odeniyi (2015) who reported
a negative relationship for both food count and relative abundance. Household heads who are
married were found to consume less food groups when compared to those that were not

51 | P a g e
married. However, the case was different for the relative abundance of the various food groups
consumed. This is not surprising as the addition of an extra person for a married household
would affect the household food decision making thereby influencing the component of the
household diet.
Furthermore, age of the household head played a significant role in the relative abundance of
the various food groups consumed though it did not affect the number food group in household
diet. The findings indicate a positive marginal effect implies that increase in age will have
positive effect on the diversity of the farming household diet. This increase in relative
abundance could be a result of changes in the food consumption need of the household as a
result of growth. This result is consistent with the findings of Dillion et al. (2015) who also
reported a positive relationship between dietary diversity and age of the household head.
Primary school education has an increasing effect on dietary diversity while for other
educational level above primary school except for polytechnic education, positive influence
was also reported in terms of the number of food groups consumed but no significance was
reported for the relative abundance. This means that an educated household head with the
exception of polytechnic education attainment is more likely to have a diverse diet when
compared to an uneducated household. This can be explained based on the role education plays
in enlightenment and as noted by Codjoe et al. (2016), it enhances the knowledge of farmers
on the importance of balanced of diet. Akerele and Odeniyi (2015) reported similar findings of
this study however with only primary and secondary education significantly affecting dietary
diversity and also Koppmair et al. (2015) and Ochieng et al. (2017) in a study carried out in
Malawi and Tanzania, respectively.
Furthermore, food prices of some food commodities were found to affect the dietary diversity
as it was observed that as the prices of tuber, pulses, beef and fat and oil increased the number
of food groups consumed increased and its relative abundance except for that of fat and oil
which was not significance for relative abundance. This actually looks awkward, but this may
be that as food price increases for the aforementioned commodities, households shift their food
consumption to a cheaper food alternative within the same food group. This shift according to
Akerele and Shittu (2017) and Rashid et al. (2011) could lead to households consuming less
nutritious food and this may have a long-term effect on the productivity of the farming
household.

52 | P a g e
This was however not the case for the prices of vegetable, cereals, egg and other food item as
it was observed that increase in the price of this food commodities have negative influence on
the dietary diversity of the farming household while the price of other food item only affected
the food count, the price of cereals only had a depressing effect on the relative abundance. The
reason for this can be that as prices of these commodities go up households tend to look for
cheaper alternative outside the food group thereby making their diet less diverse. Rashid et al.
(2011) however argued that these food commodities exert a negative influence because of their
relative importance in household diet therefore household would rather drop other food
commodity in other to maintain the consumption of this food commodity as the price increases.

53 | P a g e
Table 5: Panel Poisson and Linear Regression of the Farm Households Dietary Diversity in Nigeria.
Dependent Variable Food -group Count TBEI TREI
Independent Variable list Coefficient R.S.E. z-value Coefficient R.S.E. z-value Coefficient R.S.E. z-value
Crop diversity index 0.029*** 0.008 3.32 0.064*** 0.006 10.44
Animal diversity index 0.065*** 0.006 11.02 0.041*** 0.004 10.93
Season (1 if planted in dry season) 0.022 0.032 0.69 -3.5e-05 0.020 -0.00
Urban farm household (1 if yes) 0.098*** 0.006 15.35 0.069*** 0.004 16.62
Household Size 0.002** 7.8e-04 2.36 -0.002*** 5.3e-04 -4.25
Gender of the HH head 0.049*** 0.007 -6.40 -0.021*** 0.005 -4.37
Marital Status of the Household head -0.025*** 0.006 4.40 0.009*** 0.004 2.58
Age of the Household head 2.38e-03 1.5e-04 1.57 2.0e-04** 9.4e-05 2.14
Higher degree dummy 0.072*** 0.025 2.91 0.014 0.016 0.89
Full degree dummy 0.030* 0.018 1.67 0.018 0.011 1.63
Polytechnic education dummy 0.019 0.017 1.06 -0.001 0.010 -0.13
Secondary education dummy 0.017* 0.009 1.88 -0.003 0.006 -0.58
Primary education dummy 0.055*** 0.008 7.16 0.010* 0.006 1.93
Log of average price of cereals -0.027 0.016 -1.64 -0.25** 0.005 -2.43
Log of average price of tuber 0.263*** 0.014 18.14 0.076*** 0.010 6.44
Log of average price of pulses 0.091*** 0.025 3.67 0.075*** 0.012 4.78
Log of average price of fat and oil 5.976*** 0.969 6.16 -0.867 0.016 -1.36
Log of average price of vegetable -0.328*** 0.029 -11.17 -0.228*** 0.638 -10.75
Log of average price of egg -0.366*** 0.003 -9.95 -0.020*** 0.021 -7.92
Log of average price of beef 0.109*** 0.011 9.59 0.057*** 0.002 7.01
Log of average price of other food item -6.649*** 1.084 -6.13 0.786 0.008 1.11
Income 7.52e-09 2.8e-08 0.27 5.9e-09 0.711 0.35
Constant 4.739*** 0.546 8.67 1.275*** 1.6e-08 3.51
Log pseudolikelihood -22778.50
Wald chi2 (22) 592746.70 1323.78
F-value 0.000 0.000
R-square 0.133
TBEI = Transformed Berry Index, TREI = Transformed Relative Entropy Index. ***, **, * indicates significance level at 1%, 5%, and 10% respectively.

54 | P a g e
Assessment of the existing farm households' land use/cropping behavioural practices.
Table 6 shows the distribution of various land use pattern among farm households in Nigeria.
The distribution revealed that most households (21.02%) engage in multiple cropping system
like mixed, strip and intercropping. Although the data did not reveal any information about the
time of planting within the year but rather provides a list crop grown by individual farm
households. Thus, it is difficult to ascertain the intensity of land us. However, according FAO
(2018), most farm households in Nigeria engage in multiple cropping being a smallholder
farmer. This is because farmers own 0.5 hectares of land on average, predominantly managing
mixed crop-livestock systems, including also fish farming. The practice indicates unstainable
land use, especially with the traditional farming systems (slash and burn) which has contributed
adversely to unhealthy soil for farming. Although, some farm households recorded sustainable
practice like alley cropping but the percentage was very low. The overall indication of the land
use pattern among farm households is low productivity, declining soil nutrient and poor income
which consequently result in food insecurity.
Table 6: Results of the Land Use/Cropping Pattern among Farm Households in Nigeria
Group Cropping pattern Frequency Percentage Land Use Index
0 No response 7,520 70.16 ****
1 Alley cropping 17 0.16
2 Monocropping 894 8.34
3 Relay cropping 35 0.33
4 Mixed, strip, and intercropping 2253 21.02
Mean = , n =10,719. **** has no estimated figure since no cropping system was identified
4.2 Farm output, Land Use Pattern, Socioeconomic and Farm Level Characteristics of
Farm Households in Nigeria.
Table 7 presents the result of the analysis of the relationship between farm output, land use
pattern, socioeconomic characteristics and farm level characteristics. The result shows that the
use of tractor is significant and negatively affects farm output among the farming households.
Although tractor use have been noted to enhance agricultural production (Amadi and Ekezie,
2016; Lamidi and Akande, 2013; Musa et al. 2012), this contrary finding may be due to the
fact that farmers who use tractors are able to clear large expanse of land for production however
credit to effectively crop this area may not be available as most of them prepare in anticipation
of the getting credit and when it is available, the management skills to manage such large
expanse of cultivated land may be lacking which may lead to losses or reduction in output. The
coefficient of farm size was also found to have a depressing effect on farm output. It therefore

55 | P a g e
means that households with larger farm size are not likely to contribute more to farm output
this according to Oseni et al., 2014 may be because of improper management which may lead
to underutilisation of this farmlands for crop cultivation. This same direction of relationship
was reported by Bello et al. (2016), Oseni et al. (2014) and Adesoji and Farinde (2006) in
Nigeria and Carletto et al. (2011) in Uganda.
Similarly, the pattern of land use by the household was also found to negatively influence farm
output. This implies that the system of land use adopted by the household is not sustainable in
maintaining the nutrient retaining ability of the soil thereby leading to decrease in the farm
output. This may be caused by increasing demand for land due to urbanisation and other
economic activities which has led to farming households being constrained in their use of land
thereby cultivating same continuously with the attendant effect being nutrient depletion from
the soil without time for replenishment (Bamire, 2010; Ogundare, 2016). An increase in
household size was also found to reduce farm output. This result agrees with the findings of
Osanyilusi and Adenegan (2016); Akinola and Adeyemo (2013) and Obasi et al., (2013) and
could be due to the presence of children and old members within the household who may not
be able to contribute to farming activities.
Similar findings hold for farming household heads that were living together with their spouse.
The negative influence of the presence of spouse in the household on farm output could be
because of the presence of an additional person in the individual which might cause the
household head to devote part of the time to be spent on the farm with the spouse. This finding
agrees with that of Ayoola et al. (2011) however, it contradicts the findings of Ojiako et al.
(2017) who reported a positive relationship. Farm output was also found to be significantly
better in the harvest season when compared with the planting season. This is not farfetched as
farm output tends to be more in the postharvest season when compared to the planting season
when they could have sold most of their harvest or even consumed it.
The role of education in determining farm output was significant as it was observed that
farming household heads with educational attainment at secondary and polytechnic level have
a better chance of having better farm output when accessed with those who had no education.
This finding is in line with that of Anyanwu (2013) and Onogwu et al. (2016) who also noted
that increase in education will increase farm output. However, it didn’t favour those with full
degree as they were likely to have lesser farm output as also confirmed by Anibogu et al., 2015
who noted a negative relationship as education increases. This could be because household
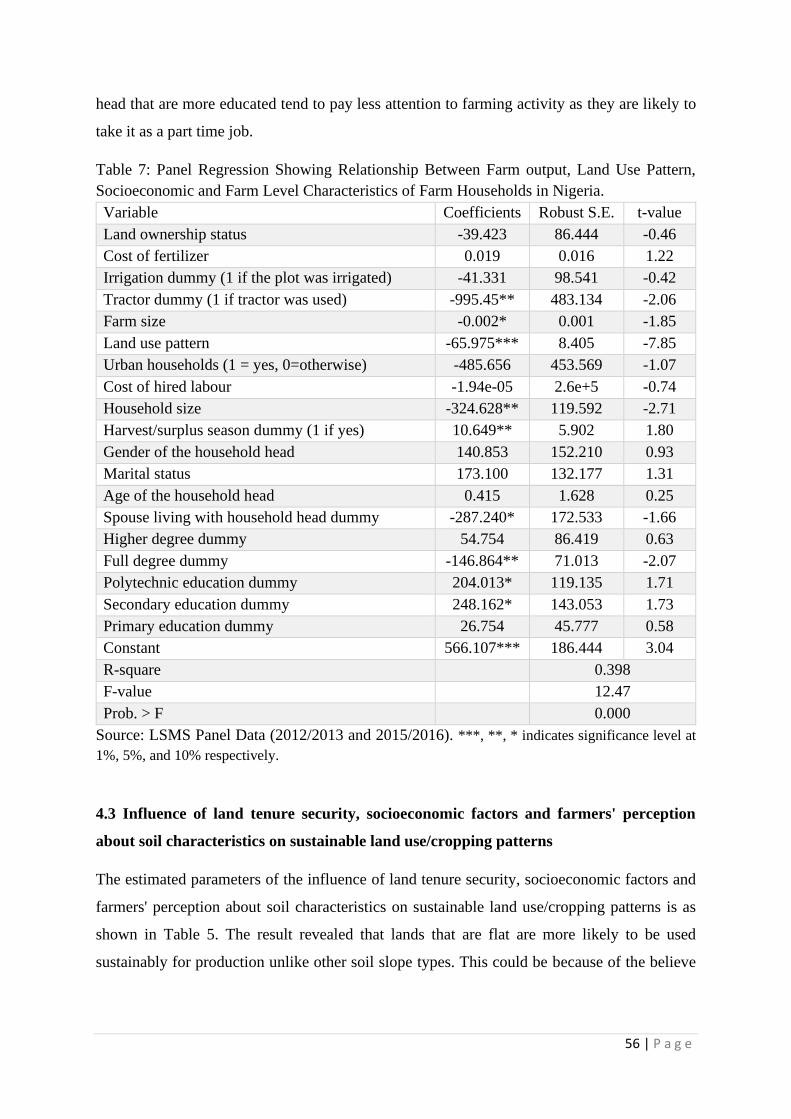
56 | P a g e
head that are more educated tend to pay less attention to farming activity as they are likely to
take it as a part time job.
Table 7: Panel Regression Showing Relationship Between Farm output, Land Use Pattern,
Socioeconomic and Farm Level Characteristics of Farm Households in Nigeria.
Variable Coefficients Robust S.E. t-value
Land ownership status -39.423 86.444 -0.46
Cost of fertilizer 0.019 0.016 1.22
Irrigation dummy (1 if the plot was irrigated) -41.331 98.541 -0.42
Tractor dummy (1 if tractor was used) -995.45** 483.134 -2.06
Farm size -0.002* 0.001 -1.85
Land use pattern -65.975*** 8.405 -7.85
Urban households (1 = yes, 0=otherwise) -485.656 453.569 -1.07
Cost of hired labour -1.94e-05 2.6e+5 -0.74
Household size -324.628** 119.592 -2.71
Harvest/surplus season dummy (1 if yes) 10.649** 5.902 1.80
Gender of the household head 140.853 152.210 0.93
Marital status 173.100 132.177 1.31
Age of the household head 0.415 1.628 0.25
Spouse living with household head dummy -287.240* 172.533 -1.66
Higher degree dummy 54.754 86.419 0.63
Full degree dummy -146.864** 71.013 -2.07
Polytechnic education dummy 204.013* 119.135 1.71
Secondary education dummy 248.162* 143.053 1.73
Primary education dummy 26.754 45.777 0.58
Constant 566.107*** 186.444 3.04
R-square 0.398
F-value 12.47
Prob. > F 0.000
Source: LSMS Panel Data (2012/2013 and 2015/2016). ***, **, * indicates significance level at
1%, 5%, and 10% respectively.
4.3 Influence of land tenure security, socioeconomic factors and farmers' perception
about soil characteristics on sustainable land use/cropping patterns
The estimated parameters of the influence of land tenure security, socioeconomic factors and
farmers' perception about soil characteristics on sustainable land use/cropping patterns is as
shown in Table 5. The result revealed that lands that are flat are more likely to be used
sustainably for production unlike other soil slope types. This could be because of the believe

57 | P a g e
that the steeper the slope of a land the higher the risk of a land being predisposed to soil erosion
and loss of soil nutrient (Teshome, 2014).
The coefficient of land ownership was positive and significant among the factors affecting
sustainable land use pattern. This shows that farming household tend to use lands belonging to
them more sustainable for production when viewed in relation to land rented, leased or gotten
through other means. The temporary nature of other land ownership structure could be the
reason for the non-sustainable use of the land by the farmers. This according to Adamu (2014)
limits their use of the land as they may not be able to introduce permanents crops which can
serve as shade and help in soil fertility. The effect being that farming households keep moving
from one farmland to the other when their current farm land can no longer sustain their
production (Oyekale, 2012a).
Farmers were found to engage in more sustainable land practices in the planting season when
compared to the postharvest season. This might be because of the importance of planting
operations on farm output therefore farming households pay more attention on practices that
ensure sustainability during this period when compared to the postharvest season when they
might have harvested their crop. Furthermore, the age of the household head was observed to
improve the sustainable use of land for agricultural production. This could be because the
experience of the household head in farming operations tends to increase with age thereby
making them better positioned in sustainable use of land because of the trainings they might
have received, and knowledge gained over time. This is in agreement with the findings of
Nwaiwu et al. (2013) in Nigeria.
It was further reported that household head with full degree were less likely to make use of
land sustainably for agricultural production. This is contrary to the finding of Oyekale (2012b)
who reported a positive relationship and quite surprising because of the role education plays in
informing and enhancing knowledge the knowledge of the farmers. However, this trend may
be because educated household heads are likely to specialise in specific crops which are
believed to be more profitable and therefore pay less attention to cropping patterns such as
mixed cropping, crop rotation which could enhance the sustainable use of the land.
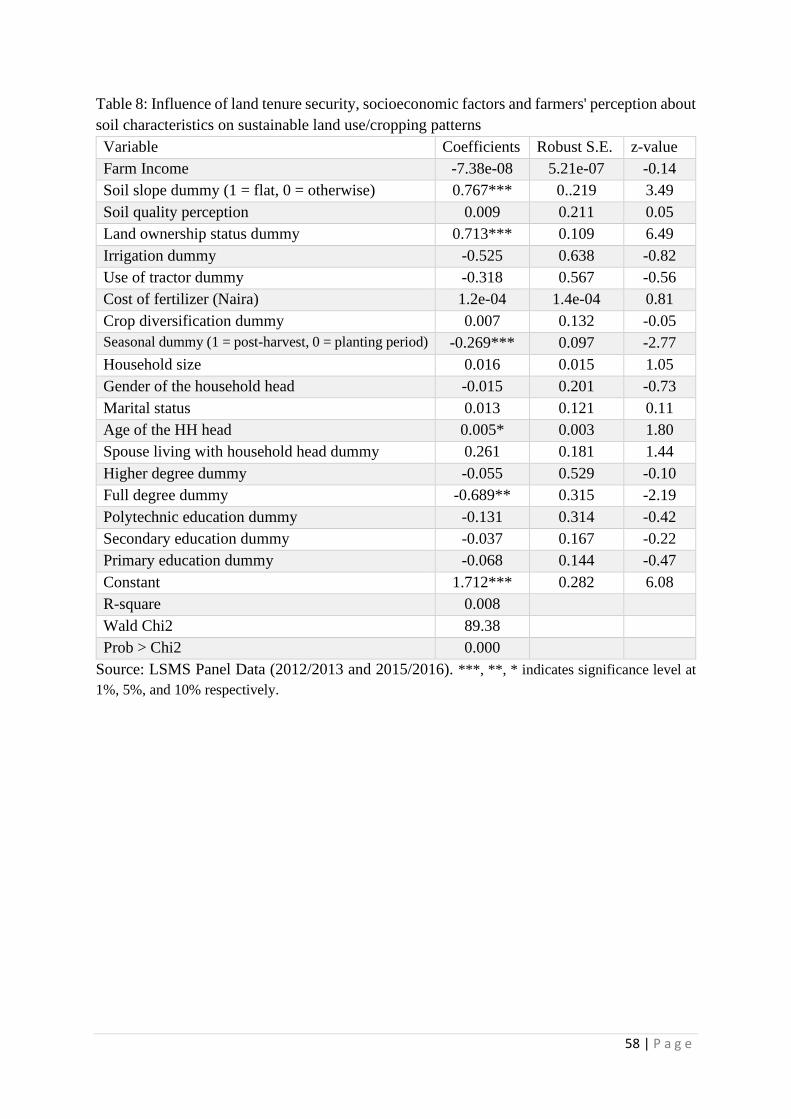
58 | P a g e
Table 8: Influence of land tenure security, socioeconomic factors and farmers' perception about
soil characteristics on sustainable land use/cropping patterns
Variable Coefficients Robust S.E. z-value
Farm Income -7.38e-08 5.21e-07 -0.14
Soil slope dummy (1 = flat, 0 = otherwise) 0.767*** 0..219 3.49
Soil quality perception 0.009 0.211 0.05
Land ownership status dummy 0.713*** 0.109 6.49
Irrigation dummy -0.525 0.638 -0.82
Use of tractor dummy -0.318 0.567 -0.56
Cost of fertilizer (Naira) 1.2e-04 1.4e-04 0.81
Crop diversification dummy 0.007 0.132 -0.05
Seasonal dummy (1 = post-harvest, 0 = planting period) -0.269*** 0.097 -2.77
Household size 0.016 0.015 1.05
Gender of the household head -0.015 0.201 -0.73
Marital status 0.013 0.121 0.11
Age of the HH head 0.005* 0.003 1.80
Spouse living with household head dummy 0.261 0.181 1.44
Higher degree dummy -0.055 0.529 -0.10
Full degree dummy -0.689** 0.315 -2.19
Polytechnic education dummy -0.131 0.314 -0.42
Secondary education dummy -0.037 0.167 -0.22
Primary education dummy -0.068 0.144 -0.47
Constant 1.712*** 0.282 6.08
R-square 0.008
Wald Chi2 89.38
Prob > Chi2 0.000
Source: LSMS Panel Data (2012/2013 and 2015/2016). ***, **, * indicates significance level at
1%, 5%, and 10% respectively.

59 | P a g e
References
Abro, A.A. 2012. Determinants of crop diversification towards high value crops in Pakistan.
International Journal of Business Management & Economic Research 3:536–545.
Agyemang-Bonsu,W.,Kojo,W.,Minia,Z.,Dontwi,J.,Dontwi,I. K., Buabeng, S.N., Baffoe-
Bonnie, B., Agyemang-Yeboah, F., Buabeng, S.N., Ofori, E., Gyasi, E.A., Karikari, O., Dugan,
E., Nelson, W., Naa Debei Agbey, A., Sagoe, R., Damptey, P., Tutuah Mensah, A., Anim-
Kwapong, G.J., and Frimpong, E.B. (eds.) 2008. Ghana Climate Change Impacts, Vulnerability
and Adaptation Assessments. Environmental Protection Agency, Accra.
Akerele, D., Momoh, S., Aromolaran, A. B., Oguntona, C. R. B. and Shittu, A. M. (2013).
Food Insecurity and Coping Strategies in South-West Nigeria. Food Security.5; 407–414.
Published by Springer, Netherlands.
Akerele, D. (2015). Household Food Expenditure Patterns, Food Nutrient Consumption and
Nutritional Vulnerability in Nigeria: Implications for Policy. Ecology of Food and Nutrition.54
(5); 546-571.
Akerele, D, Shittu, A.M., Ogunmola, O. O., Adekanmbi, A. A, Adekunle, C. P. (2017). Poverty
transition in rural Nigeria: Do household idiosyncratic, farm and geo-spatial factors influence
movers and stayers? Trop. Agric. (Trinidad) 94 (2): 185-199
Ali M (1996): “Quantifying the Socio-Economic Determinants of Sustainable Crop Production
an Application to Wheat Cultivation in the Tarui of Nepal” Agric. Econ. 14: 45 – 60
Aneani, F., Anchirinah, V., Owusu-Ansah, F., and Asamoah, M. 2011. An analysis of the
extent and determinants of crop diversification by cocoa (Theobroma cacao) farmers in Ghana.
African Journal of Agricultural Research 6:4277– 4287.
Arimond, M. and Ruel, M. (2004). Dietary diversity is associated with child nutritional status:
Evidence from 11 demographic and health surveys 2004., J. Nutr. 134: 2579-2585.
Arimond M, et al. (2010) Simple food group diversity indicators predict micronutrient
adequacy of women’s diets in 5 diverse, resource-poor settings. J Nutr 140(11): 2059–2069.
Ashfaq, M., Hassan, S., Naseer, M.Z., Baig, I.A., and Asma, J. 2008. Factors affecting farm
diversification in rice–wheat. Pakistan Journal of Agricultural Science 45:91–94.
Bain, L. E., Awah, P. K., Geraldine, N., Kindong, N. P., Sigal, Y., Bernard, N., Tanjeko, A. T.
(2013). Malnutrition in Sub – Saharan Africa: burden, causes and prospects, Pan African
Medical Journal.15: 120. doi:10.11604/pamj.2013.15.120.2535
Bellù, L. G. and Liberati, P. (2006). Describing income inequality Theil index and entropy
class indexes, Agricultural Policy Support Service, Policy Assistance Division, FAO.
Available at: www.fao.org/tc/easypol.
Benin, S., Smale, M., Pender, J., Gebremedhin, B., and Ehui, S. 2004. The economic
determinants of cereal crop diversity on farms in the Ethiopian highlands. Agricultural
Economics 31:197–208.

60 | P a g e
Berry, C. H. (1971). Corporate growth and diversification, Journal of Law and Economics 14:
371-383.
Birthal, P.S., Joshi, P.K., Roy, D., and Thorat, A. 2007. Diversification in Indian Agriculture
towards High-Value Crops: The Role of Smallholders. IFPRI Discussion Paper 00727.
Burlingame B, Dernini S, eds (2012) Sustainable Diets and Biodiversity: Directions and
Solutions for Policy, Research and Action (Food and Agriculture Organization and
Biodiversity International, Rome).
Cameron, A. C. and Trivedi, P. K. (2010). Micro-econometrics using STATA. Revised Edition,
Stata Press, United State of America.
Caviglia‐Harris, J.L. and Sills, E.O. 2005. Land use and income diversification: Comparing
traditional and colonist populations in the Brazilian Amazon. Agricultural Economics 32: 221–
237.
Chand, R. 1996. Diversification through high value crops in western Himalayan region:
Evidence from Himachal Pradesh. Indian Journal of Agricultural Economics 41:652– 663.
Chaplin, H. 2000. Agricultural diversification: a review of methodological approaches and
empirical evidence. Available at Web site: http://www.ilr.uni-bonn.de/agpo/rsrch/Idara/Farm/
wyewp2.doc (verified 22 January 2013).
Chavas, J.P. and Di Falco, S. 2012. On the role of risk versus economies of scope in farm
diversification with an application to Ethiopian farms. Journal of Agricultural Economics
63:25–55.
De, U.K. and Chattopadhyay, M. 2010. Crop diversification by poor peasants and role of
infrastructure: Evidence from West Bengal. Journal of Development and Agricultural
Economics 2:340–350.
Deckelbaum RJ, Palm C, Mutuo P, DeClerck F (2006) Eco nutrition: Implementation models
from the Millennium Villages Project in Africa. Food Nutr. Bull 27(4):335–342.
Devendra, C. and Ibrahim, M. 2004. Silvopastoral systems as a strategy for diversification and
productivity enhancement from livestock in the tropics. The importance of silvopastoral
systems in rural livelihoods to provide ecosystem services. Second international symposium of
silvopastoral systems. Universidad Autónoma de Yucatán, Mérida, 8–22.
Dubé L, Pingali P, Webb P (2012) Paths of convergence for agriculture, health, and wealth.
Proc Natl Acad Sci USA 109(31):12294–12301.
Dzanku, F.M. and Sarpong, D. 2010. Agricultural diversification, food self-sufficiency and
food security in Ghana–the role of infrastructure and institutions. In G. Djurfeldt, E. Aryeetey,
and A.C. Isinika (ed.). African Smallholders: Food Crops, Markets and Policy. CAB
International, Wallingford, UK, 189–213.
Ellis, F. 1998. Household strategies and rural livelihood diversification. The Journal of
Development Studies 35:1–38.

61 | P a g e
Ellis-Jones, J., Larbi, A., Hoeschle-zeledon, I., Dugje, I., Teli,I., Buah, S., Kanton, R.,
Kombiok, M., Kamara, A., and Gyamfi, I. 2012. Sustainable intensification of cereal-based
farming systems in Ghana’s Guinea savanna: constraints and opportunities identified with local
communities. IITA report. International Institute for Tropical Agriculture, Ibadan, Nigeria.
Estache, A. 2003. On Latin America’s infrastructure privatization and its distributional effects.
Available at Web site at SSRN: http://ssrn.com/abstract=411942 or http://dx.doi.org/
10.2139/ssrn.411942
Fageria N.K., Baligar V.C. (1993). Growth and Mineral Nutrition of Field Crops. Chectarerles
Allen Jones Publication, London. 208p.
Fanzo J, Hunter D, Borelli T, Mattei F, eds (2013) Diversifying Food and Diets: Using
Agricultural Diversity to Improve Nutrition and Health (Routledge, London).
FAO (2003). Trade Reforms and Food Security – conceptualizing the linkages, Food and
Agriculture Organization of the United Nations, Rome, 2013.
Food and Agriculture Organization (FAO). 2010. An international consultation on integrated
crop-livestock systems for development: The way forward for sustainable production
intensification. Integrated Crop Management 13:1–63.
FAO (2011). Guidelines for measuring household and individual dietary diversity, Food and
Agriculture Organization (FAO) of the United Nations, Rome, Italy.
FAO (2015). The State of Food Insecurity in the World. Meeting the 2015 international hunger
targets: taking stock of uneven progress. http://www.fao.org/3/a-i4646e.pdf
FAO, IFAD, WFP (2015) The State of Food Insecurity in the World 2015 (Food and
Agriculture Organization of the United Nations, Rome)
Fausat, A.F. 2012. Income diversification determinants among farming households in
Konduga, Borno state, Nigeria. Academic Research International 2:555–561.
Frison EA, Smith IF, Johns T, Cherfas J, Eyzaguirre PB (2006) Agricultural biodiversity,
nutrition, and health: Making a difference to hunger and nutrition in the developing world.
Food Nutr Bull 27(2):167–179.
Godfray HCJ, et al. (2010) Food security: The challenge of feeding 9 billion people. Science
327(5967):812–818
Govereh, J. and Jayne, T.S. 2003. Cash cropping and food crop productivity: Synergies or
trade‐offs? Agricultural Economics 28:39–50.
Greene, W. H. (1997). Econometric Analysis, 3rd Edition, Prentice Hall, Englewood Cliffs,
NJ.
Griebenow, G. and Kishore, S. 2009. Mainstreaming environment and climate change in the
implementation of poverty reduction strategies. Environment Department, Paper No. 119. The
World Bank, Washington, DC.

62 | P a g e
Guvele, C. 2001. Gains from crop diversification in the Sudan Gezira scheme. Agricultural
Systems 70:319–333.
Herrero, M., González-Estrada, E., Thornton, P.K., Quiros, C., Waithaka, M.M., Ruiz, R., and
Hoogenboom, G. 2007. IMPACT: Generic household-level databases and diagnostics tools for
integrated crop-livestock systems analysis. Agricultural Systems 92:240–265.
Herrero, M., Thornton, P.K., Notenbaert, A.M., Wood, S., Msangi, S., Freeman, H.A., Bossio,
D., Dixon, J., Peters, M., and Van De Steeg, J. 2010. Smart investments in sustainable food
production: Revisiting mixed crop-livestock systems. Science 327:822–825.
Ibrahim, H., Rahman, S., Envulus, E., and Oyewole, S. 2009. Income and crop diversification
among farming households in a rural area of north central Nigeria. Agro-Science: Journal of
Tropical Agriculture, Food, Environment and Extension 8:84–89.
IFPRI (2014) Global Nutrition Report 2014: Actions and Accountability to Accelerate the
World’s Progress on Nutrition (International Food Policy Research Institute, Washington, DC).
Iiyama, M., Maitima, J., and Kariuki, P. 2007. Crop-livestock diversification patterns in
relation to income and manure use: A case study from a Rift Valley community, Kenya. African
Journal of Agricultural Research 2:058–066.
Jackson, L. F. (1984). Hierarchic demand and the engel curve for variety, The Review of
Economics and Statistics 66(1984): 8-15.
Jackson, L. F. (1984). Hierarchic demand and the engel curve for variety, The Review of
Economics and Statistics 66(1984): 8-15.
Johnston, G., Vaupel, S., Kegel, F., and Cadet, M. 1995. Crop and farm diversification provide
social benefits. California Agriculture 49:10–16.
Jones, A. D., Shrinivas, A. and Bezner-Kerr, R. (2014). Farm production diversity is associated
with greater household dietary diversity in Malawi: Findings from nationally representative
data, Food Policy 46(2014): 1-12.
Joshi, P.K., Gulati, A., and Cummings, R.W. (eds). 2007. Agricultural Diversification and
Smallholders in South Asia. Academic Foundation, New Delhi, India.
Joshi, P.K., Gulati, A., Birthal, P.S., and Tewari, L. 2004. Agriculture diversification in South
Asia: Patterns, determinants and policy implications. Economic and Political Weekly 39:2457–
2467.
Joshi, P.K., Gulati, A., Birthal, P.S., and Tewari, L. 2004. Agriculture diversification in South
Asia: Patterns, determinants and policy implications. Economic and Political Weekly 39:2457–
2467.
Joshi, P.K., Joshi, L., and Birthal, P.S. 2006. Diversification and its impact on smallholders:
Evidence from a study on vegetable production. Agricultural Economics Research Review
19:219–236.
Kankwamba, H., Mapila, M., and Pauw, K. 2012. Determinants and spatio-temporal
dimensions of crop diversification in Malawi. Project Report produced under a co-financed
research agreement between Irish Aid, USAID and IFPRI, Paper.

63 | P a g e
Kelley, T., Ryan, J., and Patel, B. 1995. Applied participatory priority setting in international
agricultural research: Making trade-offs transparent and explicit. Agricultural Systems 49:177–
216.
Khoury CK, et al. (2014) Increasing homogeneity in global food supplies and the implications
for food security. Proc Natl Acad Sci USA 111(11):4001–4006.
Kim, K., Chavas, J.P., Barham, B., and Foltz, J. 2012. Specialization, diversification, and
productivity: A panel data analysis of rice farms in Korea. Agricultural Economics 43:687–
700.
Knudsen, M.H.2007. Making a living in the cocoa frontier, Western Ghana: Diversifying
incomes in a cocoa economy. Geografisk Tidsskrift – Danish Journal of Geography 107:29–
44.
Lancaster, K. (1990). The economics of product variety: A survey, Marketing Science 9(3):
189-206.
Lawal AF (2001). “Socio-Economic Effects of Flood Disaster on the Riparian Communities
Around Jebba and Shiroro Dams in Niger State, Nigeria”. Paper Presented at the 19th Annual
Conference of Agricultural Society of Nigeria. Badeggi
Lay, J. and Schüler, D. 2008. Income Diversification and Poverty in a Growing Agricultural
Economy: The Case of Ghana. 39th German Development Economics Conference, Zürich.
Lay, J. and Schüler, D. 2008. Income Diversification and Poverty in a Growing Agricultural
Economy: The Case of Ghana. 39th German Development Economics Conference, Zürich.
Lim SS, et al. (2012) A comparative risk assessment of burden of disease and injury attributable
to 67 risk factors and risk factor clusters in 21 regions, 1990-2010: A systematic analysis for
the Global Burden of Disease Study 2010. Lancet 380(9859):2224–2260
Lin, T.-F. and Schmidt, P. 1984. A test of the Tobit specification against an alternative
suggested by Cragg. The Review of Economics and Statistics 66:174–177.
Little, P.D., Smith, K., Cellarius, B.A., Coppock, D.L., and Barrett, C. 2001. Avoiding disaster:
Diversification and risk management among East African herders. Development and Change
32:401–433.
Liu, J., Shively, G. E. and Binkley, J. K. (2014). Access to variety contributes to dietary
diversity in china, Food Policy 49(2014): 323-331.
Mainik, G. and Rüschendorf, L. 2010. On optimal portfolio diversification with respect to
extreme risks. Finance and Stochastics 14:593–623.
Mallard, S.R., Houghton, L.A., Filteau, S., Mullen, A., Nieuwelink, J., Chisenga, M., Siame,
J. and Gibson, R.S. (2014). Dietary diversity at 6 months of age is associated with subsequent
growth and mediates the effect of maternal education on infant growth in urban Zambia.
Journal of Nutrition 144 (11): 1818-1825.

64 | P a g e
Mekhora, T. and Fleming, E. 2004. An analysis of scope economies and specialisation
efficiencies among Thai shrimp and rice smallholders. Working paper series, Graduate School
of Agricultural and Resource Economics, University of New England.
Mesfin, W., Fufa, B., and Haji, J. 2011. Pattern, trend and determinants of crop diversification:
Empirical evidence from smallholders in Eastern Ethiopia. Journal of Economics and
Sustainable Development 2:78–89
Ndamani, F. and Watanabe, T. 2015. Influences of rainfall on crop production and suggestions
for adaptation. International Journal of Agricultural Sciences 5:367–374.
Nnakwe N. and Oyemaobi G. (2013). Prevalence of Food Insecurity and Inadequate Dietary
Pattern among Households with and without Children in Imo State Nigeria. International
Journal of Sociology and Anthropology. Vol. 5(9), pp 402 – 408, December, 201.3
Ogundari, K. 2013. Crop diversification and technical efficiency in food crop production: A
study of peasant farmers in Nigeria. International Journal of Social Economics 40: 267–287.
Ogundari, K. 2013. Crop diversification and technical efficiency in food crop production: A
study of peasant farmers in Nigeria. International Journal of Social Economics 40: 267–287.
Olutayo I.B. (2009) Poverty and Income Diversification among Household in Rural Nigeria;
A Gender Analysis of Livelihood Pattern. Conference page No 41 of 2nd Institute de Estudos
Socias Economics (IESE) Conference on Dynamics of Poverty and Patterns of Economic
Accumulation in Mozambique at Maputo, Mozambique 22-23 April,2009.
Orewa, S. I. and Iyangbe, C. (2010). The struggle against hunger: the victims and the food
security strategies adopted in adverse conditions, World Journal of Agricultural
Sciences 6(6): 740–745
Pandey, V. and Sharma, K. 1996. Crop diversification and self-sufficiency in food grains.
Indian Journal of Agricultural Economics 51:644–651.
Petit, M. and Barghouti, S. 1992. Diversification: Challenges and opportunities. World Bank
Technical Paper 1:0253–7494.
Pingali, P. (2007). Westernization of Asian diets and the transformation of food systems:
implications for research and policy, Food Policy 32(3): 281-298.
Pinstrup-Andersen, P. (2009). Food security: definition and measurement, Food security 1(1):
5-7.
Popkin BM, Slining MM (2013) New dynamics in global obesity facing low- and middle-
income countries. Obes Rev 14(Suppl 2):11–20.
Rahm, M.R. and Huffman, W.E. 1984. The adoption of reduced tillage: The role of human
capital and other variables. American Journal of Agricultural Economics 66:405–413.
Rahman, S. 2008. Determinants of crop choices by Bangladeshi farmers: A bivariate probit
analysis. Asian Journal of Agriculture and Development 5:30–14.
Rahman, S. 2008. Determinants of crop choices by Bangladeshi farmers: A bivariate probit
analysis. Asian Journal of Agriculture and Development 5:30–14.

65 | P a g e
Rana S S and M C Rana. 2011. Cropping System. Department of Agronomy, College of
Agriculture, CSK Himachal Pradesh Krishi Vishvavidyalaya, Palampur, 80 pages.
Rizov, M., Cupak, A. and Pokrivcak, J. (2014). Demand for the food diversity in Central and
Eastern European Countries: an evidence from Slovakia,
http://econpapers.repec.org/paper/agsaiea14/172978.htm.
Ruel, M. T. (2002). Is dietary diversity an indicator of food security or dietary quality? A
review of measurement issues and research needs, Food Consumption and Nutrition Discussion
Paper No. 140.
Ryan, J.G. and Spencer, D. 2001. Future Challenges and Opportunities for Agricultural R&D
in the Semi-Arid Tropics. International Crops Research Institute for the Semi-Arid Tropics,
Patancheru, India.
Senadza, B. 2012. Non‐farm income diversification in rural Ghana: Patterns and determinants.
African Development Review 24:233–244.
Shannon, C. E. (1948). A mathematical theory of communication in, The Bell System
Technical Journal 27: 379-423, 623-656.
Shezongo, M. 2005. Women’s property rights in Zambia. The Strategic Litigation Workshop.
Johannesburg, South Africa. www.cohre.org/womenlitigation/zambia.doc.
Sibhatu, K.T., Krishna V.V., Qaim, M. (2015). Farm Production Diversity and Dietary
Diversity in Developing Countries. Pnas Journal 112(34): 10657 – 10662
www.pnas.org/lookup/suppl/doi:10. 1073/pnas.1510982112/-/DC Supplemental
Sichoongwe, K., Mapemba, L., Ng’ong’ola, D., and Tembo, G. 2014. The Determinants and
Extent of Crop Diversification among Smallholder Farmers: A Case Study of Southern
Province, Zambia. IFPRI Working Paper International Food Policy Research Institute,
Washington, DC.
Smith, D.R., Gordon, A., Meadows, K., and Zwick, K. 2001. Livelihood diversification in
Uganda: Patterns and determinants of change across two rural districts. Food Policy 26:421–
435.
Spio K.C. (1996). “Inter-Cropping-the Hidden Revolution: A Solution to Land Scarcity and Household
Food Security” In Conference Issue: Paper presented at the 3rd Annual Conference of the Agricultural
Economic Association of South Africa, Agrekon 35(4): 266 – 270.
Swindale A. and Bilinsky, P (2006). Household Dietary Diversity Score (HDDS) for
Measurement of Household Food Access: Indicator Guide.
Tasie, C., Offor, U., and Wilcox, G. 2012. Determinants of off-farm income diversification in
Rivers state, Nigeria. Wudpecker Journal of Agricultural Research 1:331–334.
Thiele, S. and Weiss, C. (2003). Consumer demand for food diversity: evidence for Germany,
Food Policy 28(2003): 99-115.
Udoh E.J. (2000). “Land Management and Resource Use Efficiency among Farmers in South
Eastern Nigeria: Ph.D Thesis Dept. of Agricultural Economics, University of Ibadan, Nigeria

66 | P a g e
Van den Berg, M.M., Hengsdijk, H., Wolf, J., Van Ittersum, M. K., Guanghuo, W., and Roetter,
R.P. 2007. The impact of increasing farm size and mechanization on rural income and rice
production in Zhejiang province, China. Agricultural Systems 94:841–850.
Vyas, V. 2006. Diversification in agriculture: Concept, rationale and approaches. In N.A.
Mujumdar and U. Kapila (eds). Indian Agriculture in the New Millennium: Changing
Perceptions and Development Policy Vol. 2. Academic Foundation, New Delhi, p. 245–256.
Weiss, C.R. and Briglauer, W. (2000). Determinants and dynamics of farm diversification. FE
Working paper 0002/Universität Kiel, Department of Food Economics and Consumption
Studies.
Wu, S. and Prato, T. 2006. Cost efficiency and scope economies of crop and livestock farms in
Missouri. Journal of Agriculture and Applied Economics 38:539–553.
Yan, J., Wu, Y., Zhang, Y., and Zhou, S. 2010. Livelihood diversification of farmers and
nomads of eastern transect in Tibetan Plateau. Journal of Geographical Sciences 20:757– 770.
UNICELF (2015) Levels and trends in child malnutrition UNICEF – WHO – World Bank
Group joint child malnutrition estimates. Key findings of the 2015 edition. Available at
http://www.unicef.org/media/files /JME_2015_edition_Sept_2015.pdf
UNICEF (2012) Integrated Social Protection systems: Enhancing equity for children. UNICEF
Social Protection Strategic Framework
UN/WFP (2007). World Hunger Series2007: Hunger and health. The United Nation World
Food Programme. Published by Earthscan in the UK and USA in 2007. WFP ISBN: 987 92
920