Embed Size (px)
Citation preview
Vol. 9 | No. 4 |556 - 565 | October - December | 2016
ISSN: 0974-1496 | e-ISSN: 0976-0083 | CODEN: RJCABP
http://www.rasayanjournal.com
http://www.rasayanjournal.co.in
Fe3O4 NANOPARTICLES J.Sivasri et al.
INFLUENCE OF Fe3O4 NANOPARTICLES DISPERSED IN
LIQUID CRYSTALLINE COMPOUNDS: SPECTROSCOPIC
CHARACTERIZATION
J.Sivasri1, M.C.Rao2, G.Giridhar3, B.T.P.Madhav4, T.E.Divakar5
and R. K.N.R. Manepalli1* 1Department of Physics, The Hindu College, Krishna University, Machilipatnam-521001, India
2Department of Physics, Andhra Loyola College, Vijayawada-520008, India 3Department of Nanotechnology, Acharya Nagarjuna University, Guntur-522510, India
4LCRC-R&D, Department of ECE, K. L. University, Guntur-522502, India 5Department of Chemistry, Noble College, Machilipatnam-521001, India
*E-mail: [email protected]
ABSTRACT The synthesis is carried on liquid crystalline (LC)p-decyloxy benzoic acid (10OBA) and p-undecyloxy benzoic acid
(11OBA) with 0.5wt % and1wt% for Fe3O4 nanoparticles dispersion. The prepared samples are characterized by
different spectroscopic techniques like X-ray diffraction (XRD), Scanning Electron Microscopy (SEM), Fourier
Transform Infra Red (FTIR) and Differential Scanning Calorimetry (DSC). Textural determinations of the
synthesized compounds are recorded by using Polarizing Optical Microscope (POM) attached with a hot stage and
camera. The results show that the dispersion of Fe3O4 nanoparticles in 10OBA and 11OBA exhibits NC phases as
same as the pure 10OBA and 11OBA with reduced clearing temperature as expected. Further, the nematic thermal
range is increased in both 10OBA and 11OBA with Fe3O4 nanoparticles dispersion.
Keywords: Synthesis, POM, DSC, Nano-dispersion, XRD, FTIR and SEM. © RASĀYAN. All rights reserved
INTRODUCTION Liquid crystals are self-assembled functional soft materials which possess both order and mobility at
molecular, supra-molecular and macroscopic levels1-3. Liquid crystals are attractive materials, since they
show unique properties, such as long-range order, cooperative effects and an anisotropic nature in optical
and electronic properties, based on a self-organizing nature in a certain temperature range with fluidity4.
Owing to the possible synergetic relationship with nanomaterials, liquid crystals can play a very
significant role in nanoscience and nanotechnology. Nanoparticles can be utilized to regulate and organize
liquid crystal molecules in a systematic manner to achieve different phase manner under optimum
environmental conditions. Nanoscale particles do not induce significant distortion in LC phases.
Therefore, different nanomaterials are dispersed and studied in LC media to enhance the physical
properties of LCs5. Moreover, alignment and self-assembly of nanomaterials themselves can be achieved
in LC phases6. The key point for all the possible applications is the alignment of liquid crystal molecules
(i.e. the director) on the substrate7,8.
LCs act as tunable solvents for the dispersion of nanomaterials and LCs being anisotropic media, they
provide a very good support for the self-assembly of nanomaterials in to large organized structures in
multiple dimensions. Hence LC mediated self-assembly can be efficiently used to organize different kinds
of nanomaterials in to soft and well defined functional super structures. Nano-objects (guests) that are
embedded in the liquid crystals (hosts) can trap ions, which decrease the ion concentration and electrical
conductivity and improve the electro-optical response of the host9.
The variation in optical texture, electro-optic and dielectric properties of iron oxide nanoparticles
embedded ferroelectric liquid crystal with respect to change in temperature and electrical bias conditions.
Vol. 9 | No. 4 |556 - 565 | October - December | 2016
557 Fe3O4 NANOPARTICLES J.Sivasri et al
Incorporation of iron oxide nanoparticles makes it easier to get better profile of display
parameters10.Fe3O4 nanoparticles inspire researcher's new researchable ideas; this is due to its
characteristics, which has a great significance in various fields. Fe3O4 nanoparticles have attracted much
interest not only in the field of magnetic recording media such as audio and videotape and high-density
digital recording disks, magnetic fluids, data storage, but also in the areas of medical care such as drug
delivery systems (DDS), medical applications, including radiofrequency hyperthermia, photomagnetics
and magnetic resonance imaging (MRI), medical diagnostics and cancer therapy and microwave devices,
magneto-optics devices, sensors, high frequency applications, catalysis and magnetic sensing11-21.In the
present work, we reported the dispersion of Fe3O4 nanoparticles into LCs and analyzed by using SEM and
XRD. Furthermore, the influence of nanoparticles has affected the thermal ranges of LCs which was
analyzed by POM and DSC.
EXPERIMENTAL LC compounds such as 10OBA and 11OBA and Fe3O4 nanoparticles are brought from Sigma-Aldrich
laboratories, USA and used as such. For uniform dispersion of nanoparticles in 10OBA and 11OBA, the
nanoparticles are first dissolved in ethyl alcohol, stirred well about 45 minutes and later introduced in the
isotropic state of mesogenic material (10OBA/11OBA) in the ratio of 0.5wt% and 1 wt% concentration
separately. After cooling, the nanocomposite 10OBA and 11OBA22 is subjected to study of the textural
and phase transition temperatures using a polarizing optical microscope (SDTECHS make) with a hot
stage in which the substance was filled in planar arrangement in 4 µm cells and these could be placed
along with the thermometer described by Gray23. Textural and phase transition temperatures are studied
after preparation of the sample and observations are made again to understand the stability of Fe3O4
nanoparticles. A DSC (Perkin Elmer Diamond DSC) is used to obtain the transition temperatures and the
enthalpy values.BRUKER-ALPHA FTIR spectrometer is used for the present study. The presence of
Fe3O4 nanoparticles in 10OBA and 11OBA are studied by SEM data and existence as well as grain size is
determined by XRD technique.
RESULTS AND DISCUSSION Phase transition temperatures and phase sequence of the compounds has been presented by POM and
confirmed by DSC. The existence of dispersed nanoparticles and their size determined by FTIR, XRD
and SEM techniques.
Polarizing Microscope Studies
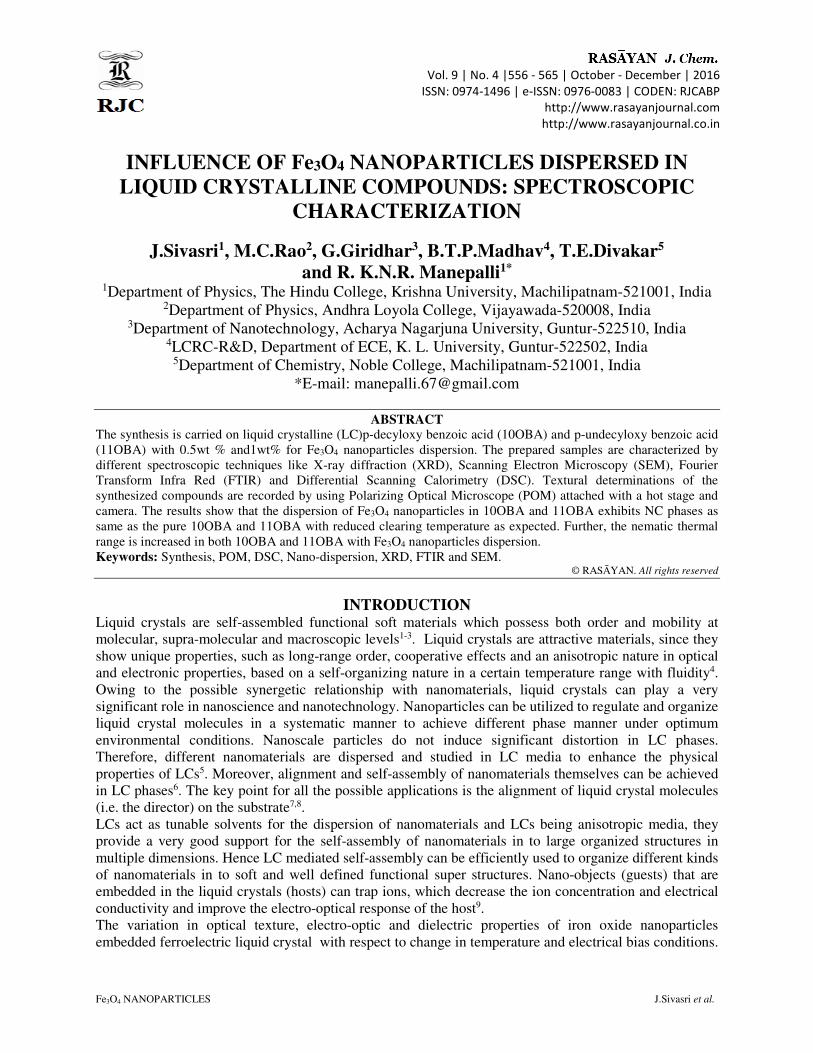
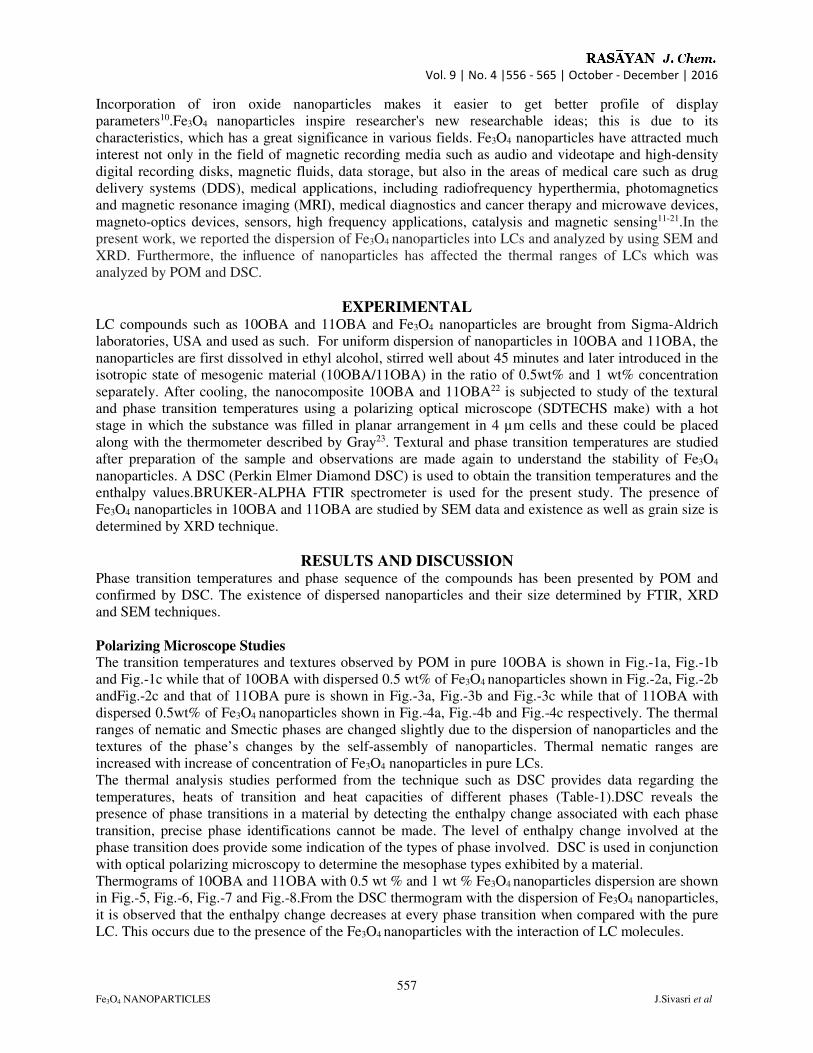
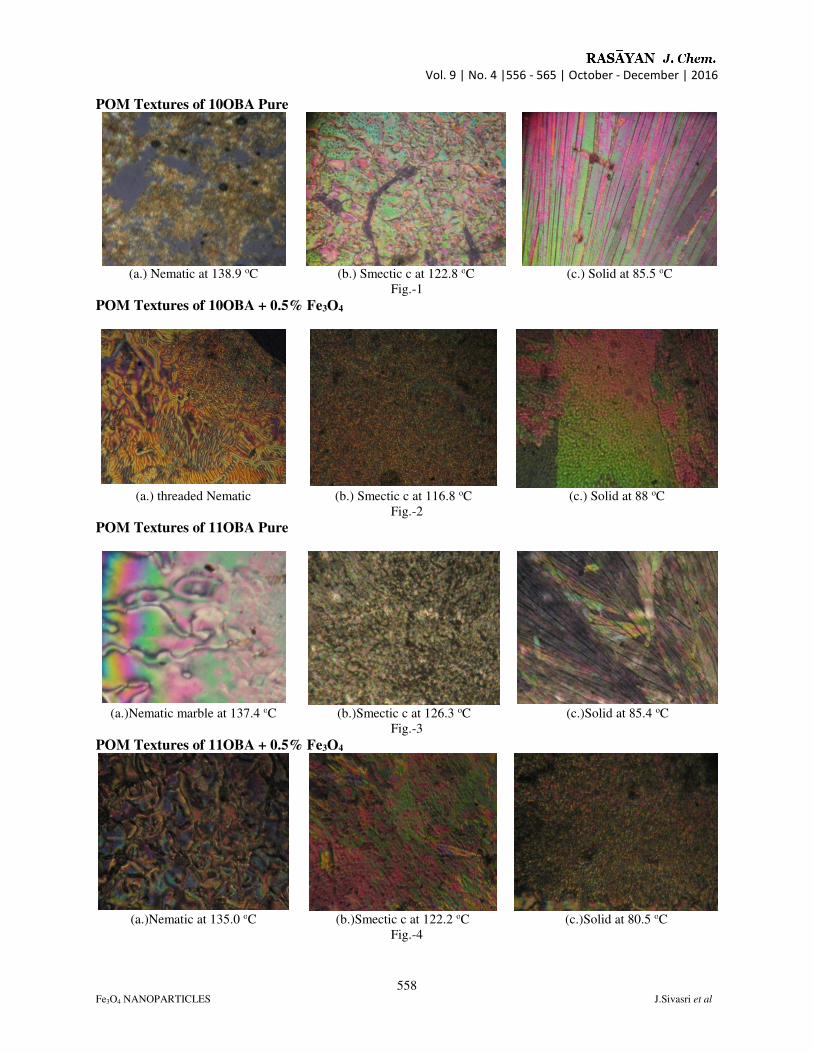
The transition temperatures and textures observed by POM in pure 10OBA is shown in Fig.-1a, Fig.-1b
and Fig.-1c while that of 10OBA with dispersed 0.5 wt% of Fe3O4 nanoparticles shown in Fig.-2a, Fig.-2b
andFig.-2c and that of 11OBA pure is shown in Fig.-3a, Fig.-3b and Fig.-3c while that of 11OBA with
dispersed 0.5wt% of Fe3O4 nanoparticles shown in Fig.-4a, Fig.-4b and Fig.-4c respectively. The thermal
ranges of nematic and Smectic phases are changed slightly due to the dispersion of nanoparticles and the
textures of the phase’s changes by the self-assembly of nanoparticles. Thermal nematic ranges are
increased with increase of concentration of Fe3O4 nanoparticles in pure LCs.
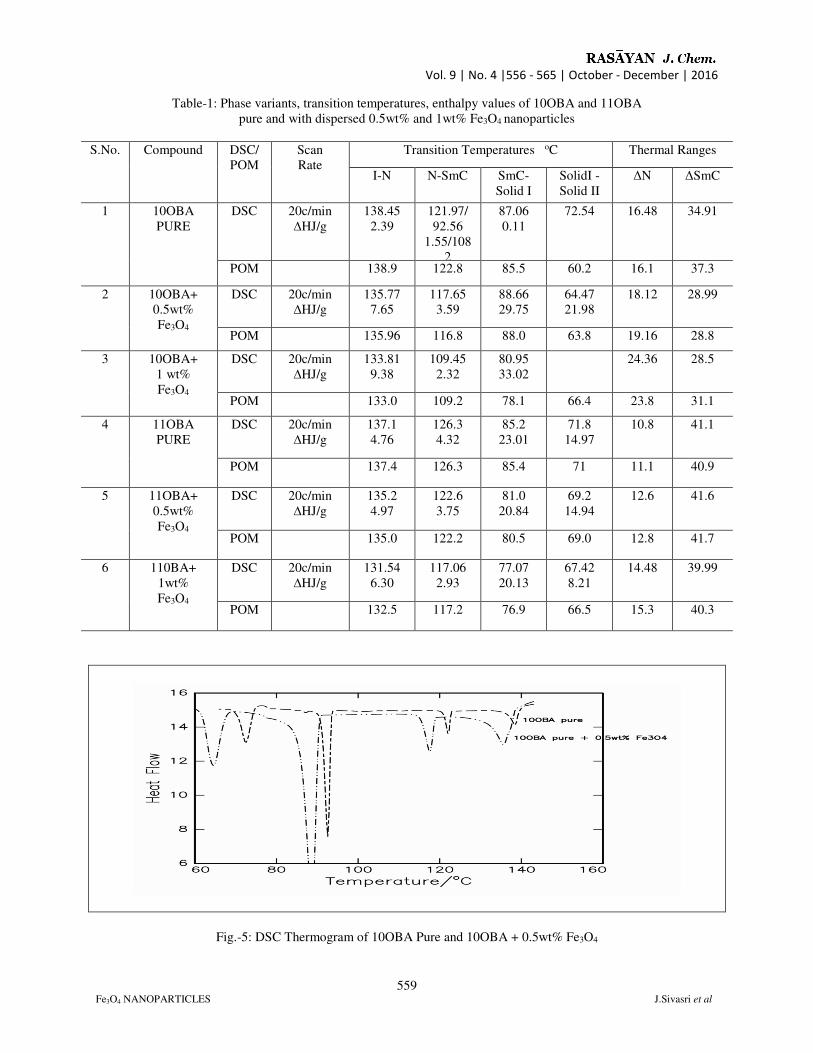
The thermal analysis studies performed from the technique such as DSC provides data regarding the
temperatures, heats of transition and heat capacities of different phases (Table-1).DSC reveals the
presence of phase transitions in a material by detecting the enthalpy change associated with each phase
transition, precise phase identifications cannot be made. The level of enthalpy change involved at the
phase transition does provide some indication of the types of phase involved. DSC is used in conjunction
with optical polarizing microscopy to determine the mesophase types exhibited by a material.
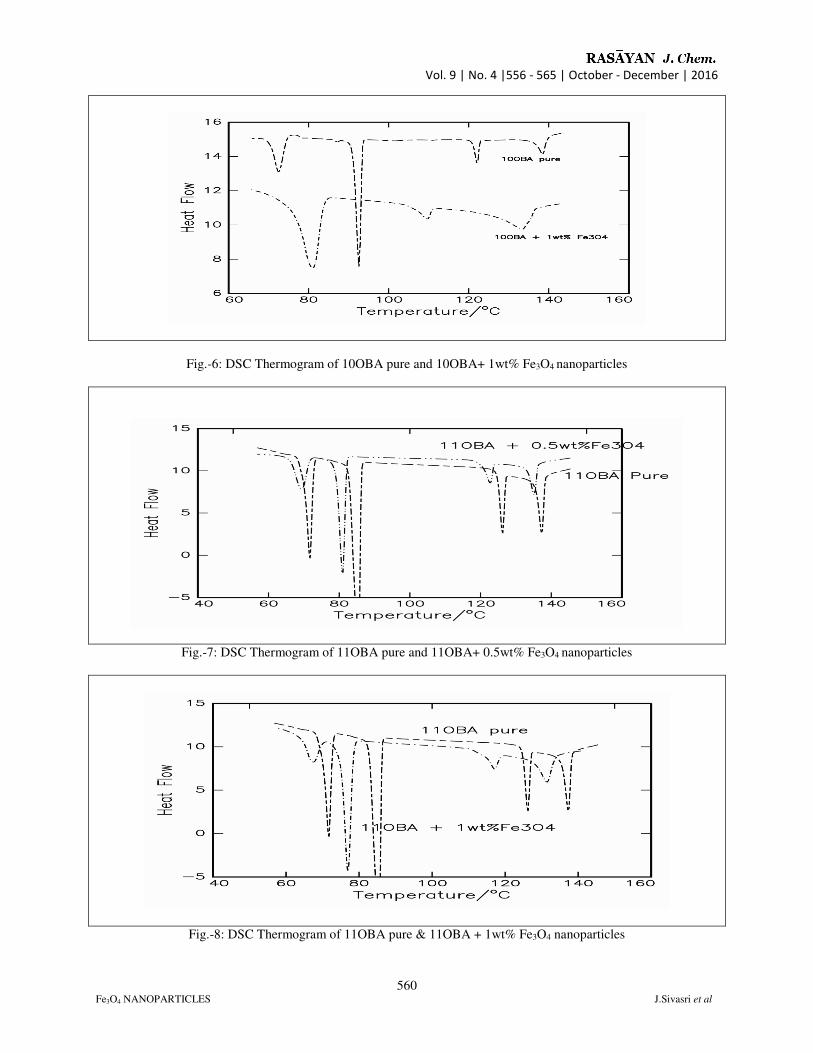
Thermograms of 10OBA and 11OBA with 0.5 wt % and 1 wt % Fe3O4 nanoparticles dispersion are shown
in Fig.-5, Fig.-6, Fig.-7 and Fig.-8.From the DSC thermogram with the dispersion of Fe3O4 nanoparticles,
it is observed that the enthalpy change decreases at every phase transition when compared with the pure
LC. This occurs due to the presence of the Fe3O4 nanoparticles with the interaction of LC molecules.
Vol. 9 | No. 4 |556 - 565 | October - December | 2016
558 Fe3O4 NANOPARTICLES J.Sivasri et al
POM Textures of 10OBA Pure
(a.) Nematic at 138.9 oC (b.) Smectic c at 122.8 oC (c.) Solid at 85.5 oC
Fig.-1
POM Textures of 10OBA + 0.5% Fe3O4
(a.) threaded Nematic (b.) Smectic c at 116.8 oC (c.) Solid at 88 oC
Fig.-2
POM Textures of 11OBA Pure
(a.)Nematic marble at 137.4 oC (b.)Smectic c at 126.3 oC (c.)Solid at 85.4 oC
Fig.-3
POM Textures of 11OBA + 0.5% Fe3O4
(a.)Nematic at 135.0 oC (b.)Smectic c at 122.2 oC (c.)Solid at 80.5 oC
Fig.-4
Vol. 9 | No. 4 |556 - 565 | October - December | 2016
559 Fe3O4 NANOPARTICLES J.Sivasri et al
Table-1: Phase variants, transition temperatures, enthalpy values of 10OBA and 11OBA
pure and with dispersed 0.5wt% and 1wt% Fe3O4 nanoparticles
S.No.
Compound DSC/
POM
Scan
Rate
Transition Temperatures oC Thermal Ranges
I-N N-SmC SmC-
Solid I
SolidI -
Solid II
∆N ∆SmC
1 10OBA
PURE
DSC 20c/min
∆HJ/g
138.45
2.39
121.97/
92.56
1.55/108
2
87.06
0.11
72.54 16.48 34.91
POM 138.9 122.8 85.5 60.2 16.1 37.3
2 10OBA+
0.5wt%
Fe3O4
DSC 20c/min
∆HJ/g
135.77
7.65
117.65
3.59
88.66
29.75
64.47
21.98
18.12 28.99
POM 135.96 116.8 88.0 63.8 19.16 28.8
3
10OBA+
1 wt%
Fe3O4
DSC 20c/min
∆HJ/g
133.81
9.38
109.45
2.32
80.95
33.02
24.36 28.5
POM 133.0 109.2 78.1 66.4 23.8 31.1
4 11OBA
PURE
DSC 20c/min
∆HJ/g
137.1
4.76
126.3
4.32
85.2
23.01
71.8
14.97
10.8 41.1
POM 137.4 126.3 85.4 71 11.1 40.9
5 11OBA+
0.5wt%
Fe3O4
DSC 20c/min
∆HJ/g
135.2
4.97
122.6
3.75
81.0
20.84
69.2
14.94
12.6 41.6
POM 135.0 122.2 80.5 69.0 12.8 41.7
6 110BA+
1wt%
Fe3O4
DSC 20c/min
∆HJ/g
131.54
6.30
117.06
2.93
77.07
20.13
67.42
8.21
14.48 39.99
POM 132.5 117.2 76.9 66.5 15.3 40.3
Fig.-5: DSC Thermogram of 10OBA Pure and 10OBA + 0.5wt% Fe3O4
Vol. 9 | No. 4 |556 - 565 | October - December | 2016
560 Fe3O4 NANOPARTICLES J.Sivasri et al
Fig.-6: DSC Thermogram of 10OBA pure and 10OBA+ 1wt% Fe3O4 nanoparticles
Fig.-7: DSC Thermogram of 11OBA pure and 11OBA+ 0.5wt% Fe3O4 nanoparticles
Fig.-8: DSC Thermogram of 11OBA pure & 11OBA + 1wt% Fe3O4 nanoparticles
Vol. 9 | No. 4 |556 - 565 | October - December | 2016
561 Fe3O4 NANOPARTICLES J.Sivasri et al
FTIR Studies
As synthesized Fe3O4nanoparticles dispersed in 11OBA Compound is analysed by using FTIR at room
temperature. The compound is stable at room temperature, the IR frequencies in solid state which are
correlated in bond with the pure bond 11OBA. The assigned bonds corresponding to the resultant
frequencies from the spectra are tabulated24. Due to the excitation of both molecular vibrations and
rotations absorptions of electromagnetic radiation causes the formation of absorption bands in the IR
spectra which are useful to explain the bonding interaction of the molecules.
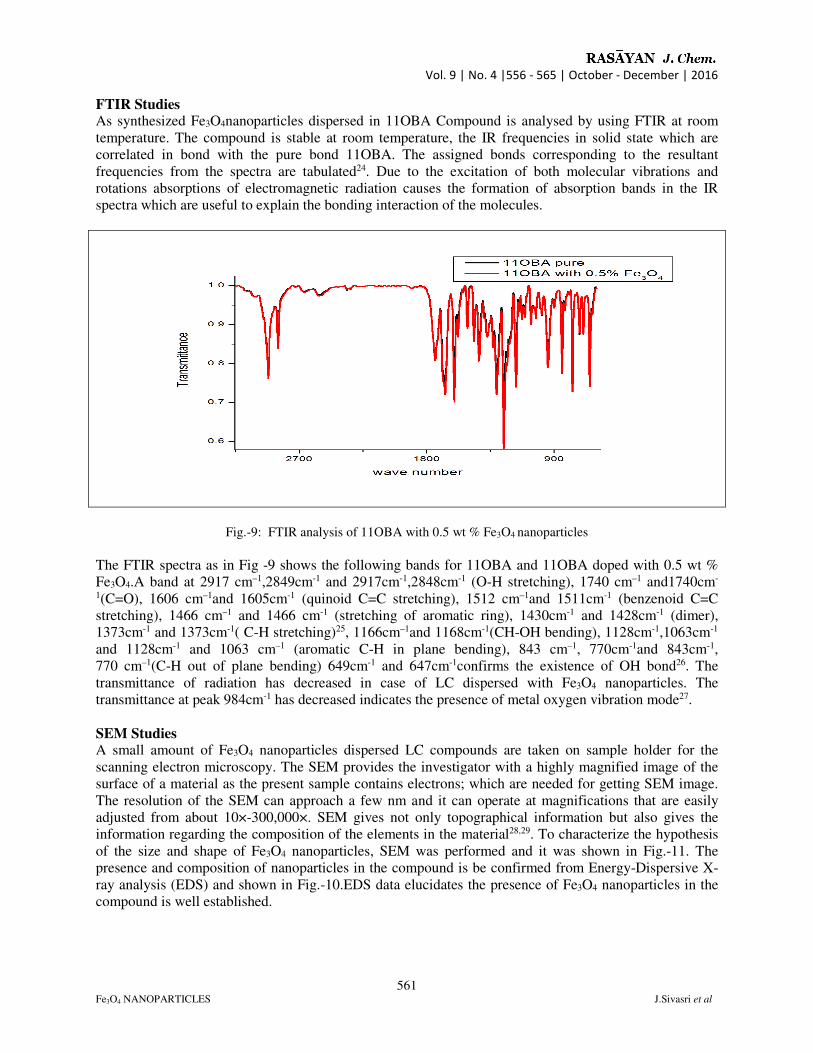
Fig.-9: FTIR analysis of 11OBA with 0.5 wt % Fe3O4 nanoparticles
The FTIR spectra as in Fig -9 shows the following bands for 11OBA and 11OBA doped with 0.5 wt %
Fe3O4.A band at 2917 cm–1,2849cm-1 and 2917cm-1,2848cm-1 (O-H stretching), 1740 cm–1 and1740cm-
1(C=O), 1606 cm–1and 1605cm-1 (quinoid C=C stretching), 1512 cm–1and 1511cm-1 (benzenoid C=C
stretching), 1466 cm–1 and 1466 cm-1 (stretching of aromatic ring), 1430cm-1 and 1428cm-1 (dimer),
1373cm-1 and 1373cm-1( C-H stretching)25, 1166cm–1and 1168cm-1(CH-OH bending), 1128cm-1,1063cm-1
and 1128cm-1 and 1063 cm–1 (aromatic C-H in plane bending), 843 cm–1, 770cm-1and 843cm-1,
770 cm–1(C-H out of plane bending) 649cm-1 and 647cm-1confirms the existence of OH bond26. The
transmittance of radiation has decreased in case of LC dispersed with Fe3O4 nanoparticles. The
transmittance at peak 984cm-1 has decreased indicates the presence of metal oxygen vibration mode27.
SEM Studies A small amount of Fe3O4 nanoparticles dispersed LC compounds are taken on sample holder for the
scanning electron microscopy. The SEM provides the investigator with a highly magnified image of the
surface of a material as the present sample contains electrons; which are needed for getting SEM image.
The resolution of the SEM can approach a few nm and it can operate at magnifications that are easily
adjusted from about 10×-300,000×. SEM gives not only topographical information but also gives the
information regarding the composition of the elements in the material28,29. To characterize the hypothesis
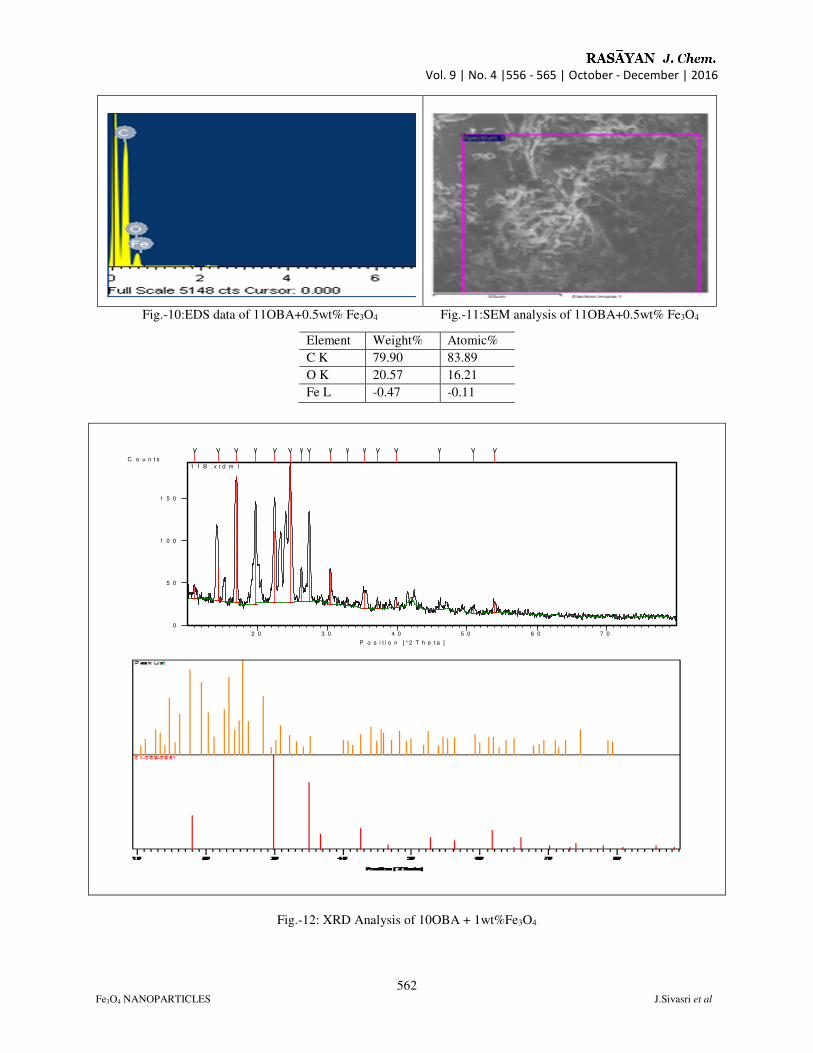
of the size and shape of Fe3O4 nanoparticles, SEM was performed and it was shown in Fig.-11. The
presence and composition of nanoparticles in the compound is be confirmed from Energy-Dispersive X-
ray analysis (EDS) and shown in Fig.-10.EDS data elucidates the presence of Fe3O4 nanoparticles in the
compound is well established.
Vol. 9 | No. 4 |556 - 565 | October - December | 2016
562 Fe3O4 NANOPARTICLES J.Sivasri et al
Fig.-10:EDS data of 11OBA+0.5wt% Fe3O4 Fig.-11:SEM analysis of 11OBA+0.5wt% Fe3O4
Fig.-12: XRD Analysis of 10OBA + 1wt%Fe3O4
P o s i t i o n [ ° 2 T h e t a ]
2 0 3 0 4 0 5 0 6 0 7 0
C o u n t s
0
5 0
1 0 0
1 5 0
1 1 B . x r d m l
Element Weight% Atomic%
C K 79.90 83.89
O K 20.57 16.21
Fe L -0.47 -0.11
Vol. 9 | No. 4 |556 - 565 | October - December | 2016
563 Fe3O4 NANOPARTICLES J.Sivasri et al
XRD Studies The XRD data of 10OBA pure and with 1wt% Fe3O4 nanoparticles are shown in Fig.-12in comparison of
JCPDF data peaks are well resolved and are matched with JCPDF card no. 01-089-0951which is clearly
evidenced the existence of Fe3O4 nanoparticles. By using Scherrer’s Formula, t = kλ/ β Cosθ, grain size is
found to be 47nm, Λ=1.54 Ao, β= FWHM, Peaks at 29.57o, 35.26o, 42.55o, 56.29o, 61.95o and 64.95o
resembles the existence ofFe3O4 nanoparticles which is matching with the early reporting30-32.
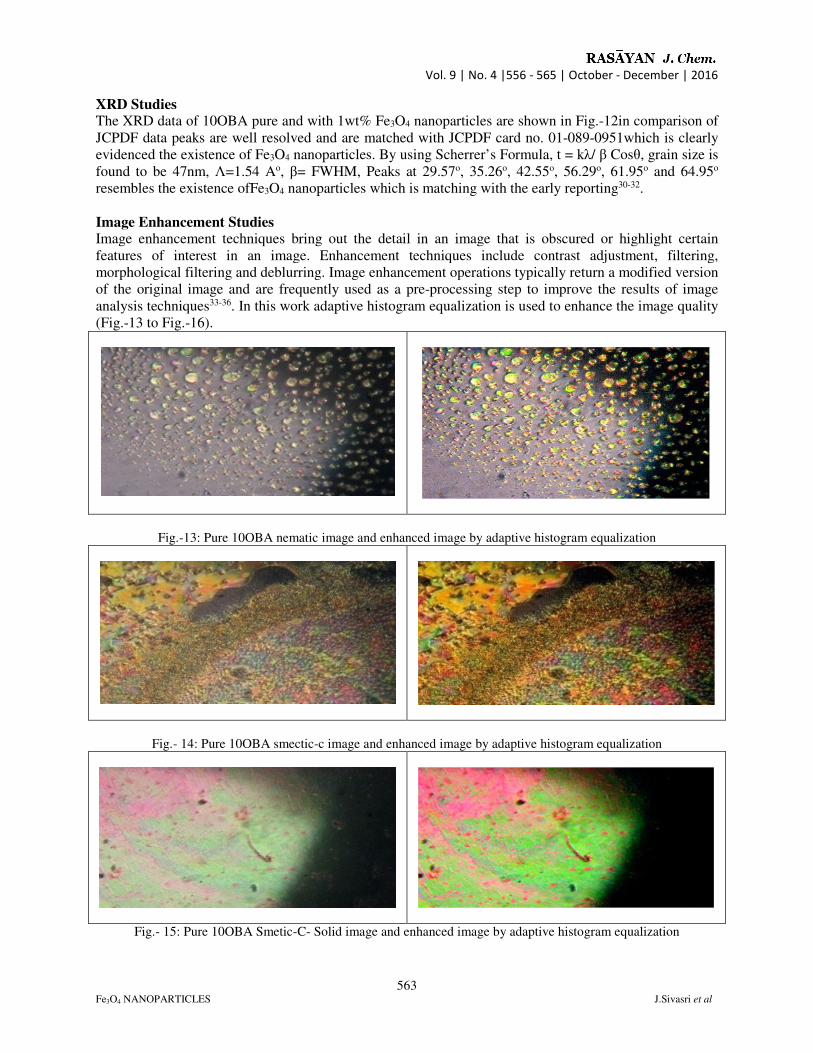
Image Enhancement Studies Image enhancement techniques bring out the detail in an image that is obscured or highlight certain
features of interest in an image. Enhancement techniques include contrast adjustment, filtering,
morphological filtering and deblurring. Image enhancement operations typically return a modified version
of the original image and are frequently used as a pre-processing step to improve the results of image
analysis techniques33-36. In this work adaptive histogram equalization is used to enhance the image quality
(Fig.-13 to Fig.-16).
Fig.-13: Pure 10OBA nematic image and enhanced image by adaptive histogram equalization
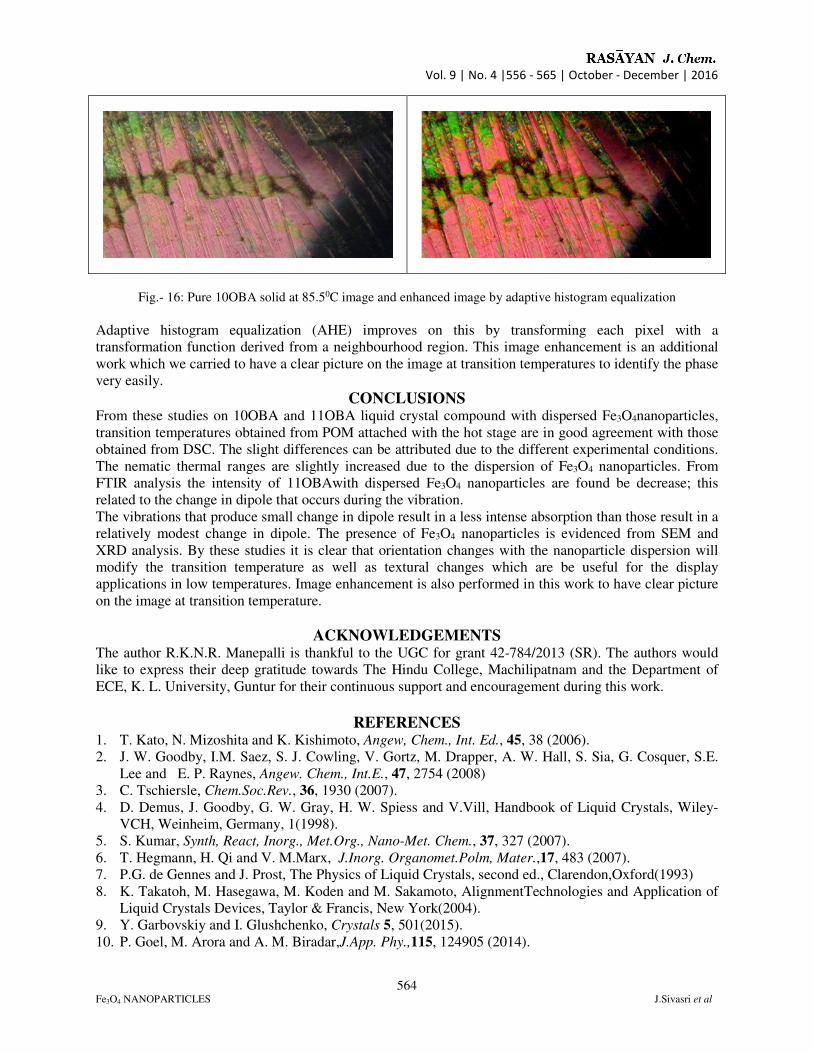
Fig.- 14: Pure 10OBA smectic-c image and enhanced image by adaptive histogram equalization
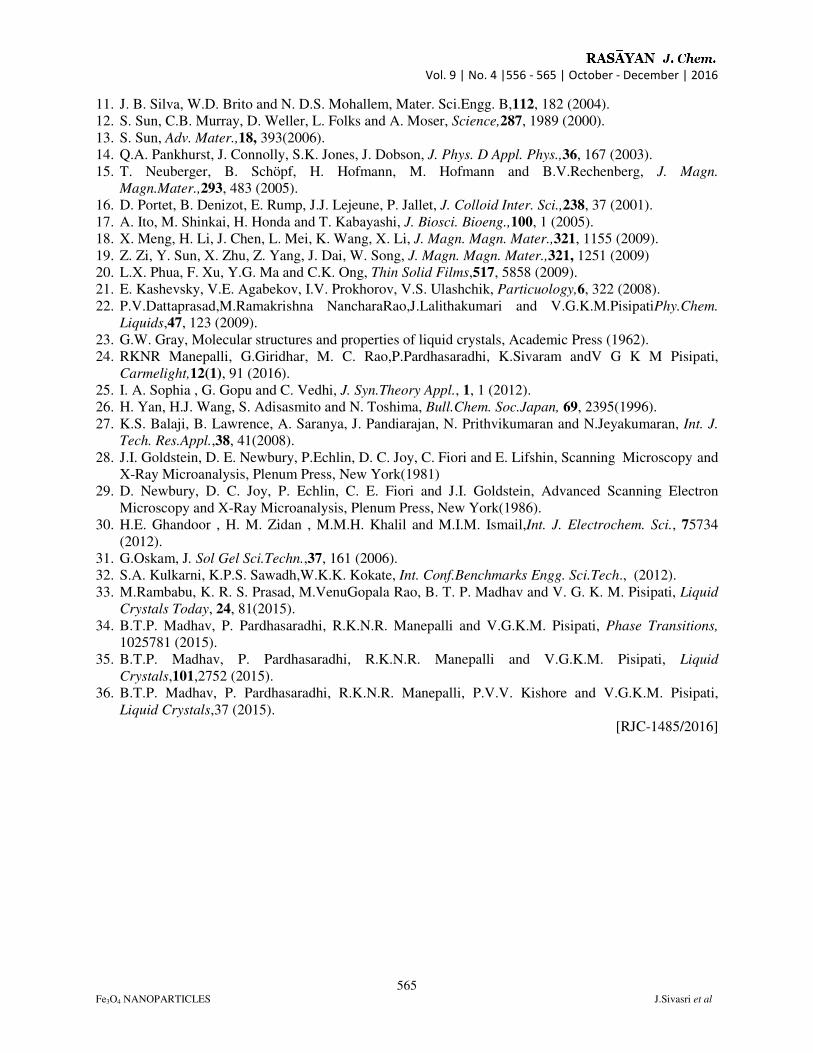
Fig.- 15: Pure 10OBA Smetic-C- Solid image and enhanced image by adaptive histogram equalization
Vol. 9 | No. 4 |556 - 565 | October - December | 2016
564 Fe3O4 NANOPARTICLES J.Sivasri et al
Fig.- 16: Pure 10OBA solid at 85.50C image and enhanced image by adaptive histogram equalization
Adaptive histogram equalization (AHE) improves on this by transforming each pixel with a
transformation function derived from a neighbourhood region. This image enhancement is an additional
work which we carried to have a clear picture on the image at transition temperatures to identify the phase
very easily.
CONCLUSIONS From these studies on 10OBA and 11OBA liquid crystal compound with dispersed Fe3O4nanoparticles,
transition temperatures obtained from POM attached with the hot stage are in good agreement with those
obtained from DSC. The slight differences can be attributed due to the different experimental conditions.
The nematic thermal ranges are slightly increased due to the dispersion of Fe3O4 nanoparticles. From
FTIR analysis the intensity of 11OBAwith dispersed Fe3O4 nanoparticles are found be decrease; this
related to the change in dipole that occurs during the vibration.
The vibrations that produce small change in dipole result in a less intense absorption than those result in a
relatively modest change in dipole. The presence of Fe3O4 nanoparticles is evidenced from SEM and
XRD analysis. By these studies it is clear that orientation changes with the nanoparticle dispersion will
modify the transition temperature as well as textural changes which are be useful for the display
applications in low temperatures. Image enhancement is also performed in this work to have clear picture
on the image at transition temperature.
ACKNOWLEDGEMENTS The author R.K.N.R. Manepalli is thankful to the UGC for grant 42-784/2013 (SR). The authors would
like to express their deep gratitude towards The Hindu College, Machilipatnam and the Department of
ECE, K. L. University, Guntur for their continuous support and encouragement during this work.
REFERENCES 1. T. Kato, N. Mizoshita and K. Kishimoto, Angew, Chem., Int. Ed., 45, 38 (2006).
2. J. W. Goodby, I.M. Saez, S. J. Cowling, V. Gortz, M. Drapper, A. W. Hall, S. Sia, G. Cosquer, S.E.
Lee and E. P. Raynes, Angew. Chem., Int.E., 47, 2754 (2008)
3. C. Tschiersle, Chem.Soc.Rev., 36, 1930 (2007).
4. D. Demus, J. Goodby, G. W. Gray, H. W. Spiess and V.Vill, Handbook of Liquid Crystals, Wiley-
VCH, Weinheim, Germany, 1(1998).
5. S. Kumar, Synth, React, Inorg., Met.Org., Nano-Met. Chem., 37, 327 (2007).
6. T. Hegmann, H. Qi and V. M.Marx, J.Inorg. Organomet.Polm, Mater.,17, 483 (2007).
7. P.G. de Gennes and J. Prost, The Physics of Liquid Crystals, second ed., Clarendon,Oxford(1993)
8. K. Takatoh, M. Hasegawa, M. Koden and M. Sakamoto, AlignmentTechnologies and Application of
Liquid Crystals Devices, Taylor & Francis, New York(2004).
9. Y. Garbovskiy and I. Glushchenko, Crystals 5, 501(2015).
10. P. Goel, M. Arora and A. M. Biradar,J.App. Phy.,115, 124905 (2014).
Vol. 9 | No. 4 |556 - 565 | October - December | 2016
565 Fe3O4 NANOPARTICLES J.Sivasri et al
11. J. B. Silva, W.D. Brito and N. D.S. Mohallem, Mater. Sci.Engg. B,112, 182 (2004).
12. S. Sun, C.B. Murray, D. Weller, L. Folks and A. Moser, Science,287, 1989 (2000).
13. S. Sun, Adv. Mater.,18, 393(2006).
14. Q.A. Pankhurst, J. Connolly, S.K. Jones, J. Dobson, J. Phys. D Appl. Phys.,36, 167 (2003).
15. T. Neuberger, B. Schöpf, H. Hofmann, M. Hofmann and B.V.Rechenberg, J. Magn.
Magn.Mater.,293, 483 (2005).
16. D. Portet, B. Denizot, E. Rump, J.J. Lejeune, P. Jallet, J. Colloid Inter. Sci.,238, 37 (2001).
17. A. Ito, M. Shinkai, H. Honda and T. Kabayashi, J. Biosci. Bioeng.,100, 1 (2005).
18. X. Meng, H. Li, J. Chen, L. Mei, K. Wang, X. Li, J. Magn. Magn. Mater.,321, 1155 (2009).
19. Z. Zi, Y. Sun, X. Zhu, Z. Yang, J. Dai, W. Song, J. Magn. Magn. Mater.,321, 1251 (2009)
20. L.X. Phua, F. Xu, Y.G. Ma and C.K. Ong, Thin Solid Films,517, 5858 (2009).
21. E. Kashevsky, V.E. Agabekov, I.V. Prokhorov, V.S. Ulashchik, Particuology,6, 322 (2008).
22. P.V.Dattaprasad,M.Ramakrishna NancharaRao,J.Lalithakumari and V.G.K.M.PisipatiPhy.Chem.
Liquids,47, 123 (2009).
23. G.W. Gray, Molecular structures and properties of liquid crystals, Academic Press (1962).
24. RKNR Manepalli, G.Giridhar, M. C. Rao,P.Pardhasaradhi, K.Sivaram andV G K M Pisipati,
Carmelight,12(1), 91 (2016).
25. I. A. Sophia , G. Gopu and C. Vedhi, J. Syn.Theory Appl., 1, 1 (2012).
26. H. Yan, H.J. Wang, S. Adisasmito and N. Toshima, Bull.Chem. Soc.Japan, 69, 2395(1996).
27. K.S. Balaji, B. Lawrence, A. Saranya, J. Pandiarajan, N. Prithvikumaran and N.Jeyakumaran, Int. J.
Tech. Res.Appl.,38, 41(2008).
28. J.I. Goldstein, D. E. Newbury, P.Echlin, D. C. Joy, C. Fiori and E. Lifshin, Scanning Microscopy and
X-Ray Microanalysis, Plenum Press, New York(1981)
29. D. Newbury, D. C. Joy, P. Echlin, C. E. Fiori and J.I. Goldstein, Advanced Scanning Electron
Microscopy and X-Ray Microanalysis, Plenum Press, New York(1986).
30. H.E. Ghandoor , H. M. Zidan , M.M.H. Khalil and M.I.M. Ismail,Int. J. Electrochem. Sci., 75734
(2012).
31. G.Oskam, J. Sol Gel Sci.Techn.,37, 161 (2006).
32. S.A. Kulkarni, K.P.S. Sawadh,W.K.K. Kokate, Int. Conf.Benchmarks Engg. Sci.Tech., (2012).
33. M.Rambabu, K. R. S. Prasad, M.VenuGopala Rao, B. T. P. Madhav and V. G. K. M. Pisipati, Liquid
Crystals Today, 24, 81(2015).
34. B.T.P. Madhav, P. Pardhasaradhi, R.K.N.R. Manepalli and V.G.K.M. Pisipati, Phase Transitions,
1025781 (2015).
35. B.T.P. Madhav, P. Pardhasaradhi, R.K.N.R. Manepalli and V.G.K.M. Pisipati, Liquid
Crystals,101,2752 (2015).
36. B.T.P. Madhav, P. Pardhasaradhi, R.K.N.R. Manepalli, P.V.V. Kishore and V.G.K.M. Pisipati,
Liquid Crystals,37 (2015).
[RJC-1485/2016]