Embed Size (px)
Citation preview
Influence of Flower Native Status, Color, and Morphology on Visiting Preferences of Bees in Riparian Areas of Eastern Oregon
Samantha M. Roof1, Sandra J. DeBano1,2, Mary M. Rowland3, and Skyler Burrows4
1Hermiston Agricultural Research and Extension Center, Oregon State University, Hermiston, OR; 2Department of Fisheries and Wildlife, Oregon State University, Corvallis, OR; 3United States Forest Service, Pacific Northwest Research Station, La Grande, OR; 4Bee Biology and Systematics Lab, Utah State University, Logan, UT.
The Pacific Northwest boasts a wide diversity of native bees that are important pollinators of crops, gardens, and native plants. However, many species of bees are in decline around the world, primarily from the destruction and degradation of their habitat.1 Effectively restoring or conserving bee habitat requires a better understanding of the complex relationship between bees and flowering plants.
High quality bee habitat includes flowers that provide pollen and nectar preferred by bees, but little data exists about which plants are commonly used by bees in the Pacific Northwest, or whether bees prefer certain plant characteristics over others. Although lists that recommend planting particular flowers attractive to bees are available, many are based on anecdotal observations rather than rigorous scientific studies. Riparian areas are of special concern because they support high levels of biodiversity, including floral diversity, and thus potentially comprise key habitat for bees, both in natural and human-dominated landscapes.2
The purpose of this study was to examine bee and plant associations in a riparian area of the Starkey Experimental Forest and Range (Starkey), in eastern Oregon.
Figure 1. A map of the sites sampled at Starkey.
Figure 2. Hand-netting a bee.
Figure 3. Collected bees.
Figure 4. Bees caught by hand-netting on the exotic bird’s-foot trefoil (Lotus corniculatus)
Twelve sites located in three different riparian pastures adjacent to Meadow Creek were sampled throughout the summers of 2014 and 2015 at Starkey (Fig. 1).
Plants
• We set up five parallel, 20-m long, 0.3-m wide belt transects, separated by 10 m, and oriented perpendicular to the creek.
• Along each transect the species and number of stems of each blooming flower were counted and recorded.
Bees
• Opportunistic Hand-Netting: we walked around each site and searched for bees visiting any blooming flower. Bee abundance on each plant species was compared with the number of blooming stems counted on transects (Figs. 2-4).
• Targeted Hand-Netting: we collected bees on 6 native plants and 6 introduced plants listed in Fig. 7. We counted the number of blooming stems and the number of bees observed and collected on each plant species for 20-min intervals at each site.
• We used a Mann-Whitney U test to determine if bee abundance differed between the native and introduced plants.
• Ordination using data from both types of hand-netting examined whether different plants had different groups of bees visiting them; multi-response permutation procedures (MRPP) determined whether observed differences were related to the native status, flower color, or floral morphology (Fig. 5) of the plant.
Figure 6. NMS ordination of 17 plant species associated with 43 bee species. Shapes represent the morphological characteristic category assigned to each plant species, and plants are arranged in bee species space. Letters in parentheses designate native status: N = native, I = introduced. Axis 1 described 52.8% of the variation, and axis 2 described 22.1% of the variation.
1) The native status of a plant did not significantly affect the number or type of bees visiting it. Flower color also had no significant influence on the types of bees associated with each plant species.
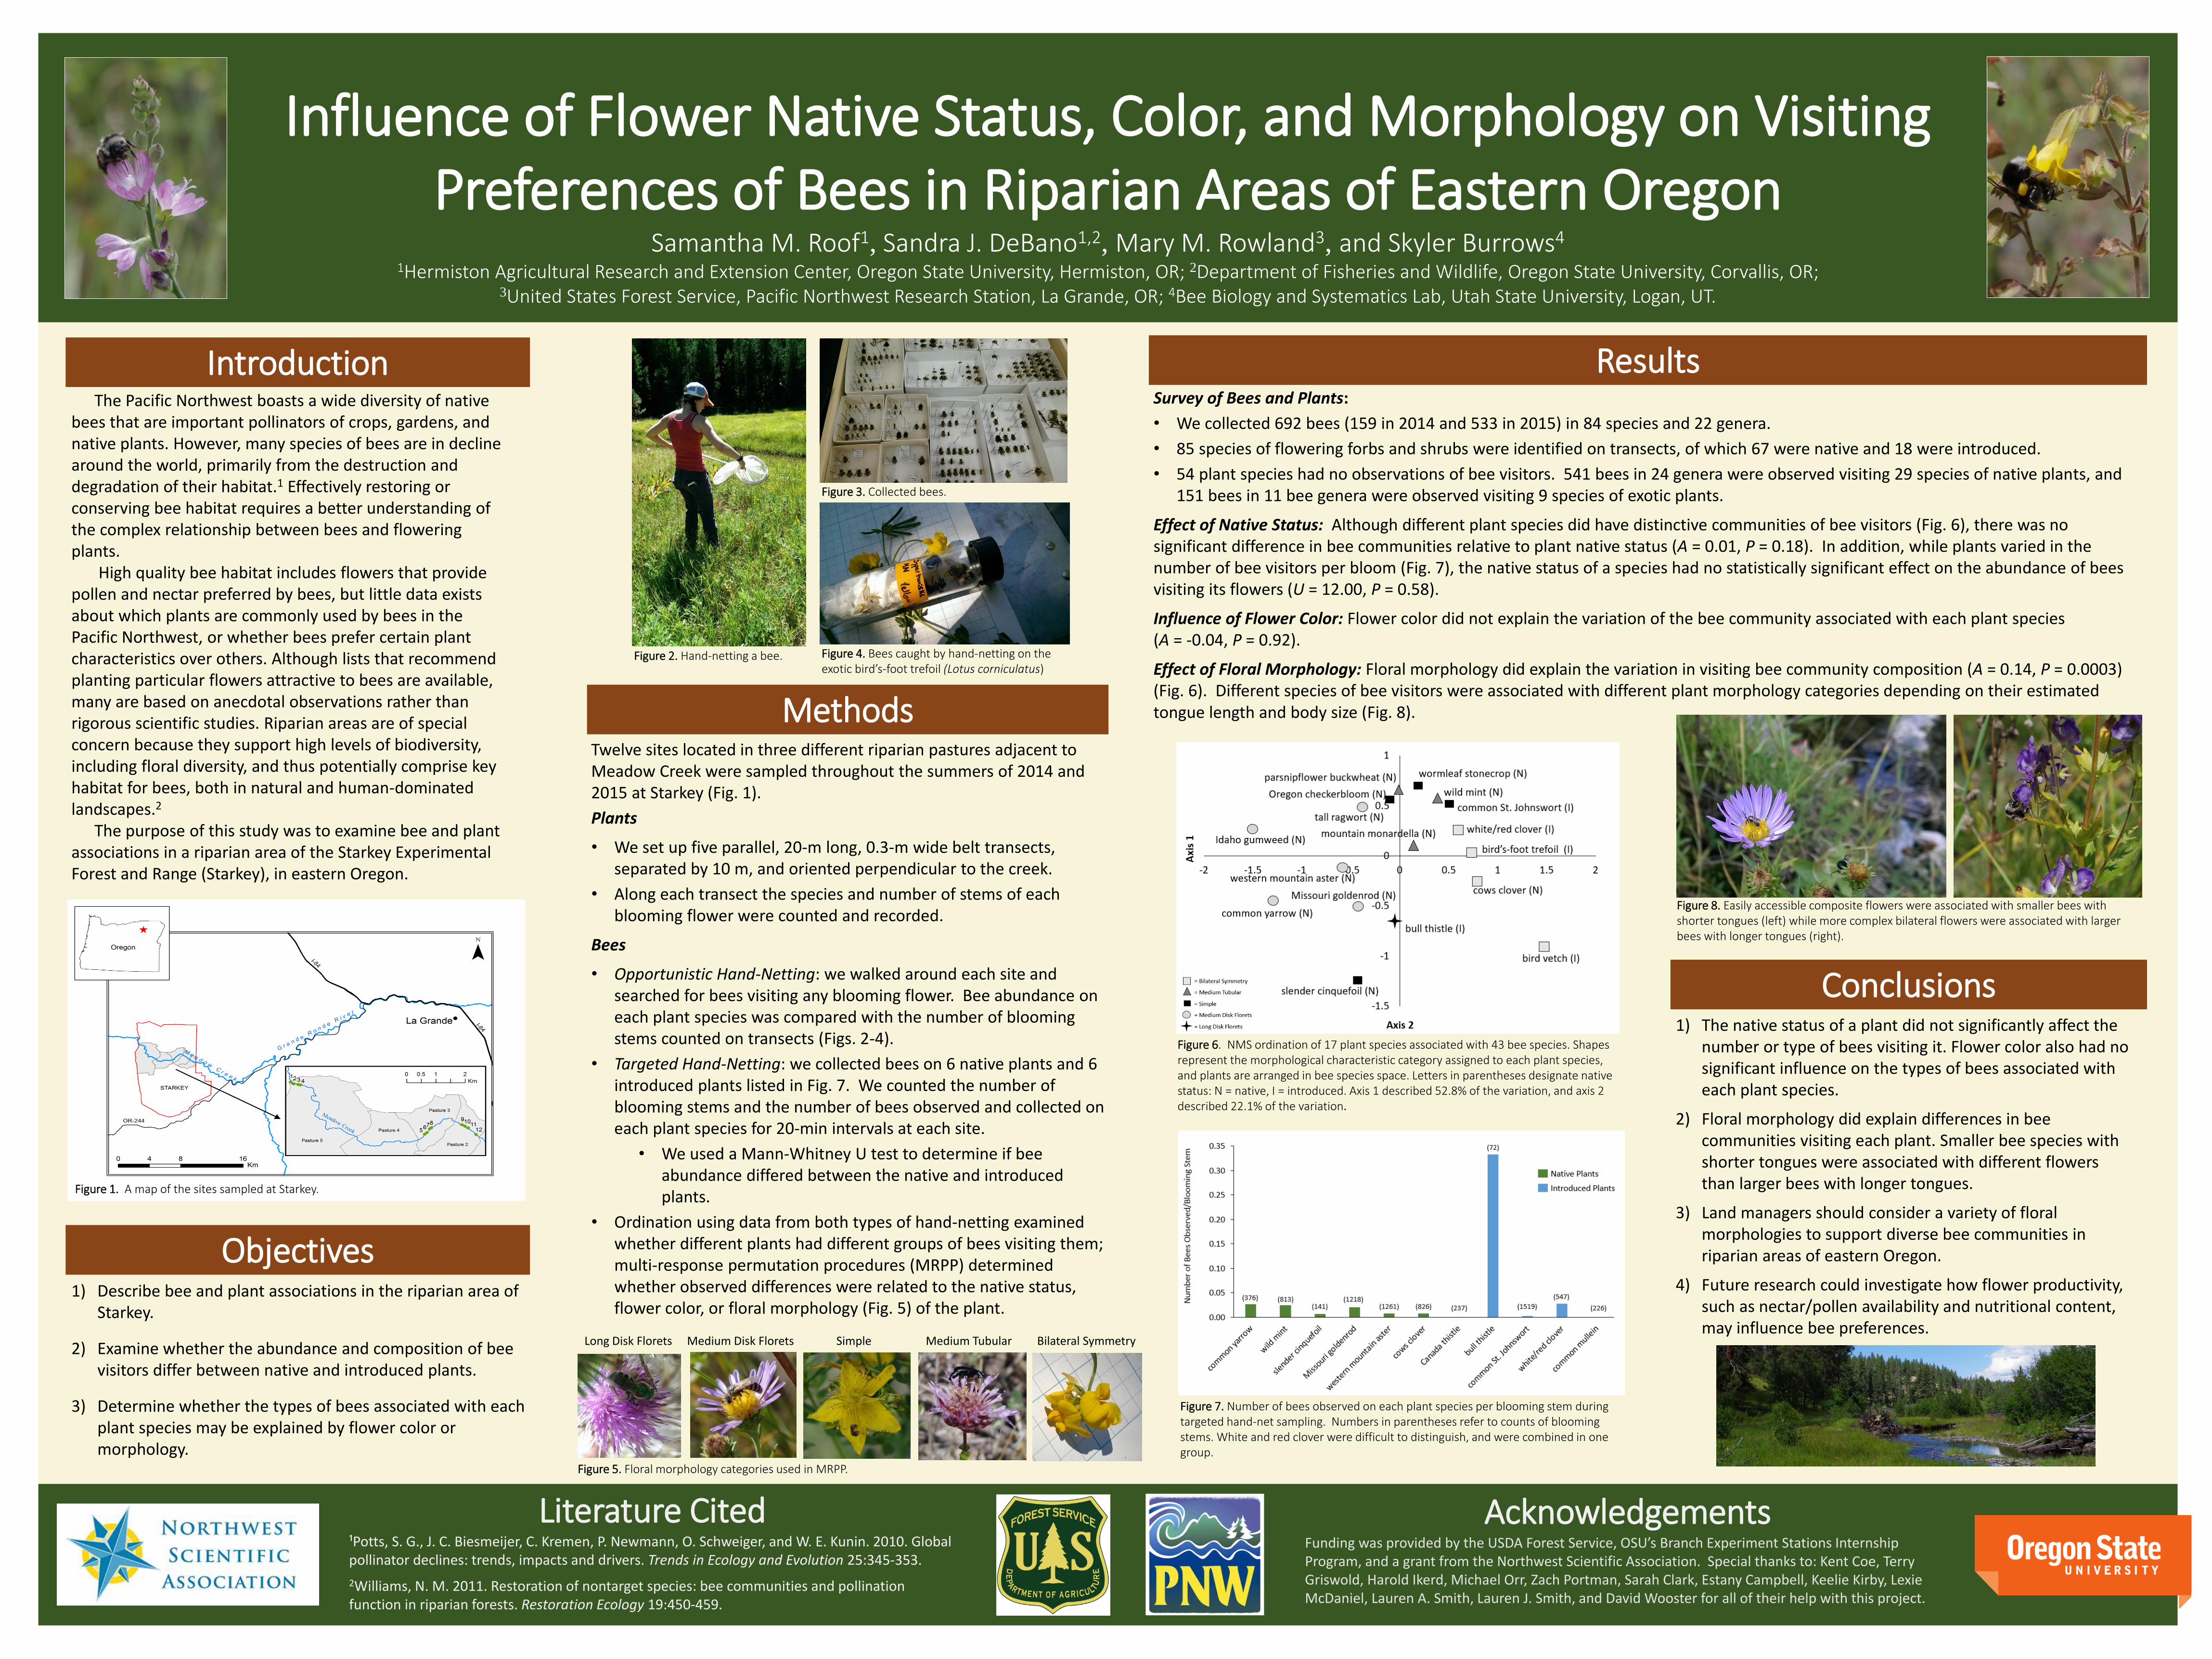
2) Floral morphology did explain differences in bee communities visiting each plant. Smaller bee species with shorter tongues were associated with different flowers than larger bees with longer tongues.
3) Land managers should consider a variety of floral morphologies to support diverse bee communities in riparian areas of eastern Oregon.
4) Future research could investigate how flower productivity, such as nectar/pollen availability and nutritional content, may influence bee preferences.
Figure 8. Easily accessible composite flowers were associated with smaller bees with shorter tongues (left) while more complex bilateral flowers were associated with larger bees with longer tongues (right).
AcknowledgementsFunding was provided by the USDA Forest Service, OSU’s Branch Experiment Stations Internship Program, and a grant from the Northwest Scientific Association. Special thanks to: Kent Coe, Terry Griswold, Harold Ikerd, Michael Orr, Zach Portman, Sarah Clark, Estany Campbell, Keelie Kirby, Lexie McDaniel, Lauren A. Smith, Lauren J. Smith, and David Wooster for all of their help with this project.
Figure 7. Number of bees observed on each plant species per blooming stem during targeted hand-net sampling. Numbers in parentheses refer to counts of blooming stems. White and red clover were difficult to distinguish, and were combined in one group.
1) Describe bee and plant associations in the riparian area of Starkey.
2) Examine whether the abundance and composition of bee visitors differ between native and introduced plants.
3) Determine whether the types of bees associated with each plant species may be explained by flower color or morphology.
Survey of Bees and Plants:
• We collected 692 bees (159 in 2014 and 533 in 2015) in 84 species and 22 genera.
• 85 species of flowering forbs and shrubs were identified on transects, of which 67 were native and 18 were introduced.
• 54 plant species had no observations of bee visitors. 541 bees in 24 genera were observed visiting 29 species of native plants, and 151 bees in 11 bee genera were observed visiting 9 species of exotic plants.
Effect of Native Status: Although different plant species did have distinctive communities of bee visitors (Fig. 6), there was no significant difference in bee communities relative to plant native status (A = 0.01, P = 0.18). In addition, while plants varied in the number of bee visitors per bloom (Fig. 7), the native status of a species had no statistically significant effect on the abundance of bees visiting its flowers (U = 12.00, P = 0.58).
Influence of Flower Color: Flower color did not explain the variation of the bee community associated with each plant species (A = -0.04, P = 0.92).
Effect of Floral Morphology: Floral morphology did explain the variation in visiting bee community composition (A = 0.14, P = 0.0003) (Fig. 6). Different species of bee visitors were associated with different plant morphology categories depending on their estimated tongue length and body size (Fig. 8).
Literature Cited¹Potts, S. G., J. C. Biesmeijer, C. Kremen, P. Newmann, O. Schweiger, and W. E. Kunin. 2010. Global pollinator declines: trends, impacts and drivers. Trends in Ecology and Evolution 25:345-353.
2Williams, N. M. 2011. Restoration of nontarget species: bee communities and pollination function in riparian forests. Restoration Ecology 19:450-459.
Introduction
Methods
Results
Objectives
Conclusions
Figure 5. Floral morphology categories used in MRPP.
Long Disk Florets Medium Disk Florets Simple Medium Tubular Bilateral Symmetry