Embed Size (px)
Citation preview

Influence of geotextile reinforcement on shearmodulus of saturated sand
Reza Ziaie MoayedAssociate Professor, Civil Engineering Dept. Imam Khomeini
International University,Qazvin, Iran
Mahdi AlibolandiInstructor, Sama Technical and Vocational Training College,
Islamic Azad University, Andisheh Branch,Andisheh, Iran
Abstract—The increasing use of geotextile-reinforced soilsystems for important earth structures requires properunderstanding of their behaviour and validation of theassumptions in their design. This paper investigates the shearmodulus of saturated reinforced sand throughout the undrainedcyclic triaxial tests. The cyclic triaxial tests are conducted onremolded specimens which reinforced by different arrangementof non-woven geotextile. The tests results indicate that thegeotextile reinforcement increase Gmax of saturated silty sand andGmax increased as the geotextile layer increased. It is alsoconcluded that as the geotextile close to the top of the specimen(load applying part) the maximum shear modulus increased andby increasing space between geotextile and cap of the sample, thereinforcement effect on Gmax decreases.
Keywords— Dynamic Behavior; Reinforced Sand; TriaxialTest; Geotextile; Shear Modulus
I. INTRODUCTION
Soil reinforcement is one of the improvement methods inwhich tensile elements are set into the soil body to compensatethe soil weakness in tension. Although examples of reinforcedsoils can be seen in ancient structures, it was only in the1960’s that the modern concepts of composite soil-inclusionmaterial were developed. Steel strips or meshes were primarilybeing used as inclusions before geosynthetics appeared withinthe last two decades. Since 1970s, the use of geotextile asreinforcement has become more popular due to a moresatisfactory performance compared with metal reinforcement,which has been reported in several instances [1]. The reason isthat geotextiles or synthetic fabrics have relatively lowstiffness compared to that of metals. Thus, they are morecompatible with soil in view of deformability. Currently, threemain geosynthetic families of products are used as soilreinforcement: geogrids, geotextiles, and synthetic fibers.Geotextile reinforced structures are increasingly being used ina wide range of applications, such as transportationinfrastructures, coastal protection, slope stabilization,embankment dams, retaining walls and also in preventingliquefaction of sand deposits [2]-[7]. These structures aresubjected to various loading conditions including dynamic orcyclic loads. The most important parameters in evaluation ofdynamic behavior of aforementioned soil structures are and
axial modulus. The locus of points corresponding to the tips ofhysteresis is loops of various cyclic strain amplitudes is calleda backbone (or skeleton) curve (Fig. 1); its slope at the origin(zero cyclic strain amplitude) and certain cyclic strainamplitude represent the largest value of the shear modulus,Gmax and secant shear modulus Gsec, respectively [8].Similarly, according to Fig. 2, maximum elastic modulus(Emax) and Esec estimated by slope of deviatoric stress σd versusaxial strain ε, [9].
The present study is aimed at obtaining a betterunderstanding of shear modulus during cyclic undraindloading of geotextile reinforced saturated sand. This studyincluded a number of undrained cyclic triaxial tests onFirouzkuh #161 sand samples reinforced with differentarrangement of geotextile, to characterize the role played bythis inclusion on the shear and axial modulus.
Fig. 1. Backbone curve showing the typical value of Gmax and Gsec [8].
Fig. 2. The Emax and Esec difination in hysteresis loop of deviatoric stress σd
versus axial strain ε [9].
Scientific Cooperations International Workshops on Engineering Branches 8-9 August 2014, Koc University, ISTANBUL/TURKEY
99

II. EXPERIMENTAL APPARTUS AND MATERIAL USED
A. Cyclic Triaxial SetupSpecimens were tested in a cyclic triaxial device. The
device is instrumented with LVDT, a load cell, pore pressureand a cell pressure transducer and a computer controlled dataacquisition system (Fig. 3).
B. Material Used
SandThe sand used in this study is Firouzkuh #161 crushed
silica sand. This type of sand has a golden yellow color andhas a uniform aggregation, which henceforth briefly namedFirouzkuh Sand (Fig. 4). Toyoura and Sengenyama standardsands that their characteristics are described in this paper werecompared to Firouzkuh sand (Table1). Grain size distributioncurves of the last two mentioned sands are presented in Fig. 5.
Fig. 3. Cyclic triaxial device set
Fig. 4. Magnified picture of Firouzkuh sand grains.
Fig. 5. Grain size distribution curve of Firouzkuh sand compared with thecurves.
TABLE I. FIROUZKUH SAND PHYSICAL CHARACTERISTICS ANDCOMPARING WITH TOYOURA AND SENGENYAMA
Sand type Firouzkuh #161 Toyoura Sengenyama
Gs 2.685 2.65 2.72
emax 0.94 0.97 0.91
emin 0.60 0.597 0.55
D50 (mm) 0.27 0.17 0.27
Cu 1.87 - -
Cc 0.88 - -
GeotextileTable 2 presents the properties of this non-woven PET
geotextile. The picture of geotextile is shown in Fig. 6.
TABLE II. GEOTEXTILE PROPERTIES
Properties ASTM method Quantity
Unit weight D-5261 500 gr/m2
Thickness D-5199 3.5 mm
Puncture strength D-4833 1100 N
Wide width tensilestrength D-4595 23.1 kN/m
0102030405060708090
100
0.01
Perc
ent
Fine
r (%
)
Grain Size (mm)
Toyoura
Sengenyama
Firouzkooh
II. EXPERIMENTAL APPARTUS AND MATERIAL USED
A. Cyclic Triaxial SetupSpecimens were tested in a cyclic triaxial device. The
device is instrumented with LVDT, a load cell, pore pressureand a cell pressure transducer and a computer controlled dataacquisition system (Fig. 3).
B. Material Used
SandThe sand used in this study is Firouzkuh #161 crushed
silica sand. This type of sand has a golden yellow color andhas a uniform aggregation, which henceforth briefly namedFirouzkuh Sand (Fig. 4). Toyoura and Sengenyama standardsands that their characteristics are described in this paper werecompared to Firouzkuh sand (Table1). Grain size distributioncurves of the last two mentioned sands are presented in Fig. 5.
Fig. 3. Cyclic triaxial device set
Fig. 4. Magnified picture of Firouzkuh sand grains.
Fig. 5. Grain size distribution curve of Firouzkuh sand compared with thecurves.
TABLE I. FIROUZKUH SAND PHYSICAL CHARACTERISTICS ANDCOMPARING WITH TOYOURA AND SENGENYAMA
Sand type Firouzkuh #161 Toyoura Sengenyama
Gs 2.685 2.65 2.72
emax 0.94 0.97 0.91
emin 0.60 0.597 0.55
D50 (mm) 0.27 0.17 0.27
Cu 1.87 - -
Cc 0.88 - -
GeotextileTable 2 presents the properties of this non-woven PET
geotextile. The picture of geotextile is shown in Fig. 6.
TABLE II. GEOTEXTILE PROPERTIES
Properties ASTM method Quantity
Unit weight D-5261 500 gr/m2
Thickness D-5199 3.5 mm
Puncture strength D-4833 1100 N
Wide width tensilestrength D-4595 23.1 kN/m
0.10 1.00Grain Size (mm)
Toyoura
Sengenyama
Firouzkooh
Scientific Cooperations International Workshops on Engineering Branches 8-9 August 2014, Koc University, ISTANBUL/TURKEY
100
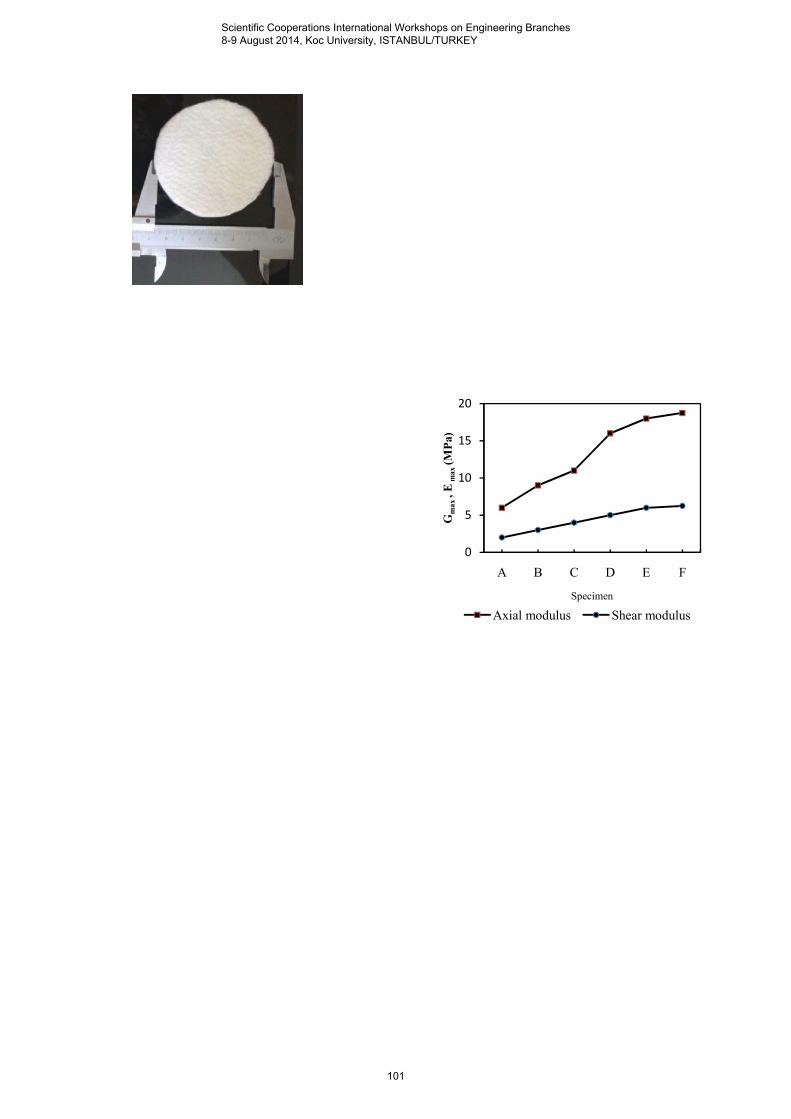
Fig. 6. Geotextile used.
III. EXPERIMENTAL PROCEDURE
A. Sample Preparation
The tests were performed on samples with aslenderness coefficient of 2, and a height of 14 cm. With adensity of 13 kN/m3, corresponding to a relative density of27%, the dry sand specimens were prepared by pouring thesand through a funnel in a mould by maintaining a constantfunnel height above the sand surface. Geosynthetic inclusionsof 7 cm diameter are placed horizontally in the sample as eachof the sand layers is formed. The specimens with differentgeotextile arrangement are shown in Fig. 7. After thespecimen has been formed, the specimen cap is placed andsealed with O-rings, and a partial vacuum of 35 kPa is appliedto the specimen to reduce the disturbances. Tubingconnections to the top and bottom specimen platens permitflow of water during saturation, consolidation andmeasurement of pore water pressure during cyclic loading.
B. Saturation and consolidationWhen the triaxial cell is assembled and filled with water,
an isotropic pressure of 10 kPa is applied. After circulating aflow of carbon dioxide (CO2) under a low pressure gradient(5kPa) through the sample for 7 min, water is circulated about30 min until the total quantity of water passing through thesample is at least equal to twice the initial volume of thesample. After this water percolation period, the effective stressacting on the sample is kept constant by a parallel increase inthe back pressure and cell pressure. The back pressure usedvaries from 10 to 90 kPa, which is sufficiently high to dissolvethe carbon dioxide and to obtain Skempton B coefficientsgreater than 0.95. Following saturation, the specimens areconsolidated isotropically at mean effective pressures 100 kPa.
After saturation and consolidation, the specimen issubjected to a sinusoidal varying axial load by means of theload rod connected to the specimen top platen. The cyclicload, specimen axial deformation, and pore water pressuredevelopment with time are monitored. The test is conductedunder undrained conditions to approximate essentiallyundrained field conditions during earthquake or otherdynamic. The cyclic loading generally causes an increase inthe pore water pressure in the specimen, resulting in a
decrease in the effective stress and an increase in the cyclicaxial deformation of the specimen.
The Cyclic triaxial tests are performed by applying asinusoidal stress deviator at a frequency f=2 Hz and bykeeping the confining pressure σcell, constant at 100 kPa.Cyclic Stress Ratio (CSR) is equal to 0.30 for all tests.
IV. RESULTS
The sand Firouzkuh #161 sand is used to construct thespecimens and to study shear modulus of reinforced sand.Undrained triaxial tests under dynamic loading condition onunreinforced and reinforced samples are performed withdifferent geotextile arrangement. It can be observed thatreinforcement lead to increase the shear and axial modulus ofsamples (Fig. 8). The reinforcement arrangement effect on theresults Gmax and Emax of these cyclic tests are analogous.Observed from aforementioned figure F-specimen (2 layergeotextile at H/3 and 2H/3 distances from top of sample)presented more Gmax – and axial modulus- compared to others.
Fig. 8. Maximum shear and axial modulus of specimen.
By comparison of B, C, D, and E arrangement describedthat as geotextile close to top of specimen (load applying part)the Gmax increased and E type (1 layer geotextile at H/5distance from top of specimen) of reinforcement arrangementtested lead to an significant increase in Gmax and Emax of thesand.
The variation of the G/Gmax for sand reinforced withdifferent arrangement of geotextile layer with respect toincreasing the shear strain is plotted in Fig. 9. As shown in thisfigure, the F specimen (2 layer geotextile reinforced) and A(unreinforced sample) presented brittle and ductile behavior,respectively. In other word by increasing Gmax of thespecimen, behavior varies from ductile to brittle, smoothly.
0
5
10
15
20
A B C D E F
Gm
ax, E
max
(MPa
)
Specimen
Axial modulus Shear modulus
Scientific Cooperations International Workshops on Engineering Branches 8-9 August 2014, Koc University, ISTANBUL/TURKEY
101

Fig. 9. G/Gmax vs. shear strain for different geotextile inclusion.
V. CONCLUSIONS
A series of undrained cyclic triaxial tests were conductedto investigate the arrangement of geotextile inclusion on theshear modulus of saturated sand. It has been brought out thatthe geotextile reinforcement plays a dominant role incontrolling the dynamic response. Based on this experimentalstudy, the main conclusions are summarized as follows:
Geotextile reinforcement increase the maximum shearmodulus of saturated sand and Gmax increased as the geotextilelayer increased.
As geotextile close to the top of the specimen (load applyingpart), the maximum shear modulus increased and byincreasing the space between geotextile and cap of the sample,the reinforcement effect on Gmax decreases.
The addition of geotextile inclusion changed its ductilebehavior to a more brittle one and specimen ductilitydecreased as the Gmax increased.
As explained the geotextile presence affect the Gmax and axialstiffness, significantly. Consequently, it is necessary toreinvestigate the geotextile arrangement carefully to calculatethe reinforced earth structure seismic responses morerealistically.
REFRENCES
[1] D.H. Gray, H. Ohashi, “Mechanics of fiber reinforcement in sand,”Journal of Geotechnical Engineering, 1983, vol. 109, pp. 335–353.[2] Y. Yoshimi, and F. Kuwabara, “Effect of sub surface liquefactionon the strength of surface soil,” Soils and Foundations. Tokyo, Japan,1973, vol.13, pp. 67-81[3] H.B. Seed, P. Martin, J. Lysmer, “Pore water pressure changesduring soil liquefaction,” Geotechnical. Engineering, ASCE, 1976, vol.102, pp. 323-345.[4] N.R. Krishnaswamy, and N.T. Isaac, “Liquefaction potential ofreinforced sand,” Geotextiles and Geomembranes, 1994, vol. 13, pp. 23-41[5] R. Noorzad and M. Omidvar,“Seismic displacement analysis ofembankment dams with reinforced cohesive shell,” Soil Dynamics andEarthquake Engineering, 2010, vol. 30, pp.1149–1157.
[6] H.T. Chen, W.Y. Hung, C. Chang, Y. Chen, and C.J. Lee,“Centrifuge modeling test of a geotextile-reinforced wall with a very wetclayey backfill ,” Geotextiles and Geomembranes, 2007, vol. 25, pp.346–359.[7] L. Wang, G. Zhang, J.M. Zhang, “Centrifuge model tests ofgeotextile-reinforced soil embankments during an earthquake,”Geotextiles and Geomembranes, 2011, vol.29, pp. 222-232[8] S.L. Kramer, Geotechnical earthquake engineering, Upper SaddleRiver, Prentice Hall, 1996.[9] F. Tatsuoka, S. Techavorasinkun, J.D.Y. Kohata, and T. Sato,“Importance of Measuring Local Strains in Cyclic Triaxial Tests onGranular Materials,” 1994, ASTM, 289.
00.10.20.30.40.50.60.70.80.9
1
0.1 1 10
G/G
max
Shear strain (%)
A
B
C
D
E
F
Scientific Cooperations International Workshops on Engineering Branches 8-9 August 2014, Koc University, ISTANBUL/TURKEY
102

Scientific Cooperations International Workshops on Engineering Branches 8-9 August 2014, Koc University, ISTANBUL/TURKEY
103