Embed Size (px)
Citation preview
Iran. J. Chem. Chem. Eng. Research Article Vol. 38, No. 6, 2019
Research Article 189
Influence of Operational Parameters and Kinetic Modelling
of Catalytic Wet Air Oxidation of Phenol
by Al/Zr Pillared Clay Catalyst
John, Moma*+; Jeffrey, Baloyi
Molecular Sciences Institute, School of Chemistry, University of the Witwatersrand, P/Bag 3, WITS 2050,
Johannesburg, SOUTH AFRICA
Thabang, Ntho
Advanced Materials Division, MINTEK, Private Bag X3015, Randburg 2125, SOUTH AFRICA
ABSTRACT: Single and mixed oxide Al/Zr-pillared clay (Al/Zr-PILC) catalysts were synthesized
and tested for catalytic wet air oxidation (CWAO) of aqueous phenol solution under milder
conditions, in a semi-batch reactor. The catalysts were synthesized from natural bentonite clay
using ultrasonic treatment during the aging and intercalation steps and were characterized
using High Resolution Scanning Electron Microscopy-Energy Dispersive angle X-ray spectrometry
(HRSEM-EDX), powder X-Ray Diffraction (p-XRD), nitrogen adsorption/desorption, Fourier
Transforms InfraRed (FT-IR) spectroscopy and zeta potential. Successful pillaring of aluminum
and zirconium oxides into the clay was confirmed by p-XRD with increased basal spacing (1.92 nm)
and higher specific surface area (230 m2/g). The influence of stirrer speed (200-1000 rpm), catalyst
dosage (1-3 g/L), initial pH (1-3), initial phenol concentration (500-1500 mg/L), the effect of
temperature (80-150 °C) and oxygen pressure (5-15 bar) was evaluated on phenol conversion
and their reaction kinetics. At the optimum conditions of initial pH of 3, catalyst dosage of 2 g/L, initial
phenol concentration of 1000 mg/L, reaction temperature of 100 °C and oxygen pressure of 10 bar,
the complete removal of phenol was achieved by Al/Zr-PILC within 120 min. The CWAO process
was well-described by the first-order power rate law kinetics model. The apparent activation energy
of the reaction calculated by Arrhenius equation was 21.306 kJ/mol.
KEYWORDS: Kinetic modeling; Al/Zr pillared clay; phenol removal; catalytic wet air oxidation.
INTRODUCTION
Wastewater containing phenol represent a threat
to human beings and aquatic life, being regenerated
by industrial processes such as petrochemicals, pharmaceuticals,
resin manufacturing and refineries in the range of
200-1500 mg/L [1, 2]. Since phenol is stable, refractory,
non-biodegradable, toxic to the living organism at very low
* To whom correspondence should be addressed.
+ E-mail: [email protected]
Other Address: Advanced Materials Division, MINTEK, Private Bag X3015, Randburg 2125, SOUTH AFRICA
1021-9986/2019/6/189-203 15/$/6.05
Iran. J. Chem. Chem. Eng. John M. et al. Vol. 38, No. 6, 2019
190 Research Article
concentration and poisonous to soil microbes, their
discharge into the environment without treatment poses
severe environmental and health problems. Given these
reasons, the treatment of phenol wastewater is important
before being released into the environment. Advanced
Oxidation Processes (AOPs) specifically Catalytic
Wet Air Oxidation (CWAO), appears as one of the preferred
feasible and effective methods for the removal of
non-biodegradable refractory organic compounds such as
phenol [3]. In general, CWAO is a liquid phase oxidation
process in which oxygen or air is used to oxidize
refractory organic compounds into carbon dioxide and
water in the presence of suitable solid catalyst, without
any toxic gaseous emission. CWAO process can be
operated at mild temperature and pressure conditions,
which are very attractive process economics.
Unfortunately, the lack of stable and active catalysts,
which results in high capital investment and high
operating costs limits the large-scale application of
CWAO.
Noble metal supported catalysts have been reported
to be active for the CWAO treatment of refractory organic
contaminants, however, the main disadvantage for these
catalysts are costs, deactivation, sintering, leaching and
deposition of carbonaceous material on the catalysts
surface [4, 5]. The use of Pillared Interlayered Clays (PILC)
as heterogeneous catalysts in CWAO has been proposed
due to their excellent physiochemical, abundant, low cost,
simplicity of the pillaring process and catalytic
properties. However, traditional process for synthesis of
PILC involves prolonged times (1-5 days) and large
amount of water (2 wt. % suspension), and such
requirements significantly hinder the scale-up of the
pillaring process to industrial scale [6, 7]. Many strategies
such as use of concentrated clay suspension, dry clay,
addition of dry clay to pillaring solutions have been
proposed as ways of overcoming the above-mentioned
problems. Microwave irradiation and ultrasonic treatment
during the synthesis of PILC, in which the aging and ion
exchange processes occur within minutes (5-30 minutes)
has also been reported. The use of mixed metal oxides for
the pillaring of the clay has been found to improve
properties of PILC compared to single metal oxide [7, 8].
However, CWAO process using PILC heterogeneous
catalysts is not only influenced by origin and features of
the catalysts but also the operational parameters used.
Therefore, in order to determine the feasibility of CWAO
for practical use, it is crucial to investigate influence of
operational parameters on the efficiency of CWAO
on the removal of refractory organic pollutants.
In this context, the objective of this study is
to synthesize single and mixed Al/Zr-PILC catalysts from
South African natural bentonite clay using ultrasonic
treatment during the pillaring and intercalation steps
and test them as heterogeneous catalysts for CWAO of
phenol. The influence of several significant operation
parameters such as stirrer speed, catalyst dosage, initial
pH, initial phenol concentration, reaction temperature
and oxygen pressure on the CWAO of phenol have also
been studied in detail.
EXPERIMENTAL SECTION
Catalyst synthesis
The starting material was natural clay from deposit of
Cape Town bentonite mine (Western Cape Province,
South Africa). The Cation Exchange Capacity (CEC) of
natural clay was 78.6 meq/g. The natural clay was used
as received without further purification. The pillaring agent
solution was prepared by the slow addition of a NaOH
solution (0.4 M, 500 mL) into a 250 mL of 0.4 M
Al(NO3)3·9H2O or Zr(NO3)4.5H2O at room temperature
under vigorous stirring for 120 min until an [OH-]/[Al3+
or Zr4+ or Al3+ + Zr4+] molar ratio of 2:1 was achieved.
The solution was then ultrasonicated for 10 min at 25 °C.
The resulting pillaring agent solution was then added
directly into dry bentonite clay, at ratio of 3.33 mmol of
(Al + Zr)/g sodium bentonite (25 mL pillaring solution/1 g)
and stirred at 25 °C for 30 min. The resulting dispersion
was ultrasonicated for 10 min at room temperature
to perform ion exchange, followed by filtering, washing
with high purity water (5 times with 200 mL portions)
and centrifuged at 4000 rpm for 8 min. The obtained
solids were oven-dried overnight at 120 °C and calcined
at 500 °C for 120 min in a muffle furnace.
Characterization of the catalysts
High resolution scanning electron microscopy
(HRTEM) was performed on a FEI Nova NanoSem 200
from FEI Company. The elemental analysis was performed
by EDX which was equipped to HRSEM. Powder
X-ray diffractograms (p-XRD) were recorded on a high
resolution Bruker AXS D8 X-ray advanced
Iran. J. Chem. Chem. Eng. Influence of Operational Parameters and Kinetic Modelling ... Vol. 38, No. 6, 2019
Research Article 191
powder diffractometer using CoKα-radiation (40 kV, 40 mA,
1.78897 Å) and scanning in the range of 2θ over 5 to
80° at scanning speed of 0.02˚/s. Brunauer−Emmett−
Teller (BET) specific surface areas, average pore
diameters, pore volumes and Barrett-Joiner-Halenda (BJH)
pore size distribution of the catalyst samples were determined
by N2 adsorption/desorption at −196 °C using a Micrometrics
ASAP Tristar 3000 unit. The samples were place in the
sample holder and degassed in a vacuum at 150 °C for
4 h before analysis. FTIR spectroscopic measurements
were performed on a Varian 640-IR FTIR spectrometer
with a Miracle single bounce diamond ATR cell from
PIKE Technologies. Zeta potential was determined by
Zetasizer Nano ZS (Malvern Instruments, UK) and the
Cation Exchange Capacity (CEC) was obtained using
Kjeldhal technique.
Catalytic oxidation of phenol solutions
The CWAO experiments were carried out in a 350 mL
high-pressure autoclave “semi-batch type” reactor
(Parr model 4531M) equipped with a magnetic stirrer
to eliminate mass transfer limitations of oxygen from
the gas to liquid phase. The reactor was fitted with
a removable glass lining and loaded with 250 mL
of aqueous phenol solution (500-1500 mg/L) at desired
initial pH over the range of 3-4 and a desired amount
of a catalyst (1-3 g/L). After reaching the adsorption/
desorption equilibrium, the reaction mixture inside the
reactor was purged with N2 and then heated to the desired
temperature between 80 to 150 °C. Once the desired
temperature was reached, pure oxygen pressure (5-15 bar)
was introduced into the reactor and a first sample
was withdrawn for analysis in which it was set as “zero
time”. Thereafter, liquid samples were withdrawn at
regular time intervals by a syringe and immediately
filtered by 0.45 μm pore size nylon micro filter
into a HPLC vial. All experiments were conducted in
triplicate and the average data used. The concentrations
of phenol were analyzed with an HPLC system (LC-10AD,
Shimadzu, Kyoto, Japan) using an ODS-3 column
and UV detector at a detection wavelength of 254 nm.
The mobile phase was a mixture of methanol and water
(60:40, v/v) slightly acidified with 0.1% acetic acid
at a flow rate of 1 mL/min and 20 µL injection volume.
The evolution of phenol intermediates during the reaction
were analysed by HPLC following the method described
by Ma et al. [9]. Total organic carbon (TOC) was measured
to determine the mineralization degree of phenol by
a Shimadzu TOC analyzer.
Kinetic study
The CWAO reaction kinetics for the phenol oxidation
reaction is required to provide complete interpretation
of the data obtained in the semi-batch reactor. Many
researchers [2, 3, 10, 11] in the literature have described
the oxidation rates of phenol oxidation using a simple
power law expression. All experimental data were fitted
to a power rate law and represented by the following
equation:
ph aa O ph
dCr k C C
dt
21 (1)
Where ra is the rate of phenol oxidation reaction;
α is the reaction order with respect to phenol; Co2 is
the oxygen concentration; k1 is the intrinsic reaction rate
constant. Assuming a constant concentration of oxygen,
the power rate law becomes
ph aap ph
dCk C
dt (2)
The majority of authors previously reported that
the CWAO of pure phenol oxidation reaction follows
first-order kinetics with respect to the phenol concentration
[2, 3, 12-16]. Assuming a first order reaction with respect
to phenol concentration, Equation 2 can be integrated
for α = 1 to become:
ph apln C k t (3)
ph
apph
Cln k t
C
0
(4)
Where kat (min-1) is the apparent first-order kinetic
rate constant, which can be determined from the slope of
ph
ph
Cln
C
0
versus t, Cph and C0 ph represent both
the final and initial concentration of phenol, respectively.
Activation energy
Assuming an Arrhenius dependence of temperature,
apparent activation energy of phenol conversion
can be expressed as follows
Iran. J. Chem. Chem. Eng. John M. et al. Vol. 38, No. 6, 2019
192 Research Article
aap
Ek k exp
RT
0 (5)
Eq. (5) can be written in the logarithmic form:
aap
Eln k ln k
RT 0 (6)
Where Ea is apparent activation energy (kJ/mol); ko is
pre-exponential factor (min-1); kap is apparent reaction
rate constant (min-1); T is the reaction temperature (K);
R is the universal gas constant (8.314 J/mol K).
RESULTS AND DISCUSSION
Catalysts characterization
The chemical composition of natural clay and pillared
clay catalysts, as determined by EDS, are reported
in Table 1S in the supplementary materials. The chemical
weight composition of natural clay confirms SiO2 and
Al2O3 as the major constituents of the natural clay with
other mineral oxides impurities such as Na2O, CaO,
MgO, K2O and Fe2O3. The high content of Si and Al
oxides revealed the existence of quartz and muscovite,
whereas the high content oxides of Na compared to Ca
confirmed that the natural bentonite is in the sodium form
(Na+) [17, 18]. After the pillaring process the aluminium
and zirconium oxides content in the pillared clay catalysts
increased from 15.31 to 31.98 wt% and from 0 to 38.19 wt%
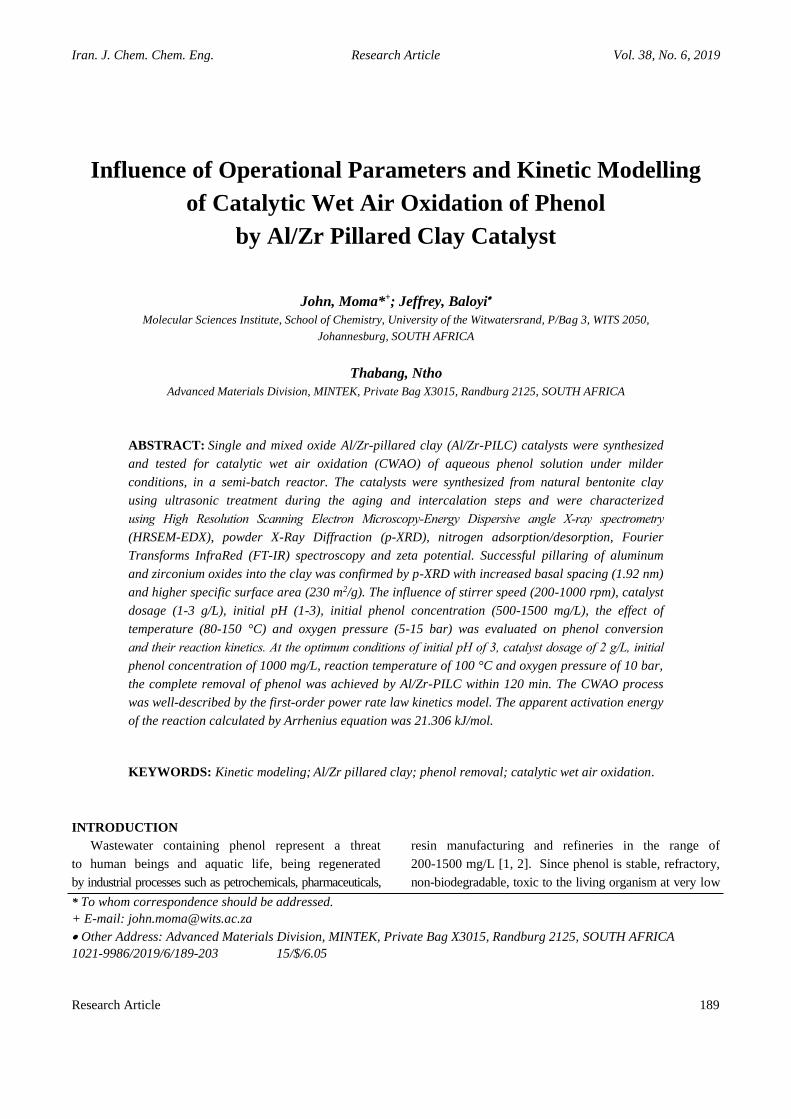
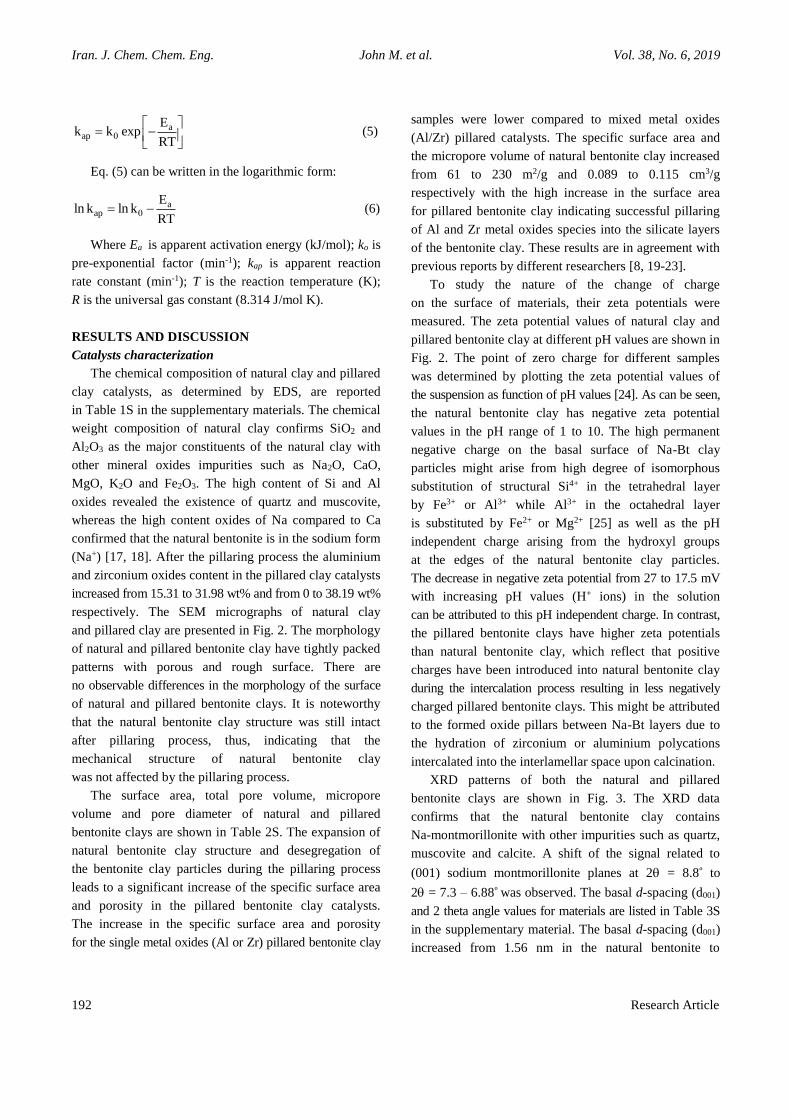
respectively. The SEM micrographs of natural clay
and pillared clay are presented in Fig. 2. The morphology
of natural and pillared bentonite clay have tightly packed
patterns with porous and rough surface. There are
no observable differences in the morphology of the surface
of natural and pillared bentonite clays. It is noteworthy
that the natural bentonite clay structure was still intact
after pillaring process, thus, indicating that the
mechanical structure of natural bentonite clay
was not affected by the pillaring process.
The surface area, total pore volume, micropore
volume and pore diameter of natural and pillared
bentonite clays are shown in Table 2S. The expansion of
natural bentonite clay structure and desegregation of
the bentonite clay particles during the pillaring process
leads to a significant increase of the specific surface area
and porosity in the pillared bentonite clay catalysts.
The increase in the specific surface area and porosity
for the single metal oxides (Al or Zr) pillared bentonite clay
samples were lower compared to mixed metal oxides
(Al/Zr) pillared catalysts. The specific surface area and
the micropore volume of natural bentonite clay increased
from 61 to 230 m2/g and 0.089 to 0.115 cm3/g
respectively with the high increase in the surface area
for pillared bentonite clay indicating successful pillaring
of Al and Zr metal oxides species into the silicate layers
of the bentonite clay. These results are in agreement with
previous reports by different researchers [8, 19-23].
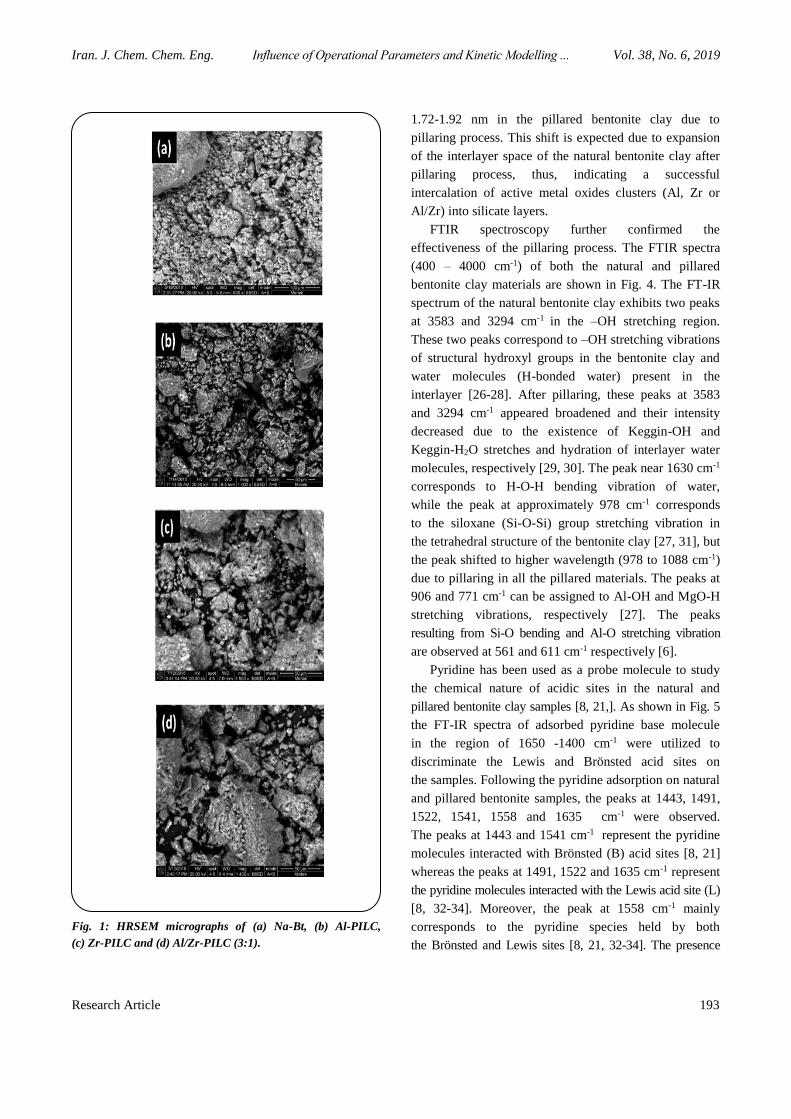
To study the nature of the change of charge
on the surface of materials, their zeta potentials were
measured. The zeta potential values of natural clay and
pillared bentonite clay at different pH values are shown in
Fig. 2. The point of zero charge for different samples
was determined by plotting the zeta potential values of
the suspension as function of pH values [24]. As can be seen,
the natural bentonite clay has negative zeta potential
values in the pH range of 1 to 10. The high permanent
negative charge on the basal surface of Na-Bt clay
particles might arise from high degree of isomorphous
substitution of structural Si4+ in the tetrahedral layer
by Fe3+ or Al3+ while Al3+ in the octahedral layer
is substituted by Fe2+ or Mg2+ [25] as well as the pH
independent charge arising from the hydroxyl groups
at the edges of the natural bentonite clay particles.
The decrease in negative zeta potential from 27 to 17.5 mV
with increasing pH values (H+ ions) in the solution
can be attributed to this pH independent charge. In contrast,
the pillared bentonite clays have higher zeta potentials
than natural bentonite clay, which reflect that positive
charges have been introduced into natural bentonite clay
during the intercalation process resulting in less negatively
charged pillared bentonite clays. This might be attributed
to the formed oxide pillars between Na-Bt layers due to
the hydration of zirconium or aluminium polycations
intercalated into the interlamellar space upon calcination.
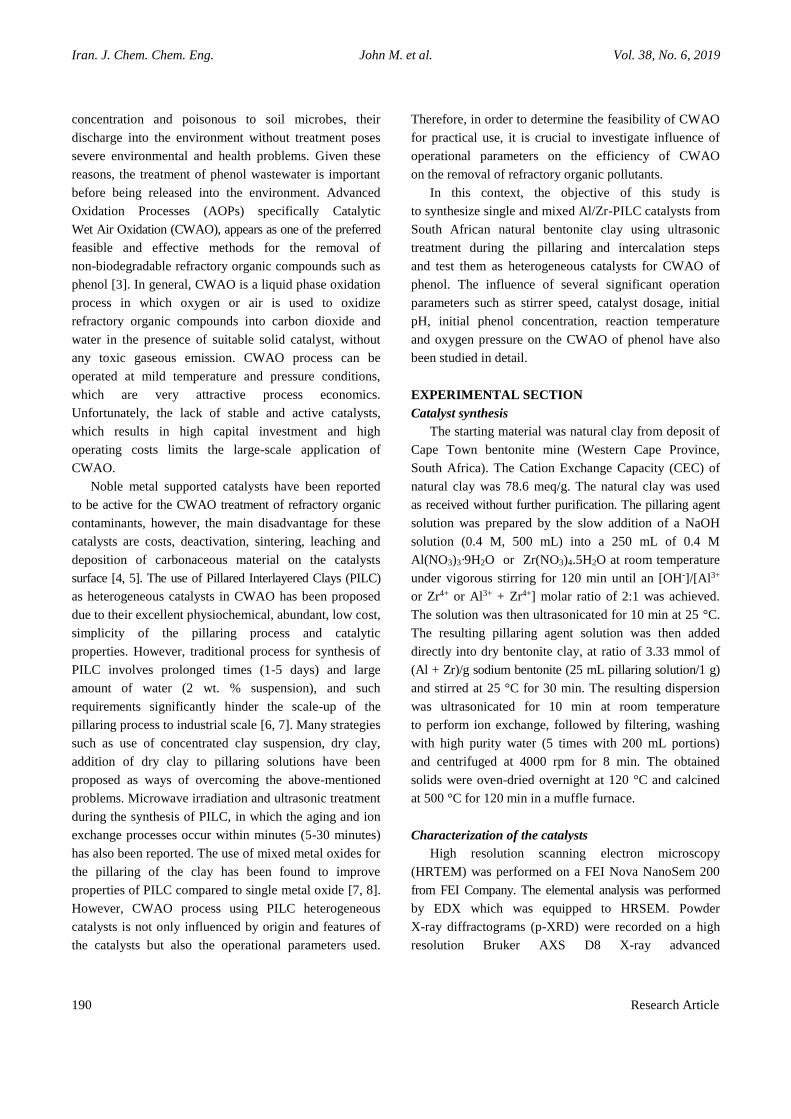
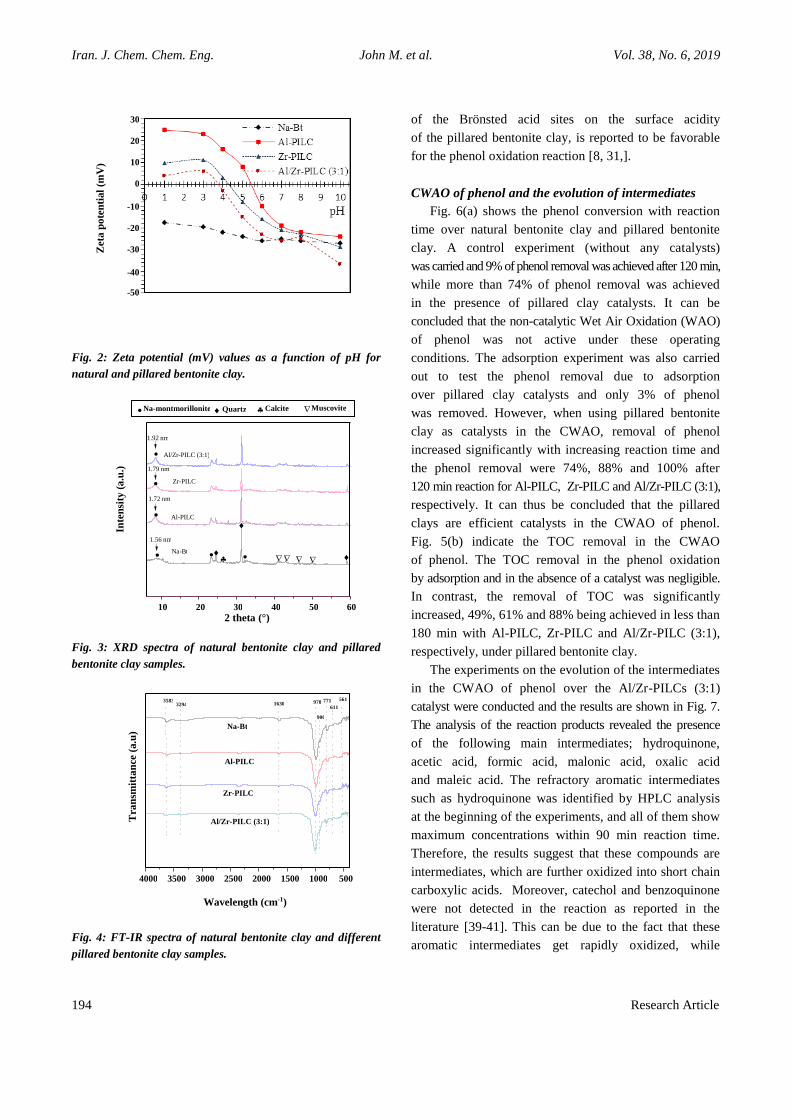
XRD patterns of both the natural and pillared
bentonite clays are shown in Fig. 3. The XRD data
confirms that the natural bentonite clay contains
Na-montmorillonite with other impurities such as quartz,
muscovite and calcite. A shift of the signal related to
(001) sodium montmorillonite planes at 2 = 8.8ᵒ to
2 = 7.3 – 6.88ᵒ was observed. The basal d-spacing (d001)
and 2 theta angle values for materials are listed in Table 3S
in the supplementary material. The basal d-spacing (d001)
increased from 1.56 nm in the natural bentonite to
Iran. J. Chem. Chem. Eng. Influence of Operational Parameters and Kinetic Modelling ... Vol. 38, No. 6, 2019
Research Article 193
Fig. 1: HRSEM micrographs of (a) Na-Bt, (b) Al-PILC,
(c) Zr-PILC and (d) Al/Zr-PILC (3:1).
1.72-1.92 nm in the pillared bentonite clay due to
pillaring process. This shift is expected due to expansion
of the interlayer space of the natural bentonite clay after
pillaring process, thus, indicating a successful
intercalation of active metal oxides clusters (Al, Zr or
Al/Zr) into silicate layers.
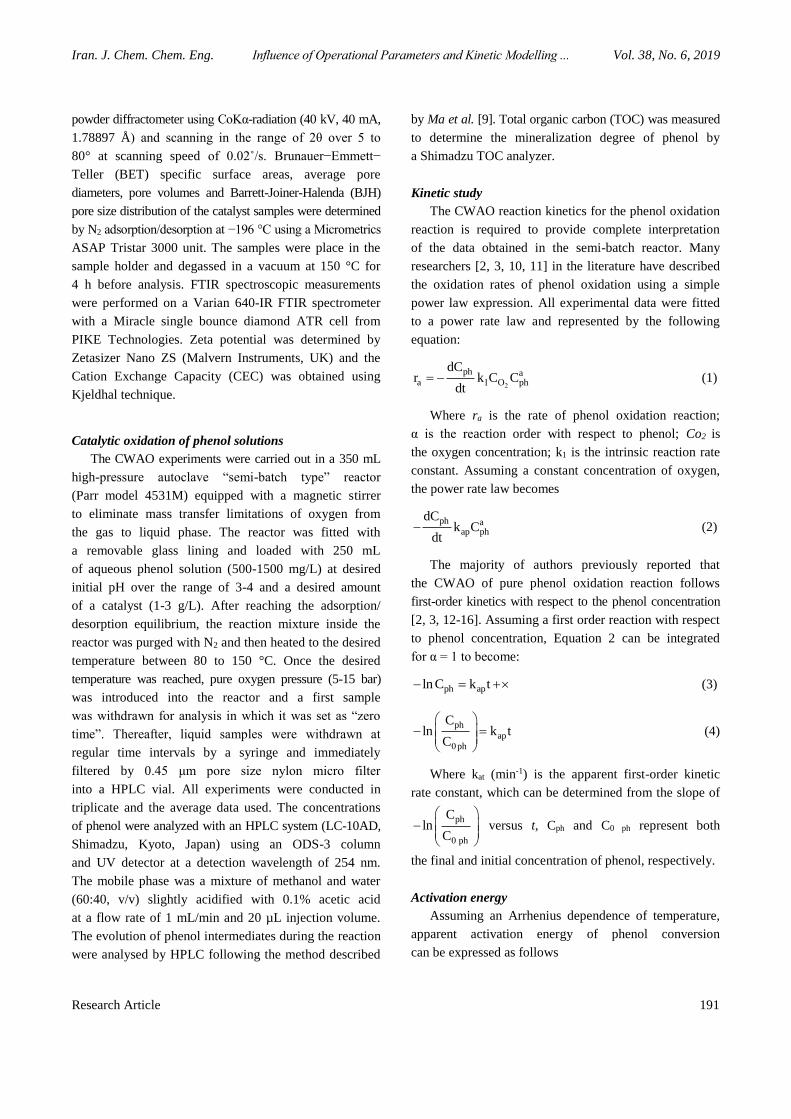
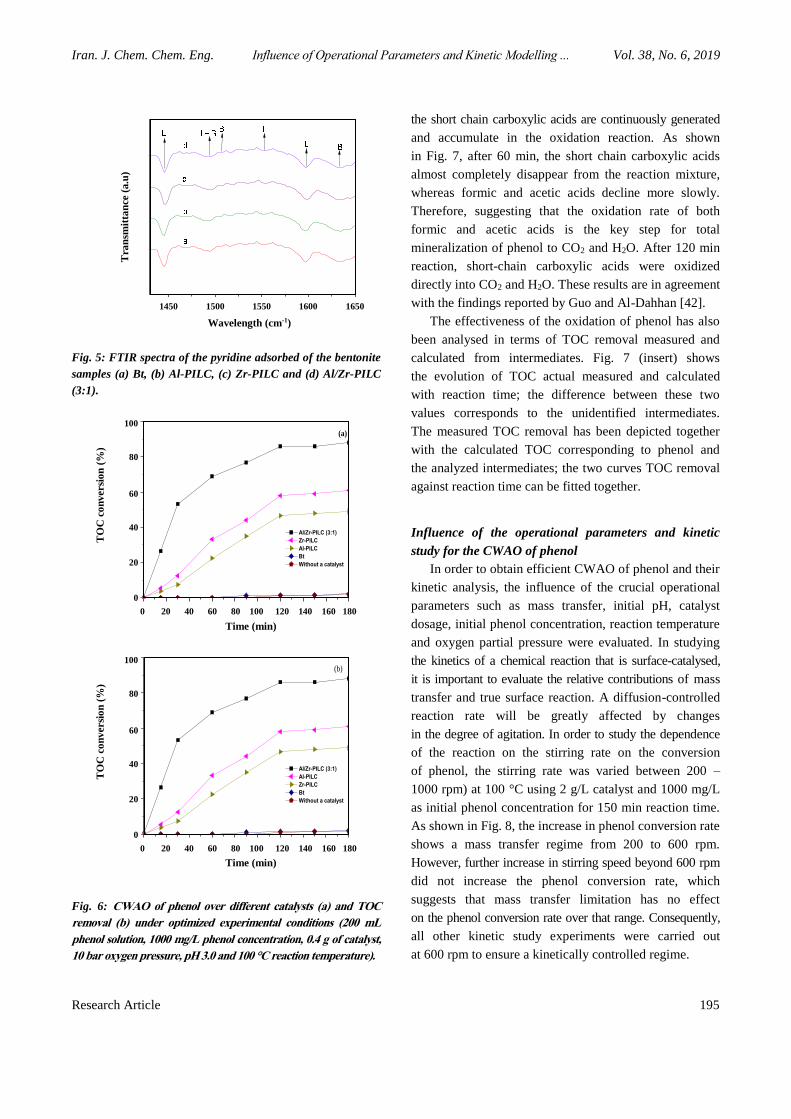
FTIR spectroscopy further confirmed the
effectiveness of the pillaring process. The FTIR spectra
(400 – 4000 cm-1) of both the natural and pillared
bentonite clay materials are shown in Fig. 4. The FT-IR
spectrum of the natural bentonite clay exhibits two peaks
at 3583 and 3294 cm-1 in the –OH stretching region.
These two peaks correspond to –OH stretching vibrations
of structural hydroxyl groups in the bentonite clay and
water molecules (H-bonded water) present in the
interlayer [26-28]. After pillaring, these peaks at 3583
and 3294 cm-1 appeared broadened and their intensity
decreased due to the existence of Keggin-OH and
Keggin-H2O stretches and hydration of interlayer water
molecules, respectively [29, 30]. The peak near 1630 cm-1
corresponds to H-O-H bending vibration of water,
while the peak at approximately 978 cm-1 corresponds
to the siloxane (Si-O-Si) group stretching vibration in
the tetrahedral structure of the bentonite clay [27, 31], but
the peak shifted to higher wavelength (978 to 1088 cm-1)
due to pillaring in all the pillared materials. The peaks at
906 and 771 cm-1 can be assigned to Al-OH and MgO-H
stretching vibrations, respectively [27]. The peaks
resulting from Si-O bending and Al-O stretching vibration
are observed at 561 and 611 cm-1 respectively [6].
Pyridine has been used as a probe molecule to study
the chemical nature of acidic sites in the natural and
pillared bentonite clay samples [8, 21,]. As shown in Fig. 5
the FT-IR spectra of adsorbed pyridine base molecule
in the region of 1650 -1400 cm-1 were utilized to
discriminate the Lewis and Brönsted acid sites on
the samples. Following the pyridine adsorption on natural
and pillared bentonite samples, the peaks at 1443, 1491,
1522, 1541, 1558 and 1635 cm-1 were observed.
The peaks at 1443 and 1541 cm-1 represent the pyridine
molecules interacted with Brönsted (B) acid sites [8, 21]
whereas the peaks at 1491, 1522 and 1635 cm-1 represent
the pyridine molecules interacted with the Lewis acid site (L)
[8, 32-34]. Moreover, the peak at 1558 cm-1 mainly
corresponds to the pyridine species held by both
the Brönsted and Lewis sites [8, 21, 32-34]. The presence
Iran. J. Chem. Chem. Eng. John M. et al. Vol. 38, No. 6, 2019
194 Research Article
Fig. 2: Zeta potential (mV) values as a function of pH for
natural and pillared bentonite clay.
Fig. 3: XRD spectra of natural bentonite clay and pillared
bentonite clay samples.
Fig. 4: FT-IR spectra of natural bentonite clay and different
pillared bentonite clay samples.
of the Brönsted acid sites on the surface acidity
of the pillared bentonite clay, is reported to be favorable
for the phenol oxidation reaction [8, 31,].
CWAO of phenol and the evolution of intermediates
Fig. 6(a) shows the phenol conversion with reaction
time over natural bentonite clay and pillared bentonite
clay. A control experiment (without any catalysts)
was carried and 9% of phenol removal was achieved after 120 min,
while more than 74% of phenol removal was achieved
in the presence of pillared clay catalysts. It can be
concluded that the non-catalytic Wet Air Oxidation (WAO)
of phenol was not active under these operating
conditions. The adsorption experiment was also carried
out to test the phenol removal due to adsorption
over pillared clay catalysts and only 3% of phenol
was removed. However, when using pillared bentonite
clay as catalysts in the CWAO, removal of phenol
increased significantly with increasing reaction time and
the phenol removal were 74%, 88% and 100% after
120 min reaction for Al-PILC, Zr-PILC and Al/Zr-PILC (3:1),
respectively. It can thus be concluded that the pillared
clays are efficient catalysts in the CWAO of phenol.
Fig. 5(b) indicate the TOC removal in the CWAO
of phenol. The TOC removal in the phenol oxidation
by adsorption and in the absence of a catalyst was negligible.
In contrast, the removal of TOC was significantly
increased, 49%, 61% and 88% being achieved in less than
180 min with Al-PILC, Zr-PILC and Al/Zr-PILC (3:1),
respectively, under pillared bentonite clay.
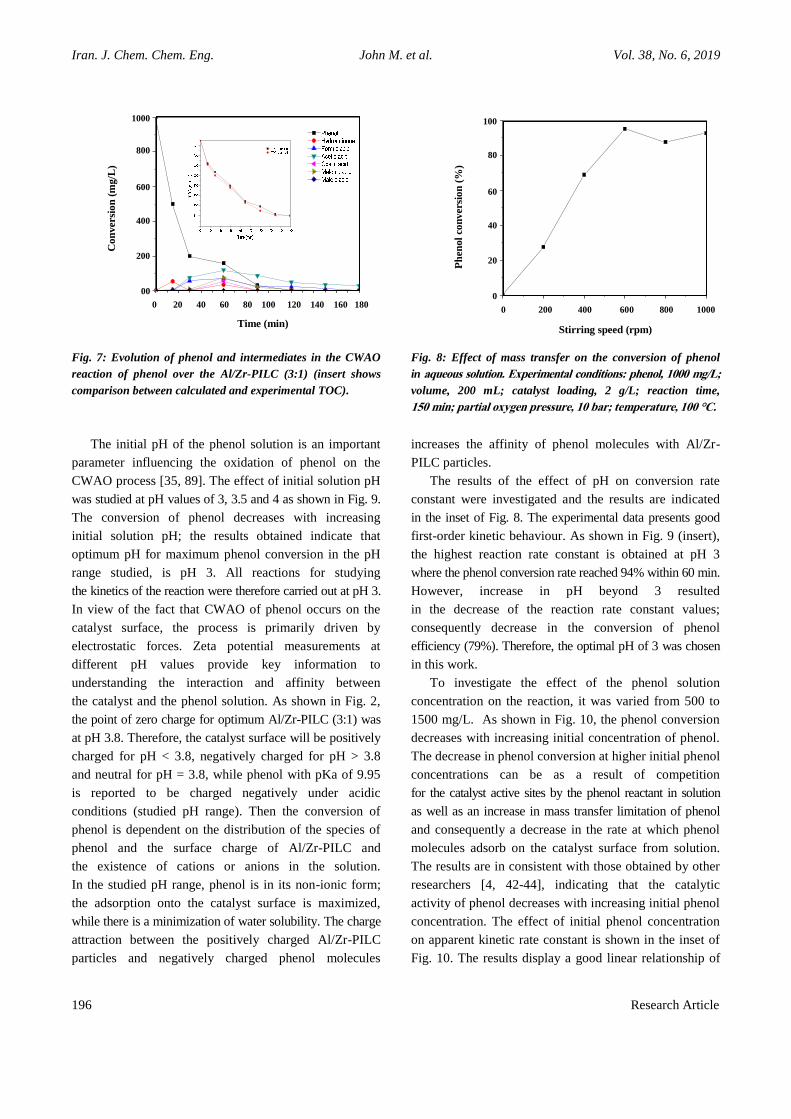
The experiments on the evolution of the intermediates
in the CWAO of phenol over the Al/Zr-PILCs (3:1)
catalyst were conducted and the results are shown in Fig. 7.
The analysis of the reaction products revealed the presence
of the following main intermediates; hydroquinone,
acetic acid, formic acid, malonic acid, oxalic acid
and maleic acid. The refractory aromatic intermediates
such as hydroquinone was identified by HPLC analysis
at the beginning of the experiments, and all of them show
maximum concentrations within 90 min reaction time.
Therefore, the results suggest that these compounds are
intermediates, which are further oxidized into short chain
carboxylic acids. Moreover, catechol and benzoquinone
were not detected in the reaction as reported in the
literature [39-41]. This can be due to the fact that these
aromatic intermediates get rapidly oxidized, while
10 20 30 40 50 60
1.56 nm
1.72 nm
1.79 nm
Na-Bt
Al-PILC
Zr-PILC
Al/Zr-PILC (3:1)
Inte
nsi
ty (
a.u
.)
1.92 nm
2 theta (°)
Na-montmorillonite Quartz Calcite Muscovite
Na-Bt
Al-PILC
Zr-PILC
3583 3294 978
906 771
611 561
1630
4000 3500 3000 2500 2000 1500 1000 500
Al/Zr-PILC (3:1) Tra
nsm
itta
nce
(a.u
)
Wavelength (cm-1)
Zeta
po
ten
tial
(mV
)
30
20
10
0
-10
-20
-30
-40
-50
Iran. J. Chem. Chem. Eng. Influence of Operational Parameters and Kinetic Modelling ... Vol. 38, No. 6, 2019
Research Article 195
Fig. 5: FTIR spectra of the pyridine adsorbed of the bentonite
samples (a) Bt, (b) Al-PILC, (c) Zr-PILC and (d) Al/Zr-PILC
(3:1).
Fig. 6: CWAO of phenol over different catalysts (a) and TOC
removal (b) under optimized experimental conditions (200 mL
phenol solution, 1000 mg/L phenol concentration, 0.4 g of catalyst,
10 bar oxygen pressure, pH 3.0 and 100 °C reaction temperature).
the short chain carboxylic acids are continuously generated
and accumulate in the oxidation reaction. As shown
in Fig. 7, after 60 min, the short chain carboxylic acids
almost completely disappear from the reaction mixture,
whereas formic and acetic acids decline more slowly.
Therefore, suggesting that the oxidation rate of both
formic and acetic acids is the key step for total
mineralization of phenol to CO2 and H2O. After 120 min
reaction, short-chain carboxylic acids were oxidized
directly into CO2 and H2O. These results are in agreement
with the findings reported by Guo and Al-Dahhan [42].
The effectiveness of the oxidation of phenol has also
been analysed in terms of TOC removal measured and
calculated from intermediates. Fig. 7 (insert) shows
the evolution of TOC actual measured and calculated
with reaction time; the difference between these two
values corresponds to the unidentified intermediates.
The measured TOC removal has been depicted together
with the calculated TOC corresponding to phenol and
the analyzed intermediates; the two curves TOC removal
against reaction time can be fitted together.
Influence of the operational parameters and kinetic
study for the CWAO of phenol
In order to obtain efficient CWAO of phenol and their
kinetic analysis, the influence of the crucial operational
parameters such as mass transfer, initial pH, catalyst
dosage, initial phenol concentration, reaction temperature
and oxygen partial pressure were evaluated. In studying
the kinetics of a chemical reaction that is surface-catalysed,
it is important to evaluate the relative contributions of mass
transfer and true surface reaction. A diffusion-controlled
reaction rate will be greatly affected by changes
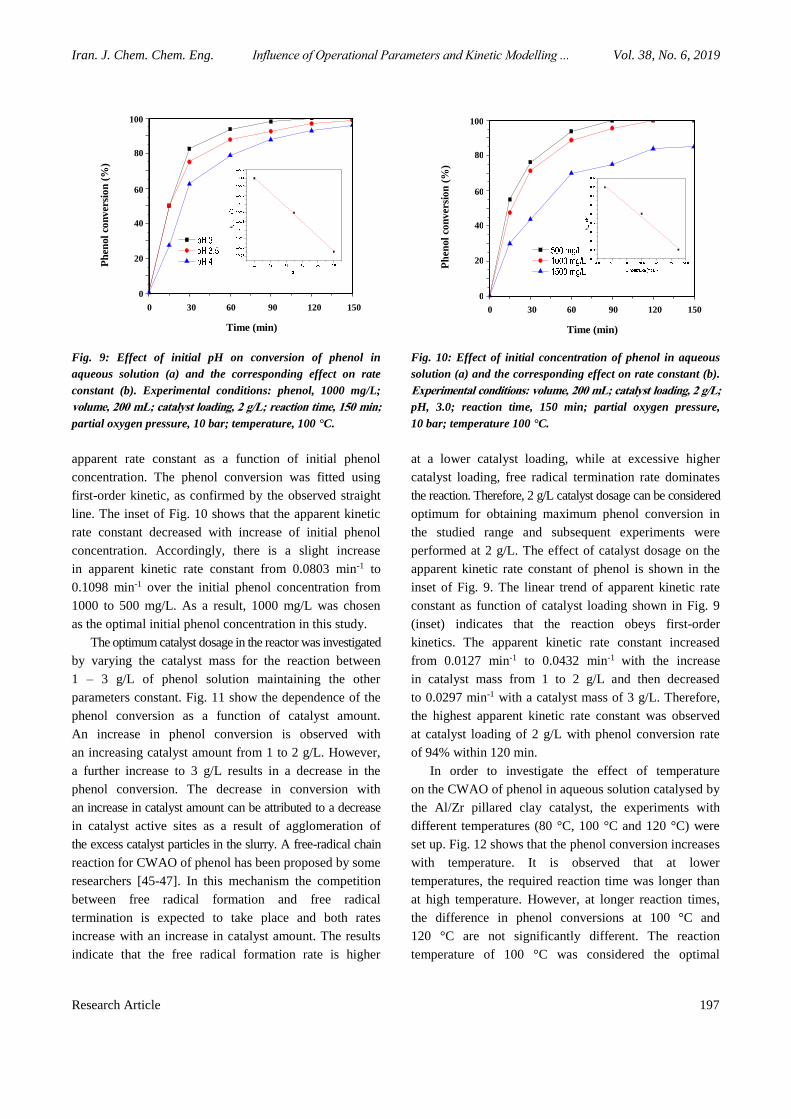
in the degree of agitation. In order to study the dependence
of the reaction on the stirring rate on the conversion
of phenol, the stirring rate was varied between 200 –
1000 rpm) at 100 °C using 2 g/L catalyst and 1000 mg/L
as initial phenol concentration for 150 min reaction time.
As shown in Fig. 8, the increase in phenol conversion rate
shows a mass transfer regime from 200 to 600 rpm.
However, further increase in stirring speed beyond 600 rpm
did not increase the phenol conversion rate, which
suggests that mass transfer limitation has no effect
on the phenol conversion rate over that range. Consequently,
all other kinetic study experiments were carried out
at 600 rpm to ensure a kinetically controlled regime.
Tra
ns
mit
tan
ce
(a
.u)
Wavelength (cm-1
)
TO
C c
on
versio
n (
%)
Time (min)
Al/Zr-PILC (3:1)
Zr-PILC
Al-PILC
Bt
Without a catalyst
(a)
TO
C c
on
versio
n (
%)
Time (min)
Al/Zr-PILC (3:1)
Al-PILC
Zr-PILC
Bt
Without a catalyst
(b)
1450 1500 1550 1600 1650
Wavelength (cm-1)
Tra
nsm
itta
nce
(a.u
)
0 20 40 60 80 100 120 140 160 180
Time (min)
TO
C c
on
versi
on
(%
)
100
80
60
40
20
0
0 20 40 60 80 100 120 140 160 180
Time (min)
TO
C c
on
versi
on
(%
)
100
80
60
40
20
0
Iran. J. Chem. Chem. Eng. John M. et al. Vol. 38, No. 6, 2019
196 Research Article
Fig. 7: Evolution of phenol and intermediates in the CWAO
reaction of phenol over the Al/Zr-PILC (3:1) (insert shows
comparison between calculated and experimental TOC).
Fig. 8: Effect of mass transfer on the conversion of phenol
in aqueous solution. Experimental conditions: phenol, 1000 mg/L;
volume, 200 mL; catalyst loading, 2 g/L; reaction time,
150 min; partial oxygen pressure, 10 bar; temperature, 100 °C.
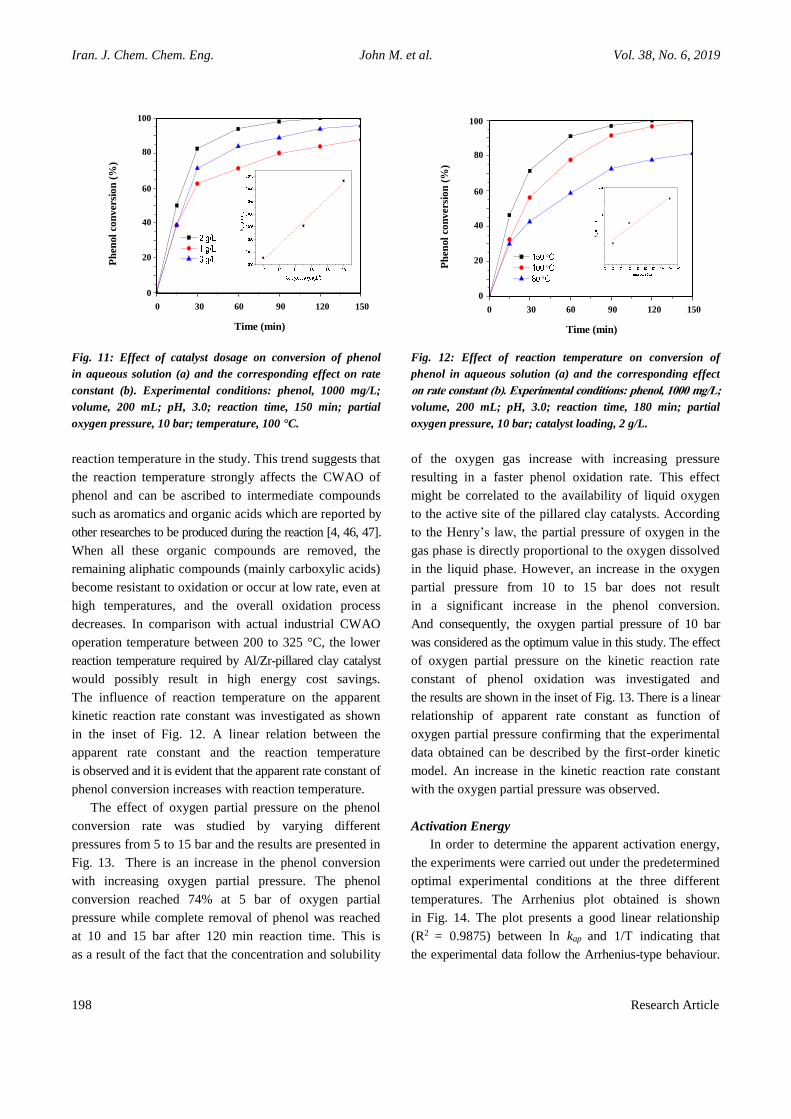
The initial pH of the phenol solution is an important
parameter influencing the oxidation of phenol on the
CWAO process [35, 89]. The effect of initial solution pH
was studied at pH values of 3, 3.5 and 4 as shown in Fig. 9.
The conversion of phenol decreases with increasing
initial solution pH; the results obtained indicate that
optimum pH for maximum phenol conversion in the pH
range studied, is pH 3. All reactions for studying
the kinetics of the reaction were therefore carried out at pH 3.
In view of the fact that CWAO of phenol occurs on the
catalyst surface, the process is primarily driven by
electrostatic forces. Zeta potential measurements at
different pH values provide key information to
understanding the interaction and affinity between
the catalyst and the phenol solution. As shown in Fig. 2,
the point of zero charge for optimum Al/Zr-PILC (3:1) was
at pH 3.8. Therefore, the catalyst surface will be positively
charged for pH < 3.8, negatively charged for pH > 3.8
and neutral for pH = 3.8, while phenol with pKa of 9.95
is reported to be charged negatively under acidic
conditions (studied pH range). Then the conversion of
phenol is dependent on the distribution of the species of
phenol and the surface charge of Al/Zr-PILC and
the existence of cations or anions in the solution.
In the studied pH range, phenol is in its non-ionic form;
the adsorption onto the catalyst surface is maximized,
while there is a minimization of water solubility. The charge
attraction between the positively charged Al/Zr-PILC
particles and negatively charged phenol molecules
increases the affinity of phenol molecules with Al/Zr-
PILC particles.
The results of the effect of pH on conversion rate
constant were investigated and the results are indicated
in the inset of Fig. 8. The experimental data presents good
first-order kinetic behaviour. As shown in Fig. 9 (insert),
the highest reaction rate constant is obtained at pH 3
where the phenol conversion rate reached 94% within 60 min.
However, increase in pH beyond 3 resulted
in the decrease of the reaction rate constant values;
consequently decrease in the conversion of phenol
efficiency (79%). Therefore, the optimal pH of 3 was chosen
in this work.
To investigate the effect of the phenol solution
concentration on the reaction, it was varied from 500 to
1500 mg/L. As shown in Fig. 10, the phenol conversion
decreases with increasing initial concentration of phenol.
The decrease in phenol conversion at higher initial phenol
concentrations can be as a result of competition
for the catalyst active sites by the phenol reactant in solution
as well as an increase in mass transfer limitation of phenol
and consequently a decrease in the rate at which phenol
molecules adsorb on the catalyst surface from solution.
The results are in consistent with those obtained by other
researchers [4, 42-44], indicating that the catalytic
activity of phenol decreases with increasing initial phenol
concentration. The effect of initial phenol concentration
on apparent kinetic rate constant is shown in the inset of
Fig. 10. The results display a good linear relationship of
Con
versio
n (m
gL
-1)
Time (min)
Ph
en
ol
con
versio
n (
%)
Stirring speed (rpm)
0 20 40 60 80 100 120 140 160 180
Time (min)
Co
nversi
on
(m
g/L
) 1000
800
600
400
200
00
0 200 400 600 800 1000
Stirring speed (rpm)
Ph
enol
con
vers
ion
(%
)
100
80
60
40
20
0
Iran. J. Chem. Chem. Eng. Influence of Operational Parameters and Kinetic Modelling ... Vol. 38, No. 6, 2019
Research Article 197
Fig. 9: Effect of initial pH on conversion of phenol in
aqueous solution (a) and the corresponding effect on rate
constant (b). Experimental conditions: phenol, 1000 mg/L;
volume, 200 mL; catalyst loading, 2 g/L; reaction time, 150 min;
partial oxygen pressure, 10 bar; temperature, 100 °C.
Fig. 10: Effect of initial concentration of phenol in aqueous
solution (a) and the corresponding effect on rate constant (b).
Experimental conditions: volume, 200 mL; catalyst loading, 2 g/L;
pH, 3.0; reaction time, 150 min; partial oxygen pressure,
10 bar; temperature 100 °C.
apparent rate constant as a function of initial phenol
concentration. The phenol conversion was fitted using
first-order kinetic, as confirmed by the observed straight
line. The inset of Fig. 10 shows that the apparent kinetic
rate constant decreased with increase of initial phenol
concentration. Accordingly, there is a slight increase
in apparent kinetic rate constant from 0.0803 min-1 to
0.1098 min-1 over the initial phenol concentration from
1000 to 500 mg/L. As a result, 1000 mg/L was chosen
as the optimal initial phenol concentration in this study.
The optimum catalyst dosage in the reactor was investigated
by varying the catalyst mass for the reaction between
1 – 3 g/L of phenol solution maintaining the other
parameters constant. Fig. 11 show the dependence of the
phenol conversion as a function of catalyst amount.
An increase in phenol conversion is observed with
an increasing catalyst amount from 1 to 2 g/L. However,
a further increase to 3 g/L results in a decrease in the
phenol conversion. The decrease in conversion with
an increase in catalyst amount can be attributed to a decrease
in catalyst active sites as a result of agglomeration of
the excess catalyst particles in the slurry. A free-radical chain
reaction for CWAO of phenol has been proposed by some
researchers [45-47]. In this mechanism the competition
between free radical formation and free radical
termination is expected to take place and both rates
increase with an increase in catalyst amount. The results
indicate that the free radical formation rate is higher
at a lower catalyst loading, while at excessive higher
catalyst loading, free radical termination rate dominates
the reaction. Therefore, 2 g/L catalyst dosage can be considered
optimum for obtaining maximum phenol conversion in
the studied range and subsequent experiments were
performed at 2 g/L. The effect of catalyst dosage on the
apparent kinetic rate constant of phenol is shown in the
inset of Fig. 9. The linear trend of apparent kinetic rate
constant as function of catalyst loading shown in Fig. 9
(inset) indicates that the reaction obeys first-order
kinetics. The apparent kinetic rate constant increased
from 0.0127 min-1 to 0.0432 min-1 with the increase
in catalyst mass from 1 to 2 g/L and then decreased
to 0.0297 min-1 with a catalyst mass of 3 g/L. Therefore,
the highest apparent kinetic rate constant was observed
at catalyst loading of 2 g/L with phenol conversion rate
of 94% within 120 min.
In order to investigate the effect of temperature
on the CWAO of phenol in aqueous solution catalysed by
the Al/Zr pillared clay catalyst, the experiments with
different temperatures (80 °C, 100 °C and 120 °C) were
set up. Fig. 12 shows that the phenol conversion increases
with temperature. It is observed that at lower
temperatures, the required reaction time was longer than
at high temperature. However, at longer reaction times,
the difference in phenol conversions at 100 °C and
120 °C are not significantly different. The reaction
temperature of 100 °C was considered the optimal
k
Ph
en
ol
con
versio
n (
%)
Time (min)
k
Ph
en
ol
con
versio
n (
%)
Time (min)0 30 60 90 120 150
Time (min)
Ph
enol
con
vers
ion
(%
)
100
80
60
40
20
0
0 30 60 90 120 150
Time (min)
Ph
enol
con
vers
ion
(%
)
100
80
60
40
20
0
Iran. J. Chem. Chem. Eng. John M. et al. Vol. 38, No. 6, 2019
198 Research Article
Fig. 11: Effect of catalyst dosage on conversion of phenol
in aqueous solution (a) and the corresponding effect on rate
constant (b). Experimental conditions: phenol, 1000 mg/L;
volume, 200 mL; pH, 3.0; reaction time, 150 min; partial
oxygen pressure, 10 bar; temperature, 100 °C.
Fig. 12: Effect of reaction temperature on conversion of
phenol in aqueous solution (a) and the corresponding effect
on rate constant (b). Experimental conditions: phenol, 1000 mg/L;
volume, 200 mL; pH, 3.0; reaction time, 180 min; partial
oxygen pressure, 10 bar; catalyst loading, 2 g/L.
reaction temperature in the study. This trend suggests that
the reaction temperature strongly affects the CWAO of
phenol and can be ascribed to intermediate compounds
such as aromatics and organic acids which are reported by
other researches to be produced during the reaction [4, 46, 47].
When all these organic compounds are removed, the
remaining aliphatic compounds (mainly carboxylic acids)
become resistant to oxidation or occur at low rate, even at
high temperatures, and the overall oxidation process
decreases. In comparison with actual industrial CWAO
operation temperature between 200 to 325 °C, the lower
reaction temperature required by Al/Zr-pillared clay catalyst
would possibly result in high energy cost savings.
The influence of reaction temperature on the apparent
kinetic reaction rate constant was investigated as shown
in the inset of Fig. 12. A linear relation between the
apparent rate constant and the reaction temperature
is observed and it is evident that the apparent rate constant of
phenol conversion increases with reaction temperature.
The effect of oxygen partial pressure on the phenol
conversion rate was studied by varying different
pressures from 5 to 15 bar and the results are presented in
Fig. 13. There is an increase in the phenol conversion
with increasing oxygen partial pressure. The phenol
conversion reached 74% at 5 bar of oxygen partial
pressure while complete removal of phenol was reached
at 10 and 15 bar after 120 min reaction time. This is
as a result of the fact that the concentration and solubility
of the oxygen gas increase with increasing pressure
resulting in a faster phenol oxidation rate. This effect
might be correlated to the availability of liquid oxygen
to the active site of the pillared clay catalysts. According
to the Henry’s law, the partial pressure of oxygen in the
gas phase is directly proportional to the oxygen dissolved
in the liquid phase. However, an increase in the oxygen
partial pressure from 10 to 15 bar does not result
in a significant increase in the phenol conversion.
And consequently, the oxygen partial pressure of 10 bar
was considered as the optimum value in this study. The effect
of oxygen partial pressure on the kinetic reaction rate
constant of phenol oxidation was investigated and
the results are shown in the inset of Fig. 13. There is a linear
relationship of apparent rate constant as function of
oxygen partial pressure confirming that the experimental
data obtained can be described by the first-order kinetic
model. An increase in the kinetic reaction rate constant
with the oxygen partial pressure was observed.
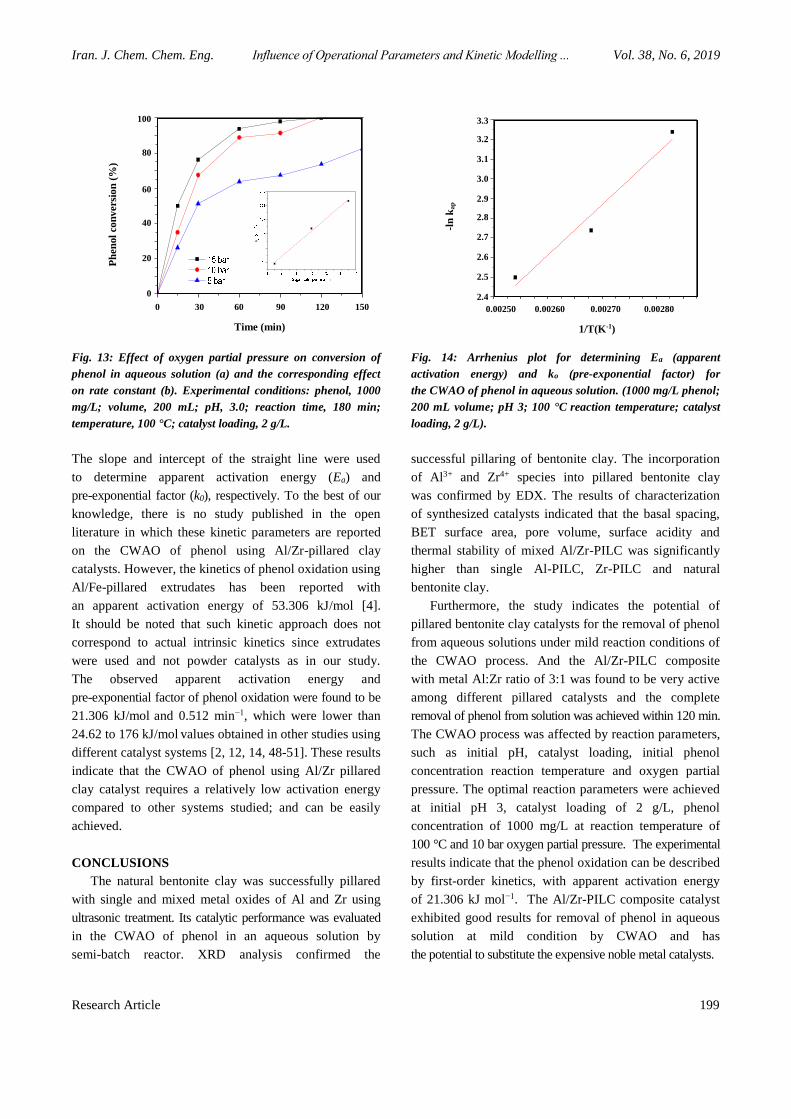
Activation Energy
In order to determine the apparent activation energy,
the experiments were carried out under the predetermined
optimal experimental conditions at the three different
temperatures. The Arrhenius plot obtained is shown
in Fig. 14. The plot presents a good linear relationship
(R2 = 0.9875) between ln kap and 1/T indicating that
the experimental data follow the Arrhenius-type behaviour.
k
Ph
en
ol
con
versio
n
Time (min)
k
0 30 60 90 120 150
Time (min)
Ph
enol
con
vers
ion
(%
)
100
80
60
40
20
0
0 30 60 90 120 150
Time (min)
Ph
enol
con
vers
ion
(%
) 100
80
60
40
20
0
Iran. J. Chem. Chem. Eng. Influence of Operational Parameters and Kinetic Modelling ... Vol. 38, No. 6, 2019
Research Article 199
Fig. 13: Effect of oxygen partial pressure on conversion of
phenol in aqueous solution (a) and the corresponding effect
on rate constant (b). Experimental conditions: phenol, 1000
mg/L; volume, 200 mL; pH, 3.0; reaction time, 180 min;
temperature, 100 °C; catalyst loading, 2 g/L.
Fig. 14: Arrhenius plot for determining Ea (apparent
activation energy) and ko (pre-exponential factor) for
the CWAO of phenol in aqueous solution. (1000 mg/L phenol;
200 mL volume; pH 3; 100 °C reaction temperature; catalyst
loading, 2 g/L).
The slope and intercept of the straight line were used
to determine apparent activation energy (Ea) and
pre-exponential factor (k0), respectively. To the best of our
knowledge, there is no study published in the open
literature in which these kinetic parameters are reported
on the CWAO of phenol using Al/Zr-pillared clay
catalysts. However, the kinetics of phenol oxidation using
Al/Fe-pillared extrudates has been reported with
an apparent activation energy of 53.306 kJ/mol [4].
It should be noted that such kinetic approach does not
correspond to actual intrinsic kinetics since extrudates
were used and not powder catalysts as in our study.
The observed apparent activation energy and
pre-exponential factor of phenol oxidation were found to be
21.306 kJ/mol and 0.512 min−1, which were lower than
24.62 to 176 kJ/mol values obtained in other studies using
different catalyst systems [2, 12, 14, 48-51]. These results
indicate that the CWAO of phenol using Al/Zr pillared
clay catalyst requires a relatively low activation energy
compared to other systems studied; and can be easily
achieved.
CONCLUSIONS
The natural bentonite clay was successfully pillared
with single and mixed metal oxides of Al and Zr using
ultrasonic treatment. Its catalytic performance was evaluated
in the CWAO of phenol in an aqueous solution by
semi-batch reactor. XRD analysis confirmed the
successful pillaring of bentonite clay. The incorporation
of Al3+ and Zr4+ species into pillared bentonite clay
was confirmed by EDX. The results of characterization
of synthesized catalysts indicated that the basal spacing,
BET surface area, pore volume, surface acidity and
thermal stability of mixed Al/Zr-PILC was significantly
higher than single Al-PILC, Zr-PILC and natural
bentonite clay.
Furthermore, the study indicates the potential of
pillared bentonite clay catalysts for the removal of phenol
from aqueous solutions under mild reaction conditions of
the CWAO process. And the Al/Zr-PILC composite
with metal Al:Zr ratio of 3:1 was found to be very active
among different pillared catalysts and the complete
removal of phenol from solution was achieved within 120 min.
The CWAO process was affected by reaction parameters,
such as initial pH, catalyst loading, initial phenol
concentration reaction temperature and oxygen partial
pressure. The optimal reaction parameters were achieved
at initial pH 3, catalyst loading of 2 g/L, phenol
concentration of 1000 mg/L at reaction temperature of
100 °C and 10 bar oxygen partial pressure. The experimental
results indicate that the phenol oxidation can be described
by first-order kinetics, with apparent activation energy
of 21.306 kJ mol−1. The Al/Zr-PILC composite catalyst
exhibited good results for removal of phenol in aqueous
solution at mild condition by CWAO and has
the potential to substitute the expensive noble metal catalysts.
k
Ph
en
ol
con
versio
n (
%)
Time (min)
-ln
kap
1/T (K-1)
0 30 60 90 120 150
Time (min)
Ph
enol
con
vers
ion
(%
) 100
80
60
40
20
0
0.00250 0.00260 0.00270 0.00280
1/T(K-1)
-ln
ka
p
3.3
3.2
3.1
3.0
2.9
2.8
2.7
2.6
2.5
2.4
Iran. J. Chem. Chem. Eng. John M. et al. Vol. 38, No. 6, 2019
200 Research Article
Acknowledgments
The authors are grateful to the National Research
Foundation (NRF)/ Department of Science and
Technology (DST) of South Africa (Project code. 96719)
and Mineral Science Council of South Africa (Mintek)
(Project code. ADR 31803) for financial support.
Received : Jun. 23, 2018 ; Accepted : Sep. 15, 2018
REFERENCES
[1] Baloyi J., Ntho T., Moma J., Synthesis and
Application of Pillared Clay Heterogeneous
Catalysts for Wastewater Treatment: A Review, RSC
Advances, 8: 5197-5211 (2018).
[2] Abid M.F., Alwan G.M., Abdul-Ridha L.A., Study
on Catalytic Wet Air Oxidation Process for Phenol
Degradation in Synthetic Wastewater Using Trickle
Bed Reactor, Arabian Journal for Science and
Engineering, 41: 2659-2670 (2016).
[3] Eftaxias A., Font J., Fortuny A., Fabregat A.,Stüber F.,
Kinetics of Phenol Oxidation in a Trickle Bed Reactor
over Active Carbon Catalyst, Journal of Chemical
Technology and Biotechnology, 80: 677-687 (2005).
[4] Guo J., Catalytic Wet Oxidation over Pillared Clay
Catalyst in Packed-Bed Reactors: Experiments and
Modeling, DSc dissertation, (2005), Washington
University, Missouri, USA.
[5] Arena F., Italiano C., Spadaro L., Efficiency and
Reactivity Pattern of Ceria-Based Noble Metal and
Transition Metal-Oxide Catalysts in the Wet Air
Oxidation of Phenol, Applied Catalysis B:
Environmental, 115: 336-345(2012).
[6] Tomul F., Effect of Ultrasound on the Structural and
Textural Properties of Copper-Impregnated Cerium-
Modified Zirconium-Pillared Bentonite, Applied
Surface Science, 258: 1836-1848(2011).
[7] Sassi H., Lafaye G., Amor H.B., Gannouni A.,
Jeday M.R., Barbier J., Wastewater Treatment by
Catalytic Wet Air Oxidation Process over Al-Fe
Pillared Clays Synthesized Using Microwave
Irradiation, Frontiers of Environmental Science &
Engineering, 12, 2 (2018).
https://doi.org/10.1007/s11783-017-0971-1.
[8] Mnasri-Ghnimi S., Frini-Srasra N., Promoting Effect
of Cerium on the Characteristic and Catalytic
Activity of Al, Zr, and Al–Zr Pillared Clay, Applied
Clay Science, 88: 214-220 (2014).
[9] Ma C., Wen Y., Yue Q., Li A., Fu J., Zhang N.,
Gai H., Zheng J., Chen B.H., Oxygen-Vacancy-
Promoted Catalytic Wet Air Oxidation of Phenol from
MnOx–CeO2, RSC Advances, 7: 27079-27088 (2017).
[10] Fortuny A., Bengoa C., Font J., Fabregat A.,
Bimetallic Catalysts for Continuous Catalytic
Wet Air Oxidation of Phenol, Journal of Hazardous
Materials, 64: 181-193 (1999).
[11] Eftaxias A., "Catalytic Wet Air Oxidation of Phenol
in a Trickle Bed Reactor: Kinteics and Reactor
Modelling", Universitat Rovira i Virgili, (2002).
[12] Pintar A., Levec J., Catalytic Oxidation of Organics
in Aqueous Solutions: I. Kinetics of Phenol
Oxidation, Journal of Catalysis, 135: 345-357 (1992).
[13] Fortuny A., Bengoa C., Font J., Castells F., Fabregat A.,
Water pollution Abatement by Catalytic Wet Air
Oxidation in a Trickle Bed Reactor, Catalysis
Today, 53: 107-114(1999).
[14] Safaa M., Catalytic Wet Air Oxidation of Phenolic
Compounds in Wastewater in a Trickle Bed Reactor
at High Pressure, MSc thesis, University of Tikrit,
(2009).
[15] Quintanilla A., Casas J.A., Rodriguez J.J., Kreutzer M.T.,
Kapteijn F., Moulijn J.A., Kinetics of the Wet
Oxidation of Phenol over an Fe/Activated Carbon
Catalyst, International Journal of Chemical Reactor
Engineering, 5 (1) (2007).
https://doi.org/10.2202/1542-6580.1555.
[16] Quintanilla A., Casas J.A., Rodriguez J.J., Catalytic
Wet Air Oxidation of Phenol with Modified Activated
Carbons and Fe/Activated Carbon Catalysts, Applied
Catalysis B: Environmental, 76: 135-145 (2007).
[17] Tomul F., Balci S., Characterization of Al, Cr-
Pillared Clays and CO Oxidation, Applied Clay
Science, 43 (1): 13-20 (2009).
[18] Grim R.E., "Clay Mineralogy". 2nd ed. McGraw-
Hill Book Company, New York, (1968) 185-224.
[19] Schwieger W., Lagaly G., Auerbach S.M.,
Carrado K.A., Dutta P.K., Handbook of layered
Materials, in, Marcel Dekker, Inc., New York,(2004).
[20] Canizares P., Valverde J.L., Kou M.R.S., Molina C.B.,
Synthesis and Characterization of PILCs with
Single and Mixed Oxide Pillars Prepared from Two
Different Bentonites, A Comparative Study,
Microporous and Mesoporous Materials, 29: 267-
281 (1999).
Iran. J. Chem. Chem. Eng. Influence of Operational Parameters and Kinetic Modelling ... Vol. 38, No. 6, 2019
Research Article 201
[21] Awate S.V., Waghmode S.B., Agashe M.S.,
Synthesis, Characterization and Catalytic Evaluation
of Zirconia-Pillared Montmorillonite for Linear
Alkylation of Benzene, Catalysis Communications,
5: 407-411(2004).
[22] Jung H., Paek S.-M., Yoon J.-B., Choy J.-H.,
Zr K-Edge XAS Study on ZrO2-Pillared Aluminosilicate,
Journal of Porous Materials, 14: 369-377(2007).
[23] Mnasri S., Hamdi N., Frini-Srasra N., Srasra E.,
Acid–Base Properties of Pillared Interlayered Clays
with Single and Mixed Zr–Al Oxide Pillars Prepared
from Tunisian-Interstratified Illite–Smectite,
Arabian Journal of Chemistry, (2014).
[24] Zhang H., Liang X., Yang C., Niu C., Wang J.,
Su X., Nano γ-Fe2O3/Bentonite Magnetic
Composites: Synthesis, Characterization and
Application as Adsorbents, Journal of Alloys and
Compounds, 688: 1019-1027(2016).
[25] Rathnayake S.I., Martens W.N., Xi Y., Frost R.L.,
Ayoko G.A., Remediation of Cr (VI) by Inorganic-
Organic Clay, Journal of Colloid and Interface
Science, 490: 163-173(2017).
[26] Madejová J., FTIR Techniques in Clay Mineral
Studies, Vibrational Spectroscopy, 31: 1-10(2003).
[27] Kumararaja P., Manjaiah K.M., Datta S.C.,
Sarkar B., Remediation of Metal Contaminated Soil by
Aluminium Pillared Bentonite: Synthesis,
Characterisation, Equilibrium Study and Plant Growth
Experiment, Applied Clay Science, 137: 115-122 (2017).
[28] Basoglu F.T., Balci S., Catalytic Properties and
Activity of Copper and Silver Containing Al-
Pillared Bentonite for CO Oxidation, Journal of
Molecular Structure, 1106: 382-389(2016).
[29] Wu L.M., Tong D.S., Zhao L.Z., Yu W.H.,
Zhou C.H., Wang H., Fourier Transform Infrared
Spectroscopy Analysis for Hydrothermal Transformation
of Microcrystalline Cellulose on Montmorillonite,
Applied Clay Science, 95: 74-82(2014).
[30] Acemana S., Lahav N., Yariv S., A Thermo-FTIR-
Spectroscopy Analysis of Al-Pillared Smectites
Differing in Source of Charge, in KBr Disks,
Thermochimica Acta, 340: 349-366(1999).
[31] Ye W., Zhao B., Gao H., Huang J., Zhang X.,
Preparation of Highly Efficient and Stable Fe, Zn,
Al-Pillared Montmorillonite as Heterogeneous Catalyst
for Catalytic Wet Peroxide Oxidation of Orange II,
Journal of Porous Materials, 23: 301-310 (2016).
[32] Lefrancois M., Malbois G., The Nature of the Acidic
Sites on Mordenite, Journal of Catalysis, 20: 350-
358 (1971).
[33] Kojima M., Rautenbach M.W., O'Connor C.T.,
Acidity Characterization of Ion-Exchanged
Mordenite, Journal of Catalysis, 112: 495-504
(1988).
[34] Loveless B.T., Gyanani A., Muggli D.S.,
Discrepancy between TPD-and FTIR-Based
Measurements of Brønsted and Lewis Acidity for
Sulfated Zirconia, Applied Catalysis B:
Environmental, 84: 591-597 (2008).
[35] Fatimah I., Preparation of ZrO2/Al2O3-Montmorillonite
Composite as Catalyst for Phenol Hydroxylation,
Journal of Advanced Research, 5: 663-670 (2014).
[36] Fetter G., Heredia G., Velázquez L.A., Maubert A.M.,
Bosch P., Synthesis of Sluminum-Pillared
Montmorillonites Using Highly Concentrated clay
Suspensions, Applied Catalysis A: General, 162:
41-45 (1997).
[37] Fetter G., Heredia G., Maubert A.M., Bosch P.,
Synthesis of Al-Intercalated Montmorillonites Using
Microwave Irradiation, Journal of Materials
Chemistry, 6: 1857-1858 (1996).
[38] Katdare S.P., Ramaswamy V., Ramaswamy A.V.,
Factors Affecting the Preparation of Alumina Pillared
Montmorillonite Employing Ultrasonics, Microporous
and Mesoporous Materials, 37: 329-336 (2000).
[39] Santos A., Yustos P., Quintanilla A., Rodrıguez S.,
Garcıa-Ochoa F., Route of the Catalytic Oxidation
of Phenol in Aqueous Phase, Applied Catalysis B:
Environmental, 39: 97-113(2002).
[40] Yang G., Chen H., Qin H., Zhang X., Feng Y.,
Effect of Nitrogen Doping on the Catalytic Activity
of Activated Carbon and Distribution of Oxidation
Products in Catalytic Wet Oxidation of Phenol,
The Canadian Journal of Chemical Engineering, 95:
1518-1525 (2017).
[41] Yang S., Li X., Zhu W., Wang J., Descorme C.,
Catalytic Activity, Stability and Structure of Multi-
Walled Carbon Nanotubes in the Wet Air Oxidation
of Phenol, Carbon, 46: 445-452 (2008).
[42] Guo J., Al-Dahhan M., Catalytic Wet Oxidation of
Phenol by Hydrogen Peroxide over Pillared Clay
Catalyst, Industrial & Engineering Chemistry
Research, 42: 2450-2460 (2003).
Iran. J. Chem. Chem. Eng. John M. et al. Vol. 38, No. 6, 2019
202 Research Article
[43] Yadav A.,. Teja A.K, Verma N., Removal of Phenol
from Water by Catalytic wet Air Oxidation Using
Carbon Bead–Supported Iron Nanoparticle–
Containing Carbon Nanofibers in an Especially
Configured Reactor, Journal of Environmental
Chemical Engineering, 4: 1504-1513 (2016).
[44] Wu Q., Hu X., Yue P.-l., Kinetics Study on Catalytic
Wet Air Oxidation of Phenol, Chemical Engineering
Science, 58: 923-928(2003).
[45] Lin S.S., Chang D.J., Wang C.-H., Chen C.C.,
Catalytic Wet Air Oxidation of Phenol by CeO2
Catalyst—Effect of Reaction Conditions, Water
Research, 37: 793-800(2003).
[46] Arena F., Italiano C., Raneri A., Saja C.,
Mechanistic and Kinetic Insights into the Wet Air
Oxidation of Phenol with Oxygen (CWAO) by
Homogeneous and Heterogeneous Transition-Metal
Catalysts, Applied Catalysis B: Environmental, 99:
321-328 (2010).
[47] Chang L., Chen I.P., Lin S.-S., An Assessment of the
Suitable Operating Conditions for the CeO2/γ-Al2O3
Catalyzed Wet Air Oxidation of Phenol,
Chemosphere, 58: 485-492(2005).
[48] Pintar A., Levec J., Catalytic Liquid-Phase
Oxidation of Refractory Organics in Waste Water,
Chemical Engineering Science, 47: 2395-2400
(1992).
[49] Santos A., Yustos P., Quintanilla A., Garcia-Ochoa F.,
Kinetic model of Wet Oxidation of Phenol at Basic
pH Using a Copper Catalyst, Chemical Engineering
Science, 60: 4866-4878 (2005).
[50] Akyurtlu J.F., Akyurtlu A., Kovenklioglu S.,
Catalytic Oxidation of Phenol in Aqueous Solutions,
Catalysis Today, 40: 343-352(1998).
[51] Stüber F., Polaert I., Delmas H., Font J., Fortuny A.,
Fabregat A., Catalytic Wet Air Oxidation of Phenol
Using Active Carbon: Performance of Discontinuous
and Continuous Reactors, Journal of Chemical
Technology and Biotechnology, 76: 743-751(2001).
Iran. J. Chem. Chem. Eng. Influence of Operational Parameters and Kinetic Modelling ... Vol. 38, No. 6, 2019
Research Article 203
Supplementary Material
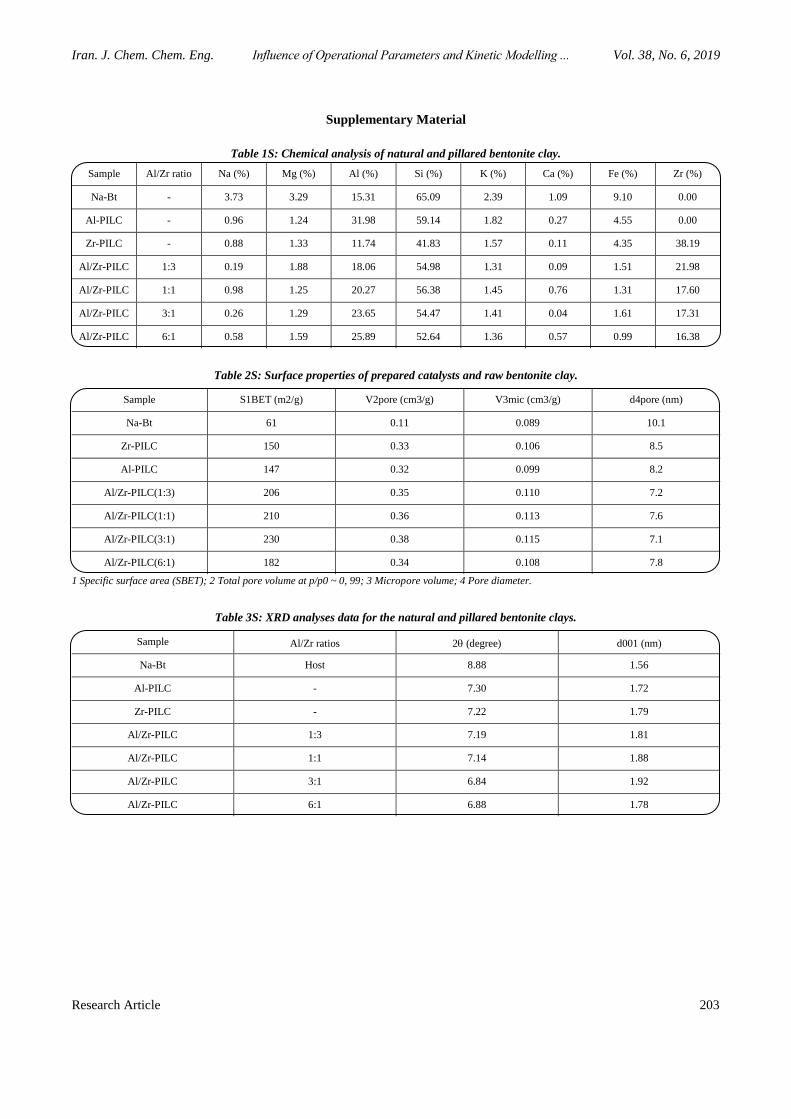
Table 1S: Chemical analysis of natural and pillared bentonite clay.
Sample Al/Zr ratio Na (%) Mg (%) Al (%) Si (%) K (%) Ca (%) Fe (%) Zr (%)
Na-Bt - 3.73 3.29 15.31 65.09 2.39 1.09 9.10 0.00
Al-PILC - 0.96 1.24 31.98 59.14 1.82 0.27 4.55 0.00
Zr-PILC - 0.88 1.33 11.74 41.83 1.57 0.11 4.35 38.19
Al/Zr-PILC 1:3 0.19 1.88 18.06 54.98 1.31 0.09 1.51 21.98
Al/Zr-PILC 1:1 0.98 1.25 20.27 56.38 1.45 0.76 1.31 17.60
Al/Zr-PILC 3:1 0.26 1.29 23.65 54.47 1.41 0.04 1.61 17.31
Al/Zr-PILC 6:1 0.58 1.59 25.89 52.64 1.36 0.57 0.99 16.38
Table 2S: Surface properties of prepared catalysts and raw bentonite clay.
Sample S1BET (m2/g) V2pore (cm3/g) V3mic (cm3/g) d4pore (nm)
Na-Bt 61 0.11 0.089 10.1
Zr-PILC 150 0.33 0.106 8.5
Al-PILC 147 0.32 0.099 8.2
Al/Zr-PILC(1:3) 206 0.35 0.110 7.2
Al/Zr-PILC(1:1) 210 0.36 0.113 7.6
Al/Zr-PILC(3:1) 230 0.38 0.115 7.1
Al/Zr-PILC(6:1) 182 0.34 0.108 7.8
1 Specific surface area (SBET); 2 Total pore volume at p/p0 ~ 0, 99; 3 Micropore volume; 4 Pore diameter.
Table 3S: XRD analyses data for the natural and pillared bentonite clays.
Sample Al/Zr ratios 2 (degree) d001 (nm)
Na-Bt Host 8.88 1.56
Al-PILC - 7.30 1.72
Zr-PILC - 7.22 1.79
Al/Zr-PILC 1:3 7.19 1.81
Al/Zr-PILC 1:1 7.14 1.88
Al/Zr-PILC 3:1 6.84 1.92
Al/Zr-PILC 6:1 6.88 1.78