Embed Size (px)
Citation preview

lable at ScienceDirect
Polymer 52 (2011) 4337e4344
Contents lists avai
Polymer
journal homepage: www.elsevier .com/locate/polymer
Influence of polymer matrix crystallinity on nanocomposite morphologyand properties
Jasmeet Kaur a, Ji Hoon Lee a,b, Meisha L. Shofner a,b,*a School of Polymer, Textile and Fiber Engineering, Georgia Institute of Technology, 801 Ferst Drive, Atlanta, GA 30332, USAb School of Materials Science and Engineering, Georgia Institute of Technology, 771 Ferst Drive, Atlanta, GA 30332, USA
a r t i c l e i n f o
Article history:Received 26 May 2011Received in revised form14 July 2011Accepted 17 July 2011Available online 23 July 2011
Keywords:NanocompositeMatrix morphologyCrystallinity
* Corresponding author. School of Materials ScienInstitute of Technology, 771 Ferst Drive, Atlanta, GA 37216; fax: þ1 404 894 8780.
E-mail address: [email protected] (
0032-3861/$ e see front matter � 2011 Elsevier Ltd.doi:10.1016/j.polymer.2011.07.020
a b s t r a c t
In order to understand more fully how polymer matrix attributes influence polymer nanocompositeproperties, nanocomposites containing hydroxyapatite nanoparticles and a poly(3-hydroxybutyrate)matrix were prepared and compared to results for a chemically-similar nanocomposite system witha lesser degree of matrix crystallinity. Experimental results indicated that the higher degree of matrixcrystallinity hinders nanoparticle dispersion at loadings above 0.5 wt.% and together these structuralfactors, high matrix crystallinity and nanoparticle aggregation, produced different mechanical rein-forcement behavior below and above the glass transition temperature than has been seen previously inamorphous matrices or matrices with moderate crystallinity levels. Overall, these results suggested thatthe amorphous character of the polymer does not govern the properties at all crystallinity levels inpolymer nanocomposite matrices.
� 2011 Elsevier Ltd. All rights reserved.
1. Introduction
Polymer nanocomposites have been extensively researchedfollowing the seminal contributions of the Toyota Central Researchand Development Labs in the late 1980s and early 1990s concerningnanoclay composites [1e4]. In addition to rigid particle inclusion,manipulating the macromolecular architecture of polymersthrough enthalpic and entropic confinement led to drasticallyincreased mechanical and thermal properties at filler loadingsconsidered low at that time, approximately 5 wt.% [3,5e11]. Thisillustrated opportunity to change bulk material properties throughinteractions at the nanoscale has motivated numerous publicationsin the research literature showing the wide range of achievablematerial properties when tuning the interfacial interactions.Attractive interfacial interactions have been used, as motivated bycomposite theory, to produce nanocomposites with increasedmodulus since effective coupling between the components allowsfor load transfer and constrained polymer in the interfacial zone.Notably, these improvements are often larger above the glasstransition temperature (Tg) of the polymer since the relative changein modulus with nanoparticle addition is larger when the inherent
ce and Engineering, Georgia0332, USA. Tel.: þ1 404 385
M.L. Shofner).
All rights reserved.
polymer mobility is higher. Favorable interfacial interactions canpromote homogeneous nanoparticle dispersion while alsoproviding a strong interface for load transfer [6,7]. Alternatively,repulsive interfacial interactions can decrease the polymer densityat the nanoparticle/polymer interface, decreasing Tg or polymerviscosity [9e11]. These types of results framed in terms of thenature of the interfacial interactions have led to a general under-standing of how polymer dynamics at the nanoparticle/polymerinterface impact properties in polymer nanocomposites withamorphous matrices.
The added complication of polymer crystallinity does notrespond in a generally uniform way to the nanoparticle/polymerinteraction. Attractive interfacial interactions can increase ordecrease the total amount of crystallinity in the composite. Whilepolyethylene oxide has shown decreased or suppressed crystal-linity in the presence of spherical [12,13], plate-like [14,15], androd-like [16] nanoparticles with attractive interactions, poly-ethylene terephthalate has shown increased crystallinity due tospecific interactions with trans conformers [17]. Interpretingresults is further complicated by results in which weakly interact-ing systems show small changes in crystallinity (less than 5%)which are difficult to separate from the error associated withintegrating the peak areas in differential scanning calorimetry(DSC) or X-ray diffraction. Nanoparticles can also stabilize differentcrystal phases in polymers; notably in polypropylene [18e21],polyvinyldifluoride [22e25], and polyamide [26e30]. At first
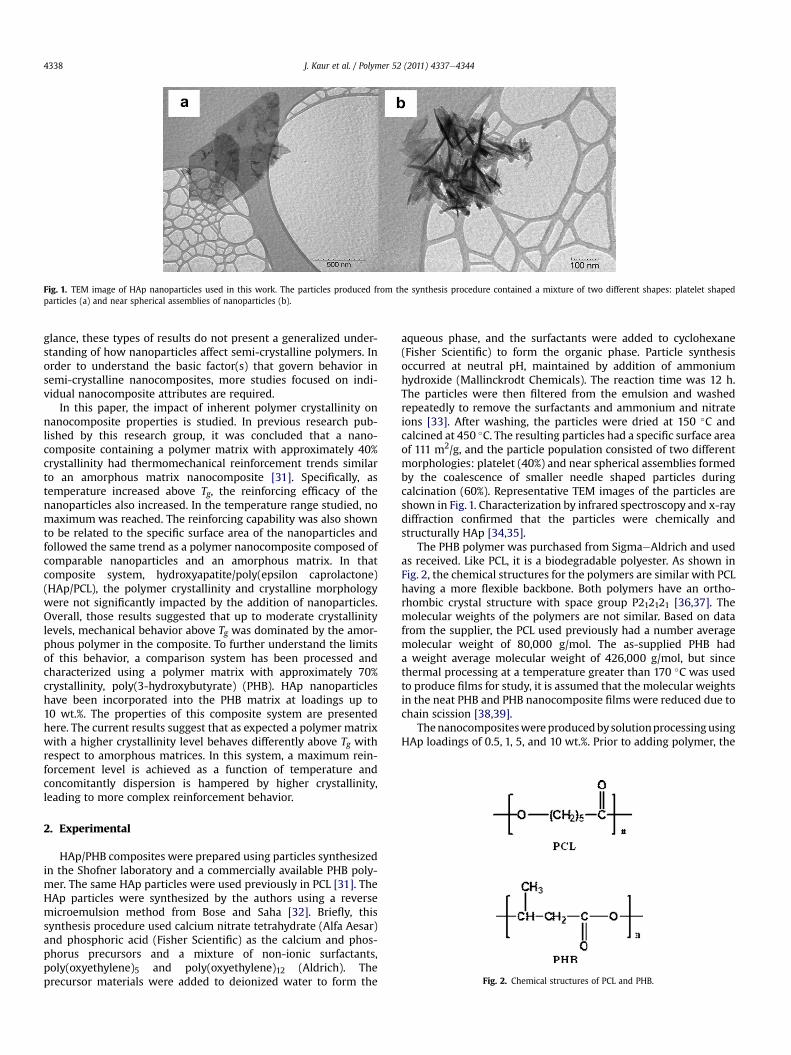
Fig. 1. TEM image of HAp nanoparticles used in this work. The particles produced from the synthesis procedure contained a mixture of two different shapes: platelet shapedparticles (a) and near spherical assemblies of nanoparticles (b).
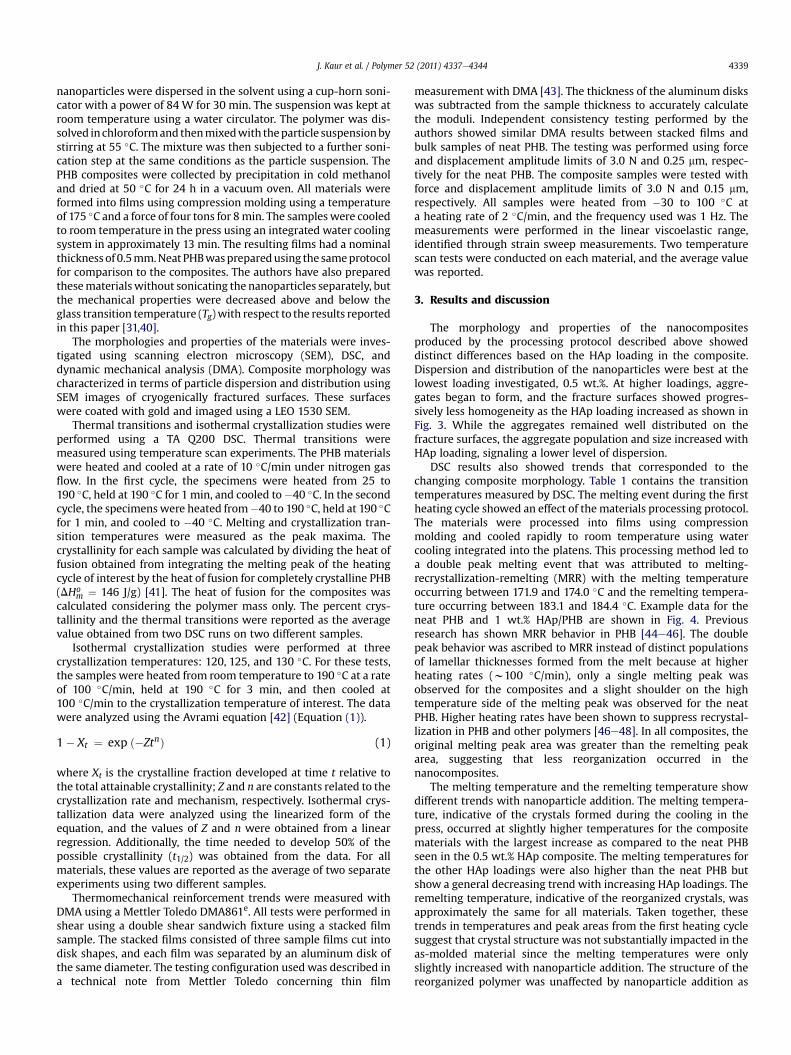
Fig. 2. Chemical structures of PCL and PHB.
J. Kaur et al. / Polymer 52 (2011) 4337e43444338
glance, these types of results do not present a generalized under-standing of how nanoparticles affect semi-crystalline polymers. Inorder to understand the basic factor(s) that govern behavior insemi-crystalline nanocomposites, more studies focused on indi-vidual nanocomposite attributes are required.
In this paper, the impact of inherent polymer crystallinity onnanocomposite properties is studied. In previous research pub-lished by this research group, it was concluded that a nano-composite containing a polymer matrix with approximately 40%crystallinity had thermomechanical reinforcement trends similarto an amorphous matrix nanocomposite [31]. Specifically, astemperature increased above Tg, the reinforcing efficacy of thenanoparticles also increased. In the temperature range studied, nomaximum was reached. The reinforcing capability was also shownto be related to the specific surface area of the nanoparticles andfollowed the same trend as a polymer nanocomposite composed ofcomparable nanoparticles and an amorphous matrix. In thatcomposite system, hydroxyapatite/poly(epsilon caprolactone)(HAp/PCL), the polymer crystallinity and crystalline morphologywere not significantly impacted by the addition of nanoparticles.Overall, those results suggested that up to moderate crystallinitylevels, mechanical behavior above Tg was dominated by the amor-phous polymer in the composite. To further understand the limitsof this behavior, a comparison system has been processed andcharacterized using a polymer matrix with approximately 70%crystallinity, poly(3-hydroxybutyrate) (PHB). HAp nanoparticleshave been incorporated into the PHB matrix at loadings up to10 wt.%. The properties of this composite system are presentedhere. The current results suggest that as expected a polymer matrixwith a higher crystallinity level behaves differently above Tg withrespect to amorphous matrices. In this system, a maximum rein-forcement level is achieved as a function of temperature andconcomitantly dispersion is hampered by higher crystallinity,leading to more complex reinforcement behavior.
2. Experimental
HAp/PHB composites were prepared using particles synthesizedin the Shofner laboratory and a commercially available PHB poly-mer. The same HAp particles were used previously in PCL [31]. TheHAp particles were synthesized by the authors using a reversemicroemulsion method from Bose and Saha [32]. Briefly, thissynthesis procedure used calcium nitrate tetrahydrate (Alfa Aesar)and phosphoric acid (Fisher Scientific) as the calcium and phos-phorus precursors and a mixture of non-ionic surfactants,poly(oxyethylene)5 and poly(oxyethylene)12 (Aldrich). Theprecursor materials were added to deionized water to form the
aqueous phase, and the surfactants were added to cyclohexane(Fisher Scientific) to form the organic phase. Particle synthesisoccurred at neutral pH, maintained by addition of ammoniumhydroxide (Mallinckrodt Chemicals). The reaction time was 12 h.The particles were then filtered from the emulsion and washedrepeatedly to remove the surfactants and ammonium and nitrateions [33]. After washing, the particles were dried at 150 �C andcalcined at 450 �C. The resulting particles had a specific surface areaof 111 m2/g, and the particle population consisted of two differentmorphologies: platelet (40%) and near spherical assemblies formedby the coalescence of smaller needle shaped particles duringcalcination (60%). Representative TEM images of the particles areshown in Fig. 1. Characterization by infrared spectroscopy and x-raydiffraction confirmed that the particles were chemically andstructurally HAp [34,35].
The PHB polymer was purchased from SigmaeAldrich and usedas received. Like PCL, it is a biodegradable polyester. As shown inFig. 2, the chemical structures for the polymers are similar with PCLhaving a more flexible backbone. Both polymers have an ortho-rhombic crystal structure with space group P212121 [36,37]. Themolecular weights of the polymers are not similar. Based on datafrom the supplier, the PCL used previously had a number averagemolecular weight of 80,000 g/mol. The as-supplied PHB hada weight average molecular weight of 426,000 g/mol, but sincethermal processing at a temperature greater than 170 �C was usedto produce films for study, it is assumed that the molecular weightsin the neat PHB and PHB nanocomposite films were reduced due tochain scission [38,39].
ThenanocompositeswereproducedbysolutionprocessingusingHAp loadings of 0.5, 1, 5, and 10 wt.%. Prior to adding polymer, the
J. Kaur et al. / Polymer 52 (2011) 4337e4344 4339
nanoparticles were dispersed in the solvent using a cup-horn soni-cator with a power of 84 W for 30 min. The suspension was kept atroom temperature using a water circulator. The polymer was dis-solved inchloroformand thenmixedwith theparticle suspensionbystirring at 55 �C. The mixture was then subjected to a further soni-cation step at the same conditions as the particle suspension. ThePHB composites were collected by precipitation in cold methanoland dried at 50 �C for 24 h in a vacuum oven. All materials wereformed into films using compression molding using a temperatureof 175 �C and a force of four tons for 8min. The sampleswere cooledto room temperature in the press using an integrated water coolingsystem in approximately 13 min. The resulting films had a nominalthicknessof 0.5mm.Neat PHBwaspreparedusing the sameprotocolfor comparison to the composites. The authors have also preparedthesematerialswithout sonicating the nanoparticles separately, butthe mechanical properties were decreased above and below theglass transition temperature (Tg)with respect to the results reportedin this paper [31,40].
The morphologies and properties of the materials were inves-tigated using scanning electron microscopy (SEM), DSC, anddynamic mechanical analysis (DMA). Composite morphology wascharacterized in terms of particle dispersion and distribution usingSEM images of cryogenically fractured surfaces. These surfaceswere coated with gold and imaged using a LEO 1530 SEM.
Thermal transitions and isothermal crystallization studies wereperformed using a TA Q200 DSC. Thermal transitions weremeasured using temperature scan experiments. The PHB materialswere heated and cooled at a rate of 10 �C/min under nitrogen gasflow. In the first cycle, the specimens were heated from 25 to190 �C, held at 190 �C for 1 min, and cooled to�40 �C. In the secondcycle, the specimenswere heated from�40 to 190 �C, held at 190 �Cfor 1 min, and cooled to �40 �C. Melting and crystallization tran-sition temperatures were measured as the peak maxima. Thecrystallinity for each sample was calculated by dividing the heat offusion obtained from integrating the melting peak of the heatingcycle of interest by the heat of fusion for completely crystalline PHB(DHo
m ¼ 146 J/g) [41]. The heat of fusion for the composites wascalculated considering the polymer mass only. The percent crys-tallinity and the thermal transitions were reported as the averagevalue obtained from two DSC runs on two different samples.
Isothermal crystallization studies were performed at threecrystallization temperatures: 120, 125, and 130 �C. For these tests,the samples were heated from room temperature to 190 �C at a rateof 100 �C/min, held at 190 �C for 3 min, and then cooled at100 �C/min to the crystallization temperature of interest. The datawere analyzed using the Avrami equation [42] (Equation (1)).
1� Xt ¼ exp ð�ZtnÞ (1)
where Xt is the crystalline fraction developed at time t relative tothe total attainable crystallinity; Z and n are constants related to thecrystallization rate and mechanism, respectively. Isothermal crys-tallization data were analyzed using the linearized form of theequation, and the values of Z and n were obtained from a linearregression. Additionally, the time needed to develop 50% of thepossible crystallinity (t1/2) was obtained from the data. For allmaterials, these values are reported as the average of two separateexperiments using two different samples.
Thermomechanical reinforcement trends were measured withDMA using a Mettler Toledo DMA861e. All tests were performed inshear using a double shear sandwich fixture using a stacked filmsample. The stacked films consisted of three sample films cut intodisk shapes, and each film was separated by an aluminum disk ofthe same diameter. The testing configuration used was described ina technical note from Mettler Toledo concerning thin film
measurement with DMA [43]. The thickness of the aluminum diskswas subtracted from the sample thickness to accurately calculatethe moduli. Independent consistency testing performed by theauthors showed similar DMA results between stacked films andbulk samples of neat PHB. The testing was performed using forceand displacement amplitude limits of 3.0 N and 0.25 mm, respec-tively for the neat PHB. The composite samples were tested withforce and displacement amplitude limits of 3.0 N and 0.15 mm,respectively. All samples were heated from �30 to 100 �C ata heating rate of 2 �C/min, and the frequency used was 1 Hz. Themeasurements were performed in the linear viscoelastic range,identified through strain sweep measurements. Two temperaturescan tests were conducted on each material, and the average valuewas reported.
3. Results and discussion
The morphology and properties of the nanocompositesproduced by the processing protocol described above showeddistinct differences based on the HAp loading in the composite.Dispersion and distribution of the nanoparticles were best at thelowest loading investigated, 0.5 wt.%. At higher loadings, aggre-gates began to form, and the fracture surfaces showed progres-sively less homogeneity as the HAp loading increased as shown inFig. 3. While the aggregates remained well distributed on thefracture surfaces, the aggregate population and size increased withHAp loading, signaling a lower level of dispersion.
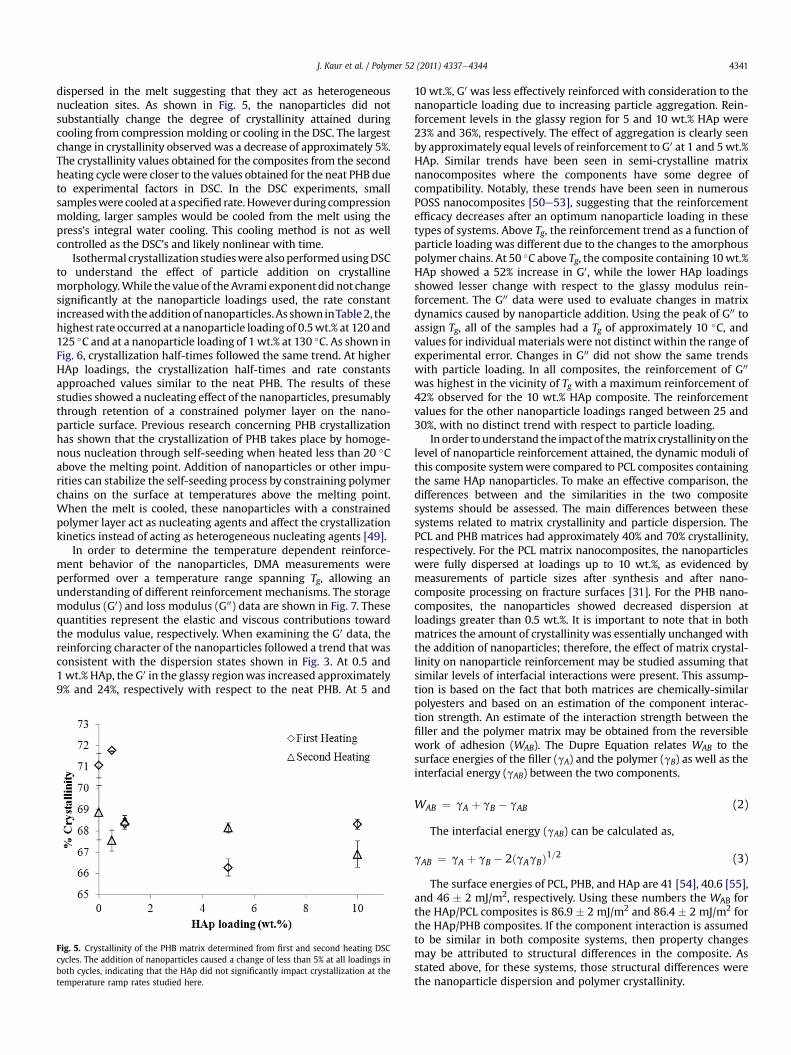
DSC results also showed trends that corresponded to thechanging composite morphology. Table 1 contains the transitiontemperatures measured by DSC. The melting event during the firstheating cycle showed an effect of the materials processing protocol.The materials were processed into films using compressionmolding and cooled rapidly to room temperature using watercooling integrated into the platens. This processing method led toa double peak melting event that was attributed to melting-recrystallization-remelting (MRR) with the melting temperatureoccurring between 171.9 and 174.0 �C and the remelting tempera-ture occurring between 183.1 and 184.4 �C. Example data for theneat PHB and 1 wt.% HAp/PHB are shown in Fig. 4. Previousresearch has shown MRR behavior in PHB [44e46]. The doublepeak behavior was ascribed to MRR instead of distinct populationsof lamellar thicknesses formed from the melt because at higherheating rates (w100 �C/min), only a single melting peak wasobserved for the composites and a slight shoulder on the hightemperature side of the melting peak was observed for the neatPHB. Higher heating rates have been shown to suppress recrystal-lization in PHB and other polymers [46e48]. In all composites, theoriginal melting peak area was greater than the remelting peakarea, suggesting that less reorganization occurred in thenanocomposites.
The melting temperature and the remelting temperature showdifferent trends with nanoparticle addition. The melting tempera-ture, indicative of the crystals formed during the cooling in thepress, occurred at slightly higher temperatures for the compositematerials with the largest increase as compared to the neat PHBseen in the 0.5 wt.% HAp composite. The melting temperatures forthe other HAp loadings were also higher than the neat PHB butshow a general decreasing trend with increasing HAp loadings. Theremelting temperature, indicative of the reorganized crystals, wasapproximately the same for all materials. Taken together, thesetrends in temperatures and peak areas from the first heating cyclesuggest that crystal structure was not substantially impacted in theas-molded material since the melting temperatures were onlyslightly increased with nanoparticle addition. The structure of thereorganized polymer was unaffected by nanoparticle addition as
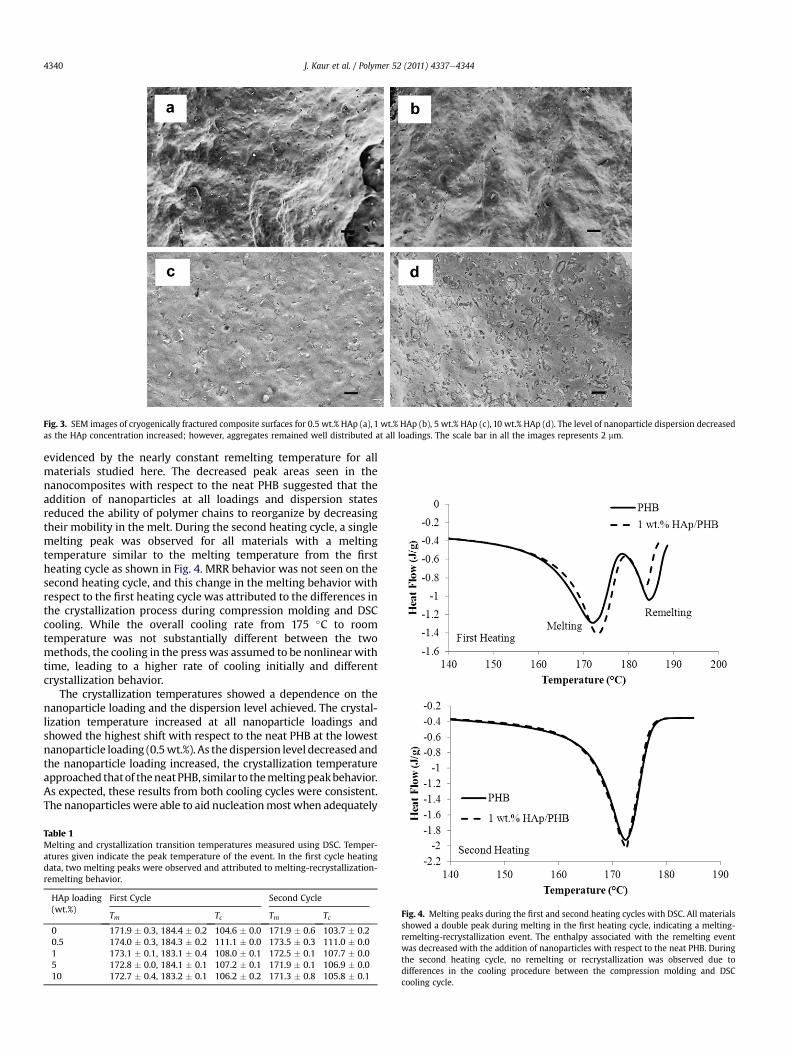
Fig. 3. SEM images of cryogenically fractured composite surfaces for 0.5 wt.% HAp (a), 1 wt.% HAp (b), 5 wt.% HAp (c), 10 wt.% HAp (d). The level of nanoparticle dispersion decreasedas the HAp concentration increased; however, aggregates remained well distributed at all loadings. The scale bar in all the images represents 2 mm.
J. Kaur et al. / Polymer 52 (2011) 4337e43444340
evidenced by the nearly constant remelting temperature for allmaterials studied here. The decreased peak areas seen in thenanocomposites with respect to the neat PHB suggested that theaddition of nanoparticles at all loadings and dispersion statesreduced the ability of polymer chains to reorganize by decreasingtheir mobility in the melt. During the second heating cycle, a singlemelting peak was observed for all materials with a meltingtemperature similar to the melting temperature from the firstheating cycle as shown in Fig. 4. MRR behavior was not seen on thesecond heating cycle, and this change in the melting behavior withrespect to the first heating cycle was attributed to the differences inthe crystallization process during compression molding and DSCcooling. While the overall cooling rate from 175 �C to roomtemperature was not substantially different between the twomethods, the cooling in the press was assumed to be nonlinear withtime, leading to a higher rate of cooling initially and differentcrystallization behavior.
The crystallization temperatures showed a dependence on thenanoparticle loading and the dispersion level achieved. The crystal-lization temperature increased at all nanoparticle loadings andshowed the highest shift with respect to the neat PHB at the lowestnanoparticle loading (0.5wt.%). As the dispersion level decreased andthe nanoparticle loading increased, the crystallization temperatureapproached thatof theneatPHB, similar to themeltingpeakbehavior.As expected, these results from both cooling cycles were consistent.The nanoparticles were able to aid nucleationmost when adequately
Table 1Melting and crystallization transition temperatures measured using DSC. Temper-atures given indicate the peak temperature of the event. In the first cycle heatingdata, two melting peaks were observed and attributed to melting-recrystallization-remelting behavior.
HAp loading(wt.%)
First Cycle Second Cycle
Tm Tc Tm Tc
0 171.9 � 0.3, 184.4 � 0.2 104.6 � 0.0 171.9 � 0.6 103.7 � 0.20.5 174.0 � 0.3, 184.3 � 0.2 111.1 � 0.0 173.5 � 0.3 111.0 � 0.01 173.1 � 0.1, 183.1 � 0.4 108.0 � 0.1 172.5 � 0.1 107.7 � 0.05 172.8 � 0.0, 184.1 � 0.1 107.2 � 0.1 171.9 � 0.1 106.9 � 0.010 172.7 � 0.4, 183.2 � 0.1 106.2 � 0.2 171.3 � 0.8 105.8 � 0.1
Fig. 4. Melting peaks during the first and second heating cycles with DSC. All materialsshowed a double peak during melting in the first heating cycle, indicating a melting-remelting-recrystallization event. The enthalpy associated with the remelting eventwas decreased with the addition of nanoparticles with respect to the neat PHB. Duringthe second heating cycle, no remelting or recrystallization was observed due todifferences in the cooling procedure between the compression molding and DSCcooling cycle.
J. Kaur et al. / Polymer 52 (2011) 4337e4344 4341
dispersed in the melt suggesting that they act as heterogeneousnucleation sites. As shown in Fig. 5, the nanoparticles did notsubstantially change the degree of crystallinity attained duringcooling from compression molding or cooling in the DSC. The largestchange in crystallinity observed was a decrease of approximately 5%.The crystallinity values obtained for the composites from the secondheating cyclewere closer to the values obtained for the neat PHB dueto experimental factors in DSC. In the DSC experiments, smallsampleswere cooledat a specified rate.Howeverduring compressionmolding, larger samples would be cooled from the melt using thepress’s integral water cooling. This cooling method is not as wellcontrolled as the DSC’s and likely nonlinear with time.
Isothermal crystallization studieswere also performedusingDSCto understand the effect of particle addition on crystallinemorphology.While the value of theAvrami exponent did not changesignificantly at the nanoparticle loadings used, the rate constantincreasedwith theadditionofnanoparticles.As shown inTable2, thehighest rate occurred at a nanoparticle loading of 0.5wt.% at 120 and125 �C and at a nanoparticle loading of 1 wt.% at 130 �C. As shown inFig. 6, crystallization half-times followed the same trend. At higherHAp loadings, the crystallization half-times and rate constantsapproached values similar to the neat PHB. The results of thesestudies showed a nucleating effect of the nanoparticles, presumablythrough retention of a constrained polymer layer on the nano-particle surface. Previous research concerning PHB crystallizationhas shown that the crystallization of PHB takes place by homoge-nous nucleation through self-seeding when heated less than 20 �Cabove the melting point. Addition of nanoparticles or other impu-rities can stabilize the self-seeding process by constraining polymerchains on the surface at temperatures above the melting point.When the melt is cooled, these nanoparticles with a constrainedpolymer layer act as nucleating agents and affect the crystallizationkinetics instead of acting as heterogeneous nucleating agents [49].
In order to determine the temperature dependent reinforce-ment behavior of the nanoparticles, DMA measurements wereperformed over a temperature range spanning Tg, allowing anunderstanding of different reinforcement mechanisms. The storagemodulus (G0) and loss modulus (G00) data are shown in Fig. 7. Thesequantities represent the elastic and viscous contributions towardthe modulus value, respectively. When examining the G0 data, thereinforcing character of the nanoparticles followed a trend that wasconsistent with the dispersion states shown in Fig. 3. At 0.5 and1wt.% HAp, the G0 in the glassy regionwas increased approximately9% and 24%, respectively with respect to the neat PHB. At 5 and
Fig. 5. Crystallinity of the PHB matrix determined from first and second heating DSCcycles. The addition of nanoparticles caused a change of less than 5% at all loadings inboth cycles, indicating that the HAp did not significantly impact crystallization at thetemperature ramp rates studied here.
10 wt.%, G0 was less effectively reinforced with consideration to thenanoparticle loading due to increasing particle aggregation. Rein-forcement levels in the glassy region for 5 and 10 wt.% HAp were23% and 36%, respectively. The effect of aggregation is clearly seenby approximately equal levels of reinforcement to G0 at 1 and 5 wt.%HAp. Similar trends have been seen in semi-crystalline matrixnanocomposites where the components have some degree ofcompatibility. Notably, these trends have been seen in numerousPOSS nanocomposites [50e53], suggesting that the reinforcementefficacy decreases after an optimum nanoparticle loading in thesetypes of systems. Above Tg, the reinforcement trend as a function ofparticle loading was different due to the changes to the amorphouspolymer chains. At 50 �C above Tg, the composite containing 10wt.%HAp showed a 52% increase in G0, while the lower HAp loadingsshowed lesser change with respect to the glassy modulus rein-forcement. The G00 data were used to evaluate changes in matrixdynamics caused by nanoparticle addition. Using the peak of G00 toassign Tg, all of the samples had a Tg of approximately 10 �C, andvalues for individual materials were not distinct within the range ofexperimental error. Changes in G00 did not show the same trendswith particle loading. In all composites, the reinforcement of G00
was highest in the vicinity of Tg with a maximum reinforcement of42% observed for the 10 wt.% HAp composite. The reinforcementvalues for the other nanoparticle loadings ranged between 25 and30%, with no distinct trend with respect to particle loading.
Inorder tounderstand the impactof thematrixcrystallinityon thelevel of nanoparticle reinforcement attained, the dynamic moduli ofthis composite systemwere compared to PCL composites containingthe same HAp nanoparticles. To make an effective comparison, thedifferences between and the similarities in the two compositesystems should be assessed. The main differences between thesesystems related to matrix crystallinity and particle dispersion. ThePCL and PHB matrices had approximately 40% and 70% crystallinity,respectively. For the PCL matrix nanocomposites, the nanoparticleswere fully dispersed at loadings up to 10 wt.%, as evidenced bymeasurements of particle sizes after synthesis and after nano-composite processing on fracture surfaces [31]. For the PHB nano-composites, the nanoparticles showed decreased dispersion atloadings greater than 0.5 wt.%. It is important to note that in bothmatrices the amount of crystallinity was essentially unchanged withthe addition of nanoparticles; therefore, the effect of matrix crystal-linity on nanoparticle reinforcement may be studied assuming thatsimilar levels of interfacial interactions were present. This assump-tion is based on the fact that both matrices are chemically-similarpolyesters and based on an estimation of the component interac-tion strength. An estimate of the interaction strength between thefiller and the polymer matrix may be obtained from the reversiblework of adhesion (WAB). The Dupre Equation relates WAB to thesurface energies of the filler (gA) and the polymer (gB) as well as theinterfacial energy (gAB) between the two components.
WAB ¼ gA þ gB � gAB (2)
The interfacial energy (gAB) can be calculated as,
gAB ¼ gA þ gB � 2ðgAgBÞ1=2 (3)
The surface energies of PCL, PHB, and HAp are 41 [54], 40.6 [55],and 46 � 2 mJ/m2, respectively. Using these numbers the WAB forthe HAp/PCL composites is 86.9 � 2 mJ/m2 and 86.4 � 2 mJ/m2 forthe HAp/PHB composites. If the component interaction is assumedto be similar in both composite systems, then property changesmay be attributed to structural differences in the composite. Asstated above, for these systems, those structural differences werethe nanoparticle dispersion and polymer crystallinity.
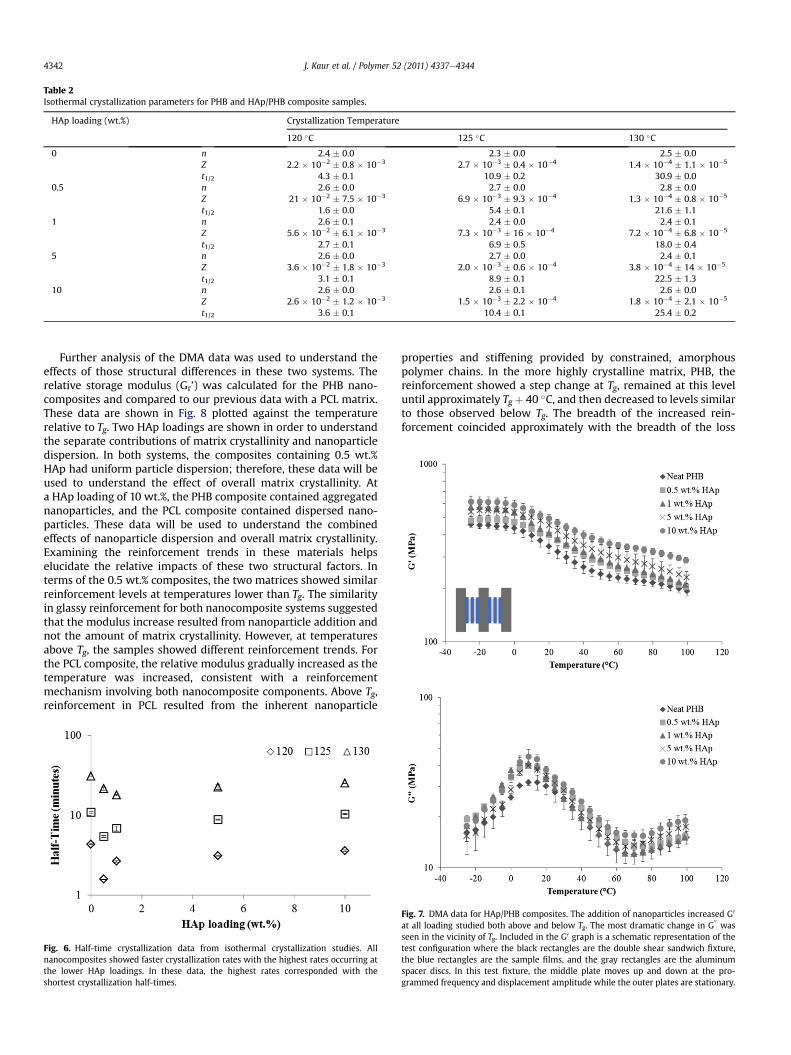
Table 2Isothermal crystallization parameters for PHB and HAp/PHB composite samples.
HAp loading (wt.%) Crystallization Temperature
120 �C 125 �C 130 �C
0 n 2.4 � 0.0 2.3 � 0.0 2.5 � 0.0Z 2.2 � 10�2 � 0.8 � 10�3 2.7 � 10�3 � 0.4 � 10�4 1.4 � 10�4 � 1.1 � 10�5
t1/2 4.3 � 0.1 10.9 � 0.2 30.9 � 0.00.5 n 2.6 � 0.0 2.7 � 0.0 2.8 � 0.0
Z 21 � 10�2 � 7.5 � 10�3 6.9 � 10�3 � 9.3 � 10�4 1.3 � 10�4 � 0.8 � 10�5
t1/2 1.6 � 0.0 5.4 � 0.1 21.6 � 1.11 n 2.6 � 0.1 2.4 � 0.0 2.4 � 0.1
Z 5.6 � 10�2 � 6.1 � 10�3 7.3 � 10�3 � 16 � 10�4 7.2 � 10�4 � 6.8 � 10�5
t1/2 2.7 � 0.1 6.9 � 0.5 18.0 � 0.45 n 2.6 � 0.0 2.7 � 0.0 2.4 � 0.1
Z 3.6 � 10�2 � 1.8 � 10�3 2.0 � 10�3 � 0.6 � 10�4 3.8 � 10�4 � 14 � 10�5
t1/2 3.1 � 0.1 8.9 � 0.1 22.5 � 1.310 n 2.6 � 0.0 2.6 � 0.1 2.6 � 0.0
Z 2.6 � 10�2 � 1.2 � 10�3 1.5 � 10�3 � 2.2 � 10�4 1.8 � 10�4 � 2.1 � 10�5
t1/2 3.6 � 0.1 10.4 � 0.1 25.4 � 0.2
J. Kaur et al. / Polymer 52 (2011) 4337e43444342
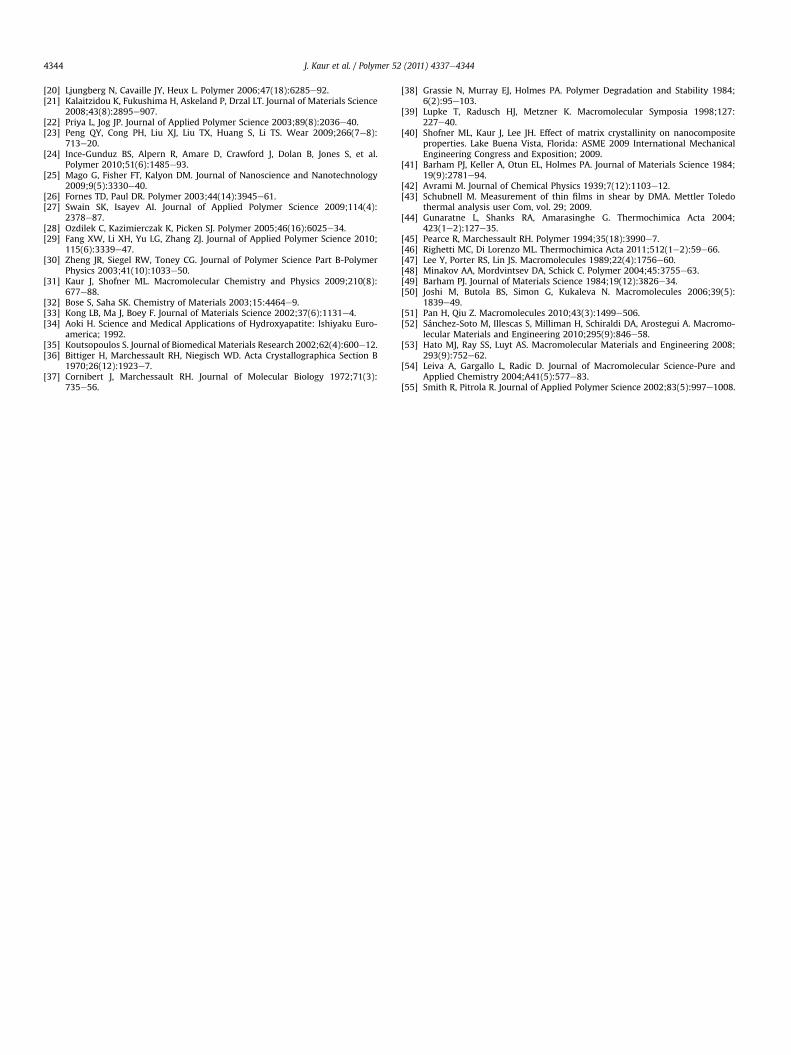
Further analysis of the DMA data was used to understand theeffects of those structural differences in these two systems. Therelative storage modulus (Gr’) was calculated for the PHB nano-composites and compared to our previous data with a PCL matrix.These data are shown in Fig. 8 plotted against the temperaturerelative to Tg. Two HAp loadings are shown in order to understandthe separate contributions of matrix crystallinity and nanoparticledispersion. In both systems, the composites containing 0.5 wt.%HAp had uniform particle dispersion; therefore, these data will beused to understand the effect of overall matrix crystallinity. Ata HAp loading of 10 wt.%, the PHB composite contained aggregatednanoparticles, and the PCL composite contained dispersed nano-particles. These data will be used to understand the combinedeffects of nanoparticle dispersion and overall matrix crystallinity.Examining the reinforcement trends in these materials helpselucidate the relative impacts of these two structural factors. Interms of the 0.5 wt.% composites, the two matrices showed similarreinforcement levels at temperatures lower than Tg. The similarityin glassy reinforcement for both nanocomposite systems suggestedthat the modulus increase resulted from nanoparticle addition andnot the amount of matrix crystallinity. However, at temperaturesabove Tg, the samples showed different reinforcement trends. Forthe PCL composite, the relative modulus gradually increased as thetemperature was increased, consistent with a reinforcementmechanism involving both nanocomposite components. Above Tg,reinforcement in PCL resulted from the inherent nanoparticle
Fig. 6. Half-time crystallization data from isothermal crystallization studies. Allnanocomposites showed faster crystallization rates with the highest rates occurring atthe lower HAp loadings. In these data, the highest rates corresponded with theshortest crystallization half-times.
properties and stiffening provided by constrained, amorphouspolymer chains. In the more highly crystalline matrix, PHB, thereinforcement showed a step change at Tg, remained at this leveluntil approximately Tg þ 40 �C, and then decreased to levels similarto those observed below Tg. The breadth of the increased rein-forcement coincided approximately with the breadth of the loss
Fig. 7. DMA data for HAp/PHB composites. The addition of nanoparticles increased G0
at all loading studied both above and below Tg. The most dramatic change in G00was
seen in the vicinity of Tg. Included in the G0 graph is a schematic representation of thetest configuration where the black rectangles are the double shear sandwich fixture,the blue rectangles are the sample films, and the gray rectangles are the aluminumspacer discs. In this test fixture, the middle plate moves up and down at the pro-grammed frequency and displacement amplitude while the outer plates are stationary.
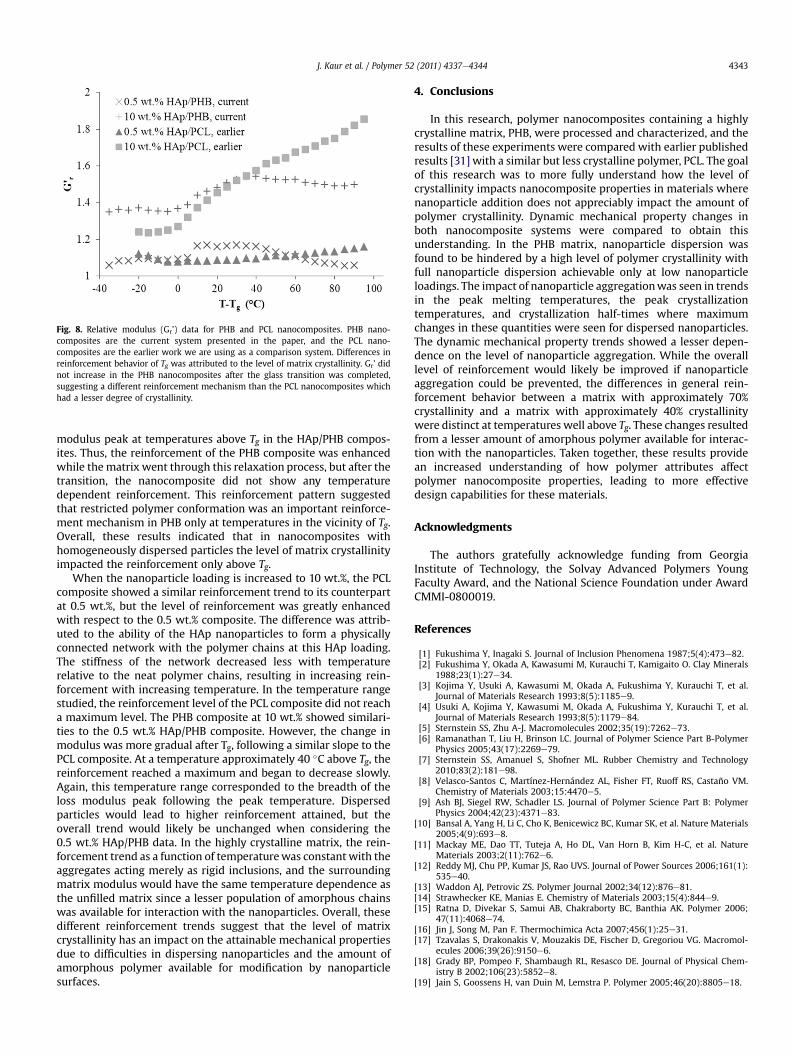
Fig. 8. Relative modulus (Gr’) data for PHB and PCL nanocomposites. PHB nano-composites are the current system presented in the paper, and the PCL nano-composites are the earlier work we are using as a comparison system. Differences inreinforcement behavior of Tg was attributed to the level of matrix crystallinity. Gr’ didnot increase in the PHB nanocomposites after the glass transition was completed,suggesting a different reinforcement mechanism than the PCL nanocomposites whichhad a lesser degree of crystallinity.
J. Kaur et al. / Polymer 52 (2011) 4337e4344 4343
modulus peak at temperatures above Tg in the HAp/PHB compos-ites. Thus, the reinforcement of the PHB composite was enhancedwhile the matrix went through this relaxation process, but after thetransition, the nanocomposite did not show any temperaturedependent reinforcement. This reinforcement pattern suggestedthat restricted polymer conformation was an important reinforce-ment mechanism in PHB only at temperatures in the vicinity of Tg.Overall, these results indicated that in nanocomposites withhomogeneously dispersed particles the level of matrix crystallinityimpacted the reinforcement only above Tg.
When the nanoparticle loading is increased to 10 wt.%, the PCLcomposite showed a similar reinforcement trend to its counterpartat 0.5 wt.%, but the level of reinforcement was greatly enhancedwith respect to the 0.5 wt.% composite. The difference was attrib-uted to the ability of the HAp nanoparticles to form a physicallyconnected network with the polymer chains at this HAp loading.The stiffness of the network decreased less with temperaturerelative to the neat polymer chains, resulting in increasing rein-forcement with increasing temperature. In the temperature rangestudied, the reinforcement level of the PCL composite did not reacha maximum level. The PHB composite at 10 wt.% showed similari-ties to the 0.5 wt.% HAp/PHB composite. However, the change inmodulus was more gradual after Tg, following a similar slope to thePCL composite. At a temperature approximately 40 �C above Tg, thereinforcement reached a maximum and began to decrease slowly.Again, this temperature range corresponded to the breadth of theloss modulus peak following the peak temperature. Dispersedparticles would lead to higher reinforcement attained, but theoverall trend would likely be unchanged when considering the0.5 wt.% HAp/PHB data. In the highly crystalline matrix, the rein-forcement trend as a function of temperaturewas constant with theaggregates acting merely as rigid inclusions, and the surroundingmatrix modulus would have the same temperature dependence asthe unfilled matrix since a lesser population of amorphous chainswas available for interaction with the nanoparticles. Overall, thesedifferent reinforcement trends suggest that the level of matrixcrystallinity has an impact on the attainable mechanical propertiesdue to difficulties in dispersing nanoparticles and the amount ofamorphous polymer available for modification by nanoparticlesurfaces.
4. Conclusions
In this research, polymer nanocomposites containing a highlycrystalline matrix, PHB, were processed and characterized, and theresults of these experiments were compared with earlier publishedresults [31] with a similar but less crystalline polymer, PCL. The goalof this research was to more fully understand how the level ofcrystallinity impacts nanocomposite properties in materials wherenanoparticle addition does not appreciably impact the amount ofpolymer crystallinity. Dynamic mechanical property changes inboth nanocomposite systems were compared to obtain thisunderstanding. In the PHB matrix, nanoparticle dispersion wasfound to be hindered by a high level of polymer crystallinity withfull nanoparticle dispersion achievable only at low nanoparticleloadings. The impact of nanoparticle aggregationwas seen in trendsin the peak melting temperatures, the peak crystallizationtemperatures, and crystallization half-times where maximumchanges in these quantities were seen for dispersed nanoparticles.The dynamic mechanical property trends showed a lesser depen-dence on the level of nanoparticle aggregation. While the overalllevel of reinforcement would likely be improved if nanoparticleaggregation could be prevented, the differences in general rein-forcement behavior between a matrix with approximately 70%crystallinity and a matrix with approximately 40% crystallinitywere distinct at temperatures well above Tg. These changes resultedfrom a lesser amount of amorphous polymer available for interac-tion with the nanoparticles. Taken together, these results providean increased understanding of how polymer attributes affectpolymer nanocomposite properties, leading to more effectivedesign capabilities for these materials.
Acknowledgments
The authors gratefully acknowledge funding from GeorgiaInstitute of Technology, the Solvay Advanced Polymers YoungFaculty Award, and the National Science Foundation under AwardCMMI-0800019.
References
[1] Fukushima Y, Inagaki S. Journal of Inclusion Phenomena 1987;5(4):473e82.[2] Fukushima Y, Okada A, Kawasumi M, Kurauchi T, Kamigaito O. Clay Minerals
1988;23(1):27e34.[3] Kojima Y, Usuki A, Kawasumi M, Okada A, Fukushima Y, Kurauchi T, et al.
Journal of Materials Research 1993;8(5):1185e9.[4] Usuki A, Kojima Y, Kawasumi M, Okada A, Fukushima Y, Kurauchi T, et al.
Journal of Materials Research 1993;8(5):1179e84.[5] Sternstein SS, Zhu A-J. Macromolecules 2002;35(19):7262e73.[6] Ramanathan T, Liu H, Brinson LC. Journal of Polymer Science Part B-Polymer
Physics 2005;43(17):2269e79.[7] Sternstein SS, Amanuel S, Shofner ML. Rubber Chemistry and Technology
2010;83(2):181e98.[8] Velasco-Santos C, Martínez-Hernández AL, Fisher FT, Ruoff RS, Castaño VM.
Chemistry of Materials 2003;15:4470e5.[9] Ash BJ, Siegel RW, Schadler LS. Journal of Polymer Science Part B: Polymer
Physics 2004;42(23):4371e83.[10] Bansal A, Yang H, Li C, Cho K, Benicewicz BC, Kumar SK, et al. Nature Materials
2005;4(9):693e8.[11] Mackay ME, Dao TT, Tuteja A, Ho DL, Van Horn B, Kim H-C, et al. Nature
Materials 2003;2(11):762e6.[12] Reddy MJ, Chu PP, Kumar JS, Rao UVS. Journal of Power Sources 2006;161(1):
535e40.[13] Waddon AJ, Petrovic ZS. Polymer Journal 2002;34(12):876e81.[14] Strawhecker KE, Manias E. Chemistry of Materials 2003;15(4):844e9.[15] Ratna D, Divekar S, Samui AB, Chakraborty BC, Banthia AK. Polymer 2006;
47(11):4068e74.[16] Jin J, Song M, Pan F. Thermochimica Acta 2007;456(1):25e31.[17] Tzavalas S, Drakonakis V, Mouzakis DE, Fischer D, Gregoriou VG. Macromol-
ecules 2006;39(26):9150e6.[18] Grady BP, Pompeo F, Shambaugh RL, Resasco DE. Journal of Physical Chem-
istry B 2002;106(23):5852e8.[19] Jain S, Goossens H, van Duin M, Lemstra P. Polymer 2005;46(20):8805e18.
J. Kaur et al. / Polymer 52 (2011) 4337e43444344
[20] Ljungberg N, Cavaille JY, Heux L. Polymer 2006;47(18):6285e92.[21] Kalaitzidou K, Fukushima H, Askeland P, Drzal LT. Journal of Materials Science
2008;43(8):2895e907.[22] Priya L, Jog JP. Journal of Applied Polymer Science 2003;89(8):2036e40.[23] Peng QY, Cong PH, Liu XJ, Liu TX, Huang S, Li TS. Wear 2009;266(7e8):
713e20.[24] Ince-Gunduz BS, Alpern R, Amare D, Crawford J, Dolan B, Jones S, et al.
Polymer 2010;51(6):1485e93.[25] Mago G, Fisher FT, Kalyon DM. Journal of Nanoscience and Nanotechnology
2009;9(5):3330e40.[26] Fornes TD, Paul DR. Polymer 2003;44(14):3945e61.[27] Swain SK, Isayev AI. Journal of Applied Polymer Science 2009;114(4):
2378e87.[28] Ozdilek C, Kazimierczak K, Picken SJ. Polymer 2005;46(16):6025e34.[29] Fang XW, Li XH, Yu LG, Zhang ZJ. Journal of Applied Polymer Science 2010;
115(6):3339e47.[30] Zheng JR, Siegel RW, Toney CG. Journal of Polymer Science Part B-Polymer
Physics 2003;41(10):1033e50.[31] Kaur J, Shofner ML. Macromolecular Chemistry and Physics 2009;210(8):
677e88.[32] Bose S, Saha SK. Chemistry of Materials 2003;15:4464e9.[33] Kong LB, Ma J, Boey F. Journal of Materials Science 2002;37(6):1131e4.[34] Aoki H. Science and Medical Applications of Hydroxyapatite: Ishiyaku Euro-
america; 1992.[35] Koutsopoulos S. Journal of Biomedical Materials Research 2002;62(4):600e12.[36] Bittiger H, Marchessault RH, Niegisch WD. Acta Crystallographica Section B
1970;26(12):1923e7.[37] Cornibert J, Marchessault RH. Journal of Molecular Biology 1972;71(3):
735e56.
[38] Grassie N, Murray EJ, Holmes PA. Polymer Degradation and Stability 1984;6(2):95e103.
[39] Lupke T, Radusch HJ, Metzner K. Macromolecular Symposia 1998;127:227e40.
[40] Shofner ML, Kaur J, Lee JH. Effect of matrix crystallinity on nanocompositeproperties. Lake Buena Vista, Florida: ASME 2009 International MechanicalEngineering Congress and Exposition; 2009.
[41] Barham PJ, Keller A, Otun EL, Holmes PA. Journal of Materials Science 1984;19(9):2781e94.
[42] Avrami M. Journal of Chemical Physics 1939;7(12):1103e12.[43] Schubnell M. Measurement of thin films in shear by DMA. Mettler Toledo
thermal analysis user Com, vol. 29; 2009.[44] Gunaratne L, Shanks RA, Amarasinghe G. Thermochimica Acta 2004;
423(1e2):127e35.[45] Pearce R, Marchessault RH. Polymer 1994;35(18):3990e7.[46] Righetti MC, Di Lorenzo ML. Thermochimica Acta 2011;512(1e2):59e66.[47] Lee Y, Porter RS, Lin JS. Macromolecules 1989;22(4):1756e60.[48] Minakov AA, Mordvintsev DA, Schick C. Polymer 2004;45:3755e63.[49] Barham PJ. Journal of Materials Science 1984;19(12):3826e34.[50] Joshi M, Butola BS, Simon G, Kukaleva N. Macromolecules 2006;39(5):
1839e49.[51] Pan H, Qiu Z. Macromolecules 2010;43(3):1499e506.[52] Sánchez-Soto M, Illescas S, Milliman H, Schiraldi DA, Arostegui A. Macromo-
lecular Materials and Engineering 2010;295(9):846e58.[53] Hato MJ, Ray SS, Luyt AS. Macromolecular Materials and Engineering 2008;
293(9):752e62.[54] Leiva A, Gargallo L, Radic D. Journal of Macromolecular Science-Pure and
Applied Chemistry 2004;A41(5):577e83.[55] Smith R, Pitrola R. Journal of Applied Polymer Science 2002;83(5):997e1008.