Embed Size (px)
Citation preview
Proc. Schl. Eng. Tokai Univ., Ser. E 40(2015)■-■
Vol. XXXX, 2015
―1―
*1 Research Student, School of Engineering *2 Professor, Department of Civil Engineering
Influence of Relative Permeability and Viscosity Ratio on
Oil Displacement by Water in Petroleum Reservoir
by
Jamil NAZARI*1, Fahim NASIRY*1, Naweed SEDDIQI*1 and Shigeo HONMA*2
(Received on Mar. 3, 2015 and accepted on May 14, 2015)
Abstract
Displacement of oil by water in a petroleum reservoir is analyzed under the Buckley-Liverett frontal displacement theory. The derivation and preconditions of the theory are pursued, focusing on the key factors that control displacement. The theory is applied to the waterflooding technique commonly employed in petroleum engineering to maintain oil production recovery, and the methods for evaluating the average water saturation behind the water front and the oil recovery factor in the reservoir are presented. The influences of relative permeability and the viscosity ratio between two immiscible liquids on the oil production efficiency during the operation are investigated. As a result, it is revealed that the influence of the viscosity ratio between displaced liquid (here, oil) and displacing liquid (water), rather than changing in relative permeability, dominates the degree of oil recovery. The connate water saturation, viz. irreducible water saturation, in the reservoir also significantly influences recovery. Keywords: Petroleum reservoir, Two-phase flow, Immiscible displacement, Relative permeability,
Waterflooding technique, Buckley-Leverett analysis, Recovery factor, Water-cut
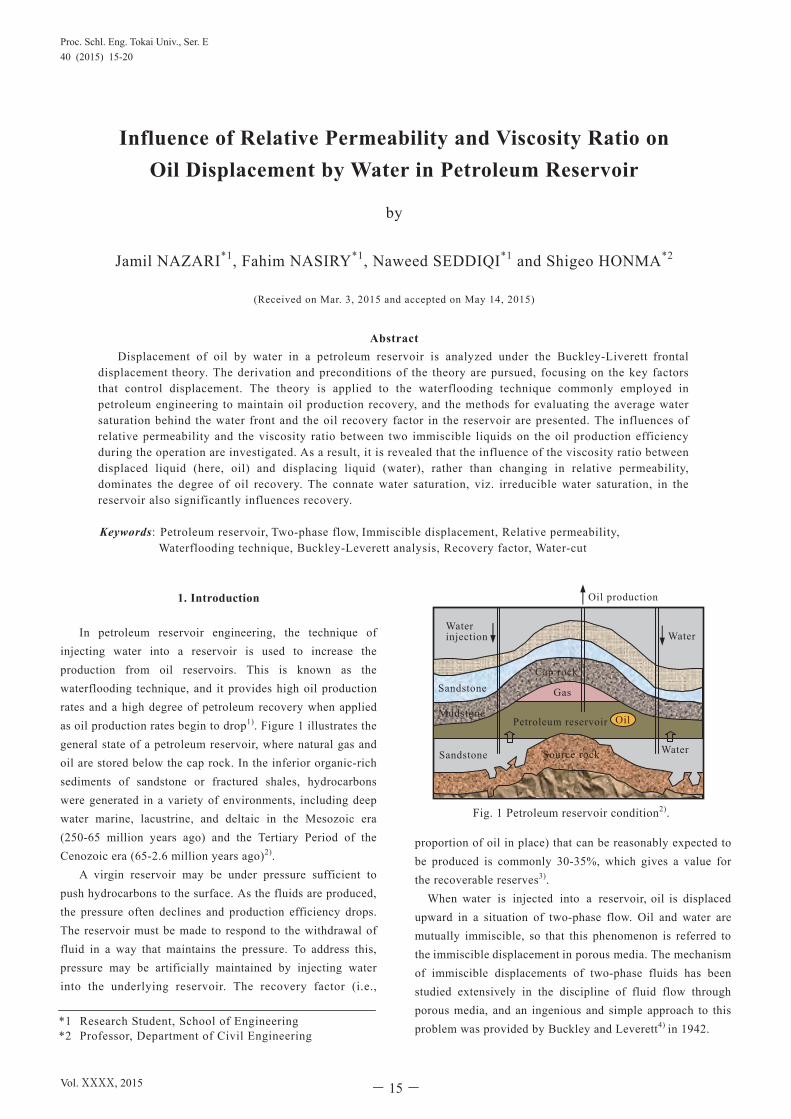
1. Introduction In petroleum reservoir engineering, the technique of injecting water into a reservoir is used to increase the production from oil reservoirs. This is known as the waterflooding technique, and it provides high oil production rates and a high degree of petroleum recovery when applied as oil production rates begin to drop1). Figure 1 illustrates the general state of a petroleum reservoir, where natural gas and oil are stored below the cap rock. In the inferior organic-rich sediments of sandstone or fractured shales, hydrocarbons were generated in a variety of environments, including deep water marine, lacustrine, and deltaic in the Mesozoic era (250-65 million years ago) and the Tertiary Period of the Cenozoic era (65-2.6 million years ago)2).
A virgin reservoir may be under pressure sufficient to push hydrocarbons to the surface. As the fluids are produced, the pressure often declines and production efficiency drops. The reservoir must be made to respond to the withdrawal of fluid in a way that maintains the pressure. To address this, pressure may be artificially maintained by injecting water into the underlying reservoir. The recovery factor (i.e.,
proportion of oil in place) that can be reasonably expected to be produced is commonly 30-35%, which gives a value for the recoverable reserves3).
When water is injected into a reservoir, oil is displaced
upward in a situation of two-phase flow. Oil and water are mutually immiscible, so that this phenomenon is referred to the immiscible displacement in porous media. The mechanism of immiscible displacements of two-phase fluids has been studied extensively in the discipline of fluid flow through porous media, and an ingenious and simple approach to this problem was provided by Buckley and Leverett4) in 1942.
Fig. 1 Petroleum reservoir condition2).
Oil production
Water
Petroleum reservoir
Sandstone
Sandstone
Waterinjection Water
Source rock
Mudstone Oil
Gas
Cap rock
Vol. ⅩⅩⅩⅩ, 2015 - 15-
Proc. Schl. Eng. Tokai Univ., Ser. E40 (2015) 15-20
Influence of Relative Permeability and Viscosity Ratio on Oil Displacement by Water in Petroleum Reservoir
Proceedings of the School of Engineering Tokai University, Series E
―2―
The Buckley-Leverett frontal displacement theory describes a method for calculating saturation profiles on the basis of the relative permeability, assuming that the effect of capillary pressure between the two fluids and the gravitational effects are neglected. According to this theory, the advance of a saturation front by displacing fluid is largely affected by the permeability of oil and water relative to reservoir rock, and to the viscosity ratio between the two fluids. Table 1 represents properties of crude oils at some production area, where there is a variety of viscosities and pour points, from light to heavy oil. (The pour point is the temperature at which oil becomes semi- solid and loses its flow characteristics. In crude oil, a high pour point is generally associated with high paraffin content.) The relative permeability, which typically exhibits an inverse relation with saturation, may also control oil production recovery. In this paper, the Buckley-Liverett frontal displa- cement theory is reviewed first, and the influence of relative permeability and viscosity ratio on the displacement of oil by water is investigated.
2. Buckley-Leverett Analysis The flow rate of oil and water through a completely saturated porous medium in the vertical direction is given by the Darcy’s law as follows.
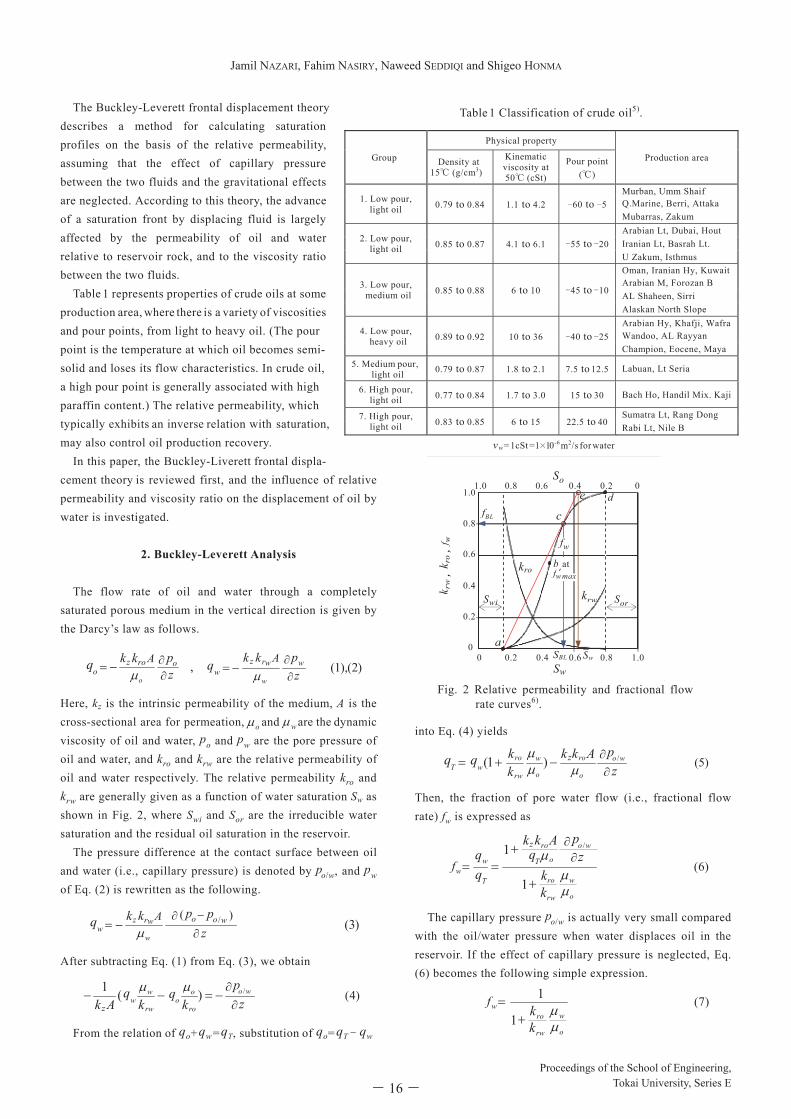
Here, kz is the intrinsic permeability of the medium, A is the cross-sectional area for permeation, and are the dynamic viscosity of oil and water, po and pw are the pore pressure of oil and water, and kro and krw are the relative permeability of oil and water respectively. The relative permeability kro and krw are generally given as a function of water saturation Sw as shown in Fig. 2, where Swi and Sor are the irreducible water saturation and the residual oil saturation in the reservoir. The pressure difference at the contact surface between oil and water (i.e., capillary pressure) is denoted by po/w, and pw of Eq. (2) is rewritten as the following. After subtracting Eq. (1) from Eq. (3), we obtain
From the relation of qo+ qw = qT, substitution of qo= qT - qw
into Eq. (4) yields
Then, the fraction of pore water flow (i.e., fractional flow rate) fw is expressed as
The capillary pressure po/w is actually very small compared with the oil/water pressure when water displaces oil in the reservoir. If the effect of capillary pressure is neglected, Eq. (6) becomes the following simple expression.
Group
Physical property
Production area Density at 15℃ (g/cm3)
Kinematic viscosity at 50℃ (cSt)
Pour point (℃)
1. Low pour, light oil 0.79 to 0.84 1.1 to 4.2 -60 to -5
Murban, Umm Shaif Q.Marine, Berri, Attaka Mubarras, Zakum
2. Low pour, light oil 0.85 to 0.87 4.1 to 6.1 -55 to -20
Arabian Lt, Dubai, Hout Iranian Lt, Basrah Lt. U Zakum, Isthmus
3. Low pour, medium oil 0.85 to 0.88 6 to 10 -45 to -10
Oman, Iranian Hy, KuwaitArabian M, Forozan B AL Shaheen, Sirri Alaskan North Slope
4. Low pour, heavy oil 0.89 to 0.92 10 to 36 -40 to -25
Arabian Hy, Khafji, WafraWandoo, AL Rayyan Champion, Eocene, Maya
5. Medium pour,light oil 0.79 to 0.87 1.8 to 2.1 7.5 to 12.5 Labuan, Lt Seria
6. High pour, light oil 0.77 to 0.84 1.7 to 3.0 15 to 30 Bach Ho, Handil Mix. Kaji
7. High pour, light oil 0.83 to 0.85 6 to 15 22.5 to 40
Sumatra Lt, Rang Dong Rabi Lt, Nile B
ν w = 1cSt =1×1 0-6 m2/s for water
o w
)3()( /
zppkk woowrz
ww
Aq
)4(/)(1z
pk
qk
qAk
wo
ro
oo
rw
ww
z
)5(/)1( zpAkk
kk wo
o
ro
o
w
rw
rowT
zqq
)6(1
1 /
o
w
rw
ro
wo
oT
ro
T
ww
kk
zp
qAkk
z
f
)7(1
1
o
w
rw
row
kk
f
Table 1 Classification of crude oil5).
1.0
0.8
0.6
0.4
0.2
00 0.2 0.4 0.6 0.8 1.0 SBL
krw
kro
Swi Sor
c d
1.0 0.8 0.6 0.4 0.2 0
k rw
, k r
o , f
ww
fw
e
Sw
So
Sw
b at f ʼ w max
Fig. 2 Relative permeability and fractional flow rate curves6).
a
fBL
,zpkk oroz
oo
Aq )2(),1(z
pkk wwrzw
w
Aq
Proceedings of the School of Engineering,Tokai University, Series E- 16-
Jamil NAZARI, Fahim NASIRY, Naweed SEDDIQI and Shigeo HONMA
Jamil NAZARI, Fahim NASIRY, Naweed SEDDIQI and Shigeo HONMA
Vol. XXXX, 2015
―3―
On the other hand, the continuity equation may be introduced to take the conservation of fluid mass into consideration, and this is expressed as whereφ is the porosity of the reservoir rock. Using the relations of qw= fw qT and fw (Sw), Eq. (8) is rewritten as
Since Sw ( z, t ), we can write the following expression for
saturation change In Eq. (10), we follow a fluid of constant saturation during
the displacement process; thus, we have
Then, it follows that
Substituting Eq. (12) into Eq. (9), we obtain
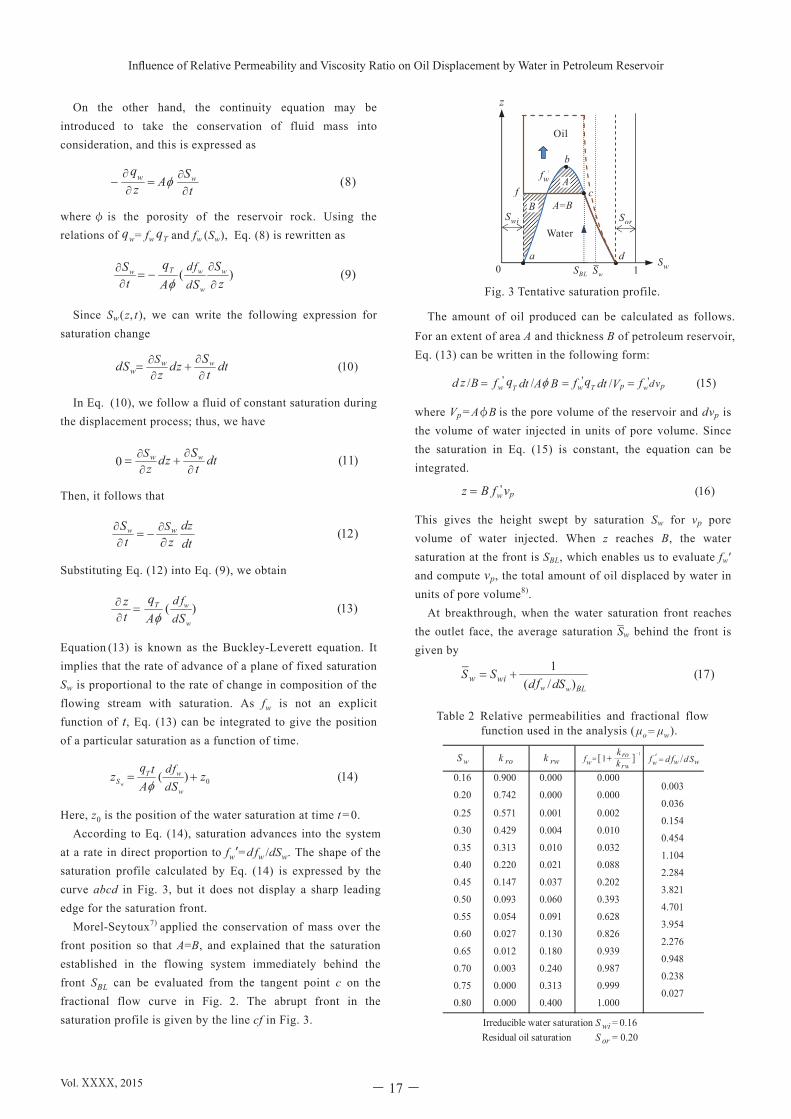
Equation (13) is known as the Buckley-Leverett equation. It implies that the rate of advance of a plane of fixed saturation Sw is proportional to the rate of change in composition of the flowing stream with saturation. As fw is not an explicit function of t, Eq. (13) can be integrated to give the position of a particular saturation as a function of time. Here, z0 is the position of the water saturation at time t = 0. According to Eq. (14), saturation advances into the system at a rate in direct proportion to fwʼ= d fw /dSw. The shape of the saturation profile calculated by Eq. (14) is expressed by the curve abcd in Fig. 3, but it does not display a sharp leading edge for the saturation front.
Morel-Seytoux7) applied the conservation of mass over the front position so that A=B, and explained that the saturation established in the flowing system immediately behind the front SBL can be evaluated from the tangent point c on the fractional flow curve in Fig. 2. The abrupt front in the saturation profile is given by the line cf in Fig. 3.
The amount of oil produced can be calculated as follows. For an extent of area A and thickness B of petroleum reservoir, Eq. (13) can be written in the following form:
where Vp = Aφ B is the pore volume of the reservoir and d vp is the volume of water injected in units of pore volume. Since the saturation in Eq. (15) is constant, the equation can be integrated. This gives the height swept by saturation Sw for vp pore volume of water injected. When z reaches B, the water saturation at the front is SBL, which enables us to evaluate fwʼ and compute vp, the total amount of oil displaced by water in units of pore volume8). At breakthrough, when the water saturation front reaches the outlet face, the average saturation Sw behind the front is given by
)8(t
SAzwwq
)9()(z
SSAt
S w
w
wTw
dfdq
)13()(w
wT
SAtz
dfdq
)14()( 0zSA
tqz
w
wTS d
fdw
Fig. 3 Tentative saturation profile.
)10(dtt
Szdz
Sd www
S
)11(0 dtt
Szdz
wwS
)12(dtdz
ztS wSw
)15(/// '''ppww vdwTT fVdtfBAdtfBzd qq
)16(' pwvfBz
Table 2 Relative permeabilities and fractional flow function used in the analysis ( μo = μw).
)17()/(
1
BLww dSfdSS wiw
d a
z
fw’
1 0 SBL
c
Sw
f
Oil
Water
b
A=B Swi Sor
A
B
Sw
Irreducible water saturation S wi = 0.16 Residual oil saturation S or = 0.20
0.80 0.000 0.400 1.000
0.70 0.003 0.240 0.9870.238
0.75 0.000 0.313 0.9990.027
0.60 0.027 0.130 0.8262.276
0.65 0.012 0.180 0.9390.948
0.50 0.093 0.060 0.3934.701
0.55 0.054 0.091 0.6283.954
0.40 0.220 0.021 0.0882.284
0.45 0.147 0.037 0.2023.821
0.30 0.429 0.004 0.0100.454
0.35 0.313 0.010 0.0321.104
0.20 0.742 0.000 0.0000.036
0.25 0.571 0.001 0.0020.154
S w k ro k rw
0.16 0.900 0.000 0.0000.003
11
wr
row k
kf ww Sddf f'
w /
Vol. ⅩⅩⅩⅩ, 2015 - 17-
Influence of Relative Permeability and Viscosity Ratio on Oil Displacement by Water in Petroleum Reservoir
Influence of Relative Permeability and Viscosity Ratio on Oil Displacement by Water in Petroleum Reservoir
Proceedings of the School of Engineering Tokai University, Series E
―4―
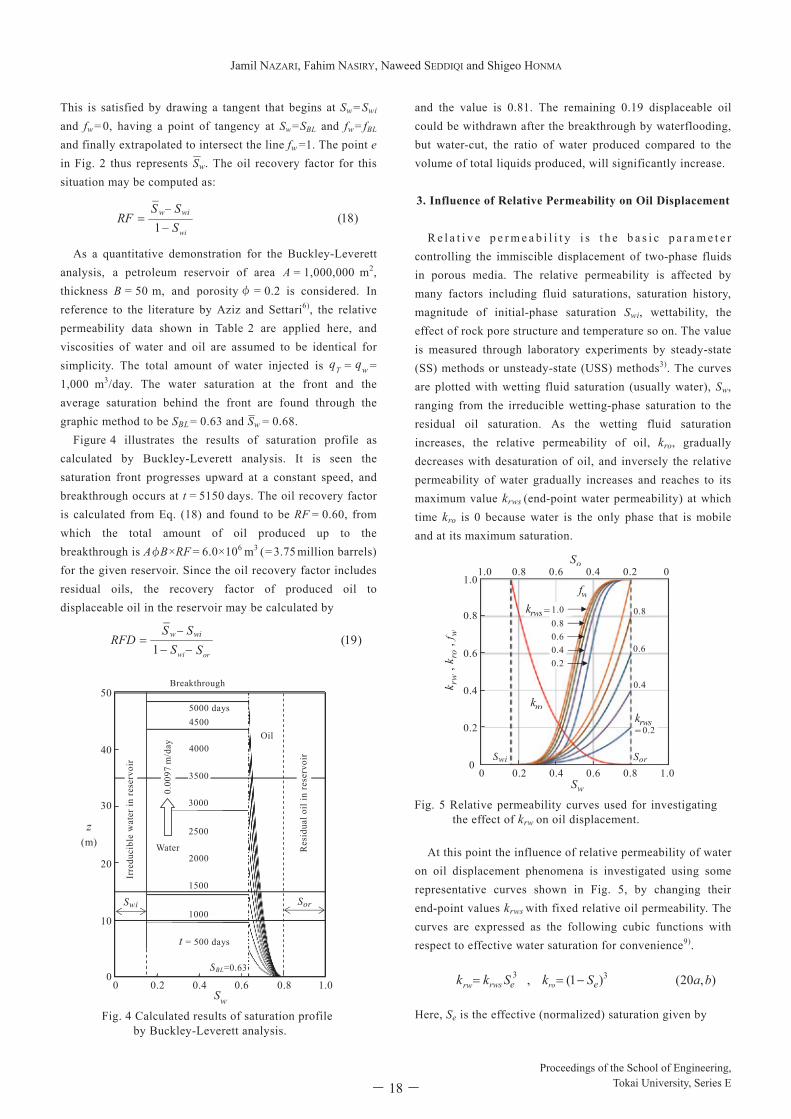
This is satisfied by drawing a tangent that begins at Sw = Swi and fw = 0, having a point of tangency at Sw = SBL and fw = fBL and finally extrapolated to intersect the line fw =1. The point e in Fig. 2 thus represents Sw. The oil recovery factor for this situation may be computed as: As a quantitative demonstration for the Buckley-Leverett analysis, a petroleum reservoir of area A = 1,000,000 m2, thickness B = 50 m, and porosityφ = 0.2 is considered. In reference to the literature by Aziz and Settari6), the relative permeability data shown in Table 2 are applied here, and viscosities of water and oil are assumed to be identical for simplicity. The total amount of water injected is qT = qw =
1,000 m3/day. The water saturation at the front and the average saturation behind the front are found through the graphic method to be SBL = 0.63 and Sw = 0.68. Figure 4 illustrates the results of saturation profile as calculated by Buckley-Leverett analysis. It is seen the saturation front progresses upward at a constant speed, and breakthrough occurs at t = 5150 days. The oil recovery factor is calculated from Eq. (18) and found to be RF = 0.60, from which the total amount of oil produced up to the breakthrough is Aφ B ×RF = 6.0×10⁶
m3 ( = 3.75 million barrels)
for the given reservoir. Since the oil recovery factor includes residual oils, the recovery factor of produced oil to displaceable oil in the reservoir may be calculated by
and the value is 0.81. The remaining 0.19 displaceable oil could be withdrawn after the breakthrough by waterflooding, but water-cut, the ratio of water produced compared to the volume of total liquids produced, will significantly increase. 3. Influence of Relative Permeability on Oil Displacement
R e l a t i v e p e r m e a b i l i t y i s t h e b a s i c p a r a m e t e r controlling the immiscible displacement of two-phase fluids in porous media. The relative permeability is affected by many factors including fluid saturations, saturation history, magnitude of initial-phase saturation Swi, wettability, the effect of rock pore structure and temperature so on. The value is measured through laboratory experiments by steady-state (SS) methods or unsteady-state (USS) methods3). The curves are plotted with wetting fluid saturation (usually water), Sw, ranging from the irreducible wetting-phase saturation to the residual oil saturation. As the wetting fluid saturation increases, the relative permeability of oil, kro, gradually decreases with desaturation of oil, and inversely the relative permeability of water gradually increases and reaches to its maximum value krws (end-point water permeability) at which time kro is 0 because water is the only phase that is mobile and at its maximum saturation.
At this point the influence of relative permeability of water on oil displacement phenomena is investigated using some representative curves shown in Fig. 5, by changing their end-point values krws with fixed relative oil permeability. The curves are expressed as the following cubic functions with respect to effective water saturation for convenience9). Here, Se is the effective (normalized) saturation given by
)18(1 wiS
SSRF iww
Fig. 4 Calculated results of saturation profile by Buckley-Leverett analysis.
)19(1 orwi SS
SSRFD iww
Fig. 5 Relative permeability curves used for investigating the effect of krw on oil displacement.
),20()1(, 33 baSS ee rokkk rwsrw
Sw
k rw
, k r
o , f
w
So
0 0.2 0.4 0.6 0.8 1.0
1.0 0.8 0.6 0.4 0.2 01.0
0.8
0.6
0.4
0.2
0
krws = 0.2
krws= 1.0 0.8 0.6 0.4 0.2
0.4
0.6
0.8
Sor Swi
kro
fw
Irre
duci
ble
wat
er in
rese
rvoi
r
SBL=0.63
t = 500 days
1000
1500
2000
2500
3000
3500
4000
4500 5000 days
Sor Swi
Res
idua
l oil
in re
serv
oir
0 0.2 0.4 0.6 0.8 1.0
50
40
30
20
10
0
(m) z
Sw
0.00
97 m
/day
Water
Oil
Breakthrough
Proceedings of the School of Engineering,Tokai University, Series E- 18-
Jamil NAZARI, Fahim NASIRY, Naweed SEDDIQI and Shigeo HONMA
Jamil NAZARI, Fahim NASIRY, Naweed SEDDIQI and Shigeo HONMA
Vol. XXXX, 2015
―5―
The fractional flow rate of water, fw, is calculated from Eq. (7) assuming that the viscosities of two fluids are the same. It is seen from Fig. 5 that the locations of fractional flow curves are shifted to the left almost in parallel, and the range of the movement is small.
The water saturation at the displacement front SBL and the average saturation behind the front Sw are obtained by the methods previously described in Section 2. Figure 6 shows the changes in SBL and Sw with krws, from which the influence of relative water permeability on the advances of saturation front can be considered insignificant.
4. Influence of Viscosity Ratio on Oil Displacement
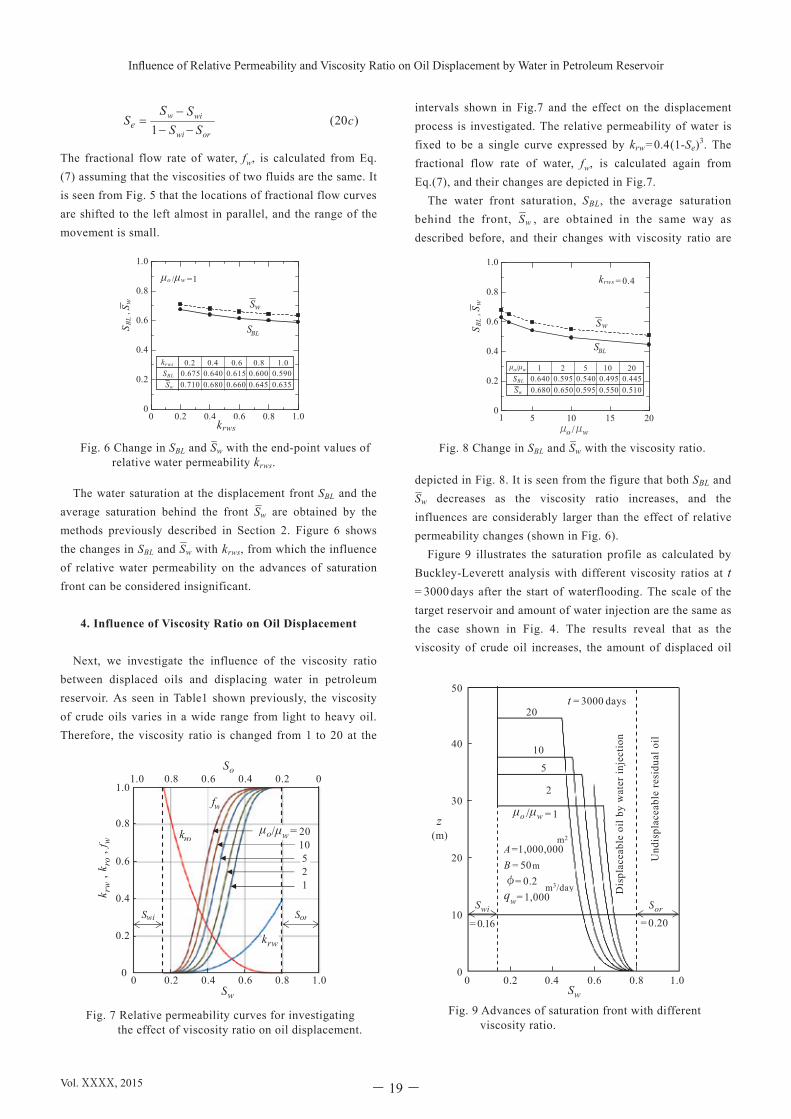
Next, we investigate the influence of the viscosity ratio between displaced oils and displacing water in petroleum reservoir. As seen in Table1 shown previously, the viscosity of crude oils varies in a wide range from light to heavy oil. Therefore, the viscosity ratio is changed from 1 to 20 at the
intervals shown in Fig.7 and the effect on the displacement process is investigated. The relative permeability of water is fixed to be a single curve expressed by krw = 0.4 (1-Se)3. The fractional flow rate of water, fw, is calculated again from Eq.(7), and their changes are depicted in Fig.7. The water front saturation, SBL, the average saturation behind the front, Sw , are obtained in the same way as described before, and their changes with viscosity ratio are depicted in Fig. 8. It is seen from the figure that both SBL and Sw decreases as the viscosity ratio increases, and the influences are considerably larger than the effect of relative permeability changes (shown in Fig. 6). Figure 9 illustrates the saturation profile as calculated by Buckley-Leverett analysis with different viscosity ratios at t = 3000 days after the start of waterflooding. The scale of the target reservoir and amount of water injection are the same as the case shown in Fig. 4. The results reveal that as the viscosity of crude oil increases, the amount of displaced oil
0 0.2 0.4 0.6 0.8 1.00
0.2
0.4
0.6
0.8
1.0
Sw
SBL
krws
SwS
BL,
krws 0.2 0.4 0.6 0.8 1.0 SBL 0.675 0.640 0.615 0.600 0.590
Sw 0.710 0.680 0.660 0.645 0.635
krws
μo /μw = 1
Fig. 6 Change in SBL and Sw with the end-point values of relative water permeability krws.
)20(1
cSS
Sorwi
wiw SSe
Fig. 7 Relative permeability curves for investigating the effect of viscosity ratio on oil displacement.
Fig. 8 Change in SBL and Sw with the viscosity ratio.
5 10 15 200
0.2
0.4
0.6
0.8
1.0
Sw
SBL
SwS
BL,
1μ μo w/
μo/μw 1 2 5 10 20 SBL 0.640 0.595 0.540 0.495 0.445
Sw 0.680 0.650 0.595 0.550 0.510
krws = 0.4
Fig. 9 Advances of saturation front with different viscosity ratio.
μo /μw = 1
0 0.2 0.4 0.6 0.8 1.0
t = 3000 days
Und
ispl
acea
ble
resi
dual
oil
Dis
plac
eabl
e oi
l by
wat
er in
ject
ion
A =1,000,000 B = 50 m φ= 0.2 qw= 1,000
m2
m3/day
5
10
20
Swi
= 0.16
Sor
= 0.20
50
40
30
20
10
0
Sw
(m)z
2
Sw i Sor
kro
krw
fw
So
Sw
k rw
, k r
o , f
w
0 0.2 0.4 0.6 0.8 1.0
1.0
0.8
0.6
0.4
0.2
0
1.0 0.8 0.6 0.4 0.2 0
10 5 2 1
μo/μw = 20
Vol. ⅩⅩⅩⅩ, 2015 - 19-
Influence of Relative Permeability and Viscosity Ratio on Oil Displacement by Water in Petroleum Reservoir
Influence of Relative Permeability and Viscosity Ratio on Oil Displacement by Water in Petroleum Reservoir
Proceedings of the School of Engineering Tokai University, Series E
―6―
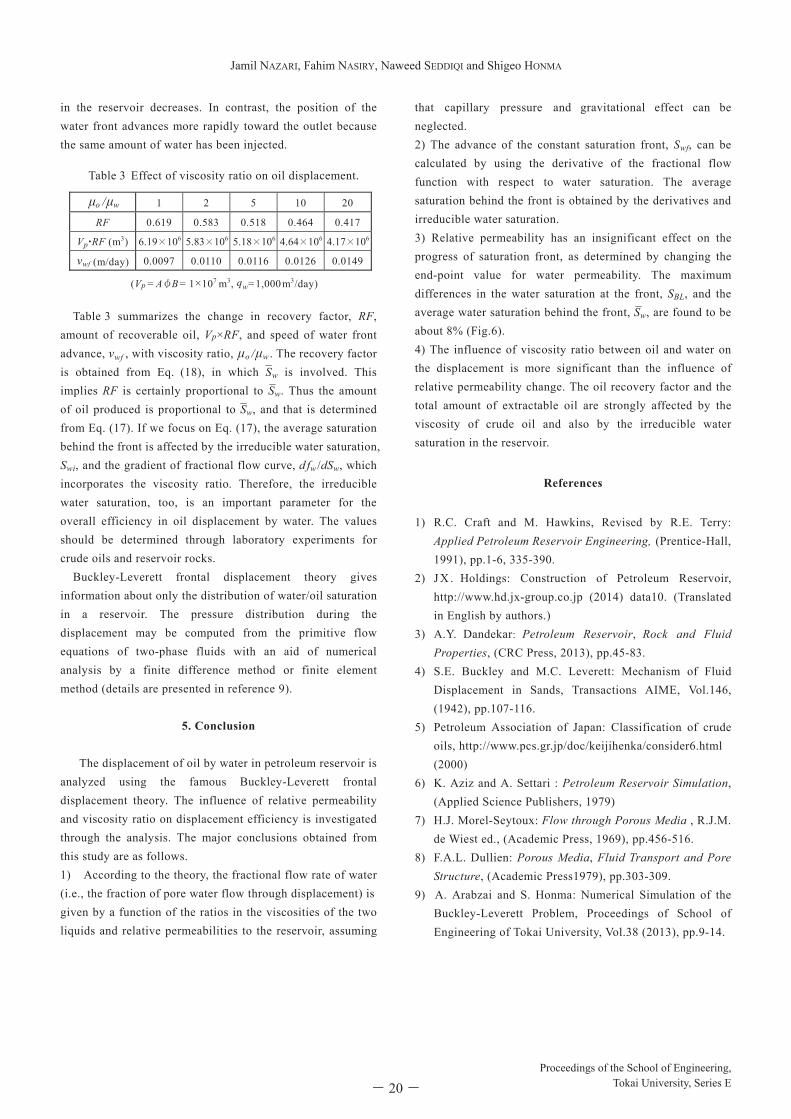
in the reservoir decreases. In contrast, the position of the water front advances more rapidly toward the outlet because the same amount of water has been injected.
Table 3 summarizes the change in recovery factor, RF, amount of recoverable oil, Vp×RF, and speed of water front advance, vwf , with viscosity ratio, μ o / μ w . The recovery factor is obtained from Eq. (18), in which Sw is involved. This implies RF is certainly proportional to Sw. Thus the amount of oil produced is proportional to Sw, and that is determined from Eq. (17). If we focus on Eq. (17), the average saturation behind the front is affected by the irreducible water saturation, Swi, and the gradient of fractional flow curve, d fw /dSw, which incorporates the viscosity ratio. Therefore, the irreducible water saturation, too, is an important parameter for the overall efficiency in oil displacement by water. The values should be determined through laboratory experiments for crude oils and reservoir rocks. Buckley-Leverett frontal displacement theory gives information about only the distribution of water/oil saturation in a reservoir. The pressure distribution during the displacement may be computed from the primitive flow equations of two-phase fluids with an aid of numerical analysis by a finite difference method or finite element method (details are presented in reference 9).
5. Conclusion The displacement of oil by water in petroleum reservoir is analyzed using the famous Buckley-Leverett frontal displacement theory. The influence of relative permeability and viscosity ratio on displacement efficiency is investigated through the analysis. The major conclusions obtained from this study are as follows. 1) According to the theory, the fractional flow rate of water (i.e., the fraction of pore water flow through displacement) is given by a function of the ratios in the viscosities of the two liquids and relative permeabilities to the reservoir, assuming
that capillary pressure and gravitational effect can be neglected. 2) The advance of the constant saturation front, Swf, can be calculated by using the derivative of the fractional flow function with respect to water saturation. The average saturation behind the front is obtained by the derivatives and irreducible water saturation. 3) Relative permeability has an insignificant effect on the progress of saturation front, as determined by changing the end-point value for water permeability. The maximum differences in the water saturation at the front, SBL, and the average water saturation behind the front, Sw, are found to be about 8% (Fig.6). 4) The influence of viscosity ratio between oil and water on the displacement is more significant than the influence of relative permeability change. The oil recovery factor and the total amount of extractable oil are strongly affected by the viscosity of crude oil and also by the irreducible water saturation in the reservoir.
References
1) R.C. Craft and M. Hawkins, Revised by R.E. Terry:
Applied Petroleum Reservoir Engineering, (Prentice-Hall, 1991), pp.1-6, 335-390.
2) J X . Holdings: Construction of Petroleum Reservoir, http://www.hd.jx-group.co.jp (2014) data10. (Translated in English by authors.)
3) A.Y. Dandekar: Petroleum Reservoir, Rock and Fluid Properties, (CRC Press, 2013), pp.45-83.
4) S.E. Buckley and M.C. Leverett: Mechanism of Fluid Displacement in Sands, Transactions AIME, Vol.146, (1942), pp.107-116.
5) Petroleum Association of Japan: Classification of crude oils, http://www.pcs.gr.jp/doc/keijihenka/consider6.html (2000)
6) K. Aziz and A. Settari : Petroleum Reservoir Simulation, (Applied Science Publishers, 1979)
7) H.J. Morel-Seytoux: Flow through Porous Media , R.J.M. de Wiest ed., (Academic Press, 1969), pp.456-516.
8) F.A.L. Dullien: Porous Media, Fluid Transport and Pore Structure, (Academic Press1979), pp.303-309.
9) A. Arabzai and S. Honma: Numerical Simulation of the Buckley-Leverett Problem, Proceedings of School of Engineering of Tokai University, Vol.38 (2013), pp.9-14.
μ o / μ w 1 2 5 10 20
RF 0.619 0.583 0.518 0.464 0.417
Vp・ RF (m3)
vwf (m/day) 0.0097 0.0110 0.0116 0.0126 0.0149
6.19×10⁶ 5.83×10⁶ 5.18×10⁶ 4.64×10⁶ 4.17×10⁶
Table 3 Effect of viscosity ratio on oil displacement.
(Vp = AφB = 1×10⁷ m3, qw= 1,000 m3/day)
Proceedings of the School of Engineering,Tokai University, Series E- 20-
Jamil NAZARI, Fahim NASIRY, Naweed SEDDIQI and Shigeo HONMA