Embed Size (px)
Citation preview

INFLUENCE OF SKILLS AND KNOWLEDGE ON THE RELATIONSHIP
BETWEEN PROJECT SCOPE MANAGEMENT AND IMPLEMENTATION OF
ECONOMIC STIMULUS PROJECTS IN PUBLIC SECONDARY SCHOOLS IN
KISUMU COUNTY, KENYA.
BY
ODHIAMBO, KENNETH OTIENO
A RESEARCH PROJECT REPORT SUBMITTED IN PARTIAL FULFILLMENT
OF THE REQUIREMENTS FOR THE AWARD OF THE DEGREE OF MASTER
OF ARTS IN PROJECT PLANNING AND MANAGEMENT OF THE UNIVERSITY
OF NAIROBI
2014

DECLARATION
This research is my own original work and has not been submitted for any award or
degree in any university.
Signature ……………………………… Date………………………………….
Odhiambo, Kenneth Otieno
L50/63326/2013
This research has been submitted for examination with our approval as University
supervisors:-
Signature ……………………………… Date………………………………….
Dr. Charles M. Rambo, PhD
Senior Lecturer,
Department of Extra-mural Studies,
University Of Nairobi
Signature ……………………………… Date………………………………….
Dr. Benson Ojwang. PhD
Lecturer
Department of Extra-mural studies
University of Nairobi

iii
DEDICATION
This research project is dedicated to my parents, Mr and Mrs Odhiambo, my brothers
Franklin and Nashon and my sister Winfred .It is my uttermost joy to share this pride
with you of furthering my education.

iv
ACKNOWLEDGEMENT
I am grateful to the University of Nairobi for offering me a conducive environment to do
my studies. I acknowledge my supervisors, Dr Charles Rambo and Dr. Benson Ojwang
for their unselfish time, direction, assistance and guidance they are offering me during the
formulation and development of this study. My profound gratitude goes to Dr. Raphael
Nyonje and Dr Odundo for their selfless input in this study. I also acknowledge and thank
all my lectures in this department for having assisted me in one way or another towards
the writing of this research proposal. I would also wish to acknowledge the late Dr. F.N
Owako for his insightful reminders about the need for further education, may almighty
God rest his soul in peace.
My sincere gratitude goes to my colleagues and friends, Mrs Jeniffer Otolo, the principal
Nyamira girls High school and the entire staff for giving me enabling environment to
accomplish this work. I sincerely thank my friends Mr Edwin Otieno, Omega and
Maureen for their encouragement and support throughout this study.
I would further like to acknowledge the co-operation and assistance that I have been
receiving from my fellow students and the entire subordinate staff at the University of
Nairobi, Kisumu campus. I also feel humbled by my family for their faith and support to
my efforts in achieving my goals academically. Lastly I would like to thank everyone
who may have taken part in the making of this research proposal in one way or the other.
All your efforts are highly appreciated.

v
TABLE OF CONTENTS PAGE
DECLARATION ................................................................................................................ ii
DEDICATION ................................................................................................................... iii
ACKNOWLEDGEMENT ................................................................................................. iv
TABLE OF CONTENTS .................................................................................................... v
LIST OF TABLES ............................................................................................................. ix
LIST OF FIGURES .......................................................................................................... xii
LIST OF ABBREVIATIONS AND ACRONYMS ........................................................ xiii
ABSTRACT ...................................................................................................................... xv
CHAPTER ONE ................................................................................................................. 1
INTRODUCTION .............................................................................................................. 1
1.1Background of the study ................................................................................................ 1
1.2 Statement of the problem .............................................................................................. 6
1.3 Purpose of the study ...................................................................................................... 7
1.4 Objectives of the study.................................................................................................. 7
1.5 Research questions ........................................................................................................ 8
1.6 Hypotheses of the study ................................................................................................ 9
1.7 Significance of the study ............................................................................................. 10
1.8 Basic assumptions of the study ................................................................................... 10
1.9 Limitations of the study .............................................................................................. 11
1.10 Delimitations of the study ......................................................................................... 11
1.11 Definitions of significant terms used in the study .................................................... 12
1.12 Organization of the study .......................................................................................... 14

vi
CHAPTER TWO .............................................................................................................. 15
LITERATURE REVIEW ................................................................................................. 15
2.1 Introduction ................................................................................................................. 15
2.2 Concept of skills and knowledge, project scope management and implementation of
Economic Stimulus Projects…………………………………………………. 15
2.3 Project initiation and implementation of Economic Stimulus Projects ...................... 18
2.4 Project Scope planning and implementation of Economic Stimulus Projects .......... 22
2.5 Project Scope definition and implementation of Economic Stimulus Projects .......... 26
2.6 Project scope verification and implementation of Economic Stimulus Projects ........ 34
2.7 Project change control and implementation of Economic Stimulus Projects ............. 36
2.8 Skills and knowledge of project scope management and implementation of Economic
Stimulus Projects……………………………………………………………… 44
2.9 Theoretical frame work ............................................................................................... 48
2.10 Conceptual Framework ............................................................................................. 49
2.11 Summary of literature ............................................................................................... 52
CHAPTER THREE .......................................................................................................... 54
RESEARCH METHODOLOGY...................................................................................... 54
3.1 Introduction ................................................................................................................. 54
3.2 Research Design.......................................................................................................... 54
3.3 Target Population ........................................................................................................ 55
3.4 Sample size and sampling procedure .......................................................................... 56
3.4.1 Sample size .............................................................................................................. 56
3.4.2 Sampling procedure ................................................................................................. 57
3.5 Research Instruments .................................................................................................. 58
3.5.1 Pilot testing .............................................................................................................. 59

vii
3.5.2 Validity of instruments ............................................................................................ 60
3.5.3 Reliability of instruments ......................................................................................... 61
3.6 Data collection procedure ........................................................................................... 62
3.7 Data Analysis techniques ............................................................................................ 62
3.8 Ethical Issues .............................................................................................................. 63
CHAPTER FOUR ............................................................................................................. 64
DATA ANALYSIS, PRESENTATION AND INTERPRETATIONS ............................ 64
4.1 Introduction ................................................................................................................. 64
4.2 Response return rate .................................................................................................... 64
4.3 Demographic characteristics of the respondents......................................................... 65
4.3.1 Distribution of respondents by Age ......................................................................... 65
4.3.2 Distribution of respondents by level of education ................................................... 66
4.4 Project initiation and implementation of Economic Stimulus projects ...................... 67
4.4.1 Project charter ........................................................................................................ 68
4.4.2 The project manager ................................................................................................ 71
4.43 project constraints and assumptions.......................................................................... 74
4.5 Project Scope Planning and Economic Stimulus Projects .......................................... 79
4.5.1 Scope statement ....................................................................................................... 82
4.5.2 Supporting details .................................................................................................... 83
4.5.3 Scope management plan .......................................................................................... 85
4.6 Project Scope Definition and Economic Stimulus Projects ...................................... 91
4.7 Project scope verification and Economic Stimulus Projects ..................................... 101
4.7.1 Accepted deliverables ............................................................................................ 101
4.7.2 Requested Changes ................................................................................................ 105
4.8 Project Change Control and Economic Stimulus Projects ........................................ 111

viii
4.8.1 Scope changes ........................................................................................................ 111
4.8.2 Corrective actions .................................................................................................. 116
4.8.3 Lessons Learned..................................................................................................... 119
4.9 Moderating influence of project skills and knowledge on the relationship between
project scope management and implementation of projects…………………... 122
CHAPTER FIVE ............................................................................................................ 140
SUMMARY OF FINDINGS, CONCLUSION AND RECOMMENDATIONS ........... 140
5.1 Introduction ............................................................................................................... 140
5.2 Summary of findings................................................................................................. 140
5.3 Conclusions of the study ........................................................................................... 144
5.4 Recommendations of the study ................................................................................. 145
5.4 Contribution to body of knowledge .......................................................................... 146
5.6Suggestions for further study ..................................................................................... 148
REFERENCES ............................................................................................................... 149
APPENDICES ................................................................................................................ 161
Transmittal letter ........................................................................................................... 161
Questionnaire. ................................................................................................................ 162
University letter of introduction...................................................................................... 171
Research authorization letter ........................................................................................... 172
Research clearance permit .............................................................................................. 173
Map of kisumu county ................................................................................................... 174

ix
LIST OF TABLES
Table 3.1: Shows stratification process ............................................................................ 57 Table 3.2: Sample size per school..................................................................................... 58 Table 4.1 Distribution of men and women respondents by Age....................................... 66
Table 4.2 Distribution of men and women by their level of education ............................ 67 Table 4.3 Responses to questions on scope initiation ....................................................... 68 Table 4.4 Cross tab between Project status and Project charter ....................................... 70 Table 4.5: Selection procedure of the project manager .................................................... 71 Table 4.6 :Competence of the project manager ................................................................ 72
Table 4.7: Application of project management techniques .............................................. 72 Table 4.8 :The competence of project manager against duration of the project ............... 74
Table 4.9 :Constraints and assumptions............................................................................ 75 Table 4.10: Accuracy of project assumptions .................................................................. 76 Table 4.11 :Validity of assumptions ................................................................................. 77 Table 4.12: Project assumptions and degree of scope control .......................................... 78
Table 4.13 Experience in scope planning ......................................................................... 80 Table 4.14: Stakeholder participation in scope planning process ..................................... 81
Table 4.15 Cross tabulation of participation in scope planning process and experience in
scope planning……………………………………………………………... 81
Table 4.16: Scope statement ............................................................................................. 82
Table 4.17: Clarity of the project objectives ..................................................................... 83 Table 4.18: Supporting details .......................................................................................... 84
Table 4.19 :Cross tabulation level of project coordination supporting details ................. 85 Table 20: Scope management plan ................................................................................... 85
Table 4.21: Reason for lack of scope management plan .................................................. 86 Table 4.22 :Cross tabulation degree of scope control and experience in scope planning 87
Table 4.23: Cross tabulation participation in scope planning process and experience in
scope planning………………………………………………………... 88
Table 4.24: Cross tabulation level of project coordination and scope statement .............. 88
Table 4.25 :Cross tabulation level of supervision and clarity of project objectives ......... 89 Table 4.26 :Chi-Square Tests on project scope planning and implementation of ESPs ... 91 Table 4. 27 :Responses to questions on scope definition .................................................. 92 Table 4.28: Details in the WBS dictionary ....................................................................... 94
Table 4.29: Detailed scope statement and project status .................................................. 97 Table 4. 30 :WBS dictionary and Scope control............................................................... 98
Table 4.31: Coordination challenges and WBS as tool .................................................... 99 Table 4.32: Scope definition and project completion on budget ...................................... 99 Table 4.33 Chi-Square Tests for relationship between scope definition and
implementation of ESPs…………………………………………………..100
Table 4.34: Inspection of the project .............................................................................. 102
Table 4. 35: Verification of Deliverables ....................................................................... 102 Table 4.36: Major Deliverables ...................................................................................... 103 Table 4.37 :Deliverables verified before acceptance ...................................................... 103

x
Table 4.38: Deliverables were verified and status of the project Cross tabulation ......... 104 Table 4.39: Requested changes ....................................................................................... 105 Table 4.40: Recommended corrective actions ................................................................ 106 Table 4.41: Work results compared against project plan .............................................. 107
Table 4. 42: Updated WBS ............................................................................................. 107 Table 4.43: Cross tabulation Work result comparison against project plan and degree of ..
quality
control……………………………………………………………….108
Table 4.44: Chi-Square tests ........................................................................................... 109
Table 4.45: Revision of results and deliverables against scope definition and Degree of....
scope
control……………………………………………………………………110
Table 4.46 :Chi-Square Test for project scope verification and implementation of ESPs
……………………………………………………………………………..111
Table4. 47: Change control system ................................................................................. 112 Table 4.48 :Objectivity of changes ................................................................................. 113
Table 4.49: Frequency of Changes ................................................................................. 114 Table4. 50: Scope creep .................................................................................................. 115 Table 4.51: Detection Of Project Deviation ................................................................... 117
Table 4.52 :Corrective Action......................................................................................... 118
Table 4.53: Cross tabulation between corrective action and project status .................... 118 Table4. 54 :Lessons learnt .............................................................................................. 120 Table 4.55: Project scope control .................................................................................... 120
Table 4.56 :Cross tabulation between lessons learnt and project scope control ............. 121 Table 4.57: Chi-Square Tests for scope change control and implementation of ESPs... 122
Table 4.58: Model summary regression of influence of skills and knowledge of project ....
initiation on the project status………..………………………………….….. 129
Table 4.59:The regression coefficient of project initiation on status of the project ....... 130 Table 4.60:Model Summary regression of scope planning on scope control ................. 131 Table 4.61:Regression coefficient of project scope planning on scope control ............. 132 Table4.62: Model Summary regression of project scope definition on completion of
project on budget…………………………………………………………..133
Table 4.63: Regression coefficent of project scope definition on completion of project on
Budget………………………………………………………………………134
Table 4.64: Model Summary regression of project scope verification on stakeholder
Satisfaction……………………………………………………………. 135
Table 4.65:Regression coefficient of project scope verification on stakeholder satisfaction
......................................................................................................................................... 136 Table 4. 66: Model Summary regression of project change control on scope control ... 137

xi
Table 4.67: Regression coefficient of project change control on scope control ............. 138

xii
LIST OF FIGURES
Figure 2.1: Project Scope Management Overview ........................................................... 48 Figure 2.2: Conceptual framework ................................................................................... 50

xiii
LIST OF ABBREVIATIONS AND ACRONYMS
ADB: African Development Bank
ADB: Asian Development Bank
ARRA: American Recovery and Reinvestment Act
BER: Building the Education Revolution
BOM: Board of Management
CBO: Congressional Budget Office
CDE: County Director of Education
CDF: Constituency Development Fund
DEB: District Education Board
DEO: District Education officer
DFID: Department for International Development
ESP: Economic Stimulus Program
FTI: Fast Track Initiative
KEMI: Kenya Education Management Institute
KESSP: Kenya Education Sector Support Programmes
LEA: Local Education Authority
MOE: Ministry of Education
ODA: Official Development Aid
OECF: Overseas Economic Cooperation Fund

xiv
PDRI: Project Definition Rating Index
PMBOK: Project Management Body of Knowledge
PSC: Project Steering Committee
SGB: School Governing Body
SIC: School Infrastructure Committee
SIDP: School Infrastructure Development Plan
SIIG: School Infrastructure Improvement Grants
SIMU: School Infrastructure Management Unit
SMC: School Management Committee
SPMC: Stimulus Project Management Committee
TCC: Technical Coordinating Committee
UNICEF: United Nations International Children‟s Emergency Fund

xv
ABSTRACT
The purpose of this study was to investigate influence of skills and knowledge on
the relationship between project scope management and implementation of economic
stimulus projects in public secondary schools in Kisumu County, Kenya. The objectives
were : to determine how project initiation as a project scope management influences the
implementation of ESP projects in public secondary schools; to establish the extent to
which project scope planning influence implementation of ESP projects in public
secondary schools; to assess how project scope definition influence implementation of
ESP projects in public secondary schools; to examine how project scope verification
influences influence the implementation of ESP projects in public secondary schools; to
establish the extent to which project change control influence implementation of ESP
projects in public secondary schools; to establish the moderating influence of project
skills and knowledge on the relationship between project scope management and
implementation of ESP projects in public secondary schools. The study targeted Boards
of Management and Project management Committees of 7 secondary schools that
benefited from the government initiative of ESP projects in Kisumu County. This gave a
target population of 189 respondents from which a sample size of 128 respondents was
drawn. In this study, descriptive survey research design was be used. Both qualitative and
quantitative research approaches were used. The study applied stratified random
sampling and judgmental sampling techniques. The study made use of questionnaires for
primary data collection and Qualitative data was collected through interviews. Validity
and reliability was done by piloting and carrying out the test and retest method.
Reliability test was be done using Pearson product‟s moment correlation co-efficient
formula a co-rrelation coefficient of .075 and 0.72 was obtained for Ministry of
educations and project committee questionnaires respectively this was acceptable to
research since it was above the recommended 0.7.Data was analyzed using Statistical
Package for Social Scientists(SPSS)The findings were; project initiation, project scope
planning, scope definition, scope verification and project change control influenced the
implementation of Economic Stimulus Projects in public secondary schools and also that
there is moderating influence of skills and knowledge on the relationship between scope
management and implementation of Economic Stimulus Projects in public secondary
schools.61.8% of the respondents reported project management techniques were
inadequately applied. Only 35.4% of the respondents admitted having a scope
management plan. Signinificant relationship was established between project initiation,
scope planning, scope definition, scope verification and project change control and
implementation of Economic Stimulus Projects, chi –square tests revealed p<0.05.Most
of the respondents did not have skills and knowledge of project scope management and
this influenced the implementation of the projects as most of the projects experienced
scope creep and are still being implemented long after their stated completion time. The
study recommends focused training of education stakeholders on project scope
management techniques and further research on how scope management can be improved
in educational projects.

1
CHAPTER ONE
INTRODUCTION
1.1 Background of the study
In response to the global financial and economic crisis that started in 2008, countries
around the world embarked on an unprecedented level of intervention. Within months of
the crisis, stimulus packages were announced, ranging for example from 1.4 percent of
GDP in the United Kingdom to close to 6 per cent of the GDP in the United States, and
over 12 percent of GDP in China. The aim of such intervention – complemented in many
instances by financial and monetary policies – was to keep the economy buoyant and stop
a full-scale assault on the labour market (International Labour Organization, 2011).
In China, Stimulus package was announced by the Central People‟s Republic of China on
9 November 2008 as an attempt to minimize the impact of global financial crises on the
world second largest economy. The main goal of the stimulus package is to maintain a
pace of growth of China‟s GDP at, or near, 8 percent (also referred to as “bao ba” or
“preserve eight”), by focusing on ten sectors of the Chinese economy: transportation,
rural infrastructure, environment, finance, earthquake reconstruction, taxes, housing,
health and education, incomes and industry. Some of these sectors are in line with the
priorities already established in China‟s 11th Five Year Plan (Revelle and Chian 2009).

2
In the USA for instance, economic stimulus plans were announced in 43 countries in
2009 that would cost US$ 2.18 trillion or 3.5% of the world‟s gross domestic product
(GDP) (Detecon Asia-Pacific, 2009), starting with the United states of America (USA)‟s
proposed US$ 825 billion package with US$ 275 billion in tax cuts and the remainder in
spending (Gravelle, Hungerford and Labonte, 2009). Debate about direct government
spending to accelerate economic recovery has intensified recently in response to
economic indicators showing significant and continuing weakness of the national
economy. Although the U.S. economy officially began to emerge in June 2009 from the
recession that began in December 2007, the recovery has been sluggish, and the economy
has continued to feel the recession‟s impact in terms of both budget deficits and high
unemployment (US Government, 2010).
In Australia, the Economic Stimulus Plan provided $16.2 billion over four years for the
Building the Education Revolution program, which funded the building and rebuilding of
primary and secondary school infrastructure and maintenance in Australia‟s schools,
including combined schools and special schools. Funding was also provided to build 537
new science and/or language learning facilities in secondary schools (Commonwealth of
Australia, 2011).
National government of United Kingdom had announced an economic stimulus package
on 24th November 2008. This particular economic stimulus package included a couple of
suggestions for betterment of UK economy like increasing expenditures and reducing
taxes. This package was aimed at addressing areas such as economic slowdown, loss of
jobs, condition of consumers and sorry state of public finances.

3
A South Africa economic stimulus package had been announced in February 2008. The
main purpose of this economic surplus package of South Africa was to make business
establishments spend more by way of introducing attractive incentives. Economic
stimulus package in South Africa was more of legislation. It provided business entities in
South Africa with rewards that are necessary to increase spending of financial resources.
As per that economic stimulus package, South African companies were awarded if they
bought assets. However, there was a catch in this South African economic stimulus
package. In order to be eligible to receive this benefit companies needed to buy an asset
that would have helped them better various aspects of their business such as software. It
was expected that as a result of this South Africa economic stimulus package, business
establishments would be taking right steps to ensure that they made full use of that
particular benefit (Economy Watch, 2010).
The 2007/2008 post election violence that affected the Kenyan economy coupled with
prolonged drought, oil and food crises and the effects of the 2008/2009 global economic
crisis called for quick measures to jumpstart the Kenyan economy toward long term
growth and development. In the 2009/10 budget, finance minister launched the economic
stimulus programme (ESP) to stimulate the growth of Kenyan economy through rapid
creation of jobs and business opportunities all over the country (Government of Kenya,
2009). The ESP was envisaged as a short term intensive programme to be implemented
within a period of six months commencing July 1st, 2009, the expected completion date
of 31st December 2009.The aim of the Kenyan ESP program is to support local
development projects in every constituency (Government of Kenya, 2009). One of the

4
key Objectives of the Economic Stimulus Programme was to improve the quality of
education.
The ESP was coordinated by the ministry of finance at the national level. At the
constituency level, projects were managed either by the District Coordination Team for
all education projects, or the Stimulus Project Management Committee (SPMC) which
manages projects in all the other sectors.
The education sector program was to be implemented through the Ministry of Education
framework. This was to be done through the School Infrastructure Management Unit
(SIMU) at the Ministry of Education headquarters. They were to develop the criteria for
selection of schools, verify the schools selected by the District in Education Boards
(DEB), prepare disbursement lists and monitor and evaluate the projects in liaison with
other line Ministries (The Kenyan Ministry of Finance, 2009).
The funds were to be used for the construction of new school buildings or upgrading
existing facilities. Funds were disbursed from the ministry of Education to target schools,
which were to open a dedicated account for the ESP activities. Selection of projects was
to be made by the CDF committee. Selection criteria for school projects included: proof
of ownership as public land (title deed/ allotment letter); strong community support; high
demand for schooling; reliable water and electricity source (except rural school).Primary
school projects were to be managed by a school management committee which is
responsible for making payments once work is done. The committee should prepare a
5
School Infrastructure Development Plan (SIDP) in conjunction with the community, and
make the community level procurement (Motano, 2010). Secondary school projects were
implemented by the B.O.G. (Board of Management) which was to make community level
procurement (Government of Kenya, 2012). Monitoring of projects was to be done by the
DICT (District Infrastructure Coordination Teams), composing departmental heads
including PWO (Provincial Works Officer), PHO (Public Health Officer),WO (Works
Officer), NEMA (National Environment Management Authority), school auditor,
Education Officer, District Accountant, Quality Assurance and Standards Officer. This
committee was also to provide the completion certificates upon project completion
(Government of Kenya, 2012).
Doubts emerged as early as 2010 whether there was adequate planning before the
Economic Stimulus Programme (ESP) was launched by the Finance Minister in 2009. A
Countrywide survey showed that very little had been done in terms of implementation of
projects in the programme which was supposed to last just about six months (Link, 2010).
Stakeholders had wondered if the constituencies had adequate capacity and skills to
effectively and efficiently manage the education sector projects among others under ESP.
It was found that the programme was running behind schedule due to delays in project
identification and release of Kshs22billion that Treasury earmarked for the projects. Only
Kshs3.25billion had been disbursed from the treasury contrary to the initial roll out plan
that was set to cover a six month period starting from July to December 2009 (Motano,
2010).

6
A further survey by education stakeholders in Nakuru and Narok counties revealed that
many of the projects are either stalled or the funds were diverted to other projects that
were outside the scope of the Economic stimulus project plan (Mkawale and Kemei,
2014).Similarly in Kakamega County multiple projects initiated were incomplete at the
exhaustion of the funds provided (Provincial Director of Education Western, ESP report
2010). There were instances of schools implementing projects that probably would have
been much lower in priority needs of the schools. In a few cases, the funds were diverted
to other purposes other than those they were intended for. This is not localized to
Kakamega County though but spread throughout Kenya (Ministry of Education, 2010).
The same is replicated in Kisumu county where most ESP projects were either behind
schedule or were stalled (Omolo, 2013).
1.2 Statement of the problem
In developing countries, 80% of the unsuccessful projects fail as a result of poor scope
management (World Bank and Africa Development Bank, 2003).A critical analysis of the
causes of project failures in Kenya by Gwaya, Masu and Wanyona Githae (2014) concluded
that 60% of construction project failures are as a result of Scope management Problems. The
Ministry of Education status monitoring report on Economic Stimulus Programme (ESP)
infrastructure projects indicated that about 43% of the projects are incomplete and thus
required more funds to complete (Ministry of Education, 2011). There are instances of
schools implementing projects that probably would have been much lower in priority
needs of the schools. In a few cases, the funds were diverted to other purposes (Ministry
of Education, 2010).

7
Several projects started under Economic Stimulus Programme are either, behind
schedule, stalled or become white elephants (Omolo, 2013). The survey further found
that in Kisumu County, a number of projects are incomplete, for instance in Kisumu West
constituency the project had not been finished, another instance is Kisumu central, where
the project is 80% complete and idle. This is a pointer that there is a problem with the
implementation on these projects which consequently may thwart the government‟s effort
in provision of quality education to the citizens creating a shortage of qualified human
resource to drive the government‟s economic goals and vision. This study therefore
sought to determine influence of skills and knowledge on the relationship between project
scope management and implementation of economic stimulus projects in public
secondary schools in Kisumu County.
1.3 Purpose of the study
The purpose of this study was to investigate the influence of skills and knowledge on the
relationship between project scope management and the implementation of economic
stimulus projects in public secondary schools in Kisumu County,Kenya.
1.4 Objectives of the study
The study was guided by the following objectives:
i. To determine how project initiation as a project scope management influence the
implementation of ESP projects in public secondary schools.
ii. To establish the extent to which project scope planning influence implementation
of ESP projects in public secondary schools.

8
iii. To assess how project scope definition influence implementation of ESP projects
in public secondary schools.
iv. To examine how project scope verification influence the implementation of ESP
projects in public secondary schools.
v. To establish the extent to which project change control influence implementation
of ESP projects in public secondary schools.
vi. To establish the moderating influence of project skills and knowledge on the
relationship between project scope management and implementation of ESP
projects in public secondary schools.
1.5 Research questions
The study sought to answer the following research questions:
i. How does project initiation as a project scope management influence the
implementation of ESP projects in public secondary schools?
ii. To what extent do project scope planning influence implementation of ESP projects
in public secondary schools?
iii. How do project scope definition influences influence the implementation of ESP
projects in public secondary schools?
iv. To what extent does project scope verification influences implementation of ESP
projects in public secondary schools?
v. To what extent do project change control influence implementation of ESP projects in
public secondary schools?

9
vi. What is the moderating influence of project skills and knowledge on the relationship
on project scope management and implementation of ESP projects in public
secondary schools?
1.6 Hypotheses of the study
To understand the above research question the research adopted the following
hypotheses:
i. H1: There is significant relationship between project initiation and
implementation of ESP projects.
ii. H0: There is no significant relationship between project initiation and
implementation of ESP projects.
iii. H1: There is significant relationship between project scope planning and
implementation of ESP projects.
iv. H0: There is no significant relationship between project scope planning and
implementation of ESP projects.
v. H1: There is significant relationship between project scope definition and
implementation of ESP projects.
vi. H0: There is no significant relationship between project scope definition and
implementation of ESP projects.
vii. H1: There is significant relationship between project scope verification and
implementation of ESP projects.
viii. H0: There is no significant relationship between project scope verification and
implementation of ESP projects.
ix. H1: There is a significant relationship between project change control and
implementation of ESP projects.
x. H0: There is no significant relationship between project change control and
implementation of ESP projects.
xi. H1: There is significant moderating influence between project scope management
and implementation of ESP projects.
xii. H0: There is no significant moderating influence between project scope
management and implementation of ESP projects.

10
1.7 Significance of the study
It is hoped that the findings of this study will be of use to the ministry of education and
other school infrastructure development partners such as International Aid Organization,
the UNICEF, and UNDP among others who fund physical infrastructure development
projects in schools; in preparing BOGs on aspects of project implementation before they
embark on this core function. It is also hoped the study will add to the project body of
knowledge and contribute to further studies on the field of project management. Finally
proper implementation of educational projects is a necessary condition for the realization
of the vision 2030.
1.8 Basic assumptions of the study
The researcher assumed that the implementation of the projects had been done according
to the Economic Stimulus Programme objective that is in one secondary school and two
primary schools per constituency. The research assumed that there was poor
implementation of the Economic Stimulus School Projects. The researcher will further
assume that the respondents willingly gave correct information; school administrators and
managers who executed the projects were still serving at the selected schools; existing
records were accurate and that the selected sample resulted into normal distribution and
were fairly representative of the larger population of the schools that were funded
through the programme.

11
1.9 Limitations of the study
The study focused only on the school projects despite the fact that other economic sectors
were also covered by the ESP and only covered the secondary schools under Economic
Stimulus Program in Kisumu County, this was despite the fact that the projects were also
implemented in primary schools and were country wide. This limited the degree of
generalization of the findings. The researcher also envisaged limitations such as lack of
cooperation and suspicion especially in schools where the implementation may not have
been satisfactory and respondents falsifying information to cover up for perceived self-
inadequacies during the implementation. These were mitigated by adequate identification
of the researcher to win the confidence of the respondents and directly administering the
research instruments to the respondents.
1.10 Delimitations of the study
The study focused specifically on influence of skills and knowledge on the relationship
between project scope management and implementation of economic stimulus projects in
public secondary schools in Kisumu County, Kenya. There could have been other factors
that influenced the implementation of projects. The study targeted the schools in Kisumu
County that were beneficiaries of ESP physical infrastructure development grants. This
was despite the fact that Economic Stimulus Projects were country wide in all the
counties. Targeting all the schools would have yielded better results, however this would
have delayed this study whose key purpose was academic attainment within a stipulated
time frame.

12
1.11 Definitions of significant terms used in the study
Project scope management skills and knowledge-Demonstration by stakeholders of
Body of knowledge that is accepted to ensure that the project includes all the work
required – and only the work required to complete the project successfully. It includes
scope planning, scope definition, creation of a Work Breakdown Structure, scope
verification and scope control.
Scope management planning-This is the detailing and documenting how the project
scope will be defined, developed and verified, while provisioning how the scope will be
managed and controlled by the project team.
Economic Stimulus school Projects – physical infrastructure projects funded through
the Kenya government Economic Stimulus Programme that were aimed at transforming
the targeted schools to centers of excellence.
Project implementation- This is the application, execution of the Economic Stimulus
Project idea, plan, model, specification and design.
Creation of Work Break down Structures – This is the breaking down of the project
into smaller units that are easy to manage. The project work is broken into deliverables
that corresponds with the project scope and the objectives

13
Scope change control- The process of comparing actual performance of the Economic
Stimulus Project under implementation in relation to the scope statement to determine
variances, evaluate possible alternatives, and take the appropriate action.
Scope verification-This is the process during which project stakeholders formally sign-
off on the project‟s scope. This process is used to gain acceptance of the current status of
the project from the stakeholders. Stakeholders might review such things as completed
deliverables or any current project documentation. Scope verification occurs at the end of
each project life-cycle phase or when major project milestones have been completed.
Scope definition – This is the clear description of the Economic Stimulus Project
boundaries as well as getting the client's agreement on the project boundaries.
Project Scope Statement -describes in detail the Economic Stimulus Project‟s
deliverables and the work required to create those deliverables.
Acceptance Criteria -Defines the process and criteria for accepting completed project
deliverable, or results of an implemented project.
Project Constraints -list and describes the specific project constraints associated with
the Economic Stimulus Project‟s scope that limits the teams options.
Project management plan- a formally approved document by the project stakeholders
that provides the structure and outline for the Economic Stimulus Project‟s scope
management plan.

14
Scope control- a description of the process for handling changes to the Economic
Stimulus Project‟s scope.
Scope Creep – Uncontrolled changes are that are arbitrarily implemented during project
execution.
1.12 Organization of the study
This document is organized into five chapters: Chapter one is the introduction and
includes background, statement of the problem, purpose of the study, objectives of the
research, research question, Significance of the study basic assumptions of the study,
limitation of the study, delimitations of the study and definition of key terms. Chapter
two contains literature review, which delves into the influence of scope management on
the implementation of Economic Stimulus Projects in. It also highlights the theoretical
and conceptual frame works upon which the study is anchored. Chapter three focuses on
research methodology to be employed. This covers the following sub-areas research
design, researcher design, target population, sample size and sample selection, data
collection and the data analysis techniques. Ethical considerations are also discussed in
this chapter. Chapter four comprises of data analysis, Presentation and interpretation and
lastly chapter five contains summary of findings discussion. It also contains reference and
appendices.

15
CHAPTER TWO
LITERATURE REVIEW
2.1 Introduction
This chapter reviews literature which is related to the study under the following sub-
themes: Concept of skills and knowledge, project scope management and implementation
of Economic Stimulus Projects, Project initiation and implementation of Economic
Stimulus Projects, Project scope planning and implementation of economic stimulus
projects, Project scope definition and implementation of economic stimulus project,
Project scope verification and implementation of economic stimulus projects, Project
change control and implementation of economic stimulus projects and Skills and
knowledge of project scope management and implementation of economic stimulus
projects, the theoretical frame work of the study and the conceptual framework of the
study.
2.2 Concept of skills and knowledge, project scope management and implementation
of Economic Stimulus Projects.
Richman (2002) says that learning project management skills can help one complete
project on time, on budget and on target. The discipline of project management includes
proven strategies for clarifying proven objectives, avoiding serious errors of omission and
eliminating costly mistakes. It also addresses the necessary people skills for getting
cooperation, support and resources to get the job done. This underscores the need for all
project managers to have skills and knowledge of project management. Svetlana (1997)

16
underscores that implementation of strategic management through projects makes
achievement of the highest returns possible by optimal utilization of resources available.
Cleland and Gareis (1994) also says that management by projects provides a disciplined
approach to gaining competitive advantage by getting the right product, in time, to
market through designated management of innovation, knowledge and skills.
Scope Management includes the activities and processes required to ensure that the
project includes all the work required – and only the work required to complete the
project successfully. It includes scope planning, scope definition, creation of a Work
Breakdown Structure, scope verification and scope control. Time management includes
the processes and activities needed to ensure timely completion of the project. It consists
of activity definition, activity sequencing, activity resource estimating, activity duration
estimating, schedule development and schedule control. Communications management
includes processes and activities needed to ensure timely and appropriate generation,
management and communication of project information. It consists of planning,
information distribution, and performance reporting and managing stakeholders
(Richman ,2012).
Scope management includes all those processes that are absolutely and necessary
required to ensure that the project is streamlined to only the required necessary work in
order to achieve a necessary product or service. Scope means what is needed to be done
and scope management is the managing of what needs to be done (Wysocki ,2009). There
are five fundamental processes relating to scope management. These processes interact
with each other and interact with other processes in other knowledge areas. You will find
that effective scoping of a project is much of an art as it is a science (Wysocki ,2009).

17
According to Lewis (2006), implementation is an application, execution of an idea, plan,
model, specification, design, standard, policy and algorithm. Project Implementation
process may be effective if some very important factors are kept in mind that are urgent
in a project management system. It is crucial for everyone to start the project by keeping
in mind some factors are identified· in the article. Implementation of a project is the step
where all the proper planned activities are put into action. Before starting the
implementation of a project, the implementers must identify his weakness and strength.
The customer‟s needs from the product of the project must be defined, and the project
scope should be clearly known. Keep a record of when the project implementation
process starts and finish the main thing to do before the implementation of a project is to
predetermine and discuss the project budget and the estimated time, and the manpower
required to finish the project (Project Management Institute, 2006).
To ensure successful project implementation, there are some important tips that you need
to make use of. The project should have people who are dedicated more to create the
situations of the successful project implementation. Before the project implementation
process starts, ensure you have all factors of project process written or recorded on paper.
This will make the projects implementation process easier to manage, and they can be of
used projects that are the same as the current projects. Project monitoring is also an
important thing to make assure that activities are implemented as per planned. This
assists the project implementers to check how well they are getting their objectives. This
process is fully based on the knowledge that the procedure, by which is implemented has
so many effects on its access, maintenance and operation (Lewis, 2006).

18
The implementation process begins with and includes many different phases. The first
phase include project planning, second phase is the project design which consist of the
creation of the system design comprising of application designing, database and data
designing, database and data communication design. Third phase include implementation
phase which consist of creating and unit testing, integration, training and finally close out
phase. The project implementation process needs urgent prerequisites identified above in
the article to make the project a success and reliable (Lewis, 2006).
2.3 Project initiation and implementation of Economic Stimulus Projects
According to Project Management Body Of knowledge (PMBOK, 1996) Initiation is the
process of formally recognizing that a new project exists or that an existing project
should proceed into the next phase. This formal initiation links the project to ongoing
works of the performing organization. Outputs of project initiation include the project
charter, identified/assigned project manager, project constraints and project assumptions.
The project charter is an output of the initiation process and serves as an input to scope
planning. The project charter names the project and provides the description of the
product it names the project manager and assigns the project manager level of authority
for managing resources, finances and decisions of the project. It details the business case
of the project; it identifies the need and establishes why the project has been created
(Project Management Professional, 2006).

19
The project manager is appointed and in turn, he selects the team members based on their
skills and experience. The initiating processes determine the nature and scope of the
project. If this stage is not performed well, it is unlikely that the project will be successful
in meeting the business' needs. The key project controls needed here are an understanding
of the business environment and making sure that all necessary controls are incorporated
into the project. Any deficiencies should be reported and a recommendation should be
made to fix them. The initiating stage should include a plan that encompasses the
following areas: analyzing the business needs/requirements immeasurable goals,
reviewing of the current operations, financial analysis of the costs and benefits including
a budget Muhia (2011) in her study on factors influencing performance of constituency
development funded projects in Kenya found that project initiation, analyzing of needs in
measurable goals, stakeholder analysis, users and support personnel, financial analysis of
the cost and benefits including a budget and reviewing of current operations as the factors
affecting negatively the performance of projects.
The organization and management systems are needed for successful implementation
should be properly planned. Inadequate project preparation leading to scope changes
during implementation is perhaps the most important reason for overruns (Morris, 1990).
No effort should be spared in the initial stage of a project to properly define the project
goals and its deliverables (Dvir, D., Raz, T. and Shenhar, A.J., 2003).
According to Taylor (2006), a project manager needs two classes of skills: technical and
human or relational skills. Furthermore, Thite (1999) states that project managers of

20
successful projects have transformational and technical leadership qualities to a greater
extent than managers of less successful projects. These views are also supported by
Muzio, Fisher, Thomas & Peters (2007), who indicate that transformational leadership is
important to project management.
Schmid and Adams (2008) advocate that a project manager should have, amongst other
things, participative leadership style and an ability to motivate team members. Pheng and
Lee (1997) state that each project‟s phase demands different skills from the project
manager. Moreover, Pheng and Lee (1997) state that a project manager should have the
following skills (criteria):leadership, decision-making, stability, good listening and
information-gathering skills, good analytical abilities, flexibility, multi-disciplinary
oriented, right temperament, planning, management and follow-up skills. Dainty, Cheng
& Moore (2005) also have a similar list of skills that a competent project manager is
expected to possess. Skulmoski (2000), on the other hand, states that competencies are
varied, multi-dimensional and are much broader than skills and knowledge.
Competencies (soft competencies) include traits, motives, self-image and social role,
while hard competencies refer to skills and knowledge (Skulmoski, 2000).
According to Project Management Body Of Knowledge (PMBOK) 2006, 50% of
unsuccessful projects fail during the initiation phase of the projects, 30% fails during the
planning phase and 20% do fail as a result of poor implementation of the projects. During
the initiation phase, the key requirement to all projects is the identification of the
magnitude of the work to be done and the deliverables of the projects. This is the scope of

21
the project and the specifications of what is expected once the projects are successfully
completed. Poor scope definition has been recognized by the industry practitioners as one
of the leading causes of projects failure, adversely affecting projects in the area of costs,
schedule, and operational characteristic. Unfortunately, many project managers and the
contractor organization do a poor job of not adequately defining the project scope leading
to a poor design basis according to PDRI (Project Definition Rating Index). The scope of
the projects acts as the cornerstone of all projects requirements in successful completion
i.e. the budget, resources and time can only be allocated once the scope of the project is
identified.
Project team and stakeholders identify constraints that include: time cost and scope are
identified at this stage. Constraints can come from contracts, social conditions and
stakeholder requests, all of which contributes to conditions placed upon time cost and
scope (PMBOK,1996).This are mainly factors that will limit the project management
teams options, for example predefined budget is highly likely to limit the teams options
regarding scope, staffing and schedule. When a project is performed under contract,
contractual provisions will generally be constraints.
Assumptions, these are factors that, for planning purposes, will be considered to be true,
real, or certain. For example, if the date that a key person will become available is
uncertain, the team may assume a specific start date ( PMBOK, 1996).

22
2.4 Project Scope planning and implementation of Economic Stimulus Projects
Scope planning is an important component of project management. The scope
management plan is the document that details how the project scope will be defined,
developed and verified while provisioning how scope will be managed and controlled by
the project management team (Elyse ,2006) .The scope management plan also defines
how WBS will be created.
Project charter is an input of the scope management plan, it is a document that is issued
by the project initiator or sponsor that formally authorizes existence of the project and
provides the project manager with authority to apply organizational resources to project
activities. This objective forms the basis of scope planning.
Another input is the preliminary project scope statement; this begins to define the project
and what needs to be accomplished. It includes project requirements, project boundaries
and methods of acceptance. The deliverables are used in scope planning as the basis for
WBS.
The project management plan, this is the approved document that provides the structure
and outline for the project scope management plan. It describes which project scope
management processes will be performed and at what level they will be implemented.
Creation of project scope management plan, often relies on the following tools and
techniques; expert judgment based on expertise on a particular discipline, industry,
application area or knowledge area. Such expertise may be provided by individual or
group with a specialized education skills or training and is available from such sources as
consultants or stakeholders (Elyse, 2006).

23
Scope planning is the justification of scope management. It is during the scope planning
stage that the scope statement is developed. The scope statement forms the basis for an
agreement between the project team and the customer by relating the work of the project
to the business owner's objectives. Scope has been defined as the most important part of
the upfront process of planning a project (Thomas, 2004).If one doesn‟t know for sure
what he or she is delivering and the boundaries of the project there are no chances of
success in that particular project. Many projects have been initiated with clear boundaries
and specific deliverables but have failed to deliver due to misallocation of resources to
activities which were outside the project scope. Thomas (2004) further observes that
managing scope is one of the most critical aspects of managing project. However if one
have not done a good job in defining the scope, managing scope will be almost
impossible.
In scope planning process, the deliverables are broken into smaller manageable
components so that the project task and activities can be planned in details. This
breakdown process will make the estimation process easier in terms of cost, time, and
resources needed for individual work components than it is to estimate the same for the
whole body of the work or deliverables. Using smaller components also makes it easier to
assign performance measure and control (Heldman, 2002). Work breakdown structure
(WBS) development in all projects ensures that all the project components (scope) are
included. Kendrick, 2003 argues that the best way to develop the WBS is to start with
scope statements and work it “top down” from the whole project concept. At this point he
points out that, the project becomes visible whenever it is confusing or difficult to
decompose project into smaller and more manageable pieces. Rory (2008), points out that
24
the WBS was originally developed in the 1960‟s as part of the drive towards improved
project definition and it is soon become the backbone of the planning and control system
of project implementation. He further adds that WBS as an excellent tool for quantifying
the scope of works and has worked successfully in information technology projects in
many developing countries. It can also be considered as a hierarchical form of mind map
that helps to break complexity down into manageable components.
Scope planning therefore refers to a project management process that defines boundaries
and deliverables. The basic matrix of a scope planning analysis consists of three main
categories: Initiation, planning, and definition, with two control categories: Verification,
and change control interspersed between the three main categories.
Initiation inputs contain program deliverable description, strategic planning, program
selection criteria, and historical information. Tools and techniques include program
selection methods and expert judgment. The output of the initiation phase will include a
program charter, the identification and assignment of a program director, and the
identification of known constraints and assumptions. The planning category covers
descriptions on deliverables, the program charter, constraints, and assumptions. Tools and
techniques involved in this category include deliverable analysis, a benefit/cost analysis,
and the identification of alternatives. The final main category includes a statement of
scope, a definition of assumptions and constraints, and other planning outputs and
historical information. An output of scope planning is the project scope management
plan. This plan is defined as the document that describes how the project scope will be

25
defined, developed and verified and how WBS will be created and defined (Nielsen,
2006).
Government of Kenya and its development partners continue to allocate huge financial
resources to finance infrastructure development. However, the intended benefits are
partly or never realized due to many unsuccessful project implementations. Specific
research undertaken to investigate what ails implementation of projects in some public
sector projects in Kenya, provide an insight to what has been the major causes of projects
time and cost overruns, failure to meet specifications and stakeholders expectations.
Musa (1999) conducted a study on factors influencing delays in water projects in Kenya
funded by the Government. A similar study by Karimi (1998) focussed on factors
contributing to cost overruns in projects under the Ministry of Water. Talukhaba (1988)
investigated on time and cost performance of construction projects. Mwandali (1996) did
an analysis of major factors that affect project management in Kenya Railway projects.
Similar observations have been made in developing countries like Indonesia (Kaming et
al.. 1997), Labanon (Mezher and Tawil, 1998), India (Morris,1990; Pillai and Kannan,
2001), Nigeria (Mansfield et al.. 1994), Vietnam (Long et al., 2004), Nepal (Manavazhi
and Adhikari, 2002), and Nigeria (Aibinu and Jagboro, 2002). Thailand as a fast growing
economy has not been spared of overruns (Ogunlana and Promkuntong, 1996). Various
factors for overruns in Saudi Arabia were identified by Assaf,S.A,Al Khalil and Al-
Hazml, M, 1995, and in Ghana (Frimpong et al.. 2003). Factors ranging from inflation,
project complexity, inaccurate material estimation, financing, change orders, design
changes, late submission of drawing, poor specification, poor scope planning, incorrect

26
site information, poor contract management among many others were found to be main
sources of overruns.
Studies conducted in developed economies like Hong Kong (Kumararswamy and Chan,
1997; 1998), UK/USA/Australia (Ireland, 1987), Florida (Ahmed et al., 2002), Australia
(Ireland, 1985) revealed a trail of time and cost overruns on building and infrastructure
projects in public and private sector, attributable to numerous factors that come into play
during the projects implementation.
2.5 Project Scope definition and implementation of Economic Stimulus Projects
Scope defines the parameters of the project and provides the foundation for all the
subsequent steps in project programme or cycle. It is a process of developing detailed
project scope statement as the basis for future project decisions. A clear scope sets the
boundaries for what the project will do. It involves developing a common understanding
of what is included or excluded from the project (Gitonga ,2010).
The details for works definition are derived from the formulation phase of the project
where the project concept is crystallized after considerable effort, technical studies,
consultations etc. Poor field investigations, incomplete and inadequate information, bad
or deliberately wrong estimation, lack of expertise or experience, inadequate project
analysis, omission of project linkages and poor appraisal and investment decisions led to
wrong project definition and consequently wrong works definition. If the basic
parameters of the project are wrong, the time and cost overruns are in-built from the very
start and these are bound to follow later (Kholi, 2001).

27
The scope sets out what is and what is not within a project‟s brief, which must surely be
known before hand as this permits formulation of “a clear boundary statement”
(McConnell, 2010, ). E-Learn (2005)concurs when it stresses that early in a project life
cycle the specification establishing scope should drawn up (cited in Cano &Lidon
2011)For the scope, if accurately delineated, also aids in calculating cost and time.
(Gibson Jr. et al., 1995) maintain that a thoroughly worked scope definition “can
significantly enhance the predictability of project outcomes, improve user satisfaction,
and provide cost and schedule savings”. It behooves a prudent project manager or project
management team to “communicate a scope well before the project gets underway due to
finite resources and the generally limited timeframe” (Waddell, 2005).
Poor scope definition has been linked to project failure: Smith and Tucker (1983, cited in
Gibson Jr., et al.., 2006) have it that “inadequate or poor scope definition, which
negatively correlates to project performance, has long been recognized as a significant
problem”. If boundaries are not appointed, “final project costs tend to be higher because
of changes that interrupt project rhythm, cause rework, increase project time, and lower
the productivity as well as the morale of the field work force” (O‟Connor &Vickroy,
1986; Merrow &Yarossi, 1994; both cited in Gibson Jr, et al., 2006).
Project management is the discipline of organizing and managing resources in such a way
that the project is completed within defined scope, quality, time and cost constraints
(PMI, 2004), then it is not a stretch to accept that one of the primary roles of a project
manager is to manage that defined scope, while ensuring that we are meeting
expectations (Millhollan,2008).

28
One of the primary benefits of defining scope is to ensure that everyone is on the same
page. Scope definition is similar to determining where you want to go. By defining scope,
you are clarifying objectives and setting the exit criteria for project completion. The
project objectives can be thought of as a boundary, which may well tie in with the
strategic plan as commented on earlier; project objectives are the expected results
(McConnell, 2010). Cicmil (1997) says that projects grow out of an organization‟s need
to extend itself within its larger environmental context, which develops the type of
project required, and translate into its objectives, or project scope (and companion
constraints). The tool which achieves the objectives is called the scope, and more
precisely, a controlled scope (Verzuh, 2005; Wijner &Kor, 2007).
Heldman (2002) agree that scope definition provides a documented basis for making
future decision and for conforming or developing a common understanding of the project
scope among the stakeholders. He further argues that the scope definition involves
several inputs that include project descriptions, project charter, constraints and project
assumptions. A clear and a concise documented definition of the above inputs will
eliminate many risks which could otherwise results to project failure.
Research results have shown that greater pre project planning efforts lead to improved
performance on industrial projects in the areas of cost, schedule, and operational
characteristics (Gibson and Hamilton 1994; CII 1995; Griffith and Gibson 1995; Griffith
et al.. 1998). Synthesizing these efforts was the development of the Project Definition

29
Rating Index (PDRI) for industrial projects, a scope definition tool that is widely used by
planners in the industrial projects sector.
One of the major sub processes of the pre project planning process is the development of
the project scope definition package. Project scope definition is the process by which
projects are defined and prepared for execution. It is at this crucial stage where risks
associated with the project are analyzed and the specific project execution approach is
defined. Success during the detailed design, construction, and start-up phases of a project
is highly dependent on the level of effort expended during this scope definition phase
(Gibson and Hamilton,1994).
Research has shown the importance of pre-project planning on capital projects and its
influence on project success. Findings of a recent study have proven that higher levels of
pre-project planning effort can result in significant cost and schedule savings.
Specifically, the research study categorized 53capital facility projects into three different
intensities of pre-project planning effort and compared total potential cost and schedule
performance differences as follows (CII 1994; Hamilton and Gibson ,1996).
Significant savings is associated with improved project predictability, a complete scope
definition prior to project execution is imperative to project success (CII 1994; Hamilton
and Gibson 1996). Effective scope management is one of the key factors determining
project success. Failure to accurately interpret the client‟s needs or problem will produce
misleading definition (scope of work). If this causes rework and additional effort, there

30
may be project cost and time implications. Therefore project success will be self-limiting
if the scope of work is not adequately defined (Rory, 2008). The key primary pillars in
scope management for successful completion of projects according to (Heldman, 2004)
are scope definition, scope planning and scope change management. He further states
that, one can have a clear definition of what is to be done in a project but poor planning
for the same would result to poor implementation and the consequences would be project
failure. Hinge, 2003 believes that 75% of the projects fail as result of poor scope
management where functional budget is exceeded, project is not delivered on time, the
end result does not meet the expectations and commitment to implement results is not
ensured (Hinge, 2003).
Poor understanding of the project scope as defined in the project charter in most cases
results to difficulties during the implementation phase of the project. This becomes clear
where misallocation of resources to undertake the projects is visible as the project
progress resulting to budget overruns prolonged schedules and undesired quality of the
deliverables of the project. Kerzner (2013) states that, interpreting the scope of the work
for the project is a common cause of project failure. This is as a result of poor planning
and poor estimation of cost, time and resources. He further adds that according to a
survey undertaken in many developing countries, information technology projects have a
poor track record of delivering within budget due to poor scope definition of work, with
only 20% of software project being completed within budget, 50% with budget overruns
and 30% being so expensive in that they are abandoned before substantial completion.

31
Whilst myriad issues make an impact over the project life cycle, and so many variables
contribute to the outcome of a project, a well-informed scope prepared as early as
possible is a prime asset. Verzuh (2005) has posited that a superior quality scope will also
dictate boundaries within the statement of works and work break down structure which
in turn will act as alerts in the event of added works: “even a product description such as
a blueprint can be a source for defining scope and setting limits on scope creep” (p.54).
The creation of the WBS involves the division of the major project deliverables into
smaller components that are more manageable and easier to monitor and evaluate. The
WBS is a deliverable-oriented hierarchical decomposition of the project work (Edward,
2007). The top-to-bottom hierarchy of activities gets more detailed and specialized. The
outputs of this step are the updated Project Scope Statement, WBS-this main output
should not be confused with other existing breakdown structures, WBS Dictionary-this is
the supplemental document the WBS functioning as like a user‟s manual for the WBS
,Scope Baseline, Updated Project Scope Management Plan; and Requested Changes
(Wyans ,2008).
A WBS, as defined in the Project Management Body Of Knowledge, Guide Third Edition
is a deliverable-oriented hierarchical decomposition of the work to be executed by the
project team to accomplish the project objectives and create the required deliverables. It
organizes and defines the total scope of the project. Each descending level represents an
increasingly detailed definition of the project work. The WBS is decomposed into work
packages. The deliverable orientation of the hierarchy includes both internal and external
deliverables (Wyans, 2008).

32
Today, Project Managers are more frequently finding high value in the creation of Work
Breakdown Structures (WBS) as they begin the process of project management. Project
success may be attributed specifically to use of a WBS (Halli, 1993). As an essential
element of the Planning Process Group outlined in the Project Management Body Of
Knowledge Third Edition, everyday practice is revealing with increasing regularity that
creation of a WBS to define the scope of the project will help ensure delivery of the
project‟s objectives and outcomes.
Moreover, the more clearly the scope of the project is articulated before the actual work
begins, the more likely the success of the project. The intelligent structure of work
breakdowns is a precursor to effective project management.” (Homer and Gunn,1995).
Specifically, the Planning Process Group begins with three essential steps – Scope
Planning, Scope Definition and Work Breakdown Structure Development, citing from the
Project Management Body of Knowledge, third edition.
Experienced project managers know there are many things that can go wrong in projects
regardless of how successfully they plan and execute their work. Component or full-
project failures, when they do occur, can often be traced to a poorly developed or
nonexistent WBS. A poorly constructed WBS can result in adverse project outcomes
including ongoing, repeated project re-plans and extensions, unclear work assignments,
scope creep or unmanageable, frequently changing scope, budget overrun, missed
deadlines and unusable new products or delivered features ( Shelly,Robert,PMP and
Norman ,2008).

33
The high-level elements in the WBS should match, word-for-word, the nouns used to
describe the outcomes of the project in the Scope Statement ( Shelly et al. ,2008).
The WBS is used as a starting point for scope management and is integral to other PMI
processes, and as a result, the standards that define these processes explicitly or implicitly
rely on the WBS. Standards that take advantage of the WBS either use the WBS as an
input (e.g., PMI‟s Practice Standard for Earned Value Management (EVM) and the
Practice Standard for Scheduling) or incorporate the WBS as the preferred tool to
develop the scope definition (Shelly et al. ,2008).
An additional key attribute of the WBS is that it is a hierarchical decomposition of the
work Decomposition is a planning technique that subdivides the project scope and project
deliverables into smaller, more manageable components, until the project work associated
with accomplishing the project scope and deliverables is defined in sufficient detail to
support executing, monitoring, and controlling the work (Project Management Body Of
Knowledge Guide Third Edition). This decomposition (or subdivision) clearly and
comprehensively defines the scope of the project in terms of individual sub-deliverables
that the project participants can easily understand. The specific number of levels defined
and elaborated for a specific project should be appropriate for effectively managing the
work in question.
The 100% Rule is one of the most important principles guiding the development,
decomposition and evaluation of the WBS. This rule states that the WBS includes 100%
of the work defined by the project scope and, by doing so, captures ALL deliverables
internal, external and interim in terms of work to be completed, including project
management (Haugan , 2002) . The rule applies at all levels within the hierarchy: the sum

34
of the work at the child level must equal 100% of the work represented by the parent and
the WBS should not include any work that falls outside the actual scope of the project;
that is, it cannot include more than 100% of the work ( Shelly et al. ,2008).
In conclusion, the process of delineating the scope of a project at the pre-planning stage
would include stakeholders and their needs or responsibilities. A quality and timely scope
document has been put forward as a primary tool for potential project success since it
indicates the specifications and limits which can be referred to over the project life cycle.
Scope definition is an extremely complex task but is a primary factor with potential to
positively influence project outcome (Cano &Lidón, 2011). A final word from Sharma
and Lutchman (2006), states “that in its simplified form, scope definition refers to
accurately defining the boundaries of the project”
2.6 Project scope verification and implementation of Economic Stimulus Projects
Scope verification is the process of formalizing acceptance of the project scope by the
stakeholders (sponsor, client, customers etc). It requires reviewing work products and
results to ensure that all were completed correctly and satisfactorily. If the project is
terminated early, the scope verification process should establish and document the level
and extent of completeness (Project Management Institute, 2004). The outputs are
accepted deliverables-these documents contain acknowledgements and proofs that the
stakeholders accept the project deliverables and if they are not accepted, the reasons must
also be stated; requested changes; and recommended Corrective Actions.
35
Though quite confused with quality control, project scope verification deals with the
actual formal acceptance of the finished product. Quality control usually precedes project
scope verification and sometimes occurs simultaneously. The main activity under this
step is inspection. Deliverables are measured, examined, and verified in order to ascertain
whether they meet the product acceptance criteria. Other terms for this step are reviews,
audits, and walkthroughs (Wyans, 2008).
Scope verification involves the official acceptance of the completed project scope by the
customer or stakeholders (Schwalbe ,2008). This process is involved with formalizing the
acceptance of the project deliverables. Reviews are made with the customer concerning
deliverables and the sponsor to en-sure that the scope is in line with the initial goals of
the sponsor. Several documents may be used to achieve this process including project
management plan, requirements documentation and validated deliverables. The main
method of achieving this process is by review and inspection.
A study by Gwaya,Munguti, and Githae(2014) on Critical analysis of the causes of
project Management Failures in Kenya concludes that the main reason for poor work man
ship was due to poor supervision which they rated at 51.96%.They further observe that
human resource management is a key indicator of successful projects arising mainly from
poor supervision by consultants and coordination challenges between the main contractor
and subcontractor. This is corroborated by research by Global Alliance of Project
Performance standards indicates human resource management as one of the key variables
of a successful project management practice .They rank causes that lead to poor quality
of projects as, poor supervision by consultants 4.3627, coordination challenges at 4.1078,
36
contractor management challenges at 4.06886, defective materials at 3.9216 and changes
in specifications at 3.600.
2.7 Project change control and implementation of Economic Stimulus Projects
A study conducted in energy sector on cost overruns in Kenya, problems associated with
pioneer power projects and process plants revealed that seventy four percent of cost
escalations were caused by poor coordination of projects activities and lack of change
management control thus affecting adherence to cost estimates (Kagiri & Wainaina, 2009).
The increasing complexity of infrastructure and the environment within which projects are
constructed places greater demand on construction managers to deliver projects on time,
within the planned budget and with high quality (Enshasi, 2009).
Non-adherence to project cost estimates can raise the capital-output ratio in the construction
sector and elsewhere bringing down the efficacy of investments (Morris, 2008). In a nutshell,
adherence to cost estimates is considered the most important element of successful projects,
which help to decrease problems for all parties and give new chances to construct other
related projects.
Richman (2002) defines scope control as "the process of comparing actual performance
to the scope statement to determine variances, evaluate possible alternatives, and take the
appropriate action". Moreover it deals with the changes that occur and controlling the
effect of those changes in the project scope and the product itself. Scope creep is those
changes that are uncontrolled. Another definition of scope creep is "the tendency for
scope to increase during the course of the project without proportionate increases in time
or scope" One can say that project scope control tries to avoid having project scope creep.

37
The tools and techniques in scope control include the following: Change Control System-
tracks down changes and classifies them as to whether they conform to the project scope
management plan; Variance Analysis-used to evaluate the magnitude of variation relative
to the scope baseline and helps decide whenever a curative course of action is required.
Replanning-updates and modifications on the project scope management plan and
configuration of management system-states procedures for the "the status of the
deliverables, and assures that requested changes to the project scope and product scope
are thoroughly considered and documented before being processed through the Integrated
Change Control process" (Jones ,2007).
The outputs of this stage are the following: updates on Project Scope Statement-this
becomes the future baseline for coming changes or variances, updates on the Work
Breakdown Structure, updated WBS Dictionary, updated Scope Baseline; requested
changes, Recommended Corrective Action-for future use, updated Organizational Assets-
includes additional information regarding the "causes of variances, the reasons behind the
corrective actions, and other types of lessons learned from project scope change" and
updated Project Management Plan (Jones ,2007).
All these processes are related to each other and affect each other. The implementation of
these stages does not lie solely on the project manager but involves the effort of the other
stakeholders-when the need arises. Those these phases may seem distinct and discrete,
they can actually overlap, and it all depends on the demands and the uniqueness of the
project (Wyans, 2008). Monitoring and Feedback is a project control processes by which
at each stage of the project implementation, key personnel receive feedback on how the

38
project is comparing to initial projections. Making allowances for adequate monitoring
and feedback mechanisms gives the project manager the ability to anticipate problems, to
oversee corrective measures, and to ensure that no deficiencies are overlooked. Schultz
and Slevin (1998) demonstrate the evolving nature of implementation and model building
paradigms to have reached the state including formal feedback channel between the
model builder and the user.
Within the project framework, the term scope can mean: product scope-refers to the
features and functions inherent to a product, service, or result; project scope-refers to the
effort being exerted to furnish as product, service or result with specialized features and
functions in itself (Jones, 2007).The completion of the project scope management is
appraised against the project management plan, the project scope statement, and its WBS
and WBS dictionary. Ultimately, the product scope is evaluated against the product
requirements (Jones, 2006).
Cohen and Palmer (2004) identify sources of construction risks to include changes in
project scope and requirements; design errors and omissions; inadequately defined roles
and responsibilities; insufficient skilled staff; force majeure; and new technology.
Changes in projects scope are inevitable as many parameters‟ comes in to play during
project implementation. Budget constraints and the time frame to complete the project do
affect the magnitude of the work to be undertaken in projects. As described by the Project
Management Body Of Knowledge, the main objectives of the projects that includes the
scope, time, costs and performance of the project are interrelated. Changes in one
objective either have a positive or negative impact on other objectives in projects
39
deliverables. Proper planning and management of costs, time and quality ensures that
when changes occurs in the project scope, it is to the interest of successful completion of
the projects and satisfaction of the beneficiaries.
Typically, change orders and variations present problems to all parties involved in the
construction process. Usually, these design changes require additional time and cost inputs
which ultimately overruns. The impact of change orders or variations varies from one project
to another. However, it is generally accepted that change orders or variations can affect
construction projects with unpalatable consequences in time and cost (Ibbs et al., 2005).
Change orders that are imposed when construction is underway, usually lead to reworks,
overruns and delays in project completion (Construction Industry Institute, 2009). Rework
and demolition are potential effects of changes in construction, depending on the timing of
the occurrence of the changes can ultimately lead to overruns. Researches in construction
projects in some developing countries indicate that by the time a construction project is
completed change orders or variations result in an 8.3 % cost overrun (Al-Momani, 2006).
Change orders typically average between 2-5 % of construction costs, but can easily soar to
more than 10 % depending up on the degree of changes (Olawale & Sun, 2010).
Change agreement may recognize that changes in the work or changes in the method or
manner of performance may require changes in the schedule and schedule milestones and this
could further necessitate revisions in activity durations, sequence of work items, or
interrelationships of various tasks. These changes may have a direct impact on the schedule,
as where a change in method requires a greater or lesser period of performance or its effects
may be subtler, as where the change merely rearranges priorities thereby protracting the
effects of costs. In addition to a time extension, the contract‟s agreement may by extension

40
provide compensation for any delay resulting from a contract change by allowing an
equitable adjustment for the increased cost of the performance of the work caused by the
change and so lead to unprecedented increased costs (Morris, 2008).
Sharma and Lutchman , urge that scope changes only be made in extreme circumstances,
e.g. if safety becomes an issue; if deliverables look like being compromised; and on
condition that re-evaluated schedules and/or resources do not interfere with the original
scoped work. Within Kerzner‟s (2002) criteria for judging project success, which include
considerations of time, budget, specification, customer satisfaction, and maintaining
status quo within the organization, he emphasizes that scope changes need to be curtailed
or, failing that, controlled, for they “have the potential to destroy not only the morale on
a project, but the entire project”.
Dinsmore and Brewin (2006) argue that monitoring and controlling should include the
following components; Measuring the ongoing project activities ('where we
are');Monitoring the project variables (cost, effort, scope, etc.) against the project
management plan and the project performance baseline (where we should be); Identify
corrective actions to address issues and risks properly (How can we get on track again)
and influencing the factors that could circumvent integrated change control so only
approved changes are implemented.
Over the course of any project, the work scope may change. Change is normal and is
expected at any part of the project process. Changes can be the result of necessary design
modifications, differing site conditions, material availability, user-requested changes and
impacts from third parties, to name a few. Beyond executing the change in the field, the

41
change normally needs to be documented to show what was actually done. This is
referred to as change management. When changes are introduced to the project, the
viability of the project has to be re-assessed. It is important not to lose sight of the initial
goals and targets of the projects. When the changes accumulate, the forecasted result may
not justify the original proposed investment in the project.
A project is a dynamic process functioning in a changing environment, a team in the
planning phase of a long project cannot predict all factors Wysocki and McGary (2003)
and even an excellent project plan cannot prevent all unexpected “surprises”
(Young,2000). Even the most sophisticated plans can fail due to changes in customer
requirements. One other finding is also important: the cost of change (due to a poor plan
or customers making changes) rises as the project progresses (Burke, 2003). The later we
decide to change (or discover a hidden change), the larger the impacts that change will
have on the success of the project. As “a project without changes” doesn‟t exist, we must
find a way to limit the negative impact of changes or even to take an advantage of them.
Project exists in the wider environment and is therefore subject to external forces which
will most likely be beyond the project team‟s control. Examples are activities by
competitors, developments in technology, and trends in the economy, social and political
factors, and upheaval within the company itself (Gustafsson, &Wikstrom, 2008). Indeed,
(Baar and Jacobson , 2004) state that a project manager should expect the scope to evolve
throughout the project life cycle which is echoed by Pietlock and Hollmann (2003) who
clarify that the scope can be “modified and refined” (cited in Sharma &Lutchman 2006).

42
However, any scope changes need to be discussed, found feasible to integrate, be agreed
upon and communicated to all stake holders. Frame (2003) believes the project team must
be ready for change so that changes do not surprise them. He also indicates that ignorance
of a project‟s environmental impacts and lack of information in the planning phase pose a
risk that changes might occur in the project. The purpose of risk and change management
is to reduce the number and range of surprises as much as possible. According to
Kerzner, change usually creates new risks, while the occurrence of risk creates changes
that are again linked with new risks. Risks and changes therefore appear to be “hand in
hand” so enterprises often set up a uniform approach to deal with both (Kerzner 2013).
Change management includes the establishment of a procedure for identifying and
evaluating scope changes which might affect the cost (Oni, 2008).
Taylor introduces another aspect that may lead to the eventual success of a project-an
external Scope Controller. In the article, „controlling project scope is critical: managing
change requests is a job for the scope controller‟, the functions and the characteristics of
an effective scope controller are outlined. It is important that this job is not given to the
project manager or anyone within the project team. The scope controller should be
always be objective and has a bird's eye view of the project. The only task of the scope
controller is to "monitor the scope" (Taylor, 1990). Taylor elaborates that this person
should not join the project team without the finalization of the project specifications. It is
at this point that the project is most susceptible to scope changes.
Three alternative techniques are used for small changes in scope. They are the following:
batching small requests-clump together small scope changes requests until a certain limit

43
is reached before going to the sponsors for approval; project management discretion-
some discretion may be given to the project manager to make decisions for smaller scope
changes; and scope change contingency budget-there should be a small budget to finance
small changes in scope (Wyans,2008).
An external consultant may also be hired as a project scope controller. This person is
good for the job because they can contribute the most unbiased evaluation of change
requests and they come in the team void of "preconceived notions or allegiances to
people or departments" (Taylor, 1990). The role of the scope controller is to mainly
scrutinize requests for changes and to counsel the stakeholders of the project whenever
there is a change in the scope of the project.
Conventionally, it was the project manager's responsibility to act as scope controller.
However from experience, project managers tend to get too personally and emotionally
involved in the daily project progress that he may be unable to be fully objective and
methodical. The timing of hiring or assigning the scope controller must also be
considered. He shouldn't be added to the project team until the finalization of the project's
specifications. It is at this point that the scope is most susceptible to changes. During this
critical period, the scope controller has the time to conscientiously evaluate change
requests. With someone specially tasked to do this, the consequences of the requests may
be easily recognized before implementation.
Aside from a consultant, the scope controller may also come from close departments or
organizations concerned with the project-like people from other branches of the systems
department or from the user departments. Preferably the scope controller should have

44
experience in systems development projects. He should also be accustomed with the
effects caused by mismanaged scope changes like "missed deadlines, the unmet
expectations, the tarnished image of the systems department, and the career casualties"
(Taylor, 1990).
Some of the tools utilized by the project scope controller include the project charter, the
project dictionary, and the change request documents-they are periodically evaluated and
updated if the changes relate with the project charter. When a scope change is identifies,
the scope controller must head a meeting with the project manager and the sponsoring
user. The implications must be made known to all stakeholders and a decision shall be
made with all the factors considered.
2.8 Skills and knowledge of project scope management and implementation of
Economic Stimulus Projects
Findings from a case study conducted for over one hundred unfinished buildings building
projects in Dar es salaam point to existence of acute planning and implementation gaps in
the entire process of building projects (Mrema and Mhando, 2005).They further point out
that In most cases, malignancy of clients to assume the role of consultants through
making decisions and changes that affect design and project costs has undermined efforts
to attain the desired goals. Apart from abrogation of roles of key players, improper
planning and poor implementation strategies have groomed serious problems of
abscondment due to frustration emanating from lack of financial transparency and
unwarranted design variations during implementation. On the other hand failure of
architects to involve clients, right from the beginning, leaves the owners at stake of

45
accepting designs which they never had complete knowledge about and more often than
not they had been led to sanction changes without knowing the associated financial
implications. These attributes have a strong bearing on escalation of project cost and have
significantly contributed to growing number of unfinished buildings that appear as
architectural pollution to urban settings.
Al-Kharashi and Skitmore (2008) point out that the main cause of delay in Saudi Arabia
construction sector for public projects is the lack of qualified and experienced personnel.
A study by Ahmed, Azhar, Castillo and Kappagantula, (2002) identified ten most critical
causes in Florida as building permits approval, change order, changes in drawings,
incomplete documents, inspections, changes in specifications, decision during
development stage and shop drawings and approval. Sambasivan and Soon (2007)
identify ten most important causes of delay in Malaysian construction industry
contractor‟s improper planning, contractor‟s poor site management, inadequate contractor
experience, inadequate client‟s finance and payments for completed work, problems with
subcontractors, shortage in material, labor supply, equipment availability and failure, lack
of communication between parties, and mistakes during the construction stage
Poor understanding of the project scope as defined in the project charter in most cases
creates problem to the project manager and his team during the implementation phase of
the project. This becomes clear where misallocation of resources to undertake the
projects is visible as the project progress resulting to budget overruns prolonged
schedules and undesired quality of the deliverables of the project (Kerzner, 2009)

46
.Kilkelly (2011) observed that skill gaps play a critical role in the failure of projects. HR
specialists, consultants, management- development specialists and trainers need to
identify and close such gaps. Despite the availability and uptake of project- management
training courses, fundamental skill gaps still remain. Frodell, Josephson and Lindahl
(2008) stated that the factors which appeared to have great effect on construction projects
are first, the clients‟ ability to make decisions, second, committed construction and
management workforce and, third, competence within construction management. The
studies by Kilkelly (2011), Frodell et al. (2008) and Vanhouka and Vandevoorde (2007)
have not covered how various critical management issues affect the performance of
projects. Once the scope is wrongly perceived, poor budget allocation is done, resources
are wrongly allocated and the time for project completion is poorly planned. This has
resulted to failure of many projects. Project scope also outlines the deliverables of the
projects and the acceptance criteria of the project to the clients and the beneficiaries and
this should be well identified and planned for during project identification.
Scope management can be more important to project success than any other individual
knowledge area. It has been proven to effectively address five out of the six most
common factors cited for cost overruns and uncontrolled project growth (Dekkers and
Forselius, 2007). These factors are: lack of user input, incomplete requirements,
changing requirements, technology incompetence, and unrealistic expectations.
The Standish group‟s definition of successful projects was projects that were delivered on
time, on budget and with all features and functions as initially specified. The Standish
47
definition of challenged projects was projects that were completed, operational but over
time, and over budget and offered fewer features and functions as originally specified.
Standish‟s definition of failed or impaired projects was projects that were cancelled at
some point during the development cycle (Standish Group 1995).
In developing countries, 80% of the unsuccessful projects fail as a result of poor scope
management (World Bank and Africa Development Bank, 2003).Project scope
identification especially for projects with many beneficiaries is a key factor in the success
of projects. Projects where the stakeholders and the beneficiaries are not involved in
scope identification face a lot of rebellion during the implementation phase as they do not
own it. Once the project scope has been identified, planning of the activities that are to be
undertaken is initiated, this aids in estimating the resources, costs and the time to
undertake the project. Research has shown the importance of project planning on capital
projects and its influence on project success. According to Construction Industry Institute
(CII), recent study have proven that higher levels of pre-project planning effort can result
in significant cost and schedule savings which is associated with improved project
predictability, and has concluded that a complete scope definition prior to project
execution is imperative to project success.
Scope management has strong relations to the other knowledge areas. According to
Dekkers and Forsellius, scope management interacts and interfaces with the other 8
knowledge areas. The most important interactions occur with time, cost, quality and risks

48
management knowledge areas. There can be no changes without affecting the time, cost,
quality and risks of the project and vice versa (Dekkers and Forselius, 2007).
Figure 2.1: Project Scope Management Overview
Source: (Guide to Project Management Body of Knowledge, PMI 1996)
2.9 Theoretical frame work
Effective scope management is one of the key factors determining project success.
Failure to accurately interpret the client‟s needs or problem will produce misleading
definition (scope of work). If this causes rework and additional effort, there may be
project cost and time implications. Therefore project successes will be self-limiting if the
scope of work is not adequately defined (Rory, 2008). The key primary pillars in scope
management for successful completion of projects according to (Heldman, 2004) are
scope definition, scope planning and scope change management. He further states that,
Project scope management
Initiation Scope planning Scope
definition
Scope
verification
Scope change
control

49
one can have a clear definition of what is to be done in a project but poor planning for the
same would result to poor implementation and the consequences would be project failure.
Hinge (2003) believes that 75% of the projects fail as result of poor scope management
where functional budget is exceeded, project is not delivered on time, the end result does
not meet the expectations and commitment to implement results is not ensured.
2.10 Conceptual Framework
According to Mugenda and Mugenda(2003), a conceptual framework helps the reader to
quickly see the proposed relationship between the variables in the study and show the
same graphically or diagrammatically. The conceptual frame work of this study is based
on one dependent variable, Implementation of Economic Stimulus Projects and five
independent variables namely; project scope initiation, scope planning, scope definition,
scope verification and scope change control. Besides these there are intervening variables
which include conflict of interest, stakeholder commitment and preference. Moderating
variables include skills and knowledge and government policy.
Figure 2.1: Shows how the independent variables influence the implementation of the
economic stimulus school project

50
INDEPENDENT VARIABLE
Figure 2.2: Conceptual framework
PROJECT SCOPE MANAGEMENT
INTERVENING
VARIABLES
Conflict of
interest
Stakeholder
commitment
Stakeholder
preference
PROJECT INITIATION
Project charter
Project manager
Constraints
Assumptions
PROJECT SCOPE DEFINITION
Work break down structure
Decomposition
PROJECT SCOPE PLANNING
Scope statement
Supporting details
Scope management plan
IMPELEMENT
ATION OF
ECONOMIC
STIMULUS
PROJECTS
Projects
completed
Project
implemented
per plan
Project still
under
implementat
ion
PROJECT SCOPE VERIFICATION
Accepted deliverables
Requested changes
Recommended corrective actions
PROJECT CHANGE CONTROL
Scope changes
Corrective actions
Lesson learned
MODERATING
VARIABLES
Skills and knowledge
DEPENDENT VARIABLE
51
The dependent variable is the implementation of Economic Stimulus Project where the
project is executed according to plan. This strongly depends on the scope management of
the project, which requires efficient project initiation, management plan, proper scope
definition, efficient scope verification and change control of the project during the
implementation.
These independent variables can have positive or negative effects on the implementation
of the economic stimulus school projects. Proper scope planning is likely to lead to the
successful implementation of the project. Likewise poor scope definition can adversely
affect the implementation of the projects leading to cost and time overruns if not total
project failure leading to termination of the project. Consistent and proper scope
verification helps the project team avoid scope creeps that can negatively impact on the
project implementation process.
Other variables included the intervening and moderating variable, intervening variables
which could have impacted on the causal relationship between the dependent and
independent variables included, conflict of interest which can cause a scope creep hence
poor implementation, conflict of interest which can result to poor project scope control, s
and stakeholder commitment, lack of management commitment eliminates the positive
impact of all variable hence resulting to poor implementation hence project failure.
Moderating variables includes government policies which are deemed beaurocratic and
this quite often results to time overruns hence poor implementation of project. Most often
government funds are often associated with delays, the delays quite often exposes the
project inflation and unpredictability of finance markets, this may contribute to cost

52
overruns hence adversely impacting the project implementation. Lack of scope
management skills directly results to poor scope management affecting implementation
of the project
2.11 Summary of literature
The first section of the literature review explored literature related to the concept of skills
and knowledge, project scope management and implementation of economic stimulus
projects. Learning project management skills can help complete project on time, on
budget and on target. Scope Management includes the activities and processes required to
ensure that the project includes all the work required – and only the work required to
complete the project successfully.
The second section focused on literature related to project initiation, initiating processes
determine the nature and scope of the project. Initiation is the process of formally
recognizing that a new project exists or that an existing project should proceed into the
next phase. This formal initiation links the project to ongoing works of the performing
organization.
Thirdly, this sectioned reviewed literature on project scope planning and implementation
of the economic stimulus projects, it creates an important out put the project scope
management plan that defines how the work break down structure will be created,
basically how the scope of the project will be managed.
The next section looked at scope definition and implementation of projects which defines
all the parameters of the project and provides all the subsequent steps in project cycle.

53
The section that followed looked at scope verification which formalizes the acceptance
process of the project deliverable. The subsequent section looked at literature on project
change control, how to manage changes during project implementation. The next section
looked at skills and knowledge of project scope management and implementation of
economic stimulus projects. The second last section looked at the theoretical frame work
and finally the last section looked the conceptual frame work.

54
CHAPTER THREE
RESEARCH METHODOLOGY
3.1 Introduction
This chapter gives a detailed outline of how the study was carried out. It describes the
research design, the target population, the sample and sampling procedure, research
instruments, validity and reliability of instruments, data collection instruments, data
analysis and presentation procedure.
3.2 Research Design
The study adopted descriptive survey design method to collect information. It is a method
of collecting information by interviewing or administering questionnaire to a sample of
individuals hence suitable for extensive research, it also maintains high level of
confidentiality (Orodho, 2004).This method enabled data to be collected faster and
enables questions to be asked personally in an interview or impersonally through a
questionnaire about things which cannot be observed easily (Kothari, 2003).
According to Kerlinger (2008) Research Design is the plan and structure of investigation
conceived so as to obtain answers to research questions or test the research hypotheses.
The plan represented the overall strategy used in collecting and analyzing data in order to
answer the research questions. Cooper and Schindler (2003) summarize the essentials of
research design as an activity and time based plan. Descriptive research design is used to
gather information on the nature or condition of a present situation. Past events and how

55
they relate to current conditions are also put into consideration (Cresswell, 2009; Best &
Kahn, 2006).Therefore the research design that was employed in this study was a
descriptive survey which involved both quantitative and qualitative approaches. A survey
can be defined as a research strategy or method used to collect information about items
from a large population. The use of this design was advantageous in that a combination
of procedures such as questionnaires, interviews and observations were employed
providing an opportunity for triangulation. It also allowed collection of firsthand
information in a relatively short period and the use of a sample sufficient to infer with
accuracy how a larger group would respond (Cohen, Manion & Morizon, 2000; Kombo
& Tromp, 2006).
3.3 Target Population
Kombo and Tromp (2006) define a population as a group of individual objects or items
from which samples are taken for measurement. The study targeted Boards of
Managements and project management committees of schools that received funds
through the ESP. Members of board of governors (B.O.G) comprises of 3 person
representing NGO bodies and organizations like sponsor, 3 persons representing local
community, and 3 representing special interest groups, the 9 members select the
chairperson of the board. Other members include 3 co-opted and 1 principal (Opot,
2006). This makes the number of board members fourteen (14).In addition there were 8
site committee members and five officers from the ministry of education in charge of the
projects. This gave a total of 27 respondents per school. The ESP targeted one secondary
school per constituency, Kisumu county has seven constituencies, namely, Nyakach,
Nyando, Muhoroni, Kisumu Town East, Kisumu Central ,Kisumu Town west and Seme

56
constituencies(Independent Electoral and Boundaries Commission/IEBC).This gave a
total of 189 respondents.
3.4 Sample size and sampling procedure
This section describes the sample size and the sampling technique used in the study.
3.4.1 Sample size
Sample size is derived from a target population of 189 respondents using the Yamane
(1967), formula for population proportion as shown
below;
n=N/ 1+N (e) 2
Where;
N= Target Population
e = Precision error at 95% confidence level. e = 0.05
n = the desired minimum sample size (where population is less than 10,000)
e2= (0.05)2= 0.0025
Therefore if;
N=189
At 95% lowest level of confidence and with an error limit of 10%.
n = 189
1+189(0.0025)
= 189
1.4725= 128.3531
Say n = 128
The researcher therefore arrived at a sample size of 128 respondents.

57
3.4.2 Sampling procedure
Sampling in research was based on selecting a portion of a population to which one wants
to generalize(Orodho2003).The purpose of sampling was to secure a representative group
which enabled the study to gain information about the population. The study applied
stratified random sampling and judgmental sampling techniques. Stratified random
sampling is a modification of random sampling in which the population is divided into
two or more relevant and significant strata based on one or more attributes (Touliatos and
Compton, 1988).Members of a population were divided into homogenous sub-groups.
Further Kothari (2004) recommends stratified sampling because it is accurate, easily
accessible, divisible into relevant strata and enhances better comparison; hence
representation across strata. Advantage of stratified sampling is its ability to ensure
inclusion of subgroups, which would be emitted entirely by other sampling methods
because of their small number in the population. The researcher selected the sampling
units based on their degree of involvement, knowledge about the project, position in the
project team, responsibility and authority. The respondents were selected based on three
clusters namely, BOM, Officers from DEO‟s office and head teachers and site committee
members.
Table 3.1: Shows stratification process
Respondents Number Proportion of population in % Sample size
Board of Management 14(7)=98 68 66
Ministry of Education 5(7)=35 68 24
Site committee members 8(7)=56 68 38
Total 189 68 128

58
The sample size was arrived at using the formula nh= (Nh/N) *n
nh=sample size for stratum h
Nh=population size of stratum h
N=total population size
n= total sample size
Patton (1990) recommends that a sample of size of more than 30 and less than 500 is
appropriate for any social research.
To arrive at the number to be interviewed per school, the researcher used judgmental
sampling, in judgment sampling, instead of statistical analysis; the researcher depends on
his or her own judgmental analysis to obtain a representative by using a sound judgment
(Black, 2010). The sample size for each stratum was divided by the total number of the
schools under study. This resulted to the following average;
Table 3.2: Sample size per school
3.5 Research Instruments
The data collection instruments used in this study included questionnaires and interview
guide for the District Education Office. According to Mugenda and Mugenda (1999) the
Respondents Sample size Sample size per school Number
to
interview
Board of management 66 66/7=9 9
Ministry Of Education 24 24/7=3 3
Site committee members 38 38/7=5 5

59
questionnaire was structured based on the main research questions. The first section
covered demographic characteristics of respondents. Section I is to elicit demographic
information. Section II sought information on implementation of the economic stimulus
projects. Section III sought to gather information related to project initiation. Section IV
sought information on project scope planning. Section V on project scope definition.
Section VI will gathered information on scope verification. Section VII sought to gather
data on scope change control. The last section contained questions and an interview
schedule to be responded to by the District Education Office.
3.5.1 Pilot testing
The researcher conducted a mini-version of the full-scale study, the pilot study. This is
was done in Alego Usonga and Gem constituencies, the target schools were, Ngiya Girls
High School in Alego and Sawagongo High School in Gem. This targeted five cases in
each school where the research instruments were tested by being administered to the
project team members who participated in the implementation of the project. This served
as a feasibility study as the participants did not form part of the final data collection. This
formed specific pre-testing of the questionnaire and the interview guide. Conducting a
pilot study increased the likelihood of success of the main study. This provided an
advance warning where the main research study could fail, where research protocols may
not have been followed or whether proposed methods and instruments were inappropriate
or too complicated..

60
3.5.2 Validity of instruments
Validity refers to the degree to which evidence and theory support interpretation of test
scores entailed by use of tests. The validity of instrument is the extent to which it does
measure what it is supposed to measure. According to Mugenda and Mugenda (1999)
validity is the accuracy and meaningfulness of inferences, which are based on the
research results. It is the degree to which results obtained from the analysis of the data
actually represent the variables of the study. The researcher validated the research
instruments in terms of content and face validity. For validation to be achieved the study
was also conducted a pilot testing.
The validation of the questionnaires and interview schedule was done through the
following ways: the researcher requested research experts, supervisors and
classmates(peers)to review the items on the instrument to determine whether the set of
items accurately represent the variables under study. They were asked to read, judge,
make recommendations and give feed back to the researcher.
Face validity concerns the extent to which the researcher judges that the instrument is
appropriate. The researcher consulted research experts to verify whether the instruments
are valid. After the construction of the questionnaires and interview schedule the
researcher reviewed items with the help of supervisors, lecturers and scrutiny of peers.
The suggestions given were incorporated to validate the instruments.

61
3.5.3 Reliability of instruments
Mugenda and Mugenda (1999) defined reliability as a measure of the degree to which a
research instrument yields consistent results or data after repeated trials. An instrument is
reliable when it can measure a variable accurately and consistently obtain the same results
over a period of time. Test-retest method was used to test the variability of the
instruments. This is because, it shows the consistency of subject scores obtained by the
instrument over time (Kasoma, 2007).
According to Punch (2008) Test-retest is the Administration of an instrument at two
points in time. Punch (2008) contends that a correlation co-efficient of above 0.70
indicates that instrument is reliable. The committee and MOE questionnaires were
administered twice to check their reliability. A Pearson product‟s moment correlation co-
efficient formula was used using the formula below.
R = NΣxy (Σx)(ΣY)
√NΣX2-(XY)2(NΣY2-ΣXY2)
ΣX=sum of scores in X distribution
ΣY=sum of scores in Y distribution
ΣX2 =sum of squared scores in x distribution
ΣY2=sum of squared scores in y distribution
Σxy=sum of the product of point x and y scores
N=the number of point x and y scores
The co-efficient for the MOE questionnaire was 0.75 while that of the project committee
had a coefficient 0.72 hence the instruments were reliable.

62
3.6 Data collection procedure
Permission for data collection was sought from the ministry of Higher Education through
the department of National Council for science and Technology, the researcher then
proceeded to collect the data. The primary data was sourced through administration of
questionnaires and interviews. The research instruments were administered the schools,
constituency offices and District Education Offices and collected immediately by the
researcher in most cases for the purpose of coding data interpretation.
3.7 Data Analysis techniques
While data collection is the systematic recording of information, data analysis according
to Egger and Carpi (2008) involves working to uncover patterns and trends in data sets.
They further elaborate that by publishing data and techniques used to analyze and
interpret the data, scientists give the community the opportunity to both review the data
and use it in future research.
Since the data used in this study was both qualitative and quantitative, organization,
presentation and analysis took different forms depending on the nature of the data. Data
entry was done immediately after collection from the field. Qualitative data was
summarized then arranged into relevant themes and presented verbatively, while
quantitative data were classified into frequency distribution tables after being analysed
using Statistical Package for Social Scientists (SPSS V.20).This approach is supported by
Earl R. Babbie( 2009). The process also consisted of data cleaning to ensure erroneous
entries were inspected and corrected where possible. Chi-square and correlation tests
were performed at a significance level of 95%.A margin of error of 5% was used to test
the hypotheses. Variables whose calculated P-value (Chi-square value) were less than

63
0.05% the hypothesis that corresponds were accepted otherwise were rejected. In order to
determine influence of skills and knowledge on the relationship between project scope
management and implementation of economic stimulus projects, regression analysis was
used at a confidence level of 0.05.In multiple regressions, the regression model is of the
form: Y= B0+B1X1+B2X2 +…………………………………BnXn+E
Where Y-is the dependent variable
X1-n -are the independent variables B0-is the constant
B1-n –are the regression coefficients or change induced in Y by each Xn
E- is the error
Source : Mugenda and Mugenda (1999)
3.8 Ethical Issues
The ethical and moral issues arising out of the research were put into consideration. As
far as confidentiality is concerned, research data was not disclosed to third parties or
other parties that could have used such data for their own purposes. Anonymity was
observed by ensuring that a respondent‟s name and particulars were not disclosed. In
addition, participation in the research was on a voluntary basis, and participants were at
liberty to withdraw from the study at any time without repercussions. In addition,
permission to conduct research was sought from the Ministry of Higher Education,
Science and Technology, National Council for Science and Technology.

64
CHAPTER FOUR
DATA ANALYSIS, PRESENTATION AND INTERPRETATIONS
4.1 Introduction
This chapter presents analysis, interpretation and discussions of the findings in the
following themes; how project initiation as a project scope management influence the
implementation of ESP, extent to which project scope planning influence implementation
of ESP, assessment how project scope definition influence implementation of ESP
projects, examination of how project scope verification influences influence the
implementation of ESP projects in public secondary schools. The extent to which project
change control influence implementation of ESP projects and moderating influence of
project skills and knowledge on the relationship between project scope management and
implementation of ESP projects in public secondary schools.
4.2 Response return rate
A total of 128 research instruments were developed for data collection. These included 66
questionnaires for members of BOM, 24 for the Ministry of Education officials and 38
for the project site committee members. Among these 106 questionnaires were duly filled
and returned for analysis which gave a questionnaire return rate of 82.8 % which the
study considered adequate for analysis. For the Ministry of Education the return rate was
100% as all the questionnaires and interview schedule were duly filled and responded to.
The site Committee members 27 questionnaires were duly filled and returned giving a
rate of 71.0%.The Board of Management, 55 questionnaires were duly filled and

65
returned, this gave a rate of return of 83.3%.In Total this gave a response rate of 82.8% of
all the 106 questionnaires that were returned. The high response rate can be attributed to
the fact that the research instruments were collected from the respondents as soon as they
finished answering the questions. This minimized the chances of misplacement or loss of
the instruments. Another strategy that the research employed to ensure high rate of return
was monitoring the research assistants to determine the number of instruments issued and
those already filled and returned.
4.3 Demographic characteristics of the respondents
The study sought to establish demographic distribution of the respondents in terms of
gender, age, education, and number of years served in the target schools. The sub-
sections discuss some of these demographic characteristics in order to understand the
participants who took part in the study.
4.3.1 Distribution of respondents by Age
The study sought to establish the age of respondents who participated in the study. This
was considered important as it could reveal information on the age bracket of men and
women who took part in the study. The age of an individual may affect ones level of
experience and physical ability to accomplish various tasks. The very young may be
inexperienced and could be better off acquiring knowledge and skills. On the other hand
the very old may not be physically up to standard required for the physical activities in a
project. From the findings majority 44 (41.5%) of the respondents were between 40-49
years, followed by 37 (34.9%) who were between 30-39 years, those above 49 yrs and

66
above were 13(12.3%) and finally the least represented were of age group 20-29 that
accounted for 11.3% of the total respondents.
From the table 4.1 the distribution of men by women by age, those between 20-29,
(7)63.6% were females against men who were (4)36.4%,the bracket of,30-39 years
showed that (16)42.1% against women who were(22) 57.9%, this trend changes
drastically in the age group of 40-49 where 35(79.5%) were male against females who
were only 9(20.5% ) and above where(9) 69.2% against women who were 4(30.8%).The
responses were captured in Table 4.1.This data points out the state of gender parity
among the projects stakeholders in terms of their ages.
Table 4.1 Distribution of men and women respondents by Age
Gender Age bracket of the respondents
20-29 30-39 40-49 Above 50
years
F % F % F % F %
Male 4 36.4% 16 42.1% 35 79.5% 9 69.2%
Female 7 63.6% 22 57.9% 9 20.5% 4 30.8%
Total 11 100% 38 100% 44 100% 13 100%
4.3.2 Distribution of respondents by level of education
Gender representation affects degree of development. If one gender group is
underrepresented, then development cannot be wholly realized. In terms of education 14
males had masters against two women which showed skewed representation at masters
level of education, at degree level the skewness was not as pronounced as 30 males

67
against 22 females had bachelors, at diploma level more females had diploma than men,
15 females against 13 males, finally at certificate again more men 7 against 2 females.
These findings revealed that most of the respondents were adequately educated with
majority having a diploma and above, statistically 17(16%) of the respondents had
masters, while 52 (49.1%) of the respondents had bachelors degree, 28(26.4%) of the
respondents had diploma, this gave accumulative percentage of 91.5% of the respondents
having diploma and above pointing to a very strong educational background among the
respondents, only 9(8.5%) had certificates. This shows that the projects were being
implemented by highly educated people and given the right skills and knowledge they
were very capable of proper implementation of the projects. It is also a pointer to
education stakeholders on the level of education of the personnel charged with the
implementation of the projects and the gender parity in terms of education.
Table 4.2 Distribution of men and women by their level of education
Gender of the respondents Masters Bachelor degree Diploma Certificate
Male 14 30 13 7
Female 3 22 15 2
Total 17 52 28 9
4.4 Project initiation and implementation of Economic Stimulus projects
The study sought to find out how project initiation as a project scope management
influences the implementation of Economic Stimulus Project in secondary schools. In
order to determine whether the project scope was adequately initiated and its influence on
the implementation of project. Several questions in line with this objective were asked to

68
the respondents. Cross tabulations were then done to determine the level of significance
initiation had on the implementation of ESPs.
4.4.1 Project charter
The project charter is the document that formally authorizes a project. It gives the project
manager authority to apply organizational resources to project activities. The project
initiators or the sponsor issues the project charter. To investigate the following questions
were posed to the respondents on project charter and the responses summarized in table
4.3.
Table 4.3 Responses to questions on scope initiation
Questions Frequency Yes % No% Total %
Was a project charter prepared? 106 42.5 57.5 100
Was expert judgment sought during initiation? 104 39 61 100
Objectives agreed upon by stakeholders 103 43.4 56.6 100
Success criteria agreed upon by stakeholders 106 39.6 60.4 100
The most important output during the project initiation phase is the project charter. The
researcher therefore sought to know if the projects had charters to guide the
implementation of the projects, 42.5% of the respondents admitted that the projects had
charters while 57.5% of the project said they did not have charters, most of the
respondents who said they had not prepared the charter due to time constraints attributed
to the initial fixed duration required of the Economic Stimulus Projects. The study further
sought to know if an expert‟s input was sought during the initiation process, 61% of the
respondents said they did not consult an expert while 39% of the respondents said an

69
expert was consulted, the findings revealed that most of the respondents did not seek
input from the experts, this implied that the initiation process was done by most of the
projects without consulting those with skills and requisite knowledge to aid in proper
initiation. Kenneth (2007) observed that technical expertise to understand the
arrangement of the projects is necessary for project to be executed within the time, cost
and quality within the resources available.
Conflict and controversies about implementation can arise if stakeholders are not
adequately engaged; this can be avoided if stakeholders are involved in every decision
during the initiation phase (Olander and Landin, 2005). Stakeholder involvement during
the initiation phase of the project is very crucial for the project success, the study
therefore sought to find out whether stakeholders participated in setting up the key
objectives of the project, 43.4% answered in the affirmative while 56.6% of the
respondents said stakeholders were not involved, this was mainly attributed to the
overriding economic stimulus objectives that came direct from the government with the
findings, other respondents still attributed this to local area politics as the projects were
overseen by the local political infrastructure, the constituency development office. This
implied that majority of the implementers of these projects did not own the project
objectives hence a higher likelihood of not meeting the objectives.
Success criterion is a very important aspect of project scope management and should be
designed as a basis for project initiation, this is derived through a consensus amongst all
the stakeholders and participants, this forms for project initiation. The findings revealed
that only 39.6% of the respondents had such criteria while 60.4% of the respondents said
success criteria was not agreed upon by the stakeholders, this implied that majority of the

70
stakeholders would find it difficult to measures the success of the projects upon
completion.
The first cross tabulation was done to ascertain the relationship between preparation of
project charter and the status of the project as reported by the respondents during
interview. The findings revealed that 72.7% of the respondents who reported the project
status as complete also said the projects had a project charter which is the most important
output during the project initiation phase, this pointed to the fact that there was proper
initiation of the projects. On the contrary 71.0% of the respondents who said then projects
never prepared a project charter reported the status of their projects a still under
construction, these were projects whose duration was stipulated at six months and
therefore this admitted the fact that the projects incurred both time and cost overrun.
Table 4.4 Cross tab between Project status and Project charter
Project charter Completed Still under construction
Yes 32 72.7% 18 29.0%
No 12 23.7% 44 71.0%
Total 44 100 62 100%
Pearson Chi –square test of significance resulted to a value of 19.718 which translated to
a p-value of 0.0001.This points to a strong relationship between project initiation and
successful implementation of the project since the a p-value of 0.0001 is less than 0.05%
significance level. Additionally, Pearson correlation analysis at 0.01 level of significance
(2-tailed) established a strong relationship between project charter and project status with
a correlation value of 0.431.

71
4.4.2 The project manager
Burke (2003) states that: “experience has shown that the selection of the project manager
is a key appointment which can influence the success or failure of a project”
Gehring(2007) states that instead of carefully selecting competent project managers,
organizations tend to create „accidental‟ project managers by not carefully selecting the
project manager. The study therefore sought to establish how the project managers were
selected by the project initiation team. Respondents were therefore asked about the mode
of selection of the project manager during the project initiation, they were asked if the
manager was selected based on competence and qualification or favoritism. Majority
(52.8%) of the respondents said the project managers were selected based on favoritism,
42.45% indicated that selection was based on competence and qualification while 4.7%
were not sure.
Table 4.5: Selection procedure of the project manager
The study also sought to determine the competent of the project managers, 31.1%
indicated that the manager was very competent. 33.0% indicated that the manger was
competent while 35.8% felt that the manager was incompetent. Gillingham (2006)
Procedure Frequency Percentage
Based on competence and qualification 45 42.5
Based of favoritism 56 52.8
Not sure 5 4.7
Total 106 100

72
reported that there is growing evidence that capability in managing projects leads to
superior performance in implementation strategy.
Table 4.6 :Competence of the project manager
Competence Frequency Percentage
Very competent 31 31.1
Competent 27 33.0
Incompetent 48 35.8
Total 106 100
Study by Brill,Bishop and Walker(2006) found that problem solving expertise and
leadership expertise were ranked as the top two key competencies required of a project
manager. Weirauch (2000) echoes the same sentiments and states that a project manager
should be competent in two primary knowledge base sets-technical and leadership
knowledge base. The study therefore sought to whether project management techniques
were adequately applied. Findings, 23.5% of the respondents indicated that project
management techniques were adequately used during the implementation of
projects.61.8% of the respondents indicated that they were inadequately applied while
14.7% were not sure. Anderson and Merna (2005) state that projects that perform poorly
signal a credibility gap as to the competence of project manager. Ceram and Dorman
reiterates that competent project managers form the foundation for successful projects

73
Table 4.7: Application of project management techniques
Rate of application Frequency %
Adequately 24 23.5
Inadequately 63 61.8
Not sure 15 14.7
Total 102 100
The second correlation test was done to ascertain the relationship between the project
duration and the competence level of the project manager as reported by the respondents.
This sought to determine whether competent project managers were able to deliver the
projects on time, which would be interpreted to mean successful implementation of the
projects. The cross tab revealed that51.6% of the respondents who rated their project
managers as very competent also indicated that the projects were completed within the
stipulated duration of ESP that is within six month duration, similarly 37.0 % of the
respondents who rated their project manager as competent also reported meeting the six
month stipulated duration. As expected 4.2% a minimal number of those who rated their
project managers as incompetent also reported that they managed to complete the projects
within the six month stipulated duration.

74
Table 4.8 :The competence of project manager against duration of the project
Duration Very competent Competent Incompetent
Up to 6
months
16 51.6% 10 37.0% 2 4.2%
6-12
months
6 19.4% 3 11.1% 3 6.2%
1-3 years 0 0.0% 6 22.2% 15 31.2%
Ongoing 9 29% 8 29.6% 28 58.3%
Total 31 100% 27 100% 48 100%
Further correlation analysis using the Spearman‟s rho resulted into a p-value of 0.017 at a
significance level of 0.05(2-tailed). This proves that there was a strong association
between competence of project manager and delivery of project on time. A further
correlation using Pearson correlation between selection procedure of the project manager
and the competence of the project manager resulted into a p-value 0.01, this in a nut shell
proves that there was a consistent strong relationship between the project manager
selection procedure during the initiation and project implementation and there by proves
that activities at initiation greatly influenced the implementation of the economic
stimulus projects.
4.43 project constraints and assumptions
Project assumptions, few projects begin with absolute certainty. If we had to wait for
absolute certainty, most projects would never get off the ground. As projects are planned
and executed, some facts and issues are known, others must be estimated. Estimation is
an art, with many fine points to finesse between certainty and wishful thinking. You can't

75
just hope you have the resources you need to do the job, and you can't wait until every
resource is available to begin. You have to manage and mitigate using informed
assumptions and constraints.
From initiation to closure, assumptions and constraints set the stage for project planning
and execution. As the project is planned, assumptions and constraints will be used to
define and shape tasks, schedules, resource assignments and budget allocations. As such,
each is used to manage an otherwise uncertain future, laying out a roadmap for how the
project will proceed. The study therefore sought to find out from the respondents whether
the project assumptions and constraints were clearly outlined by the project stakeholders,
45.3% of the respondents said that the projects had assumptions and constraints out lined,
implying that the projects took into considerations various aspects that could limit and
also aspects that could be assumed during the implementation54.7% of the respondents
said that the constraints and assumptions were not outlined and therefore the
implementation just proceeded .
Table 4.9 :Constraints and assumptions
Item Frequency %
True 48 45.3
False 58 54.7
Total 106 100
To find out more on the assumptions the project sought to find out the accuracy of the
project assumptions, this also helped the study to establish whether the assumptions were
valid or were just a formality, carefully crafted project assumptions tend to be accurate

76
and helpful to project implementation ,the findings revealed that 5.7% of the respondents
felt that the project assumptions were very accurate, 35.3% felt the assumptions were
accurate, while 58.8% of the respondents observed that the assumptions were in accurate
implying they were misleading to project implementation. ( Attarzadeh, 2008) concluded
that projects fail mainly because of inability to estimate correctly.
Table 4.10: Accuracy of project assumptions
Level of accuracy Frequency Percentage
Very accurate 6 5.7
Accurate 36 35.3
In accurate 60 58.8
Total 102 100
On effectiveness of the project assumptions, 19.8% of the respondents observed that the
project assumptions were very effective, 33% felt that the assumptions were effective
while 46.7% felt that the project assumptions were not effective.
The study sought to find out whether the assumptions made by the project team were
useful, to establish this the respondents were asked whether they established that the
assumptions were valid for the project implementation , the following responses were
elicited;

77
Table 4.11 :Validity of assumptions
Validity Frequency Percentage
Valid 28 32.1
Invalid 25 28.3
Not sure 36 39.6%
Total 89 100
The study sought to determine the relationship between project constraints and scope
control, the study sought to establish if the project implementation teams that were aware
of the project constraints also had better project scope control. To do this response from
the question that required the respondents to indicate whether the project constraints were
outlined was cross tabulated with the responses on the degree of scope control as reported
by the respondents. The findings revealed 71.4% of the respondents who said they
outlined the project constraints meaning they were aware also reported the degree of
scope control as very good, similarly 69.6% of the respondents rated the project scope
control as good also reported they outlined the project constraints. Conversely 68.6% and
62.5% of the respondents who respectively indicated the degree of scope control as poor
and very poor respectively also indicated they did not outline the project constraints
meaning they were not away of the project constraints. A project constraint is an output
of project initiation and this fact demonstrates how project initiation impacted on the
scope control hence influencing the entire implementation process of the project. The
Pearson Chi-square test asymptomatic (2-sided) resulted to a value of 11.542 which
translated to a p-value of 0.021 which is less than 0.05 significant level hence indicating a
very significant relationship.

78
Finally the study sought to determine the significance of relationship between validity of
project assumptions as reported by the respondents against the degree of scope control as
reported by the respondents. Table (4.12) presents the findings as follows, 71.4% of the
respondents who reported the degree of scope control as very good also reported the
project assumptions as valid, on the other hand 28.6% and 37.5% of the respondents who
reported scope control as poor and very poor respectively also reported the assumptions
as not valid.51.4% and 50.0% of the respondents who reported the degree of scope
control as poor and very poor respectively were equally not sure about the validity of the
assumptions made during the project initiation. The Pearson Chi-square test resulted to a
calculated value of 16.509 which translated to a p-value of 0.036 which was less than
0.05 significance level hence establishing a strong relationship between valid
assumptions and project scope control.
Table 4.12: Project assumptions and degree of scope control
Validity Very good Good Average Poor Very poor
F F F F F
Valid 10 71.4% 9 39.1% 7 26.9% 7 20.0% 1 12.5%
Invalid 2 14.3% 8 34.8% 7 26.9% 10 28.6% 3 37.5%
Not sure 2 14.3% 6 26.1% 12 46.2% 18 51.4% 4 50.0%
Total 14 100% 23 100% 26 100% 35 100% 8 100%

79
Hypothesis one
The study sought to establish the relationship between project initiation and the
implementation of ESP projects. This was made possible by the hypothesis that stated
„There is no significant relationship between project initiation and implementation of
Economic Stimulus Projects.” To do these responses from respondents who prepared a
project charter, the most important output of project initiation was cross tabulated with
status of the project as reported by the respondents then Chi-square test was employed to
test for significance. Pearson Chi –square test of significance resulted to a calculated
value of 19.718 which translated to a p-value of 0.0001.This means there was a strong
relationship between project initiation and successful implementation of the project since
the a p-value of 0.0001 is less than 0.05% significance level. Additionally, Pearson
correlation analysis at 0.01 level of significance (2-tailed) established a strong
relationship between project charter and project status with a correlation value of
0.431.The study confidently concluded that there was a significant relationship between
project initiation and implementation of the Economic Stimulus Projects.
4.5 Project Scope Planning and Economic Stimulus Projects
In this section, the study sought to determine the extent to which project scope planning
influenced the implementation of Economic Stimulus Projects in public secondary
schools in Kisumu County. Several questions in line with this objective were asked to the
respondents. Cross tabulations were then done to determine the level of significance
scope planning had on the implementation of ESPs.

80
The research sought to know whether the respondents had experience in scope planning,
from the findings the study was able to find that, (41)38.7% did have experience
65(61.3%) said they did not have experience. This implied that most of the respondents
did not have the experience of scope planning. Inexperience during project planning
creates obstacles to implementation of projects(Commission of the European Union,
2008).There is fear that obstacles in the planning and implementation phases translate
into cost escalation, if they do not block projects all together (Ardity et al,2007).
Table 4.13 Experience in scope planning
Response Frequency %
Yes 41 38.7%
No 65 61.3%
Total 106 100
Lack of effective involvement of stakeholders may contribute to poor implementation of
the project. The researcher therefore sought to know whether the key stakeholders
participated in the scope planning process, 47(48%) said the key stakeholders participated
in the process, while 51(52%) said that the key stakeholders never participated in the
process. Artkinson et al (2006) concluded that failure to consider and clarify stakeholders
expectations and concern can result in extraordinary risks being ignored and may lead to
difficulties in running the project and poor performance.

81
Table 4.14: Stakeholder participation in scope planning process
Response Frequency %
Yes 47 48.0%
No 51 52.0%
Total 98 100%
The research was therefore able to establish that slight majority participated in the
process of the plan, cross tabulation were done to find out how many of the respondents
who had experience participated in the process. Cross tabulation revealed that 37.8% of
the respondents who said they had experience in scope planning participated in the
process, similarly 54.1% of the respondents who said they did not have experience also
participated in the process. These findings show that scope planning process during the
implementation of Economic Stimulus Projects was largely undertaken by those who did
not have experience and this had a possibility of negatively influencing the
implementation process.
Table 4.15 Cross tabulation of participation in scope planning process and
experience in scope planning
Participation in scope planning Experience in scope planning
F Yes F No
Yes 14 37.8% 33 54.1%
No 23 62.2% 28 45.9%
Total 37 100% 61 100%

82
4.5.1 Scope statement
The goal of project scope planning is to create a scope statement, as a prerequisite the
project manager and the project team must have a full understanding of the project
requirements, justification and stakeholder expectation to successfully create a project
scope statement, the researcher therefore found important to probe if the project team
prepared a scope statement (see table). The research found that, 22(20.8%) of the
respondents said they had prepared a scope statement, 51(48.1%) said no scope statement
was availed while 33(31.1%) were not sure. This could imply that most of the projects
were implemented without full requirements and were most likely to encounter scoping
problems.
Table 4.16: Scope statement
Response Frequency %
Yes 22 20.8%
No 51 48.1%
Not sure 33 31%
Total 106 100%
The scope statement quantifies the project objectives and this guides and is key to
understanding the project purpose, it also guides all future project decisions during
implementation. The study in order to gather more information sought to find out if the
project objectives were clear to all the stakeholders, from the findings(see table 4.18) it
was realized that 44(41.5%) of the respondents said the project objectives were clear
while 62(58.5%) said that the project objectives were not clear. The fact that objectives

83
were not clear to all the stakeholders is an indication that the scope statement was not
properly done.
Table 4.17: Clarity of the project objectives
Response Frequency %
Yes 44 41.5%
No 62 58.5%
Total 106 100
4.5.2 Supporting details
Supporting details in a scope statement plays a very important role in passing clear and
adequate information to other stakeholders during project implementation and this
enables scope management. The researcher found it important to assess whether
supporting details were clear enough to facilitate use by other project stakeholders
implementing the project, findings 15(33.3%) of the respondents said the supporting
details were clear enough while(30) 66.7% said supporting details were not clear enough
to facilitate use. The research interpreted this to mean the scope statements were not
useful to the project implementation process.

84
Table 4.18: Supporting details
Response Frequency %
True 15 33.3%
False 30 66.7%
Total 45 100%
The study sought to determine the correlation between project coordination and
supporting details in the scope statement. Cross tabulation was therefore done to ascertain
how the 45 respondents who responded to this question rated the level of coordination
during the project implementation. Findings revealed that out of the 15 respondents who
reported clear supporting details, 66.7% rated the level of project coordination highly. On
the other hand out of 30 respondents who did not support the fact that there were clear
supporting details, 73.3% and 23.3% respectively rated the level of coordination as low
and very low. This revealed that that there was a correlation between clear supporting
details in the project scope statement and the level of coordination. Poor coordination of
projects was pointed out by Kwak (2002) as a significant factor contributing to cost
overruns during project implementation.
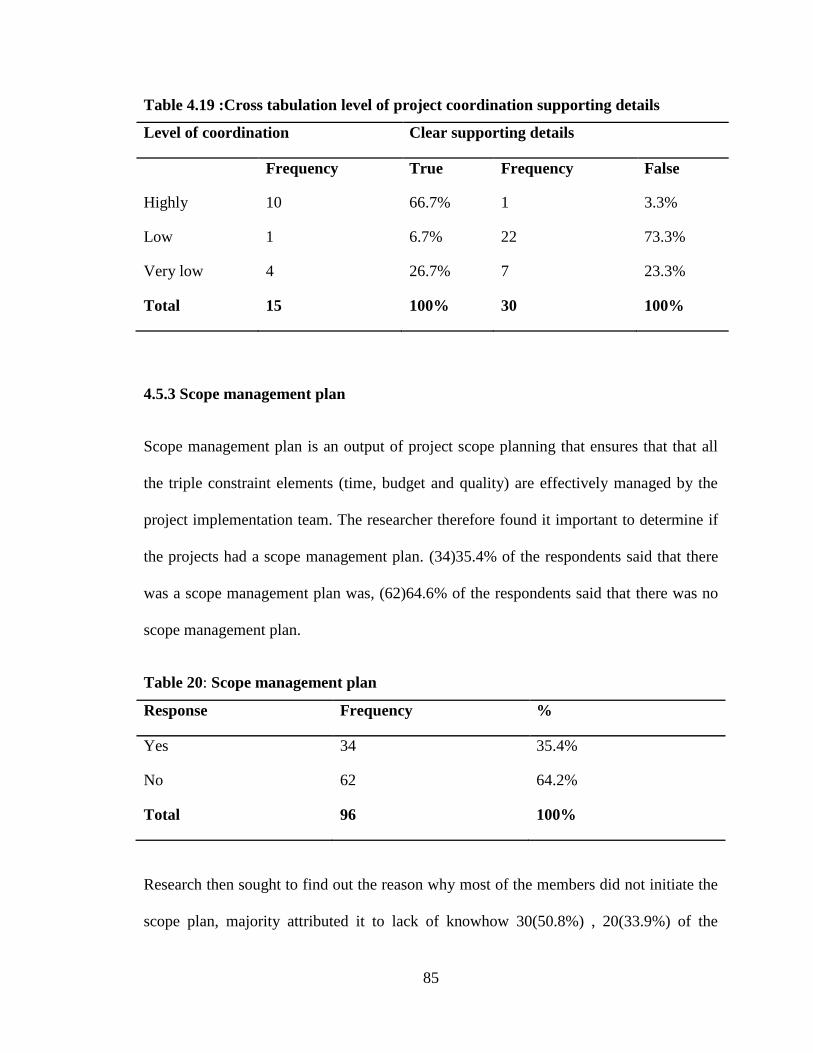
85
Table 4.19 :Cross tabulation level of project coordination supporting details
Level of coordination Clear supporting details
Frequency True Frequency False
Highly 10 66.7% 1 3.3%
Low 1 6.7% 22 73.3%
Very low 4 26.7% 7 23.3%
Total 15 100% 30 100%
4.5.3 Scope management plan
Scope management plan is an output of project scope planning that ensures that that all
the triple constraint elements (time, budget and quality) are effectively managed by the
project implementation team. The researcher therefore found it important to determine if
the projects had a scope management plan. (34)35.4% of the respondents said that there
was a scope management plan was, (62)64.6% of the respondents said that there was no
scope management plan.
Table 20: Scope management plan
Response Frequency %
Yes 34 35.4%
No 62 64.2%
Total 96 100%
Research then sought to find out the reason why most of the members did not initiate the
scope plan, majority attributed it to lack of knowhow 30(50.8%) , 20(33.9%) of the

86
respondents said that they did not due to lack of management commitment while
9(15.3%) attributed it to time constraints .Most of the qualitative account from the
respondents alluded to inappropriate trainings, they said that most of the training they
were mainly taught how to develop project proposal and overview of project management
without delving into specific areas like project scope management.
Table 4.21: Reason for lack of scope management plan
Reason Frequency Percentage
Lack of management commitment 20 33.9%
Lack of know how 30 50.8%
Time constraints 9 15.3%
Total 59 100%
Cross tabulation was done to establish the relationship between scope planning and scope
control, the findings revealed that 23.8%,33.3% and 7.9% of the respondents who said
they had experience in scope planning also reported the degree of scope control as
excellent, very good and good respectively. On the other hand, 25.6%, 37.2% and 7.0%
of the respondents who said they lacked experience in scope planning also rated the level
of supervision as average, poor and very poor respectively.
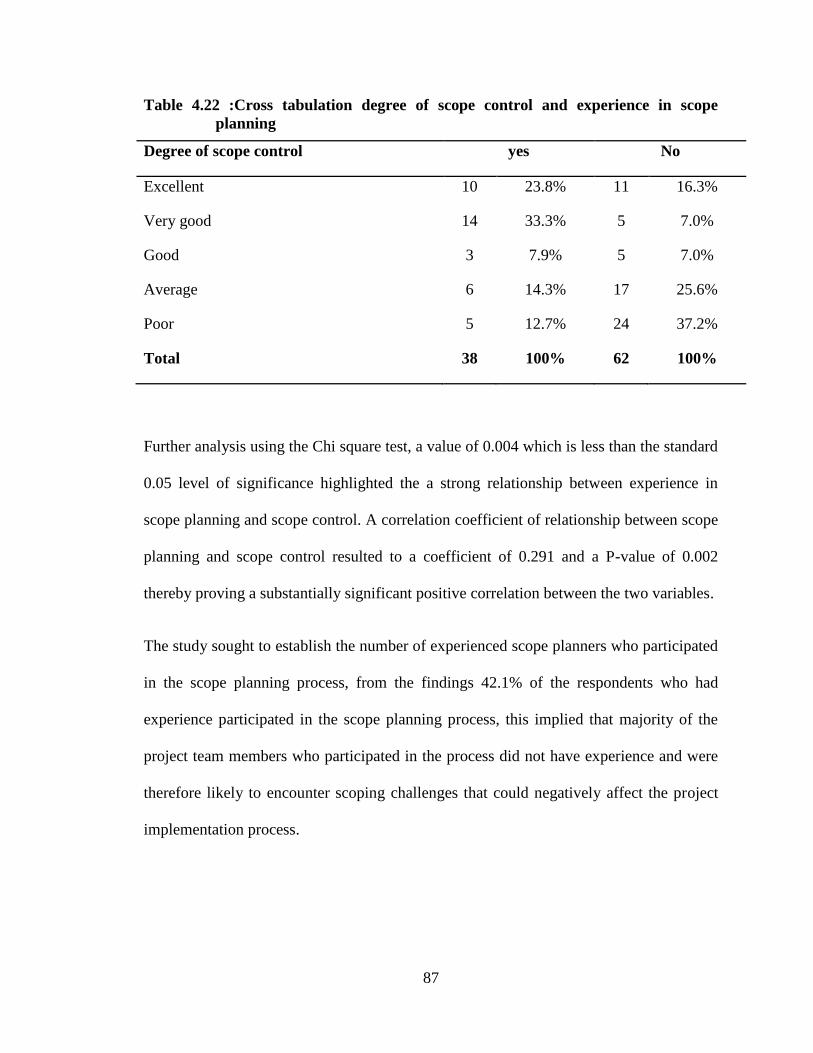
87
Table 4.22 :Cross tabulation degree of scope control and experience in scope
planning
Degree of scope control yes No
Excellent 10 23.8% 11 16.3%
Very good 14 33.3% 5 7.0%
Good 3 7.9% 5 7.0%
Average 6 14.3% 17 25.6%
Poor 5 12.7% 24 37.2%
Total 38 100% 62 100%
Further analysis using the Chi square test, a value of 0.004 which is less than the standard
0.05 level of significance highlighted the a strong relationship between experience in
scope planning and scope control. A correlation coefficient of relationship between scope
planning and scope control resulted to a coefficient of 0.291 and a P-value of 0.002
thereby proving a substantially significant positive correlation between the two variables.
The study sought to establish the number of experienced scope planners who participated
in the scope planning process, from the findings 42.1% of the respondents who had
experience participated in the scope planning process, this implied that majority of the
project team members who participated in the process did not have experience and were
therefore likely to encounter scoping challenges that could negatively affect the project
implementation process.

88
Table 4.23: Cross tabulation participation in scope planning process and experience
in scope planning
Participated Experience in scope planning
Yes No
Yes 24 42.1% 23 56.1%
No 33 57.9% 18 43.9%
Total 57 100% 41 100%
Proper coordination of projects is a necessary condition to successful implementation of
projects, the study therefore found it important to establish the relationship between the
project scope statement and coordination level of the project, table 4.24 reveals that
63.3% of the respondents who availed scope statement also reported that the project was
highly coordinated, this implied that the projects had greater chance to successful
implementation. In contrast, 59.5% of the respondents who reported no scope statement
and 55.9% of the respondents who were not sure also rated the coordination as low and
very low respectively. This implied potential scoping problems like scope creep due to
poor coordination.
Table 4.24: Cross tabulation level of project coordination and scope statement
Level of coordination Scope statement was availed.
F Yes F No F Not sure
highly 19 63.3% 16 38.1% 13 38.2%
low 10 33.3% 25 59.5% 19 55.9%
Very low 1 3.3% 1 2.4% 2 5.9%
Total 30 100% 42 100% 34 100%
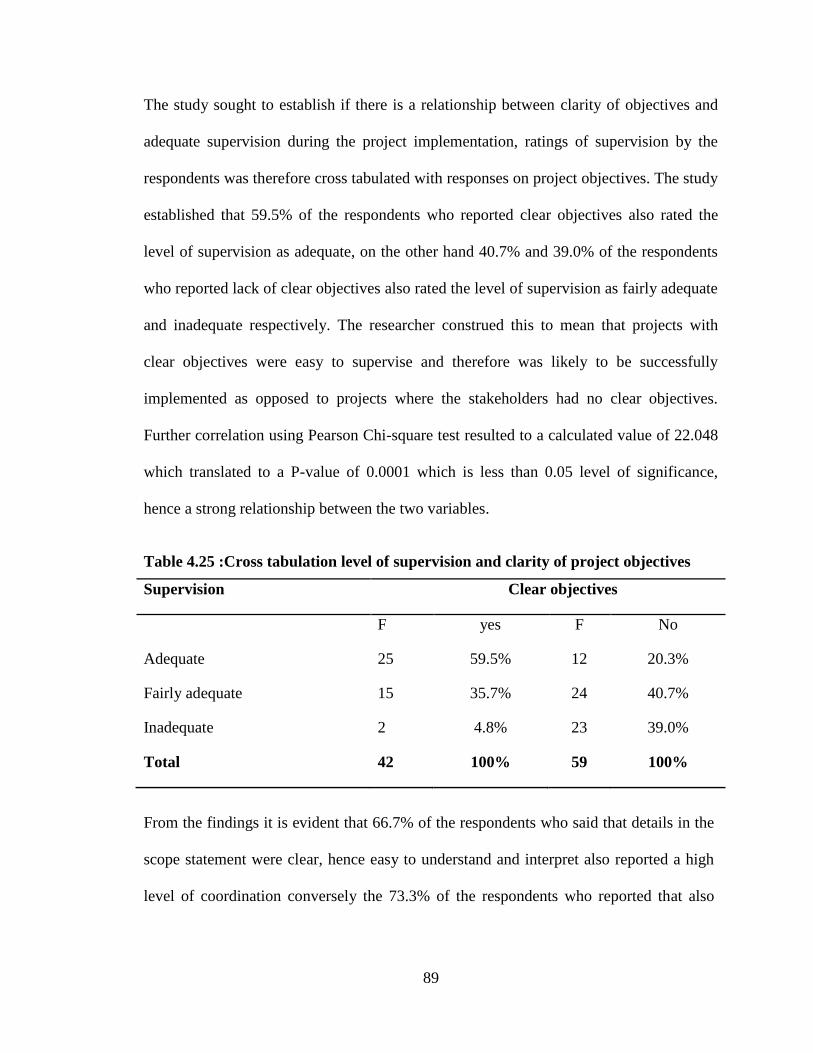
89
The study sought to establish if there is a relationship between clarity of objectives and
adequate supervision during the project implementation, ratings of supervision by the
respondents was therefore cross tabulated with responses on project objectives. The study
established that 59.5% of the respondents who reported clear objectives also rated the
level of supervision as adequate, on the other hand 40.7% and 39.0% of the respondents
who reported lack of clear objectives also rated the level of supervision as fairly adequate
and inadequate respectively. The researcher construed this to mean that projects with
clear objectives were easy to supervise and therefore was likely to be successfully
implemented as opposed to projects where the stakeholders had no clear objectives.
Further correlation using Pearson Chi-square test resulted to a calculated value of 22.048
which translated to a P-value of 0.0001 which is less than 0.05 level of significance,
hence a strong relationship between the two variables.
Table 4.25 :Cross tabulation level of supervision and clarity of project objectives
Supervision Clear objectives
F yes F No
Adequate 25 59.5% 12 20.3%
Fairly adequate 15 35.7% 24 40.7%
Inadequate 2 4.8% 23 39.0%
Total 42 100% 59 100%
From the findings it is evident that 66.7% of the respondents who said that details in the
scope statement were clear, hence easy to understand and interpret also reported a high
level of coordination conversely the 73.3% of the respondents who reported that also

90
reported low level of supervision implying the project were not properly supervised
hence implementation was likely to go wrong.
The respondents were asked how effective the scope planning was. This was important in
providing the extent of scope planning during the implementation of the projects, 15%
said the planning was very effective, 33% was effective, while remaining 48% said it was
rather poor, 4% of the respondents were not sure.
Hypothesis two
The study sought to establish the relationship between project scope planning and the
implementation of ESP projects. This was made possible by the hypothesis that stated
„There is no significant relationship between project scope planning and implementation
of Economic Stimulus Projects.” To do these responses from respondents who said they
had a scope management plan, an output of project scope planning was then cross
tabulated with status of the project as reported by the respondents then Chi-square test
was employed to test for significance. Table provides a chi –square p-value of 0.0001 and
since this is less than the standard of 0.05 level of confidence, the null hypothesis was
rejected and the alternative hypothesis adopted. This shows there was a significant
association between project scope planning and implementation of the Economic
Stimulus Projects.

91
Table 4.26 :Chi-Square Tests on project scope planning and implementation of
ESPs
Value df Asymp. Sig.
(2-sided)
Exact Sig.
(2-sided)
Exact Sig.
(1-sided)
Pearson Chi-Square 13.288a
1 .000
Continuity Correctionb 11.791 1 .001
Likelihood Ratio 13.376 1 .000
Fisher's Exact Test .000 .000
Linear-by-Linear
Association
13.160 1 .000
N of Valid Cases 104
4.6 Project Scope Definition and Economic Stimulus Projects
Project scope definition is the process whereby a project is defined and prepared for
execution. It helps to decide on whether or not to proceed with the project. An incomplete
scope definition in early stages of a project‟s life cycle is a common source of difficulty
in construction project development process. This involves breaking down work into
manageable chunks. In this section, the study sought to assess the extent to which project
scope definition influenced the implementation of Economic Stimulus Projects in public
secondary schools in Kisumu County. Several questions in line with this objective were

92
asked to the respondents. Cross tabulations were then done to determine the level of
significance scope verification had on the implementation of ESPs.
Table 4. 27 :Responses to questions on scope definition
Questions Yes% No% Not
sure %
total
F % F % F % (T)%
Work break down structure used as a
tool during scope definition?
28 27.8 51 50.0 23 22.2 100%
Were project deliverables defined 34 35.4 62 64.6 00 N/A 100%
Detailed scope statement was availed? 44 44 56 56 00 N/A 100%
WBS was updated with changes to
project scope?
39 37.5 64 62.5 N/A 100%
A work break down structure is a tool that is used define the project scope, it manages the
project team‟s work into manageable sections. It visually defines the scope into
manageable chunks that the project team can understand as each level of the break down
provides further definition and detail (PMBOK,2006).The study therefore sought to find
out if the WBS was used as a scope definition tool, from the findings, 27.8% of the
respondents reported that the WBS was used as definition tool, this implied that the
project scope was aligned to the Work Break Down structure implying that there was
little likelihood of certain deliverable not being defined and this according to project
management body of knowledge is best practice.50.0% of the respondents however,
reported that the WBS was not used as a scope definition tool and this presented a
likelihood of inadequate scope definition, 22.2% of the respondents said they were not
sure whether WBS was used as a scope definition tool. 100% states that together all work

93
packages defined in WBS makes up 100% of the projects work. This implies that
anything outside the WBs is not part of the project.
To probe further the study sought to find out whether the project deliverables were
defined, the respondents were asked to sate whether the deliverables were defined, from
the findings the 34(35.4%) respondents said the deliverables were, while 64.6% did not
have project deliverables defined, this implied that most of the projects did not defined
the deliverables , this exposed the project to a likelihood of a scope creep where the scope
of the project would be difficult to control as the deliverables were not defined. Defining
the deliverables enables easier estimation of costs and schedule hence sound scope
management. It also provides a basis for resource allocation and tasks assignments,
defining deliverables enables project implementation to determine skill sets needed to
complete the work as well as the number of people needed to complete the work.
To further determine whether scope was adequately defined the researcher posed a
question to find out whether a detailed scope statement was availed to all the project
stakeholders. The findings revealed that 44% of the respondent said scope statement was
availed while 56.0% denied the fact that scope statement was availed.
Due to ever changing circumstances, the work break down structure is under constant
revision, therefore frequent review of its content will ensure proper scope management
(PMBOK 3rd
edition).The researcher sought to know whether the work break down
structure was consistently updated whenever changes were enacted in the projects, 37.5%
of the respondents said that there were consistent updates, 62.5% said there were no such
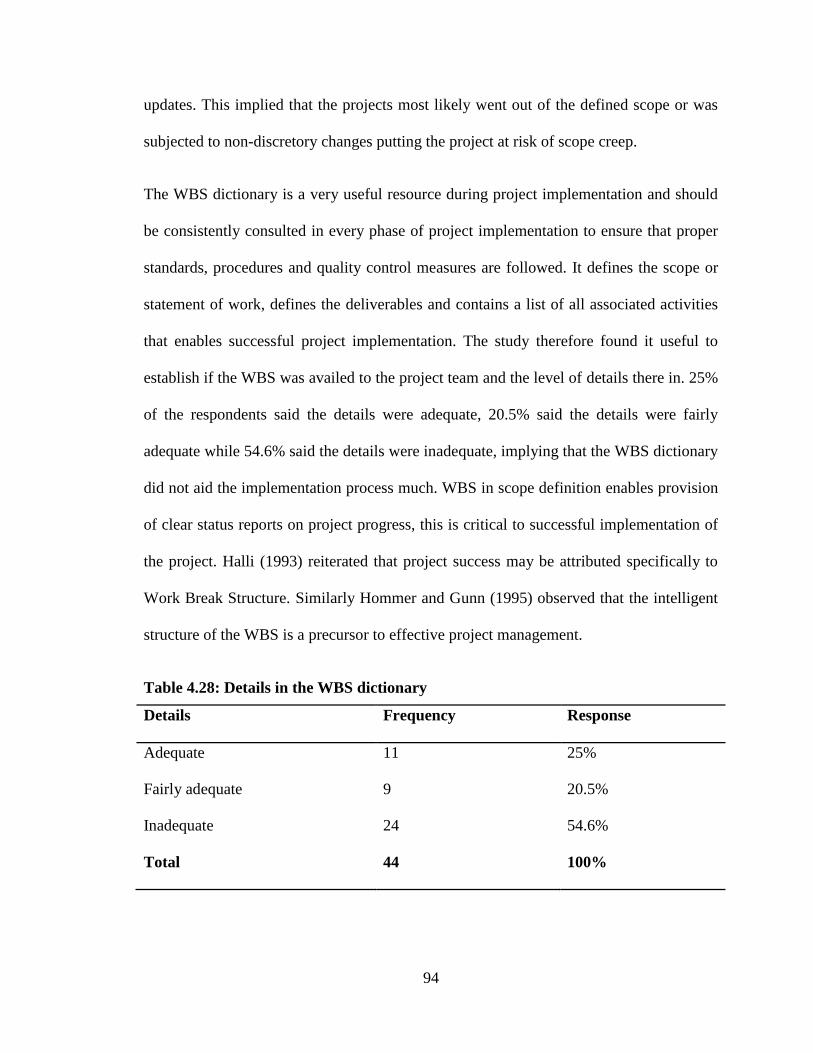
94
updates. This implied that the projects most likely went out of the defined scope or was
subjected to non-discretory changes putting the project at risk of scope creep.
The WBS dictionary is a very useful resource during project implementation and should
be consistently consulted in every phase of project implementation to ensure that proper
standards, procedures and quality control measures are followed. It defines the scope or
statement of work, defines the deliverables and contains a list of all associated activities
that enables successful project implementation. The study therefore found it useful to
establish if the WBS was availed to the project team and the level of details there in. 25%
of the respondents said the details were adequate, 20.5% said the details were fairly
adequate while 54.6% said the details were inadequate, implying that the WBS dictionary
did not aid the implementation process much. WBS in scope definition enables provision
of clear status reports on project progress, this is critical to successful implementation of
the project. Halli (1993) reiterated that project success may be attributed specifically to
Work Break Structure. Similarly Hommer and Gunn (1995) observed that the intelligent
structure of the WBS is a precursor to effective project management.
Table 4.28: Details in the WBS dictionary
Details Frequency Response
Adequate 11 25%
Fairly adequate 9 20.5%
Inadequate 24 54.6%
Total 44 100%
95
Defining project scope using input from all stakeholders is a vital task that needs to be
adequately carried out at the early stage. The purpose of project definition is to provide
adequate information that is needed to identify the work to be performed in order to avoid
major changes that may negatively affect project performance (Gibson et al., 2006).The
study therefore sought to find out if the scope of the project was adequately defined, the
respondents were asked to rate the level of adequacy of the project scope definition,
adequate, fairly adequate and inadequate, out of 106 respondents , 20.0% reported that
the scope was adequately defined, 20.45% of the respondents felt that the scope was
fairly defined while majority of the respondents,54.55% felt that the scope was not
adequately defined. Rory(2008) observed that a poorly or inadequately defined scope is
self limiting to project success, this is supported by Kezner (2013) observed that poor
scope definition may lead to completion of projects with up to 50% cost overruns.
To explore further the study sought to find the relationship between scope definition and
cost control, to do this the researcher considered 106 responses that rated degree of cost
control as very good, good, average, poor, and very poor respectively then cross tabulated
with responses on adequacy of scope definition findings revealed that 100% of the
respondents who reported degree of project cost control as very good also reported the
level of project scope definition as adequate. Similarly the respondents who rated the
level of cost control as good, 37.5% and 31.2% also rated scope definition as adequate
and fairly adequate respectively. On the other hand 68.9% and 71.4% of the respondents
who reported cost control as poor and very poor respectively also rated the scope
definition as inadequate. Correlation analysis using Spearman‟s rho at a significance level
of 0.01(2-tailed) established a significant relationship with a p-value of 0.0001 and

96
correlation coefficient of 0.341.The study therefore confidently concluded that there is a
significant relationship between scope definition and cost control. This echoes findings
by Smith and Tucker (1983) that inadequate or poor scope definition is a significant
problem which impacts on construction projects. Similarly (O‟connor and Vickroy
1986;Merrow and Yarosii 1994) concluded that as a consequence of poor scope
definition final project costs tend to be higher. Kholi (2001) stated that if the basic
parameters of the project are wrong, then time and cost overruns are inbuilt from the
start.
As an output of scope definition process, the study found it important to inquire whether
the project implementation teams were able to develop a detailed project scope statement;
this enabled the study to establish the extent to which scope of the project was defined.
Findings established that 44% of the respondents answered in the affirmative, while 56%
reported there were no detailed scope statements, this implied that there was an
incomplete scope definition by most of the projects and therefore they were likely to
encounter scope management problems impacting on the overall project implementation.
An incomplete scope definition in early stages of project‟s life cycle is a common source
of difficulty in construction project development process (Fageha and Aibinu,2012).
From the findings, 62.8% of the respondents who said they availed a detailed scope
statement which the study interpreted to mean the scope was adequately defined also
reported the status of the projects as complete, conversely 68.9% of the respondents who
said they did not prepare a detailed scope statement also reported the status of their
projects as incomplete implying the scope of the Economic Stimulus Projects were not
matched. Rory (2008) Project success will be self limiting if the scope of work is not

97
adequately defined. Pearson Chi-square value was 10.238 which translated to a p-value of
0.001 at 0.05 confidence level. This established that there was a strong relationship
between scope definition and implementation of projects.
Table 4.29: Detailed scope statement and project status
Scope statement availed Status of the project
Complete Under construction
Yes 28 62.8% 19 31.1%
No 16 37.2% 43 68.9%
Total 44 100% 62 100%
Cross tabulation to ascertain the relationship between scope definition and overall scope
control of the project was done by considering respondents responses on the WBS
dictionary and scope control.WBS dictionary is an indicator of adequate scope definition,
findings revealed that 75% and 80% of the respondents who rated the level of details in
the WBS dictionary as adequate respectively also rated the degree of scope control as
very good and good respectively, conversely, 71.4% and 50% of the respondents who
rated degree of scope control as poor and very poor respectively also rated the level of
detail in the WBS as inadequate. Pearson Chi-square test value of 21.976 which
translated to a p-value of 0.005 at 0.05 confidence level. This further revealed a very
significant relationship between scope definition and scope control. Gibson Jr. et al
maintained that a thoroughly worked scope definition can significantly enhance the
predictability of project outcome, improve user satisfaction and provide cost and schedule
savings.

98
Table 4. 30 :WBS dictionary and Scope control
Level Degree of scope control
Very good Good Average Poor Very poor
Adequate 10 75% 18 80% 10 40% 0 0.00% 0 0.0%
Fairly adequate 2 12.5% 5 20% 6 20% 10 28.6% 4 50.0%
Inadequate 2 12.5% 0 0.00% 10 40% 25 71.4% 4 50.0%
Total 14 100% 23 100% 26 100% 35 100% 8 100%
Further cross tabulation was done to ascertain whether there is influence of using WBS as
a scope definition tool on the coordination of project, this took to consideration 101
respondents who responded to the question. Findings revealed that 90% of the
respondents who used Work Break Down Structure as a tool to define the project scope
also reported having faced no challenges pertaining to project coordination, this is in line
with Project Body Of Knowledge (PMBOK, 2006) best practice of scope definition. On
the other hand 67.2% of the respondents who did not use WBS as tool during scope
definition also reported coordination challenges during project implementation. To meet
objectives project will require effective planning and control through application of
project management systems (Muchungu 2012).The calculated Pearson chi-square value
was 20.047 which translated to a p-value of 0.0001(2-sided), at a significance level of
0.05, this relationship was considered to be very significant by the study.

99
Table 4.31: Coordination challenges and WBS as tool
Challenges WBS as tool for scope definition
Yes No Not sure
yes 3 10% 32 67.2% 10 54.2%
No 31 90% 16 32.8% 9 45.8%
Total 34 100% 48 100% 19 100%
PMBOK 4th
edition recommends definition of project deliverables ,it helps the project
implementation team to have a complete basis of task identification, sequencing,
estimating and developing a proper project schedule, it helps the project avoid scope
escalations, the study sought to determine relationship between deliverable definition and
delivering the project on budget, findings revealed that 55.3% of the respondents who
said they delivered project on the predefined ESP budget also reported that they had their
project deliverables defined. Contrarily 73.2% who reported that they did not complete
their project on budget also said projects deliverables were not defined. The Pearson chi-
square p-value was 0.003 which is less than 0.05 significant level, the study considered
this a significant relationship since it is less than 0.05 acceptable research standard.
Table 4.32: Scope definition and project completion on budget
Deliverables defined Project completed on predefined budget
Yes No
Yes 21 55.3% 17 26.8%
No 18 44.7% 46 73.2%
Total 39 100% 63 100%

100
Hypothesis three
The study sought to establish the relationship between project scope definition and the
implementation of ESP projects. This was made possible by the hypothesis that stated
„There is no significant relationship between project scope definition and implementation
of Economic Stimulus Projects.” Ratings of the level of scope definition among the
respondents were cross tabulated with the status of the projects as reported by the
respondents. Chi-square test was employed to test for significance, a value of 12.154
which translated to a chi –square p-value of 0.002 was obtained, since this is less than the
standard of 0.05 level of confidence, the null hypothesis was rejected. This shows there is
a significant association between project scope definition and implementation.
Additionally, a correlation analysis using Spearman‟s rho at a significance level of
0.01(2-tailed) established a significant relationship with a p-value of 0.0001 and
correlation coefficient of 0.340.The study therefore confidently concluded that there is a
significant relationship between scope definition and implementation of the Economic
Stimulus Projects.
Table 4.33 Chi-Square Tests for relationship between scope definition and
implementation of ESPs.
Value df Asymp. Sig. (2-
sided)
Pearson Chi-Square 12.514a 2 .002
Likelihood Ratio 12.601 2 .002
Linear-by-Linear Association 12.383 1 .000
N of Valid Cases 106
101
4.7 Project scope verification and Economic Stimulus Projects
In this section, the study sought to examine how scope verification influenced the
implementation of Economic Stimulus Projects in public secondary schools in Kisumu
County. Several questions in line with this objective were asked to the respondents. Cross
tabulations were then done to determine the level of significance scope verification had
on the implementation of ESPs
4.7.1 Accepted deliverables
Verifying project scope includes reviewing the deliverables to ensure that each is
completed satisfactorily. Even if the project is terminated early, the project verification
process should establish and document the level and extent of completion. Inspection or
auditing is one of the tools used within this process of scope verification and involves
detailed review of the scope to be compared with the actual deliverable. The study
established that 6.8% and 19.4% of the respondents strongly agreed and agreed
respectively that inspection was employed throughout the project cycle, 15.5% were
undecided while 31.1% and 27.2% disagreed and strongly disagreed respectively. The
study therefore established that majority of the respondents disagreed with the fact that
inspection were done during the implementation of the projects. Le-Hoai,Lee and Lee
(2008) using factor analysis to determine causes of delay and cost overruns in Vietnam
large construction projects obtained poor supervision and inspection as among 5 main
factors out of a list of 21 as problems of project implementation.
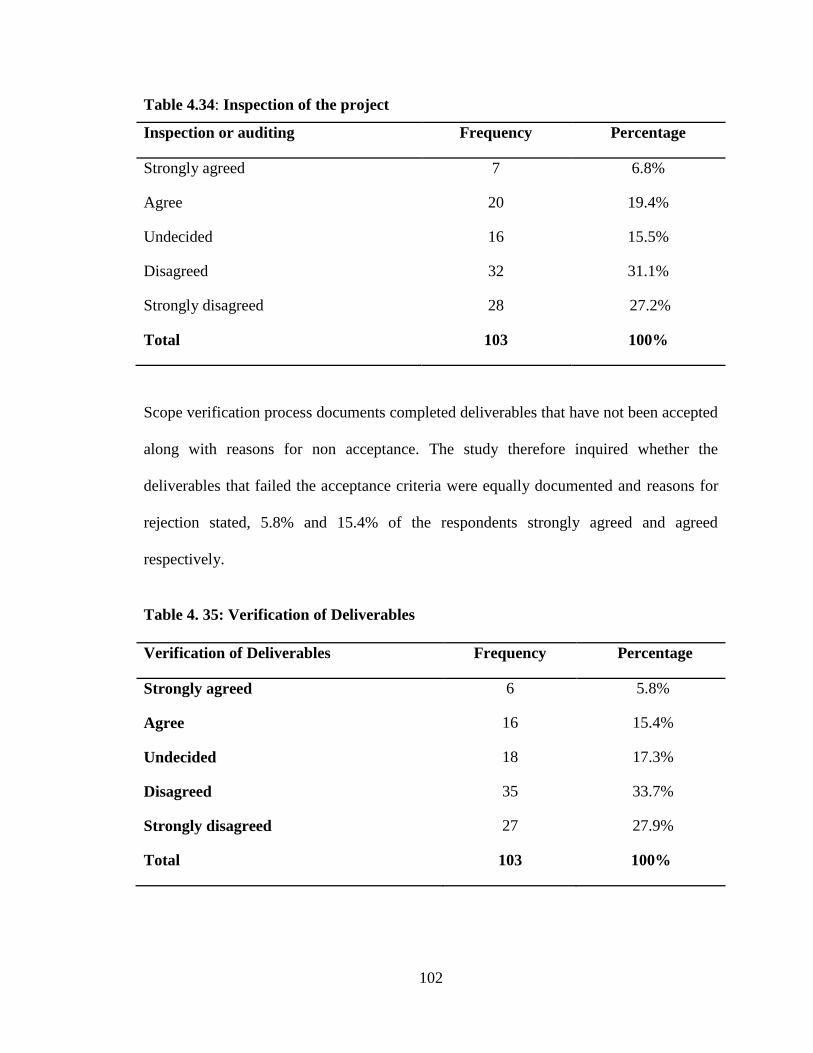
102
Table 4.34: Inspection of the project
Inspection or auditing Frequency Percentage
Strongly agreed 7 6.8%
Agree 20 19.4%
Undecided 16 15.5%
Disagreed 32 31.1%
Strongly disagreed 28 27.2%
Total 103 100%
Scope verification process documents completed deliverables that have not been accepted
along with reasons for non acceptance. The study therefore inquired whether the
deliverables that failed the acceptance criteria were equally documented and reasons for
rejection stated, 5.8% and 15.4% of the respondents strongly agreed and agreed
respectively.
Table 4. 35: Verification of Deliverables
Verification of Deliverables Frequency Percentage
Strongly agreed 6 5.8%
Agree 16 15.4%
Undecided 18 17.3%
Disagreed 35 33.7%
Strongly disagreed 27 27.9%
Total 103 100%

103
The research further sought to know if major deliverables were identified by the project
implementation team, the findings revealed that 43(40.6%) of the respondents said that
the project deliverables were identified while 63(59.4%) said the deliverables were not
identifies. This is a clear indication that the process was casual among most project
members and most likely the verification process was not taken seriously.
Table 4.36: Major Deliverables
Response Frequency %
Yes 43 40.6%
No 63 59.4%
Total 106 100%
To find more the researcher sought to find out whether the deliverables were verified
before formal acceptance, 34% said the deliverables were verified, while 66% said the
deliverables were not verified, most of the respondents attributed this to stalled or
incomplete projects implying there was no formal acceptance for most of the projects
Table 4.37 :Deliverables verified before acceptance
Response Frequency %
Yes 35 34%
No 68 66%
Total 103 100%

104
The study also sought to find out whether there were deliverables that were rejected
during the verification process, the respondents were further asked to state reason behind
rejection.61.3% of the respondents reported that at some point they had to reject the
deliverables, main reason given was that they did not meet the agreed quality
specification .
The study further sought to determine the relationship between verification of the
deliverables and project status, out of 35 respondents who said they verified deliverables
before formal acceptance, 66.7% reported their projects as complete. This can be
attributed to verification where by deviations were rectified before formal hand over
hence completeness. On the other hand out of 68 respondents who did not verify, 65.1%
reported the project status as still under construction implying that the projects were
never completed under the Economic Stimulus programme for the projects.
Table 4.38: Deliverables were verified and status of the project Cross tabulation
Verified Project status
Frequency Completed Frequency Under construction
yes 23 66.7% 24 34.9%
no 12 33.3% 44 65.1%
Total 35 100% 68 100%

105
4.7.2 Requested Changes
Since this process is all about verify and the scope of the actual deliverables against what
was originally planned, then change requests are a normal result resulting from any such
inspection, as change requests will often result from such inspection. The study sought to
verify if there were changes requests as result of scope verification 6.8% and 20.4% of
the respondents strongly agreed and agreed respectively that there were change requests
after verification and this implied that the scope verification was done well, 15.5% of the
respondents were undecided, while 32(31.1%) both disagreed and strongly disagreed
respectively.
Table 4.39: Requested changes
Verification of Deliverables Frequency Percentage
Strongly agreed 7 6.6
Agree 21 19.9
Undecided 16 15.1
Disagreed 32 30.2
Strongly disagreed 32 30.2
Total 106 100%
The study further sought to find the views of the respondents on the changes that were
recommended as part of the corrective actions during the scope verification process.
From the findings most respondents felt that recommended corrective actions were
subjective,(60)57% of the respondents felt that recommended corrective actions were
subjective , implying that corrections made to the project scope were unilateral as

106
opposed to the required consultative approach before any aspect of the project is
implemented.(28)26% of the respondents felt it was objective implying the
implementation was appropriate and acceptable to all the project implementation
team.(18)17% of the respondents were not sure whether the recommended corrective
actions were subjective or objective.
Table 4.40: Recommended corrective actions
Verification of Deliverables Frequency percentage
Objective 28 26
Subjective 60 57
Undecided 18 17
Total 106 100
Project performance measurements are used to assess the magnitude of variation. This is
an important aspect of project control, variations detected relative to the project scope
baseline helps in deciding whether corrective action is required. The researcher therefore
sought to know whether work results were consistently compared against the project plan
to check for completeness and against quality control measures to check correctness.
From the findings out of 103, 34.3% of the respondents said yes while 65.7% said no, this
implied that most of the implementation team did not follow correct procedure to correct
the deviations that might have been inherent in the project.
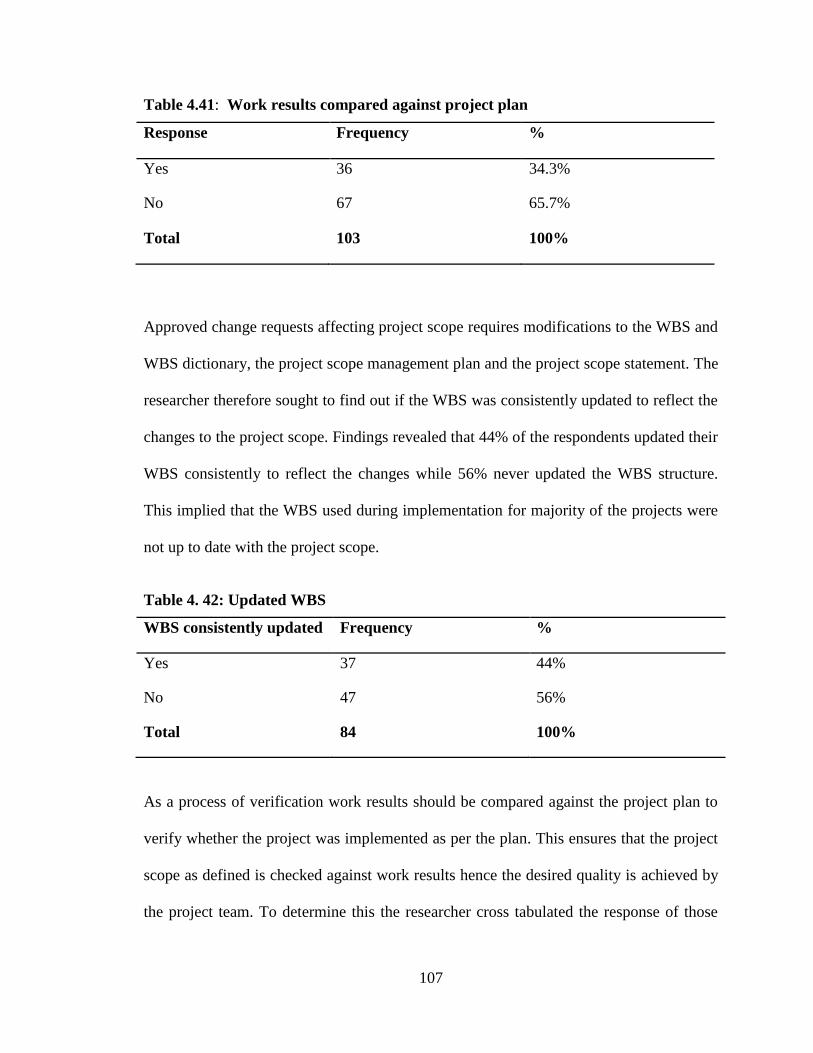
107
Table 4.41: Work results compared against project plan
Response Frequency %
Yes 36 34.3%
No 67 65.7%
Total 103 100%
Approved change requests affecting project scope requires modifications to the WBS and
WBS dictionary, the project scope management plan and the project scope statement. The
researcher therefore sought to find out if the WBS was consistently updated to reflect the
changes to the project scope. Findings revealed that 44% of the respondents updated their
WBS consistently to reflect the changes while 56% never updated the WBS structure.
This implied that the WBS used during implementation for majority of the projects were
not up to date with the project scope.
Table 4. 42: Updated WBS
WBS consistently updated Frequency %
Yes 37 44%
No 47 56%
Total 84 100%
As a process of verification work results should be compared against the project plan to
verify whether the project was implemented as per the plan. This ensures that the project
scope as defined is checked against work results hence the desired quality is achieved by
the project team. To determine this the researcher cross tabulated the response of those

108
who answered the question as to whether they consistently compared the work results
against project plan and whether this resulted to better quality control during the project
implementation (see table 4.43) 57.9%, 50.0%, 31.2% and 25% of those who responded
in affirmative reported degree of quality control as very good, good, average and poor
respectively. This showed that there is a significant relationship between consistent
comparison of results against the project plan and ensuring quality during project
implementation.
Table 4.43: Cross tabulation Work result comparison against project plan and
degree of quality control
Degree of quality control
Results compared
against plan
freq V.good freq good freq average freq poor
Yes 9 57.9% 13 50.0% 12 31.2% 6 25.0%
No 7 42.1% 13 50.0% 27 68.8% 17 75.0%
Total 16 100% 26 100% 39 100% 23 100%
The calculated Pearson Chi-square test value was 8.241 which translated to a p-value of
0.41 which is less than 0.05 level of significance revealed a strong relationship between
the two variables. The Spearman's rho Correlation Coefficient was 0. 273**
Sig. 0.005 at
a significance level of 0.01(2-tailed).

109
Table 4.44: Chi-Square tests
Value
df
Asymp. Sig. (2-
sided)
Pearson Chi-Square 8.241a 3 .041
Likelihood Ratio 8.498 3 .037
Linear-by-Linear Association 7.997 1 .005
N of Valid Cases 105
To establish the relationship between revision of results and deliverables against the
defined scope and scope control. The researcher cross tabulated responses from the
respondents who responded to the question as to whether they revised the deliverables
against the defined scope and the degree of scope control as repoted. Findings (see table
4.18) established that, 71.4%, and 61.9% of the respondents who reported the degree of
scope control as very good and good respectively also reported having revised the results
and deliverables against the defined project scope. On the other hand, 71.4% and 87.5%
of the respondents who reported the degree of scope control as poor and very poor
respectively also reported that they did not revise results and deliverables against the
defined scope. Chi-square test of significance resulted to a calculated value of 13.641
which translated to a p-value of 0.009, this against the research standard p-value of not
more than 0.05, the study established a strong relationship between revision of project
deliverables and result and project scope control.

110
Table 4.45: Revision of results and deliverables against scope definition and Degree
of scope control
Work results
revised against
defined scope.
Degree of scope control
F Very
good
F Good F Average F Poor F Very
poor
Yes 10 71.4% 13 61.9% 12 46.2% 10 28.6% 1 12.5%
No 4 28.6% 8 38.1% 14 53.8% 25 71.4% 7 87.5%
Total 14 100% 21 100% 26 100% 35 100% 8 100%
Hypothesis four
The study sought to establish the relationship between project scope verification and the
implementation of ESP projects. This was made possible by the hypothesis that stated
„There is no significant relationship between project scope verification and
implementation of Economic Stimulus Projects.’ To do these responses from respondents
who said they had skills and knowledge of scope verification then cross tabulated with
status of the project as reported by the respondents then Chi-square test was employed to
test for significance. Table 4.45 provides a chi –square p-value of 0.032 and since this is
less than the standard of 0.05 level of confidence, the null hypothesis was rejected and
alternative hypothesis adopted. This shows there is a significant association between
project scope verification and implementation of Economic Stimulus Project.

111
Table 4.46 :Chi-Square Test for project scope verification and implementation of
ESPs
Value df Asymp.
Sig. (2-
sided)
Exact Sig.
(2-sided)
Exact Sig.
(1-sided)
Pearson Chi-Square 4.615a 1 .032
Continuity
Correctionb
3.774 1 .052
Likelihood Ratio 4.598 1 .032
Fisher's Exact Test .040 .026
Linear-by-Linear
Association
4.572 1 .033
4.8 Project Change Control and Economic Stimulus Projects
In this section, the study sought to establish the extent to which project scope change
control influenced the implementation of Economic Stimulus Projects in public
secondary schools in Kisumu County. Questions in line with this objective were asked to
the respondents. Cross tabulations were then done to determine the level of significance
scope verification had on the implementation of ESPs.
4.8.1 Scope changes
Proper and well structured administration is critical to manage project change orders.
Change control system defines how project deliverables and documentation are
controlled, changed and approved. Changes to project scope are best managed through
this system to protect the project from unwarranted changes that could impact on
implementation. Implementation of changes during the implementation phase of the

112
project takes time and diverts resources from the work efforts. Ability of the project to
monitor and manage change is improved with an established change control system. The
researcher sought to determine from the respondents by posing the question whether there
was a change control system, from the responses 33(31.4%) of the respondents said there
was a change control system, 57(54.3%) said there was no change control system, while
15(14.3%) were not sure whether there was a change control system or not, this was
mainly attributed to turn over. From the statistics it is evident that most of the projects
were implemented without change control system, the research therefore inferred that
most of the changes were informal without adequate change procedure and were
therefore out of control. Change orders have been found to be a major factor affecting
adherence to cost estimates (Jahren &Ashe 2009). Chan et al(2007) proposed a system to
control and evaluate project changes.
Table4. 47: Change control system
Response Frequency %
Yes 33 31.4
No 57 54.3
Not sure 15 14.3
Total 105 100%
To find out more the researcher sought to find out the respondents view on the scope
changes during the project implementation. They were therefore asked to state whether
they felt the changes were subjective or objective from the findings 41(38.7%) of the
respondents felt that the changes were objective while majority 65(61.3%) felt that the
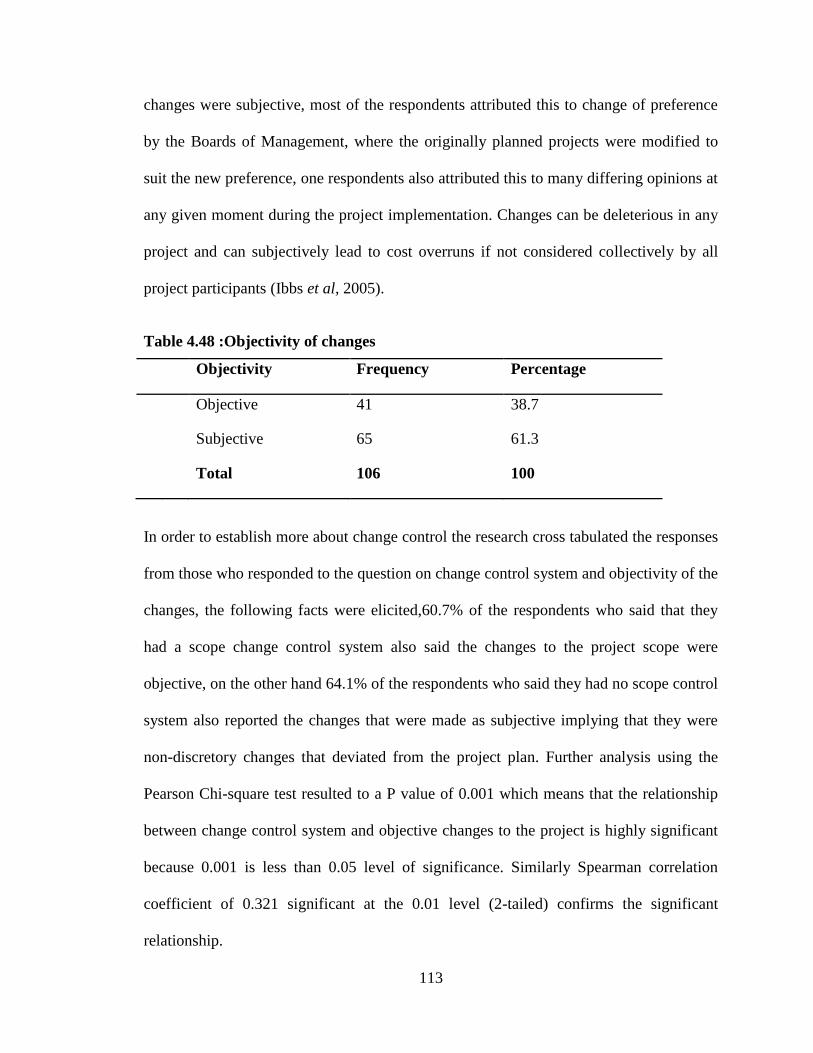
113
changes were subjective, most of the respondents attributed this to change of preference
by the Boards of Management, where the originally planned projects were modified to
suit the new preference, one respondents also attributed this to many differing opinions at
any given moment during the project implementation. Changes can be deleterious in any
project and can subjectively lead to cost overruns if not considered collectively by all
project participants (Ibbs et al, 2005).
Table 4.48 :Objectivity of changes
Objectivity Frequency Percentage
Objective 41 38.7
Subjective 65 61.3
Total 106 100
In order to establish more about change control the research cross tabulated the responses
from those who responded to the question on change control system and objectivity of the
changes, the following facts were elicited,60.7% of the respondents who said that they
had a scope change control system also said the changes to the project scope were
objective, on the other hand 64.1% of the respondents who said they had no scope control
system also reported the changes that were made as subjective implying that they were
non-discretory changes that deviated from the project plan. Further analysis using the
Pearson Chi-square test resulted to a P value of 0.001 which means that the relationship
between change control system and objective changes to the project is highly significant
because 0.001 is less than 0.05 level of significance. Similarly Spearman correlation
coefficient of 0.321 significant at the 0.01 level (2-tailed) confirms the significant
relationship.

114
Frequent change orders to a project are unacceptable and indicate poor planning or poor
scheduling skills during implementation. The researcher further sought to find out the
frequency of changes during implementation. From the findings 48(45.3%) of the
respondents said that changes very frequent, 29(27.4%) said the changes were frequent,
while another 27.4% said that the changes were not frequent. When probed further one
respondents attributed this to inflation, that by the time project funds were released the
prices of materials required for the project had skyrocketed, given that this was after a
time of instability in the country Where part of the money was misappropriated and
therefore the implementation team had to adjust to reality of a limited budget. Hamas et
al (2004) showed that the most common reason for change orders are addition, design
change and design errors.
Table 4.49: Frequency of Changes
Changes Response
Frequency Percentage
Very frequent 48 45.3
Frequent 29 27.4
Not frequently 29 27.4
Total 106 100%
To gain more insight the researcher sought to find out if the projects experienced scope
creep during the implementation, 52.8% of the respondents said there was scope creep,
34.0% of the respondents said there was no scope creep while 13.2% were not sure. From
the findings it is evident that most of the projects experienced scope creep which can be
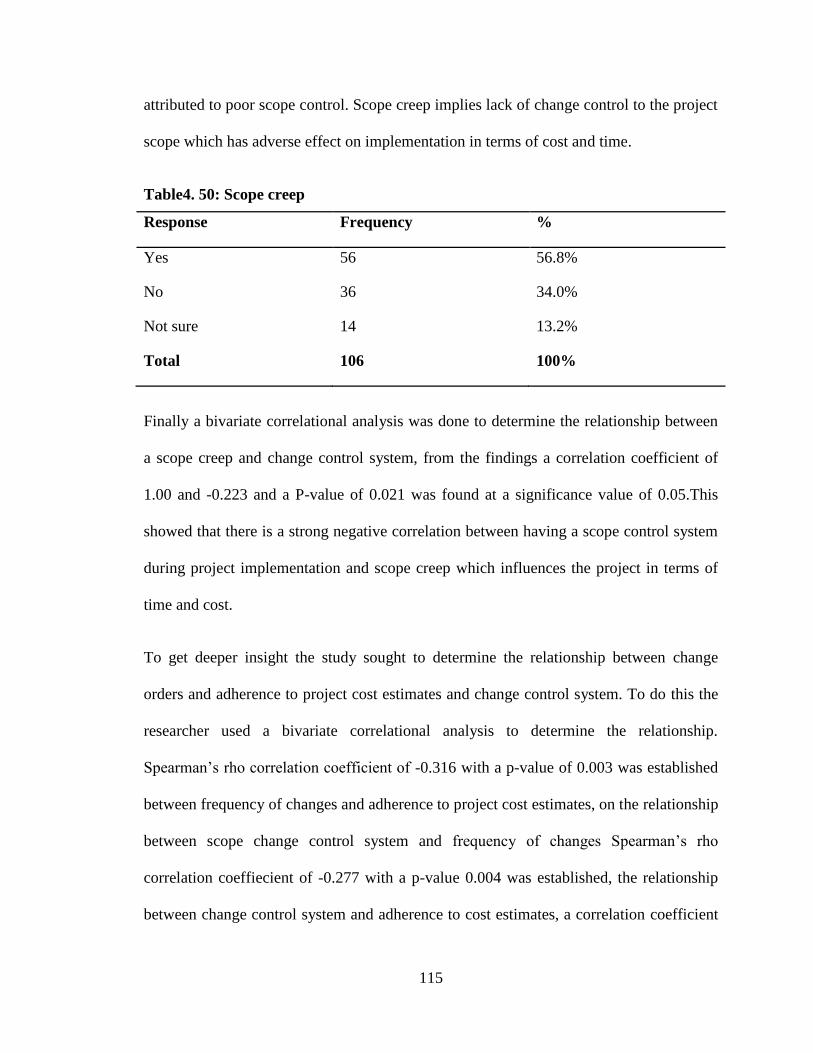
115
attributed to poor scope control. Scope creep implies lack of change control to the project
scope which has adverse effect on implementation in terms of cost and time.
Table4. 50: Scope creep
Response Frequency %
Yes 56 56.8%
No 36 34.0%
Not sure 14 13.2%
Total 106 100%
Finally a bivariate correlational analysis was done to determine the relationship between
a scope creep and change control system, from the findings a correlation coefficient of
1.00 and -0.223 and a P-value of 0.021 was found at a significance value of 0.05.This
showed that there is a strong negative correlation between having a scope control system
during project implementation and scope creep which influences the project in terms of
time and cost.
To get deeper insight the study sought to determine the relationship between change
orders and adherence to project cost estimates and change control system. To do this the
researcher used a bivariate correlational analysis to determine the relationship.
Spearman‟s rho correlation coefficient of -0.316 with a p-value of 0.003 was established
between frequency of changes and adherence to project cost estimates, on the relationship
between scope change control system and frequency of changes Spearman‟s rho
correlation coeffiecient of -0.277 with a p-value 0.004 was established, the relationship
between change control system and adherence to cost estimates, a correlation coefficient

116
of 0.550 with a p-value of 0.0001 was determined (all the correlations were significant at
the 0.01 level 2-tailed.) The study determined a strong correlation between change
control system, frequency of changes and adherence to project cost estimates, the fact
that all the p-values were below the research standard of 0.05 lent credence to this
conclusion. Research in construction project in developing countries indicate that by the
time construction project is completed change order variation result in an 8.3% cost
overrun(Al-Momani,2006).Change orders typically average between 2-5% of
construction costs,but easily soar to more than 10% depending upon the degree of
change(Olawale & Sun,2010).
4.8.2 Corrective actions
Corrective actions are activities that will make an effort to bring the project back in
alignment with the project plan. This involves influencing factors that create scope
changes and controlling impact of those changes on the implementation of projects. This
helps the project management team to avoid scope creep .Deviations when detected early
costs less to correct as compared to later in the project cycle the study sought to find out
how quick deviations to project scope were detected, 36.8% of the respondents said that
deviations from the project scope were detected after occurrence,29.2% said that they
detected deviations shortly occurrence,18.9% said that deviations were detected before
they could occur and 15.1% said they never detected deviations from the project scope.
Kog and Loh(2012), observed that late changes that occur during implementation cause
serious disruption to the project. Hanna et al (2004) recommended that the time between
the initiation of the change order and its approval should be kept as short as possible
because the productivity loss is more likely to be minimized. The Construction Industry

117
Institute change management research team concluded that projects have declining ability
to recover lost schedule and cost in later in later stages of construction (CII, 2000).
Table 4.51: Detection Of Project Deviation
Detection Frequency Percentage
After occurrence 39 36.8
Shortly after they occur 31 29.2
Before they occur 20 18.9
Deviations were never
established
16 15.1
Total 106 100
When deviation from the project scope is detected the most important thing to do is to
initiate a course for correction in order to minimize the impact on the project
implementation process. The research therefore sought to find how often corrective
action was taken on the project scope. From the findings the research was able to
establish that, 22.6% of the respondents said that corrective action was very often taken,
while 21.7% said that corrective action was often taken, while 55.7% said corrective
action was not often taken. Failure to take corrective actions implied that the
implementation was continued with the deviations even after being detected, reason give
by most respondents attributed this to extra expenses and “waste” associated with
corrective actions.

118
Table 4.52 :Corrective Action
Corrective Action Frequency Percentage
Very often 24 22.6
Often 23 21.7
Not often 59 55.7
Total 106 100
To explore further the researcher sought to know the relationship between corrective
action and timely delivery of projects, to do this a cross tabulation was done between
responses on corrective action and the project status. From the results it evident that
29.5% and 34.1% of the respondent who reported their projects as completed often took
corrective action during the project implementation, contrarily 62.9% of the respondents
who reported that their projects are still under construction also said they did not take
corrective action often during the implementation of the projects.
Table 4.53: Cross tabulation between corrective action and project status
Corrective action Project status
frequency Completed Frequency Under construction
Very often 13 29.5% 11 22.6%
Often 15 34.1% 9 14.5%
Not often 21 36.4% 37 62.9%
Total 49 100 57 100%

119
The significant Spearman‟s rho correlation coefffient value of 0.216 with a p-value of
0.026 at 0.05 significance level (2-tailed) confirmed a positive correlation between
corrective action and projects status.
4.8.3 Lessons Learned
PMI‟s PMBOK guide defines lesson learnt as the learning gained in the process of
performing the project. As an extension of project management, lessons learnt are an
efficient and effective way of transferring valuable project knowledge, the good, the bad
and the ugly. Lessons learnt involve sharing knowledge about elements of specific
project phases that went according to plan, the parts that could be improved on and plans
to address these issues before moving on to the next phase. The researcher therefore
asked the respondents to state whether the lessons learnt were documented as part of
historical information for current and future use, from the findings 40% of the
respondents said this was done, while 60% said there were no documented lessons learnt,
implying they were most likely to repeat mistakes throughout the project cycle. Lessons
learnt is quality improvement oriented and help correct implementation process
efficiency and effectiveness(Schindler,2003).Help deliver successful projects, improve
customer satisfaction (Kotnour) and help participants learn about successful and
unsuccessful practices(Busby, 1999).

120
Table4. 54 :Lessons learnt
Response Frequency %
True 42 40%
False 63 60%
Total 105 100%
The lessons learnt should be updated as an output of scope change control, the project
manager should document reasons why changes were approved, corrective actions taken
and components added or removed from the project scope and the reasoning behind the
decisions. Lesson learnt serves as future historical information and helps guide other
project managers.
Finally the research sought to establish the opinion of the respondents on the
implementation, to do this the researcher asked the respondents to state whether min their
opinion the project scope control was a success, 42.5% said they thought the scope
control was a success, while 57.5% said the scope control was not successful.
Table 4.55: Project scope control
Response Frequency %
Yes 45 42.5%
No 61 57.5%
Total 106 100%
To determine the significance of lesson learnt on project the two responses above were
cross tabulated. The findings reveal a significant relationship, 67.9% of the respondents

121
who documented the lesson learnt and used during the implementation reported success
in scope control, implying the project was successfully implemented; on the other hand
73.5% of the respondents who did not document the lessons learnt and never used
reported failure of scope control implying they experienced scoping problems.
Table 4.56 :Cross tabulation between lessons learnt and project scope control
Lesson learnt Opinion on project scope control
Frequency Success Frequency Failure
True 38 67.9% 13 26.5%
False 18 32.1% 36 73.5%
Total 56 `100% 49 100%
From the findings it is clear that the projects that took lesson learnt seriously also
reported successful scope control, because most likely they were able to learn from
previous mistakes and therefore were less likely to repeat. Contrarily those who did not
take the implementation as a learning session had poor scope control, this due to the fact
that most likely they kept on repeating mistakes.
Hypothesis five
The study sought to establish the relationship between project changer control and the
implementation of ESP projects. This was made possible by the hypothesis that stated
„There is no significant relationship between project change control and implementation
of Economic Stimulus Projects.” To do this response from respondents who said they had
a change control was then cross tabulated with duration of the project as reported by the

122
respondents then Chi-square test was employed to test for significance. Table provides a
chi –square p-value of 0.0001 and since this is less than the standard of 0.05 level of
confidence, the null hypothesis was rejected and alternative hypothesis adopted. This
shows there was a significant association between project change control and
implementation of Economic Stimulus Projects.
Table 4.57: Chi-Square Tests for scope change control and implementation of ESPs
Value
df
Asymp. Sig. (2-
sided)
Pearson Chi-Square
16.542a
2 .000
Likelihood Ratio 17.258 2 .000
Linear-by-Linear Association 1.166 1 .280
N of Valid Cases 103
4.9 Moderating influence of project skills and knowledge on the relationship
between project scope management and implementation of projects
Success or failure of a project can be attributed to skills and knowledge of the team that is
tasked with the project implementation. In order for project to succeed, application of
relevant skills and knowledge is a necessary condition (PMBOK, 2008). The study
sought to establish the moderating influence of project skills and knowledge on the
relationship between project scope management and implementation of the economic
stimulus projects. To do this the study used cross tabulated responses on dependent and

123
independent variables. Level of correlation and significance of the relationship was
determined using regression analysis.
To establish the moderating influence of skills and knowledge on the relationship
between scope management and implementation of the Economic Stimulus Projects, the
study sought to find whether the respondents who demonstrated skills and knowledge of
scope verification by using the Work Break Down structure as verification tool managed
to implement the projects on time. To this the researcher cross tabulated the responses
was able to determine that (29)76.3% of the respondents who reported having completed
the projects within the six month stipulated period in Economic Stimulus programme also
reported having used WBS as a scope verification tool, on the other hand (55)85.9% who
reported failure to complete the projects within the six month time frame also reported
having not used the WBS as a scope verification tool hence implying knowledge and skill
gap. A simple linear regression analysis was carried to ascertain the extent to which skills
and knowledge demonstrated through ability to use WBS as a scope verification tool
predicted implementation of duration of the project. A positive correlation was
established between skills and knowledge and implementation, a correlation of 0.623
which indicates a high degree of correlation was established. A p<0.00001 which is less
than 0.05 indicated a significant relationship.
The study sought to establish skills and knowledge of scope change control and scope
creep. The researcher therefore cross tabulated the responses on scope change control and
scope creep. The findings established that out of 52 respondents who reported scope
creep 76.1% reported that they did not have a change control system. On the other hand

124
49 who reported having no scope creep 69.6% also reported that they had a change
control system.
The study further sought to establish the moderating effect of skills and knowledge of
scope planning on project scope control. Scope management plan was used as the
indicator of skills and knowledge of scope planning, responses as to whether the projects
availed a scope management plan was cross tabulated with how the respondents reported
the degree of scope control. Findings revealed that out of the 15 respondents who
reported the degree of scope control as very good 13(86.7%) also reported that they had a
scope management plan. Similarly out of 22 respondents who reported the degree of
scope control as good 19(86.4%) also reported having developed a scope management
plan, implying they had skills and knowledge of scope management planning. On the
other hand out of the 35 respondents who reported poor scope control 28(80%) reportedly
had no scope management plan which the study attributed to lack of skills and knowledge
of scope planning. Similarly out of the 10 respondents who reported scope control as very
poor 7(70%) reported having no scope management plan.
The study also sought to determine the correlation between skills and knowledge of cost
estimating, monitoring and controlling of project expenditures and degree of cost control
as reported by the respondents.13 out 13 respondents who reported project cost control as
very good also reported having an adequate approach to estimating, monitoring and
controlling project expenditures, this represented 100%.Out of the 31 respondents who
reported the degree of cost control as good 25(80.6%)similarly reported having adequate
approach to estimating, monitoring and controlling of project expenditures. On the other
hand out of 31 respondents who reported degree of cost control as poor 24(77.4%) said

125
they had no adequate approach to estimating ,monitoring and controlling total amount of
expenditures, likewise out of 18 respondents who reported scope control as very poor
12(66.7%) equally reported having no adequate, approach to estimating, monitoring and
controlling project costs. Simple linear regression analysis was used to establish the
correlation,
The researcher sought to establish whether the respondents who reported having
knowledge and skills did better in terms of the status of the projects as they reported. The
findings show that 51(48%) of the respondents said there were skilled and experienced
members of the project team. While (55)52 % of the respondents said there were no
skilled and experienced members with clearly defined roles. To establish the moderating
influence of skills and experience, the researcher decided to compare this response and
how the respondents reported the status of the projects. Cross tabulation was done to
ascertain the relationship between skills and the status of the project, the findings
revealed that out of the 51 respondents who reported having skilled and experienced
project team 30(58.8%) reported that the status of the project as complete. On the other
hand out of the 55 respondents who reported not having skilled and experienced project
team 41(74.5%) also reported the status of the project as still under construction. This is
line with findings of Voestch et al (2004) that there is a significant positive relationship
of management knowledge and skills with performance of construction projects.
The study also established that 31.1% and 33.0% of the respondents reported having very
competent and competent project managers, the study sought to establish the influence of
competence of project manager on the implementation of the projects, the study sought to
find out relationship between delay in projects and competence of the project manager.
126
From the findings out of 30 respondents who reported the project managers as very
competent (16)53.3% reported delays of more than 36 months, similarly 24(75.0%) out
of 32 who reported that the project managers were competent, the study was able to
establish no significant correlation between competence of a project manager and the
delay in projects, this echoed similar findings by Munns and Bjeirmi (1996) it is possible
to achieve successful even when management has failed and vice versa, similarly
Wit(1988) observed that there are many examples of projects which are relatively
successful despite not being completed on time and being over budget like the Fulmar
North sea Oil project and Concorde project.
Out of 62 respondents who reported having no scope management plan about 50.8% cited
lack of knowhow as the reason they could not avail the scope management plan. The
study sought to establish the relationship between scope management plan and scope
control, after cross tabulations the study established that out of the 34 respondents, 25%,
30% and 20 reported degree of scope control as very good, good and average
respectively, on the other hand out of the 62 respondents who reported having not
prepared a scope statement 40.6% and 10.9% respectively reported scope control as poor
and very poor respectively, the study attributed this to lack of know how. The Pearson
chi-square test of correlation p-value of 0.005 was obtained at a degree of freedom of 4,
this demonstrated a strong relationship between skills and knowledge of scope planning
and scope control. Respondents who demonstrated skills and knowledge of scope
planning reported above average scope control.
The study also sought to find out whether those who initiated the project properly were
also able to fair well in project implementation, to do this the research assumed that the

127
projects that developed a charter, proved skills and knowledge of scope initiation and
there by sought to determine the moderating relationship between the demonstrated skills
and knowledge and project implementation. This was done by cross tabulating the project
charter against project coordination, out of 55 respondents who prepared a project
charter, 35(63.6%) rated the level of project coordination highly, on the other hand
36(70.6%) of the 51 respondents who did not prepare a project charter also rated the level
of project coordination as low. Bivariate correlation analysis using Spearman‟s rho
resulted to a correlation coefficient of 0.362 and a p-value of 0.0001 Correlation was
significant at the 0.01 level (1-tailed).This established a significant positive relationship
between project initiation and coordination of the project.
On skills and knowledge of scope verification, respondents who were able to recommend
corrective actions were deemed by the researcher to be skillful and knowledgeable; the
moderating effect was verified on the project implementation. This was done by
establishing the relationship between corrective actions, adherence to quality
specification and stakeholder satisfaction, the findings established a Spearman rho
correlation coefficient of 0.220 at 0.05 level of significance (1 tailed) between adherence
to quality and stakeholder satisfaction, similarly a Spearman rho correlation coefficient of
0.535 at 0.01 level of significance was established between quality adherence and
corrective action. The study interpreted that projects who managed recommend corrective
actions after scope verification not only had quality specifications adhered to but were
also able to achieve customer satisfaction upon implementation of the ESP projects.
On skills and knowledge of scope change control, the respondents who reported having a
change control system were considered by the researcher to have demonstrated adequate

128
skills and knowledge of scope change control, the study therefore sought to establish the
relationship between a change control system, adherence to cost estimates and scope
creep, the study established that out of 36 respondents who said they had a change control
system, 15(41.7%) and 15(41.7%) rated adherence to cost estimates as high and
moderate respectively, this means they were able to achieve satisfactory level cost
estimation during the project implementation. On the other hand out of 38 respondents
who said they had no change control system in place, 28(73.7%) rated adherence to cost
estimate as low. (Kipruto and Muturi , 2014) observed that cost is one of the primary
measure of project success. A positive correlation coefficient 0.342 with a p-value of
0.001 (significant at 0.01 level 1-tailed) using Spearman‟s rho was established. Being less
than 0.05 significance level the study considered this to be a strong positive correlation
between adherence to cost estimates and having a change control system during the
implementation of the projects
To further test the moderating influence of project skills and knowledge on the
relationship between project scope management and implementation of projects, the
researcher did multiple regression analysis on each research variable to determine the
moderating relationship.
A standard multiple regression analysis was conducted to evaluate how status of the
project is predicted by scope initiation. The linear combination of expert judgement,
selection procedure of the project manager, project charter and competence of the project
manager was significantly related to the project status, F(4,101)=49.315 p< .001.The
multiple correlation coefficient was 0.813 indicating that approximately 66% of the

129
variance can be accounted for by the linear combination of expert judgment, selection
procedure of the project manager, project charter and competence of the project manager.
Table 4.58: Model summary regression of influence of skills and knowledge of
project initiation on the project status.
Model R R square Adjusted R
square
Std Error
1 .813a .661 .648 .33005
a. Predictors: (Constant), expert judgment , selection procedure of the project manager,
project charter , competence of the project manage
Table provides the R and R2
values. Regression analysis yields a statistics called
coefficient determination or R2 .The R
2 refers to the amount of variation explained by the
independent variable or variables in the equation. The R values range from -1 to 1.The
absolute value of R indicates the strength, with larger absolute values indicating the
strength of the relationship. The R value is 0.813 which represents the multiple
correlations and therefore, indicates a high degree of correlation. The R value indicates
how much of dependent variable can be explained by the independent variable i.e
Expert judgment, selection procedure of the project management, project charter and
competence of project manager. Adjusted R squared attempts to correct R squared to
more closely to more closely reflect the goodness of fit of the model in the population. In
this case the coefficient determination (R2) is calculated to be 0.661 which means, 66.1
percent of the variations in a given dependent variable can be explained or can be
predicted by the variables in the equation.

130
Table 4.59:The regression coefficient of project initiation on status of the project
Model Unstandardised
coefficients
Standardized
coefficients
B Std
Error
Beta t Sig
.
(Constant ): -.052 .115 .-452 .652
Project charter .437 .090 .394 4.825 .000
Selection procedure
of the project
manager
.139 .068 .154 2.042 .044
Competence of the
project manager
.108 .058 .155 1.862 .065
Expert judgment .284 .102 .256 2.794 .006
a. Dependent Variable: the current status of project.
The table of coefficients provides multiple regression information on each variable. This
provides information necessary to predict relationship between project initiation and
status of the project. The table shows the variables that contribute to the model by
looking at the significance column at a confidence level of 0.05.Acording to the table
most significance predictors are project charter, selection procedure of the project
manager and expert judgment. They all have p<0.05. a significance level below 0.05
shows that there is a significant influence of the independent variable on the depended
variable. A significance level of more than 0.05 shows that there is reduced or minimal
influence of the independent variable on the depended variable. The competence of the
project manager has a significance level above 0.05 .These findings are in corroboration
with earlier research on factors influencing performance of constituency development
funded projects in Kenya, found that project initiation is one of the factors affecting
projects negatively (Muhia ,2011).The findings further corroborates Project Management

131
Body Of Knowledge(PMBOK,2006) findings that 50% of unsuccessful projects fail
during the initiation phase of the projects, 30% fails during the planning phase and 20%
do fail as a result of poor implementation of the projects
A standard multiple regression analysis was conducted to evaluate how scope control is
predicted by scope planning. The linear combination of experience, scope management
plan, expert judgment and experience in scope planning was significantly related to scope
control, F(4,101) =114.246 p<0.001.The multiple correlation coefficient was 0.905
indicating that approximately 90.5% of the variance can be accounted for by the linear
combination of experience, scope management plan, expert judgment and experience in
scope planning.
Table 4.60:Model Summary regression of scope planning on scope control
Model R R square Adjusted R
square
Std Error
1 .905a .819 .812 .51436
Predictors: (Constant), members with experience, Expert judgment, scope management
plan for the project, experience in scope planning
The R value is 0.905 in the regression coefficient table (4.60) represents the multiple
correlations and therefore, indicates a high degree of correlation. The R value indicates
how much of dependent variable can be explained by the independent variable i.e, ,
experience in scope planning, scope management plan and members with experience.
Adjusted R squared attempts to correct R squared to more closely to more closely reflect
the goodness of fit of the model in the population. In this case the R2 is calculated to be
0.819 which means, 81.9 percent of the variations in a given dependent variable can be
explained or can be predicted by the variables in the equation.

132
Table 4.61:Regression coefficient of project scope planning on scope control
Model Unstandardized
coefficients
Standardized
coefficients
t Sig .
B Std.Error Beta
(Constant) .505 .165 3.059 .003
Members
with
experience
.913 .190 .387 4.811 .000
Expert
judgement .097 .053 .113 1.836 .069
Experience
in scope
planning
.807 .178 .341 4.536 .000
Scope
management
plan .151 .061 .171 2.473 .015
a. Dependent Variable: scope control
The table of coefficients provides multiple regression information on each variable. This
provides information necessary to predict relationship between project initiation and
status of the project. The table shows that both constant(scope control) and the variables
contribute to the model by looking at the significance column at a confidence level of
0.05.Acording to the table most significance predictors are; expert judgment, members
with experience, scope management plan and experience in scope planning. They all have
p<0.05. a significance level below 0.05 shows that there is a significant influence of the
independent variable on the depended variable. A significance level of more than 0.05(p>
0.05) shows that there is reduced or minimal influence of the independent variable on the
depended variable. Expert judgment had 0.069 which is more than 0.05.These findings
are in line with earlier research on factors influencing delays in water projects in Kenya,

133
attributed poor scope planning as a factor contributing to cost overruns(Musa,
1999).Similarly Talukhaba (1988) while investigating on time and cost performance
attributed scope planning as a factor influencing implementation of projects.
A standard multiple regression analysis was conducted to evaluate how completion of
project on budget is predicted by scope definition. The linear combination of consistent
updated of WBS, the level of scope definition stakeholder involvement, detailed scope
statement, projects limitations, definition of project deliverables, F(6,93) = 33.569
p<0.001.The multiple correlation coefficient was .827 indicating that approximately
82.7% of the variance can be accounted for by the linear combination of experience,
scope management plan, expert judgment and experience in scope planning.
Table4.62: Model Summary regression of project scope definition on completion of
project on budget
Model R R square Adjusted R
square
Std Error
1 .827a .683 .663 .28580
The R value is 0.827 which represents the multiple correlations and therefore, indicates a
high degree of correlation. The R2 was calculated to be 0.683 which means, 68.3 percent
of the variations in a given dependent variable can be explained or can be predicted by
the variables in the equation.

134
Table 4.63: Regression coefficent of project scope definition on completion of project
on budget
Model Unstandardized
coefficients
Standardized
coefficients
t Sig .
B Std.Error Beta
(Constant) .023 .123 .183 .855
Projects
limitations .312 .071 .318 4.367 .000
Scope
definition .080 .034 .155 2.362 .020
Stakeholder
involvement .079 .044 .118 1.790 .077
Detailed
scope
statement
.433 .070 .441 6.153 .000
deliverables
defined .162 .101 .158 1.601 .113
WBS
updated -.070 .101 -.069 -.690 .492
a. Dependent Variable: the project completed on the government‟s predefined budget
The table of coefficients provides multiple regression information on each variable. This
provides information necessary to predict relationship between project scope definition
and completion of project on government‟s predefined budget. The table shows the
variables that contribute to the model, looking at the significance column at a confidence
level of 0.05.Acording to the table most significance predictors are; project limitations,
scope definition and detailed scope statement. They all have p<0.05. a significance level
below 0.05 shows that there is a significant influence of the independent variable on the
depended variable. Stakeholder involvement ,definition of deliverables and updating of
WBS had reduced level significance as they were less than 0.05.Kholi (2001), concluded
that lack of expertise or experience leads to wrong project scope definition and

135
consequently wrong works definition. He goes further to elaborate that if the basic
parameters of the project are wrong g, time and cost overruns are inbuilt. Likewise
Gibson(2006) linked poor project scope definition to project failure.
A standard multiple regression analysis was conducted to evaluate how stakeholder
satisfaction is predicted by project scope verification. The linear combination of quality
control measures, recommended corrective action WBS as a verification tool, revision of
results and deliverables against the defined scope ,was significantly related to stakeholder
satisfaction, F(4,101) = 108.757 p<0.001.The multiple correlation coefficient was .901
indicating that approximately 90.1% of the variance can be accounted for by the linear
combination of quality control measures, recommended corrective action ,WBS as a
verification tool, revision of results and deliverables against scope definition.
Table 4.64: Model Summary regression of project scope verification on stakeholder
satisfaction
Model R R square Adjusted R
square
Std Error
1 .901a .812 .804 .22235
a. Predictors: (Constant), quality control measures, recommended corrective action ,
WBS used as a verification tool, results and deliverables were reviewed against
the scope definition
The R value is 0.901 which represented the multiple correlations coefficient indicated a
high degree of correlation. The R value indicates how much of dependent variable can be
explained by the independent variable i.e quality control measures, recommended
corrective action , WBS used as a verification tool, results and deliverables were
reviewed against the scope definition. Adjusted R square attempts to correct R squared to
more closely to more closely reflect the goodness of fit of the model in the population. In

136
this case the R2 is calculated to be 0.812 which means, 81.2 percent of the variations in a
given dependent variable can be explained or can be predicted by the variables in the
equation.
Table 4.65:Regression coefficient of project scope verification on stakeholder
satisfaction
Model Unstandardized
coefficients
Standardized
coefficients
t Sig .
B Std.Error Beta
(Constant) -.028 .096 -.296 .768
Results
reviewed
against the
scope
definition
.682 .094 .678 7.244 .000
Recommended
corrective
actions.
.062 .062 .072 1.007 .316
WBS used as
a verification
tool
.180 .084 .179 2.146 .034
Quality
control
measures
.062 .044 .062 1.422 .158
a. Dependent Variable: Stakeholder satisfaction
The table of coefficients provides multiple regression information on each variable. This
provides information necessary to predict relationship between project scope definition
and completion of project on government‟s predefined budget. The table shows variables
which contribute to the model, looking at the significance column at a confidence level of
0.05.Acording to the table most significance predictors are; revision of results against
defined scope and using Work Break Down Structure as a verification tool.
Recommended corrective action and quality control measures have got a p-value of more

137
than 0.05 hence having reduced significance level. A critical analysis of the causes of
project management failures in Kenya by Abenego Oswald Gwaya, Sylvester Munguti
Masu and Githae Wanyona attributed poor supervision as one of the causes leading to
project failures. Similarly Makulwasawatudom et al while investigating Critical Factors
Influencing construction Productivity in Thailand found incompetent supervisors,
inspection delays and rework to be among the ten critical factors influencing construction
productivity.
A standard multiple regression analysis was conducted to evaluate how project scope
control is predicted by scope change control. The linear combination of detection of
deviations, notification of stakeholders change, revision of changes and scope change
control system was significantly related to scope control, F(6,93) = 33.569 p<0.001.The
multiple correlation coefficient was .663 indicating that approximately 66% of the
variance can be accounted for by the linear combination of experience, scope
management plan, expert judgment and experience in scope planning.
Table 4. 66: Model Summary regression of project change control on scope control
Model R R square Adjusted R
square
Std Error
1 .663a .440 .418 .38272
a. Predictors: (Constant), detection of deviations, notification of stakeholders on
change, revision of changes scope change control system.
Table provides the R and R2
values. Regression analysis yields a statistics called
coefficient determination or R2 .The R
2 refers to the amount of variation explained by the
independent variable or variables in the equation. The R values range from -1 to 1.The

138
absolute value of R indicates the strength, with larger absolute values indicating the
strength of the relationship. The R value is 0.663 which represents the multiple
correlations and therefore, indicates a high degree of correlation. The R value indicates
how much of dependent variable can be explained by the independent variable i.e the
reason for not scope planning, supporting details , experience in scope planning, Expert
judgment ,scope management plan ,members with experience and project management
scope plan. Adjusted R squared attempts to correct R squared to more closely to more
closely reflect the goodness of fit of the model in the population. In this case the R2 is
calculated to be 0.440 which means, 44 percent of the variations in a given dependent
variable can be explained or can be predicted by the variables in the equation.
Table 4.67: Regression coefficient of project change control on scope control
Model Unstandardized
coefficients
Standardized
coefficients
t Sig .
B Std.Error Beta
(Constant) .226 .165 1.372 .173
Revision of
changes .198 .052 .298 3.842 .000
Change
control system
.
.180 .058 .242 3.089 .003
Notification of
scope changes .405 .078 .405 5.198 .000
Speed of
deviation
detection
.007 .035 .015 .200 .842
a. Dependent Variable: Project scope control.
The table of coefficients provides multiple regression information on each variable. This
provides information necessary to predict relationship between project scope change

139
control and scope control. The table shows variables which contribute to the model by
looking at the significance column at a confidence level of 0.05.Acording to the table
most significance predictors are; revision of changes, change control system and
notification of scope changes whose p-values are less than 0.05. Speed of detection of
deviation has got a reduced significance since it has a p-value that is more than
0.05.These findings are in corroboration with earlier research on quantitative effects of
construction changes on labor productivity which concluded that changes have a negative
impact on productivity, affect project duration and costs (Thomas and Napolitan ,1995).
In conclusion from the correlation and regression analysis the study established that there
is moderating influence of project skills and knowledge on the relationship between
project scope management and implementation of projects.

140
CHAPTER FIVE
SUMMARY OF FINDINGS, CONCLUSION AND RECOMMENDATIONS
5.1 Introduction
This chapter summarizes the major findings, conclusions and recommendations of the
study based on the themes that were discussed in chapter four.
5.2 Summary of findings
From the analysis, interpretation and discussion in chapter four, the study came up with a
number of findings. These findings are discussed below according to their themes.
From the demographic data, it was found out majority of the respondents were aged
between 40-49 years at 41.5%, this was followed by 34.9% who were aged between 30-
39years, those above 50 years were 12.3% and the least represented age group were
falling between 20-29 years at 11.3% .Educationally majority of the respondents had
reasonable educational back ground, 16% had masters, 49.1% had bachelors
degree,26.4% had diploma, cumulatively 91.5% of the respondents were diploma holders
and above only 8.5% had certificate level of education.
On objective one, the study sought to establish how project initiation influences the
implementation of economic stimulus projects. The study established that majority of the
projects were not initiated properly. For instance 52% of the projects did not prepare a
project charter which is a very basic output of project initiation that is very important in
scope planning of the project. Most those who prepared the project charter were able to

141
deliver their projects on time. When it came to selecting the project manager findings
revealed that most of the project managers were not competitively selected, majority of
the few who were competitively selected were able to deliver their projects on time and
on budget. The study through Chi-square test was able to establish that significant
relationship between competence of a project manager and implementation of the project
was 0.001 which is a very significant. Correlations between the project constraints and
scope control were established to be significant and therefore had influence on the
implementation of the projects. Similarly those who had valid assumption during the
implementation were able to deliver the projects on time. Chi –square analysis revealed a
significant relationship between project initiation and implementation of the projects. The
study was therefore able to establish that to a large extent the Initiation process
influenced the implementation of the economic stimulus projects.
On objective two, the study sought to establish the extent to which project scope planning
influence implementation of ESP projects in public secondary schools. The study found
that majority of the respondents did not have experience in scope planning, up to 61.3%,
also that there was little stakeholder participation process and majority (54.1% ) who
participated in the scope planning did not have experience in scope planning. The project
scope statement was not prepared by most of the projects (48.1%) only 20.8% of the
projects had scope statement, the rest were not sure, and this indicates that the level of
scope planning was not standard. Most of the prepared scope statements did not have
clear supporting details meaning they were rudimentarily prepared. Scope management
plan was not prepared by most of the projects an indication that scope was not properly
managed, majority of the respondents attributed this to lack of know how. The study was

142
able to establish a significant relationship between project scope planning and
implementation of the Economic Stimulus projects through a chi square test.
Objective three sought to assess how project scope definition influence implementation
of ESP projects in public secondary schools. From the findings the project was able to
determine that most of the deliverables were not defined and this was bound to impact on
the overall scope definition of the projects. Detailed scope statement was only 44% of
the respondents reported to have had detailed scope statement, while majority 56% did
not have a detailed scope statement implying the overall scope definition was below
standard. There was lack of consistent updating of changes on the Work Break Down
structure to align with the changes that were implemented on the project scope.On the
relationship between project definition and implementation of Economic Stimulus
Projects, a significant relationship was established through a chi –square test‟s P-value of
0.001 implying a very significant relationship at significance level of 95%.The study
therefore satisfied the objective that scope definition influenced the implementation of
Economic Stimulus Projects.
Objective four sought to examine how project scope verification influences influence the
implementation of ESP projects in public secondary schools. The study established that
most of the deliverables were not verified before acceptance, further analysis revealed
that 66.7% of the respondents who verified the deliverable reported the status of projects
as complete, and this ascertained the fact that there is a strong correlation between scope
verification and implementation of the projects. The study also realized that most of the
changes were not formally made through the change control system and this exposed
project to scope creep which negatively impacts on the implementation. Research also

143
established that mostly the recommended actions were subjective and work results were
not consistently verified against the project plan. Further findings revealed that most of
the respondents who revised the results of the deliverables against scope definition had
better scope control.
Objective five that sought to establish the extent to which project change control
influence implementation of ESP projects in public secondary schools. The study
established that most of the project did not have a formalized change control system
during the implementation; many respondents reported that changes were largely
subjective and very frequent. The researcher further established that most of the projects
experienced scope creep which is due to poor change management. Deviations were
mainly detected shortly after they had occurred and corrective action was not often
taken.60% of the respondents said that lesson learnt were not documented making a high
likelihood of mistake repetition during implementations.
Objective six to establish the moderating influence of project skills and knowledge on the
relationship between project scope management and implementation of ESP projects in
public secondary schools. The researcher established most of the respondents who had
skills reported timely delivery of projects. For instance 58.8% of the respondents who
had experience also stated the status of projects as complete while 74.5% of the
respondents who had no skills and experience of scope management reported status of the
project as still under construction. The respondents who demonstrated skills and
knowledge of project initiation by preparing a project charter majority 63.6% rated
project coordination highly meaning they were satisfied with the implementation, on the
other hand majority of the respondents who were not skilled and knowledgeable also

144
reported poor coordination of the project implying the implementation were likely to fail.
Those skills and knowledge of scope control 69.6% reported no scope creep meaning
scope control was good and therefore the projects had high likelihood of successful
implementation.
5.3 Conclusions of the study
From the above findings, the study came up with the following conclusions. On objective
one the study concluded that project initiation influenced the implementation process of
the economic stimulus projects. Basic parameters of project initiation like preparation of
project charter, selection of the project manager and project constraints and assumptions
had influence on the implementation process, for instance 52.8% of the respondents felt
selection process was not fair, similarly a bigger percentage, 61.8% felt project
management techniques were inadequately applied. Factors affect standard initiation of
project need to be addressed.
The second objective that investigated the extent to which project scope planning
influenced implementation of the Economic Stimulus projects, the study concluded there
was significance influence of scope planning and implementation of the economic
stimulus. Proper scope planning is in order to avoid the problem of scope creep during
the implementation.
On the third objective the study concluded that there is a strong association between
project scope definition and the implementation of economic stimulus projects. Projects
whose scopes were properly defined were completed on budget. Similarly projects that
demonstrated skills and knowledge of scope definition by creating a detailed scope
statement reported status as complete.
Objective four, the study concluded that scope verification influenced the implementation
of the economic stimulus projects. Comparing work results against project plan resulted
to a higher level of quality adherence and this positively impacted on the implementation.

145
Objective five, the study concluded that there is a significant association between project
change control and implementation of the Economic Stimulus Projects. Projects that
properly managed changes through a change control system reported better status
Finally the study concluded that there is a moderating influence of skills and knowledge
on the relationship between scope management and implementation of economic stimulus
projects in public secondary schools.
5.4 Recommendations of the study
School Boards of Management are tasked with management of infrastructural projects.
The management of these projects is crucial to improving standards and sustaining
education programmes in the country. This calls for development of requisite knowledge
and skills. The researcher therefore made the following recommendations:
i. The funding agency should ensure adequate members of any project team receive
a working level of requisite scope management capacities before implementation
of these projects.
ii. Scope for all projects due for implementation must be adequately defined and the
same approved by all primary stakeholders of any given project.
iii. The government should adequately involve all stakeholders in its projects and
should adequately define the project objectives to stakeholders before
implementation.
iv. The ministry of finance should have its own monitoring capacity of the spending
of money allocated to educational projects.
v. Project scope management must be given a special interest during training of
project stakeholders before implementation of any government projects.

146
vi. There should be a contractors‟ performance assessment/feed back process to
construction projects by independent party on all projects implemented in schools
vii. Project stakeholders should consider continuous coordination and direct
communication to avoid deviations and also provide an opportunity for experts to
review project documents before implementation of projects.
5.4 Contribution to body of knowledge
From the findings and conclusions above, it was said that the study contributed to the
existing body of knowledge.

147
Table 5.1 Study contribution towards knowledge
Objective Contribution to body of knowledge
i) To determine how project
initiation as a project scope
management influence the
implementation of ESP
projects in public secondary
schools.
The study determined that there is a very significant
relationship between project initiation and
implementation of the projects. However skills and
knowledge of project initiation was a major
impediment on the implementation process. The
study recommends effort towards equate initiation
projects.
ii) To establish the extent to
which project scope planning
influence implementation of
ESP projects in public
secondary schools.
The study established that scope planning to a large
extent influence implementation of projects. Most of
the stakeholders did not have skills of project
planning. Majority had no scope Scope management
plan largely due to lack of know how..
iii) To assess how project scope
definition influence
implementation of ESP
projects in public secondary
schools.
The study determined that scope definition
influences project implementation. The key
challenge was poorly defined scope. Adequate
definition of project scope before and during
implementation is strongly advised.
iv) To examine how project
scope verification influences
influence the implementation
of ESP projects in public
secondary schools.
Project scope verification greatly influences the
implementation of projects. There is a strong
correlation between project scope verification and
quality control. There is need to inculcate standard
and adequate scope verification during project
implementation.
v) To establish the extent to
which project change control
influence implementation of
ESP projects in public
secondary schools.
Project change control management to a big extent
influences the implementation. Key challenge is
poor stakeholder management and conflict of
interest and belated changes to project scope. Study
advised adoption of change control system.
vi) To establish moderating
influence of project skills and
knowledge on the relationship
between project scope
management and
implementation of ESPs in
public secondary schools.
The study established that those who had skills and
knowledge of project scope management had better
implementation. The study recommends salient
attention to scope management skills and techniques
during stakeholder training on project management.

148
5.6Suggestions for further study
Despite the findings obtained by the study, there are still some areas which may need
further research to enable better understanding of the problem. While carrying out the
study it was apparent that the following areas need further study:
i. An assessment of project management knowledge base of secondary school
principals and members of board of management.
ii. Factors influencing adherence to project cost estimates of secondary school
projects.
iii. Factors contributing to scope creep in educational projects
iv. Politics as moderating factor on the implementation of government projects in
educational institutions
v. School Board Of Management as a critical success factor on the implementation
of Economic Stimulus School projects.

149
REFERENCES
Angela Thody (1999), Developing school governors, 1987-1997: Change or inertia?
,Belmont,California USA.
Ahmed, S.M., Azhar, S., Castillo, M. and Kappagantula, P. (2002) Construction Delays
in Florida: An Empirical Study, Final Report Submitted to State Florida,
Department of Community Affairs, ([email protected]) (online).
Ardity ,D,Akan,T.,& Gudamar, S. (2005) Cost overruns in public projects. International
Journal of Project Management.
Ardity ,D,Akan,T.,& Gudamar, S. (2009) Adherence to cost estimates in public
projects. International Journal of Project Management.
Assaf, S.A., Al-Khalil, M. and Al-Hazml, M. (1995) „Causes of Delay in Large Building
Construction Projects‟, Journal of Management in Engineering, Vol. 11, No. 2.
Atkinson ,R., Crawford, L., Ward, S.(2006).Fundamentals uncertainties in projects and
the scope of project management. International Journal of Project Management.
Baar, J.E., & Jacobson, S.M. (2004).The Keys to Forecasting Scope, Cost Engineering.
Retrieved January 19, 2006 from University of Phoenix EBSCHO Host database.
Babbie ,E. 2009.The Practice of Social Research.Wadswork Publishing Company
,Belmont,California USA.
Black , K.(2010) Bussiness Statistics: Contemporary Decision Making 6th
edition, John
Wiley & Sons
Burke, R. (2003). Project management: planning and control techniques. Chichester: John
Wiley & Sons.
Bwana (2013) ,Influence of Board of Management Management Capacities on the
Implementation of Economic Stimulus Projects in Kakamega County, Kenya,
Unpublished project.
Chan, D.W.M and Kumaraswamy, M.M. (1997) „A Comparative Study of Causes of
Time Overruns in Hong Kong Construction Projects‟, International
Journal of Project Management Vol. 15, No. 1, pp. 55-63.
Chandra, P. (2002) Projects Planning, Financing, Implementation and Review. (5th
edition) Publisher, Tata McGraw-Hill Publishing Company.

150
Chandra, P. (2009), Projects Planning, Analysis, Selection, Planning, Implementation
and Review. New Delhi: McGraw-Hill
Cleland, D.I., Gareis, R. (Eds) (1994), Global Project Management Handbook. New
Delhi: McGraw-Hill.
Chinese Economic stimulus Plan 2008-2009
Cohen.J, Cohen P, West, S.G & Aiken ,L.S (2003) Apllied multiple
regression/correlation analysis for the behavioral sciences,3rd
Ed.Mahwah, NJ:
Lawrence Erlbaum Associates.
Clark Charles & Millband David, (2003), Building schools for the future. Department for
Education and Skills, DFES Publications
Common Wealth of Australia (2011). “Nation Building – Economic Stimulus Plan”
http://www.economicstimulusplan.gov.au/pages/default.aspx
Commission of the European Union (1993).Growth ,Competitiveness and
Employment.Challenges and Ways Forward Into the 21st century.White paper
(Brussels: Commission of the EU)
Construction Industry Institute.The impact of Changes on Construction Cost and
Schedule.CII Research summary RS43-2,Date TDB.
Detecon Asia-Pacific (2009), Economic stimulus impacts: Technology strategies towards
meaningful broadband in Thailand.
Cuyvers K et al.. (2011). Well-being at school: Does infrastructure matter? Institute for
educational and information science, instructional and educational science,
University of Antwerp.
Decarlo, D. (2004) Extreme Project Management: Using Leadership, Principles, and
Tools to Deliver Value in the Face of Volatility. Sanfrancisco: Jossey- Bass
Dekkers and Forsellus (2007) Increase ICT project success with concrete Project
Management. 4SUM partners. www.4sumpartners.com.
Dinsmore, P. C. & Cabanis-Brewin, J. (Eds.). (2006). The AMA Handbook of Project
Management (2nd ed.). New York: AMACOM. Retrieved April 19, 2008, from
Questia database: [http://www.questia.com/PM.qst?a=o&d=111664430]
Dinsmore, P. C., and Irewin, J. C. (2011). The AMA Handbook of Project Management.
New Yolk: Amacom.
Dvir, D., Raz, T. and Shenhar, A.J. (2003) „An Empirical Analysis of the Relationship
Between Project Planning and Project Success‟, International Journal of Project
Management, 21, pp. 89-95.
Economy Watch (2010). Economic Stimulus.www.economywatch.com

151
Edward Jones (2006). 5.0 Project Scope Management. Retrieved April 19, 2008, from
Ten Step You Can Manage:
[http://www.tensteppb.com/5.0ProjectScopeManagement.htm]
Edward Jones (2007) Learn PMP for Free-5 Project Scope Management.[http://
www.tenstepp.com]
Egger ,A.N & Carpi A. (2008) Data Analysis and Intrepretation. Vision Learning
Vol.Pos-1
Elbeik, S. and Thomas, M. (2008). Project Skills. Great Britain: Butterworth- Heinemann
Elyse Nielsen (2006) Scope planning www. Amazon.com
Frame, J. D. (2003).Managing projects in organizations: how to make the best use of
time, techniques, and people (3rd
Ed.). San Francisco: Jossey-Bass.
Frimpong, Y., Oluwoye, J. and Crawford L. (2003) „Delay and Cost Overruns in
Construction of Groundwater Projects in a Developing Countries; Ghana as a
Case Study‟, International Journal of Project Management, 21, 321-326.
Frödell, M., Josephson,P. E., and Lindahl, G. (2008) "Swedish construction clients' views
on project success and measuring performance", Journal of Engineering, Design
and Technology, Vol. 6 Iss: 1, pp.21 – 32
Gibson, G.E. and Walewski, P. „Risks of International Projects: Reward or Folly‟,
([email protected]) (online).
Gibson, G. E. Jr., Kaczmarowski, J., & Lore, H. Jr. (1995).Pre-project planning process
for capital facilities. Journal of Construction Engineering Management, 121(3),
312–318.
Gibson, G. E. Jr., Wang, Y-R., Cho, C-S., & Pappas, M.P. (2006).What is pre-project
planning anyway? Journal of Management in Engineering, 22(1), 35-42.
Ginnell, R. M. Jr and Unrau, Y. A. (2011) Social Work Research and Evaluation:
Foundations of Evidence Based Research. New York. Oxford University Press
Gitonga B.A (2010) Project Management Simplified, Community Devlopment Projects
Approach.Project Support Information Publication Series.www.psi-
consultants.org.
Government of Kenya. (2009), Economic Stimulus Programme. Kenya.
Government of Kenya. (2011), Economic Stimulus Programme. Kenya.
Government of Kenya. (2012), Economic Stimulus Programme. Kenya.
Gravel, Hungerford and Labonte (2009), Economic Stimulus: Issues and
Policies.Congressional research services.
Gregory, I. (2003), Ethics in Research. Great Britain.MPG Books Ltd

152
Gwaya,O.A,Masu, S.M & Wanyona, G (2014), A critical Analysis of The Causes Of
Project Management Failures in Kenya.Blue Eyes Intelligence Engineering &
Sciences Publication Pvt Ltd.
Hans d‟ Orville. (2009). “The Global Financial Crisis and its Impact for Multilateralism
and UNESCO” http://www.undp.org/index.php/mdgs/goal-1-eradicate-extreme-
poverty.
Hartman, F. (1996), "Risk allocation in lump-sum contracts: concepts of latent disputes",
Journal of Construction Engineering and Management, ASCE, Vol. 122 pp.291-7.
Haugan, G. T. (2002). Project Planning and Scheduling. USA: Management Concepts,
inc.
Hayes, R., Perry, J., Thompson, J. (1986), Risk Management in Engineering
Construction: A Guide to Project Risk Analysis and Risk Management., Thomas
Telford, London.
Heagney, J. (2012). Fundamentals of Project Management. USA: American Management
Association. (4th ed)
Heldman, K. (2011). Project Management Professional Exam Study Guide. Indiana: John
Wiley and Sons inc (6th ed)
Heldman, K. (2004). PMP: Project management professional study guide. (2nd Ed.).
Chapter 1 “What is a project?” pp.1-34. CA: Sybex.
Heldman, W. and Cram, L. (2004). Project Study Guide. USA: Sybex
International Labor Organization. (2010). Brazil‟s response to thecrisis. International
Labor Organization.
International Labor Organization. (2011). Brazil: An innovative income led
strategy. Geneva: ILO.
Ireland, V. (1985) „The Role of Managerial Actions in the Cost, Time and Quality
Performance of High-Rise Commercial Building Projects‟, Construction
Management and Economics, 3, 59-87.
Ireland, V. (1987) „A Comparison of U.S., U.K. and Australia Management Practices
with Special Reference to Lost Time‟, The Building Economist, December, pp. 4-
10.
Isham, J., Kaufman, D. and Pritchett, L. H. (1997). “Civil Liberties, Democracy, and the
Performance of Government Projects.” The World Bank Economic Review, Vol
11, No.2, pp 219-242
153
Jagboro, G.O. and Aibinu A.A. (2002) „The Effects of Construction Delays on Project
Deliver in Nigerian Construction Industry‟, International Journal of Project
Management, 20, 593-599.
Kaming, P.F., Olomolaiye, P.O., Holt, G.D. and Harris, F.C. (1997) „Factors Influencing
Construction Time and Cost Overruns on High-Rise Projects in Indonesia‟,
Construction Management and Economics, 7, 83-94.
Karimi, R.B., “Factors which are Critical in Project Cost Overruns: A Case Study of
Ministry of Water Resources Projects”, Unpublished MBA Thesis, University of
Nairobi, 1998. KPLC (2004), 2003/2004 Annual Report and Account
Jacon Wyans (2008) scope verification and scope control: Integral in Project
Management Retrieved April 19, 2008, from Questia database:
[http://www.questia.com/PM.qst?a=o&d=111661506]
Kendrick (2003) Identifying and Managing Project Risk. United States, American
Management Association.
Kerzner, H. (2009) Project Management: A Systems Approach to Planning, Scheduling,
and Controlling. Canada: John Wiley and Sons
Kerzner, H. (2001). Project management: a systems approach to planning, scheduling,
and controlling (7thed.). John Wiley & Sons, New York.
Kerzner, H (2002), Project management- a systems approach to planning, scheduling and
Controlling 8th edition, New York, John Wiley & sons Inc
Kerzner, H (2013), Project management:A systems approach to planning, scheduling and
Controlling 8th edition, New York, John Wily & Blackwell.
Kilkelly, E. (2011) "Using training and development to recover failing projects", Human
Resource Management International Digest, Vol. 19 Iss: 4,
Kombo, D. K.and Tromp, D. L. A. (2007). Proposal and Thesis Writing-An Introduction.
Kohli U. (2001) “How to Minimize Time and Cost Over-Runs of Projects”, Available at
Http://www.shilpabichitra.com/shilpa2001/v083.htm (Cited 13-August-04).
Kumaraswamy, M.M. and Chan, D.W.M (1998) „Contributors to Construction Delays‟,
Construction Management and Economist, 16, 17-29Kenya: Paulines
Publications Africa, Nairobi

154
Kog C., and Loh .K ., (2012) Critical Success Factors for Different Components of
Construction Projects. Journal of Construction Engineering and Management.
Kothari, C. R. (1985). Research Methodology. New Delhi: Willy Eastern Limited.
Kosekla,L.and Howell, G (2002) “The underlying theory of Project Management is
Obsolete” Proceedings of PMI/Research conference,293-495.
Kwak , Y.H (2002) Critical success Factors in International Development Project
Management
Langwen, B. M. (2011). “Strategic Environmental Assessment Report for the Economic
Stimulus Programme (ESP)”, Kenya Gazette No. 16934
Le-Hoai,L, Lee,Y.D, Lee,J.Y. (2008), “Delay and Cost Overruns in Vietnam Large
Construction Projects: A comparison with other selected countries” KSCE Journal
of Civil Engineering .
Levine, H. A. (2002). Practical Project Management: Tips, Tactics, and Tools. Canada.
John Wiley and Sons
Lewis, J.P. (2004). Project Planning, Scheduling and Control. A Hands- on Guide to
Bringing Projects in on Time and on Budget. New York. McGraw-Hill
Lock, D. (2004). Advanced Project Management: A Structured Approach. England:
Gower Publishing Ltd. (9th ed)
Lock, D. (2007). Project Management. England: Gower Publishing Ltd. (9th ed)
Lyons, T. and Skitmore, M. (2004), "Project risk management in the Queensland
engineering construction industry: a survey", International Journal of Project
Management, Vol. 22 pp.55-61.
Long, N.D., Ogunlana, S., Quang T. and Lam, C.K. (2004) „Large Construction Projects
` in Developing Countries: a Case Study from Vietnam‟, International
Journal of Project Management, 22, 553-561.
Malachi Motano (2010, April 11) Education: Faces big challenges. The link.
Malik, M. A., Baharumshah, A. Z. and Rahman, A.Z. (2005). “Malaysia: From Economic
Recovery to Sustained Economic Growth”, Journal of Post Keynesian
Economics, vol 28, No. 2
Manavazhi, M.R. and Adhikari, D. K. (2002) „Material and EEquipment Procurement
Delays in Highway Projects in Nepal‟, International Journal of Project
Management, 20, 627-632.

155
Mansfield, N.R., Ugwu O.O., and Doran T. (1994) „Causes of Delay and Cost Overruns
in Nigeria Construction Projects‟, International Journal of Project
Management, 12 (4), 254-260.
Mezher, T.F. and Tawil, W. (1998) „Causes of Delays in the Construction Industry in
Labanon‟, Engineering, Construction and Architectural Management, 3,
252-260.
Morris, S. (1990) „Cost and Time Overruns in Public Sector Projects‟, Economic and
Political Weekly, Nov. 24, Vol. XXV, No. 47, pp. M154 -168.
Musa, G. H., “Determination of Factors Influencing Projects Delays in Water Projects in
Kenya: The Case of Government Funded Projects”, Unpublished MBA
Thesis University Of Nairobi, 1999.
McConnell, E. (2010). Boundaries, deliverables and requirements as key components of
project scope. Retrieved from http://www.mymanagementguide.com/project-
boundaries-project-deliverables-and-project-requirements-as-key-components-of-
project-scope/ on 16 March 2012.
Merrow, E. W., & Yarossi, M. E. (1994). Managing capital projects: where have we been
– where are we going? Chemical Engineering, 101(10), 108–111.
Meredith, J. R. and Mantel, S. J. (2012). Project Management: A Managerial Approach.
USA: John Wiley and Sons.
Mittal, P. (2009). Managing Multiple Projects Successfully. New Delhi. Global India
Publications PVT ltd
Mouly, G. J. (1978). Educational Research. Boston: Allyn and Bacon.
Muchungu, P.K (2012). The contribution of human factors in the performance of
construction projects in Kenya.Unpublished Phd.Thesis.University of Nairobi.
Mugenda and Mugenda (1999) .Research Methods in education: Quantitative and
Qualitative Approach, Nairobi.Acts press.
Mugenda, A. G. (2008). Social Science Research. Nairobi: Applied Research and
Training Services
Mkwala and Kemei (2014) Years later, ambitious County projects remain incomplete.
The Standard digital.
Mulwa, F. W. (2008). Participatory Monitoring and Evaluation of Community Projects.
Nairobi. Paulines Publications Africa
Mrema and Mhando(2005) Causes of project failure of housing projects:A case of
unfinished buildings in Dar es alaam, Worls congresss on housing Pretoria South
Africa.
Muzio, E., Fisher, D.J., Thomas, E.R. & Peters, V. 2007. „Soft Skills Quantification
(SSQ) for project Manager Competencies‟, Project Management Journal, 38(2):
30-38.

156
Nelloreisher, R. and Blachandra, R. 2001. „Factors Influencing Success in Integrated
Product Development (IPD) Projects‟, IEEE Transactions on Engineering
Management, 48(2): 164-174.
Neser, J.J., Joubert, S.J., Sonnekus, E.F. 1995. Introduction to methodology:
Criminology, penology and policy science. Pretoria. University of South
Africa.
Nachmias,D & Oso W.Y (2005) A General Guide to Writing Research Proposal and
report. Replika Press Pvt. Limited, India
Nachmias and Nachmias (1996) Research Methods In the social sciences. Replika Press
Pvt. Limited, India.
Nyaga, J. W. N. (2010). Stand up Campaign for Millenium Development Goals”,
Ministry of State for Planning, National Development and Vision 2030. Nairobi:
City Stadium
O‟Connor, J., and Vickroy, C. (1986). Control of construction project scope. Source
Document 6, Construction Industry Institute, Austin, Tex.
Odera Omolo(2013) Kenya: Government blamed for lack of proper supervision of its
funds for rural projects.
Ogunlana, S.O., Promkuntong, K and Jearkjirm, V. (1996) „Construction Delays in a
Fast-Growing Economy: Comparing Thailand with Other Economies‟,
International Journal of Project Management. Vol. 14, No. 1, pp. 37-45
Olander,S.& Landin,A.(2005). Evaluation of stakeholder influence in the implementation
of construction projects.International journal of project management.
Olawale , A and Sun, M.(2010) Cost and Time Control of Construction Projects:
Inhibiting factors and Mitigating measures in practice.
Oni, A. I. (2008). Linking Project Controls Implementation Planning and Project
Success: the Northern Canadian Mining Projects Lessons. 2008 AACE
International Transactions.1-8.
Opot, T. O. (2006) Unpublished Conference Paper, Presented to Head Teachers and
Deputies of Central Province at Muranga T.T.C Nairobi, Kenya
Oso W.Y & Onen (2005) A General Guide to Writing Research Proposal and report.
Jomo Kenyatta Foundation.
Orodho J.A (2004) Techniques of Writing research proposals and reports in education
and social sciences (4th
edition) Nairobi :Masola.
Patton (1990), Qualitative evaluation and research methods , Beverly Hill ,CA.

157
Perminova, O., Gustafsson, M., & Wikstrom, K. (2008). Defining uncertainty in projects
– a new perspective. International Journal of Project Management, 26(3), 73–79.
Pietlock, B. A., Leo, D. W., & Hollmann, J. K. (2003). The cost management (TCM)
framework section 8.3 cost estimating and budgeting. AACE International
Transactions preceding. Retrieved January 19, 2006 from University of Phoenix
EBSCHO Host database.
Pillai, N.V and Kannan, K.P. (2001) „Time and Cost Over-runs of the Power Projects in
Kerala‟, Centre for Development Studies, Thiruvananthapuram, Working
Paper No. 320 (available: www.cds.edu)
Pheng, L.S. and Lee, B.S.K. 1997. „East meets West: Leadership development for
construction project management‟, Journal of Managerial Psychology,
12(6): 383-400.
Project Management Institute 2004 A guide to the project management body of knowledge
(PMBOK® Guide). Pennsylvania: Project Management Institute.
Project Management Institute 2006 A guide to the project management body of knowledge
(PMBOK® Guide) Pennsylvania: Project Management Institute.
Project Management Institute 2007 A guide to the project management body of knowledge
(PMBOK® Guide) Pennsylvania: Project Management Institute.
Project Management Institute 2013. A guide to the project management body of
knowledge (PMBOK® Guide), Pennsylvania: Project Management Institute.
Raid, A. P. (1999). Project Management: Getting it Right. USA: Woodhead Publishing
Ltd.
Richman, L. (2002). Project Management Step-By-Step. New York: AMACOM
Retrieved April 19, 2008, from Questia database:
[http://www.questia.com/PM.qst?a=o&d=111661506]
Richman, L. (2012). Project Management Step-By-Step. New York: AMACOM.
Retrieved April 19, 2008, from Questia database:
[http://www.questia.com/PM.qst?a=o&d=111661506]
Republic of Kenya (2009), Economic stimulus programme, overcoming todays‟
challenges for a better Kenya tomorrow
Republic of Kenya (2009), Kenya Education Sector Support Programmes – School
Infrastructure Improvement Grants Training Manuals
Republic of Kenya (2008), Ministry of education strategic plan 2008-2012

158
Republic of Kenya (2005), Sessional paper No. 1: 2005: Policy framework for Education,
training and research.
Rory (2008) Project Management techniques. Roanke,Virginia United States
Burke Publishers
Rubin, A. and Babbie, E. R. (2011). Research Methods for Social Work. Canada.
Cengage Learning
Rwelamila, P.M.D. 2007. „Construction Project Management Education Programmes in
South Africa– Addressing the Gap‟. In: de Ridder, H.A.J.,
Wamelink, J.W.F. ed. Second International Conference
Schmid, B., and Adams, J. 2008. „Motivation in Project Management: The Project
Manager‟sPerspective‟, Project Management Journal, 39(2): 60-71.
Schimmoller, B.K. 2001. „The changing face of project management‟, Power
Engineering, May: 28-30.
Schwalbe, K. 2007. Information Technology Project Management. 5th ed. USA:
Thomson Course Technology.
Skulmoski, G.J. 2000. „Critical Performance Competencies for Cost Engineers‟, AACE
International Transactions, DEV.02: 1-7.
Shelly A Brotherton, PMP; Robert T. Fried, PMP; Eric S. Norman, PMP, PgMP - 2 -
Originally published for the 2008 PMI Global Congress Proceedings – Denver
Colorado Sharma, A., & Lutchman, C. (2006). Scope definition for expanding
operating projects. AACE International Transactions, 16, 1-6.
Smith, H. J., Thompson, R. and Lacovou, C. (2009). “The Impact of Ethical Climate on
Project Status Misreporting.” Journal of Business Ethics Vol 90. No. 4.
Smith M.B., (1997) "Are traditional management tools sufficient for diverse teams?”
Team Performance Management, Vol. 3 Iss: 1, pp.3 – 11
Smolley, E.R. (1999), Effective School Boards strategies for improving board
performance. California: Jossey Bass Publishers.
Standard Digital is a product of The Standard Group Limited Read more
ahttp://www.standardmedia.co.ke/?articleID=2000096775&pageNo=3
Standish Group. 2004. CHAOS Report. West Yarmouth, MA: The Standish
Group.International Inc.
Stanton, B. and Hunt, M. S. (2005). Management Skills. UK: Select Knowledge Ltd.
Steve Hinge (2003) Project scoping an effective tool, PMI.
Svetlana J.K. C, (1997) "Critical factors of effective project management", The TQM
Magazine, Vol. 9 Iss: 6, pp.390 – 396

159
Smith, M., & Tucker, R. (1983). An assessment of the potential problems occurring in
the engineering phase of an industrial project. Report Prepared for Texaco, Inc.,
Univ. of Texas Austin, Texas.
Tanner Kenneth (2009), Implementation of President Barak Obama‟s Agenda on School
Infrastructure: How to Improve School Infrastructure; Spend Stimulus Money
Wisely, and Share the Wealth
Theunynck S. (2009), School construction strategies for universal primary education I
Africa: Should communities be empowered to build their own schools?
Taylor, A. (1990, January 18). Controlling project scope is critical: managing change
requests is a job for the Scope Controller. Computing Canada .
Thomas,W.K (2004), Measuring Project Success in Construction Industry, Engineering
Management Journal Vol 16 No.3 pp 31-37
Thanoon , M. A., Baharumshah, A. Z., Aziz A and Rahman, A.(2005), “Malaysia: from
economic Recovery to sustained economic growth” .Journal of Post Keynesian
Economics (M. E. Shape inc), Vol 28, No. 2, pp295-315
The Daily Nation August 19,2013 A Nation Survey of Economic Stimulus Projects.
Touliatos J. & Compton N.H (1988) Research Methods In Human Ecology/Home
Economics.Iowa state University Press
US Government. 2010. Economic report of the president. Feb. 2010. (Washington: US
Government Printing Office).
Verzuh, E. (2005). The fast forward MBA in project management. (2nd Ed), New York:
John Wiley & Sons Inc.
Voetsch,R.J., D.F Cioffi and F.T Anbari, 2004.Project Risk Management Practices and
their Association with Reported Project Success. Proceedings from IRNOP.
Waddell, D. (2005). Program management: The next step in the evolution of project
management? Problems and Perspectives in Management, 3, 160-169.
Ward, J.A. (1995). Project pitfalls. Information Systems Management, 12(1), 74-76.
Webster G, (1999) "Project definition – the missing link", Industrial and Commercial
Training, Vol. 31 Iss: 6, pp.240 – 245

160
Whitley, M. (2012) The Importance of Project Management: New Research into the Role
of Project Management in a Modern Developed Economy like the UK.
http://www.project smart.co.uk/history of projectmanagement.html.
Wijner G. & Kor R. (2000). Using project and programme management to handle „unique
assignments‟. The Antidote, (27), 6-10.
World Bank (1999) Project Financial Management Manual: Loan Department. Vietnam:
Site resources
Wysocki R. K., (2000). Effective Project Management: Traditional, Agile, Extreme.
San Francisco: Wiley.com
Wysocki, R. K. &McGary, R. (2003).Effective project management: traditional, adaptive,
extreme (3rd ed.).Wiley Publishing, Indianapolis.
World of Construction Project Management, Netherlands, August 14, 2007. TU Delft. 1-
15.
Yamane ,Taro (1967) Statistics: An introductory Analysis, 2nd
Ed. New York: Harper and
Row.
Yehunda B. &Brooks C. H. (2008), Human relations; Vol. 61(8):
http://hum.sagepub.com U.S. Congressional Budget Office. (2011). The Budget
and Economic Outlook: An Update, 69
Young, R.R. (2008). Twelve requirements basics for project success. Journal of the
Quality Assurance Institute, 22(1), 19-25.
Young, T.L. (2000). Successful project management .Kogan Page, London

161
APPENDICES
APPENDIX I: TRANSMITTAL LETTER
Odhiambo Kenneth Otieno
P.O .Box 78
Bondo
Dear Respondent
I am a student of the University of Nairobi pursuing master of art degree in project
planning and management. I am conducting an academic research on influence of skills
and knowledge on the relationship between project scope management and
implementation of economic stimulus projects in public secondary schools in Kisumu
County, Kenya.
I am kindly requesting for your assistance in responding honestly to all items in the
questionnaire.
All information given will be treated with utmost confidentiality and will be used only for
the intended purpose. Your cooperation and assistance will be highly appreciated.
Thank you.
Yours faithfully,
Odhiambo Kenneth Otieno

162
APPENDIX II: QUESTIONNAIRE.
QUESTIONNAIRE FOR BOM AND SITE COMMITEE MEMBERS
Below is a questionnaire for a research project entitled “influence of skills and
knowledge on the relationship between project scope management and implementation
of economic stimulus projects in public secondary schools in Kisumu county.” leading
to an award of degree of master of arts in Project Planning and Management of the
University of Nairobi. Your response is needed for academic purposes and will be treated
in strict confidence. Please answer the questions as truthfully as you can.
INSTRUCTIONS
i. Answer all the questions
ii. You may or may not indicate your name.
iii. Please tick (√) or provide the required information for the various questions.
SECTION I : BACKGROUND INFORMATION
Name (optional)……………………………………………………………………………
1. Please indicate your gender. Male [ ] Female [ ]
2. Please indicate your age bracket?
i. 20-29 years [ ]
ii. 30-39 years [ ]
iii. 40-49 years [ ]
iv. Above 49 years [ ]
3. Please state the number of years you have been BOM or a committee member in this
school
Less than 3 years [ ]
4-6 years [ ]
7-9 years [ ]
Above 9 years [ ]
4. Please indicate your education level
Masters [ ]
Bachelor‟s degree [ ]
Diploma [ ]
Certificate [ ]
6. Others (specify)……………………………………………………………
SECTION II: IMPLEMENTATION OF ECONOMIC STIMULUS PLAN
1) Did the project last for the six month duration set by the government?
Yes [ ] No [ ]

163
2) Did the project last for the duration set by the government, that‟s the six month period
as stimulated in the government blue print of the Economic Stimulus programme?
Yes [ ] No [ ]
3) If no above give reason………………………………………………………..
4) Was the project completed on government predefined budget?
Yes [ ] No[ ]
5) If No above what funds were used to rescue the
project?.............................................................................................................................
................................................................................................
6) Was there any quality specification for the project?
Yes [ ] No[ ]
7) If yes were the quality specifications adhered to? Yes [ ] No[ ]
8) Was there scope management plan for the project?
Yes [ ] No[ ]
9) Indicate the degree to which the following project parameters were controlled.
Excellent =5, Good=4, Average=3, Poor=2, Very poor=1
Parameter Excellent Good Average Poor Very poor
Time
Cost
Quality
Scope
10) How would you rate the skills and knowledge of the key members of the project
implementation team?
i. Adequate [ ]
ii. Fairly adequate[ ]
iii. inadequate [ ]7
11) How would you rate the level of supervision during the project implementation?
i. Adequate [ ]
ii. Fairly adequate[ ]
iii. inadequate [ ]
12) How would you rate the level of clients‟ interference during the project
implementation?
13) Did the implementation team encounter challenges of project coordination?
Yes [ ] No [ ]
14) If yes above please
elaborate………………………………………………………………………………
…………………………………………………………………………………………
…Was there a corrective system for measuring and tracking project progress?
Yes [ ] No [ ]
15) Was there an adequate approach for estimating, monitoring and controlling the total
amount of expenditures?
Yes [ ] No [ ]

164
Were there skilled and experienced project team members with clearly defined roles and
responsibilities? Yes [ ] No [ ]
16) Was there access to expertise which could benefit those fulfilling the requisite roles?
Yes [ ] No [ ]
17) What was the status of the major project milestones in relation to the planned
schedule of activities?
i. Ahead of schedule [ ]
ii. On schedule [ ]
iii. Slightly behind schedule [ ]
iv. Behind schedule to a larger extent [ ]
19 )What was the approximate delay in terms of months?
i. Upto six months
ii. 6-12 months
iii. 1-3 years
iv. Ongoing
20) Were the quality specification adhered to? Yes [ ] No [ ]
22) How would you rate the satisfaction level of the stakeholders with the project
outcome?
i. High
ii. Low
23) There were recommended corrective actions after verification
True [ ] false [ ]
24) What is the status of the project?
i. Complete
ii. Incomplete
iii. Under construction
SECTION IIIPROJECT SCOPE INITIATION
1) Did the project team members prepare a project charter? Yes [ ] No [ ]
2) How do you rate the competence of the project manager?
Very competent
Competent
Incompetent
Very incompetent
3) The project constraints were clearly outlined for all the stakeholders.

165
True [ ]
False [ ]
4) Project assumptions were appropriate and clearly outlined to all stakeholders?
True [ ]
False [ ]
5) Project constraints were clearly outlined and discussed by the project
stakeholders?
Yes [ ] No[ ]
6) Project deliverables were outlined?
Yes [ ] No [ ]
7) All project objectives were agreed on by the stakeholders?
Yes [ ] No [ ]
8) Project success criteria were agreed upon by the project stakeholders?
Yes [ ] No [ ]
9) How would rate the effectiveness of the project assumptions?
Very effective
Ineffective
Effective
10) How would you rate the accuracy of the overall project assumptions?
Very accurate
Accurate
Inaccurate
11) How adequate were the project the project management techniques applied during
the implementation of the projects?
Adequately
Inadequately
Not sure
SECTION IV SCOPE PLANNING
1) Do you have experience in Project Scope Planning? Yes [ ] No [ ]
2) Do you have skills and knowledge of scope planning? Yes [ ] No [ ]
3) Were there members among the project team who were experienced in scope
planning? Yes [ ] No [ ]
4) Was the scope management plan initiated before project implementation?
Yes [ ] No [ ]
5) If No above what could be the reason?
i. Lack of know how. [ ]
ii. Time constraints. [ ]
iii. Lack of management commitment. [ ]
6) Did the key stakeholders participate in the process of scope planning?
Yes [ ] No [ ]
7) Did you involve a project management expert to review the scope plan before
initiation of the project? Yes [ ] No [ ]
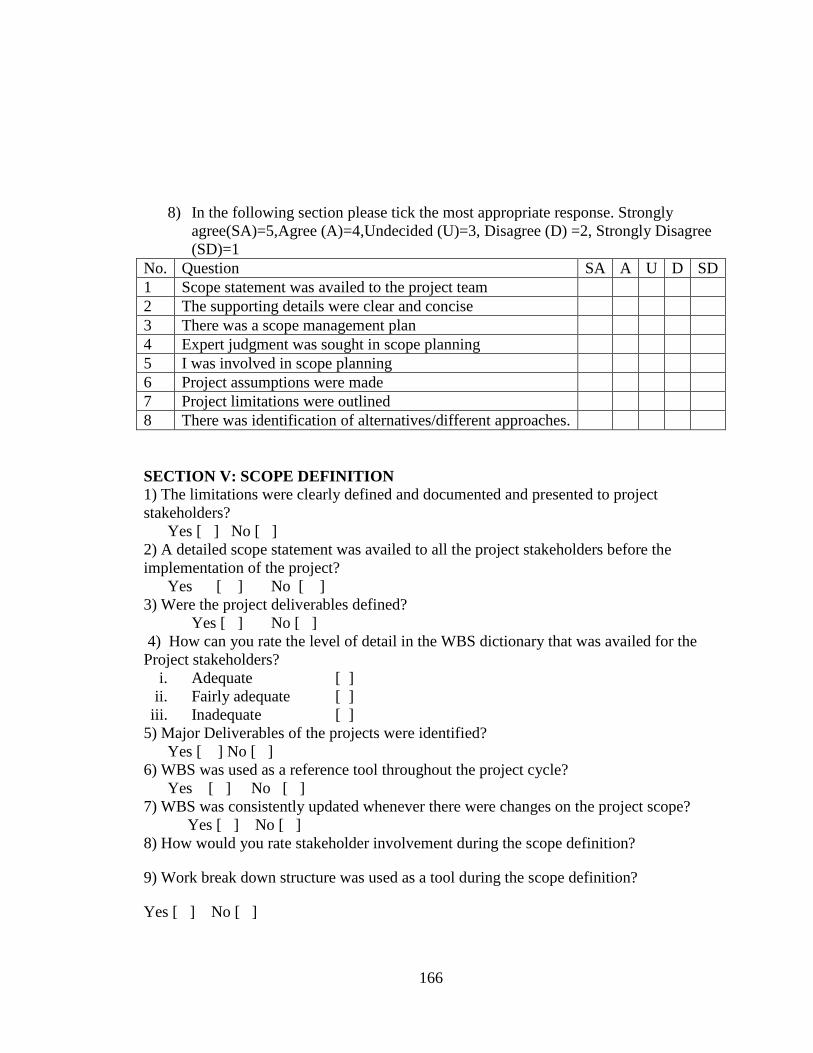
166
8) In the following section please tick the most appropriate response. Strongly
agree(SA)=5,Agree (A)=4,Undecided (U)=3, Disagree (D) =2, Strongly Disagree
(SD)=1
No. Question SA A U D SD
1 Scope statement was availed to the project team
2 The supporting details were clear and concise
3 There was a scope management plan
4 Expert judgment was sought in scope planning
5 I was involved in scope planning
6 Project assumptions were made
7 Project limitations were outlined
8 There was identification of alternatives/different approaches.
SECTION V: SCOPE DEFINITION
1) The limitations were clearly defined and documented and presented to project
stakeholders?
Yes [ ] No [ ]
2) A detailed scope statement was availed to all the project stakeholders before the
implementation of the project?
Yes [ ] No [ ]
3) Were the project deliverables defined?
Yes [ ] No [ ]
4) How can you rate the level of detail in the WBS dictionary that was availed for the
Project stakeholders?
i. Adequate [ ]
ii. Fairly adequate [ ]
iii. Inadequate [ ]
5) Major Deliverables of the projects were identified?
Yes [ ] No [ ]
6) WBS was used as a reference tool throughout the project cycle?
Yes [ ] No [ ]
7) WBS was consistently updated whenever there were changes on the project scope?
Yes [ ] No [ ]
8) How would you rate stakeholder involvement during the scope definition?
9) Work break down structure was used as a tool during the scope definition?
Yes [ ] No [ ]

167
SECTION VI: SCOPE VERIFICATION
1) Requested changes were consistently taken into consideration and documented by
project team members? Yes [ ] No [ ]
2) Requested changes were documented and factored in the WBS? Yes [ ] No [ ]
3) All stakeholders were notified of recommended changes before the
implementation? Yes [ ] No [ ]
4) Deliverables were verified before formal acceptance? Yes [ ] No [ ]
5) Work results were consistently compared against project plan to check their
completeness and against the quality control measures to check the correctness of the
work. Yes [ ] No [ ]
6) WBS was used as a verification tool? Yes [ ] No [ ]
VER change requests were formal and all the project team members notified of
impending changes
7) Do you have skills and knowledge of scope verification? Yes [ ] No [ ]
8) As an output of scope verification, were there recommended corrective action on the
project implementation process? Yes [ ] No [ ]
9) Work results were consistently compared against the project plan, to check
completeness and against quality control measures to check correctness.
True[ ] False[ ]
10) What is your view the recommended corrective actions during the
implementation?
i. Objective
ii. Subjective
iii. Very subjective
11) Work results and deliverables were reviewed against the scope definition that
was accepted at the beginning of the project?
11) There were quality control measures endorsed by the project stakeholders
True [ ] False [ ]
SECTION VII: PROJECT CHANGE CONTROL
1) How would rate the level of control to scope changes?
i. Adequate [ ]

168
ii. Fairly adequate [ ]
iii. Inadequate [ ]
2) Were project team members notified on impending changes to the project scope?
If yes how often
i. Very often
ii. Often
iii. Rarely
iv. very rarely
3) How frequent can you rate the changes made to the project scope during
implementation?
i. Very frequent
ii. Frequent
iii. Not frequent
4) How would you rate the degree of reporting on project deviation?
i. Very objective
ii. Objective
iii. Fairly objective
iv. Subjective
v. Very subjective
5) In your opinion, do you think the project was completed on scheduled time, on
allocated budget, within the set scope and planned performance requirements?
Yes [ ] No [ ]
6) Was there a scope change control system for the project?
Yes [ ] No [ ] Not sure [ ]
6) How would you rate the objectivity of scope changes?
i. Objective
ii. Subjective
7) Did the project experience scope creep(uncontrolled changes)?
Yes [ ] No [ ] Not sure [ ]
8) How would you rate the level at which cost estimates were adhered to during the
project implementation?
i. High
ii. Low
iii. Not sure
9) How quick was the project team able to detect deviations from the scope?
i. After occurrence
ii. Shortly after they occur

169
iii. Before they occur
iv. Deviations were never detected
10) How frequent were changes made to project scope during implementation
i. Very frequent
ii. Not frequent
iii. Frequent
11)In your opinion , do you think the project scope control was a success?
Yes [ ] No [ ]
12) The lessons learnt were documented as part of historical information for current and
futures use? True [ ] False [ ]
SECTION VII: TO BE RESPONDED TO BY THE DISTRICT EDUCATION
OFFICE.
1) Was the project adequately defined and the same communicated to stakeholders?
Yes [ ] No [ ]
2) Was reasonable effort taken to ensure that the project scope was commensurate with
the ESP budget?
Yes [ ] No [ ]
3) Were the funds for implementing the projects availed adequately as per the schedule?
Yes [ ] No [ ]
4) To what extent did your office ensure that there was consistent verification of the
project scope during the project implementation?
i. To a large extent [ ]
ii. To some extent [ ]
iii. Not sure [ ]
5) How often did you obtain reports on the project‟s progress?
i. Very often
ii. Often
iii. Not often
iv. There were no reports
6) Were there instances where the projects actual performance deviated from the
planned performance?
Yes [ ] No [ ]
7) Were these instances documented?
Yes [ ] No [ ]
8) What corrective actions were undertaken?
9) Yes [ ] No[ ]
10) Were the project team members trained on matters relevant to scope management?
Yes [ ] No [ ]
If no elaborate……………………………………………………………

170
11) What is your opinion on the predefined project budget as was the case with the
economic stimulus projects?....................................................................................
………………………………………………………………………………………
………………………………………………………………………………………
12) What challenges were faced in the course of scope planning?
………………………………………………………………………………………
………………………………………………………………………………………
………………………………………………………………………………………
….
13) To what extent did you ensure that only the right project team members and other
project workers were recruited for the projects?
………………………………………………………………………………………
………………………………………………………………………………………
………………………………………………………………………………………
14) Were the project team members trained on matters relevant to the projects
implementation skills?
………………………………………………………………………………………
……………………………………………………………

171
APPENDIX III
UNIVERSITY LETTER OF INTRODUCTION

172
APPENDIX IV
RESEARCH AUTHORIZATION LETTER

173
APPENDIX V
RESEARCH CLEARANCE PERMIT

174
APPENDIX VI: MAP OF KISUMU COUNTY
Figure 3.1 shows the map of Kisumu County.