Embed Size (px)
Citation preview

Eastern Michigan UniversityDigitalCommons@EMU
Master's Theses and Doctoral Dissertations Master's Theses, and Doctoral Dissertations, andGraduate Capstone Projects
11-3-2015
Influence of sports drink taste preference onconsumption in adult recreational soccer playersKiarash Molavi
Follow this and additional works at: http://commons.emich.edu/theses
Part of the Exercise Science Commons, and the Nutrition Commons
This Open Access Thesis is brought to you for free and open access by the Master's Theses, and Doctoral Dissertations, and Graduate Capstone Projectsat DigitalCommons@EMU. It has been accepted for inclusion in Master's Theses and Doctoral Dissertations by an authorized administrator ofDigitalCommons@EMU. For more information, please contact [email protected].
Recommended CitationMolavi, Kiarash, "Influence of sports drink taste preference on consumption in adult recreational soccer players" (2015). Master'sTheses and Doctoral Dissertations. 652.http://commons.emich.edu/theses/652

Influence of Sports Drink Taste Preference on Consumption in Adult Male Soccer
Players
by
Kiarash Molavi
Thesis
Submitted to the School of Health Sciences
Eastern Michigan University
in partial fulfillment of the requirements
for the degree of
MASTER OF SCIENCE
in
Human Nutrition
Thesis Committee:
Anahita Mistry, Ph.D, Chair
Emily Edison, M.S., R.D.
November 3, 2015
Ypsilanti, Mi

ii
Acknowledgments
I would like to thank Professor Anahita Mistry for serving as my thesis chair. I
would not have been able to complete this thesis without her guidance. I would also like
to thank Emily Edison for serving on my thesis committee. I admire her work, and I
hope this project will one day propel me to work with athletes as a sports dietitian. A
special thank you to Todd Olsen for providing me with sports drinks, which helped keep
the cost of this project down. I would like to thank all the subjects who participated in
this study. It was a pleasure getting to know all of them. Lastly, I would like to thank
my friends and family who have supported me through this long process.
iii
Abstract
Sports drinks provide nutrients that improve athletic performance. This study
investigated whether a preference in taste leads to an increased consumption of a sports
drink prior to and after an endurance event in athletes. Male amateur soccer players
(n=16) first participated in a blind sensory evaluation to determine their taste preference
for two (designated as Drink A and Drink B) similarly flavored sports drinks. Subjects
were divided into two groups based on their taste preference for either drink. They then
participated in 9 soccer matches and were presented with either Drink A, Drink B, or
water (3 trials each) before and after matches. Volumes of drinks voluntarily consumed
were measured and averaged. Both groups consumed similar amounts of either Drink A
or Drink B, before and after matches. Taste preference for a drink did not influence the
amount of a sports drink that athletes consumed pre- or post- exercise.

iv
Table of Contents
Acknowledgments............................................................................................................... ii
Abstract .............................................................................................................................. iii
List of Tables ...................................................................................................................... v
List of Figures .................................................................................................................... vi
Chapter 1: Introduction ....................................................................................................... 1
Purpose and Objectives ........................................................................................... 4
Research Hypothesis ............................................................................................... 5
Chapter 2: Literature Search ............................................................................................... 6
Chapter 3: Research Methodology.................................................................................... 18
Research Design.................................................................................................... 18
Comparisons and Statistical Analysis ................................................................... 23
Chapter 4: Results ............................................................................................................. 24
Chapter 5: Discussion ....................................................................................................... 36
References ......................................................................................................................... 44
Appendix A: Recruitment E-mail ..................................................................................... 49
Appendix B: Informed Consent ........................................................................................ 51
Appendix C: Taste Test and Sensory Evaluation Questionnaire (form 1)........................ 54
Appendix D: Taste Test and Sensory Evaluation Questionnaire (form 2) ....................... 56
Appendix E: Human Subjects Approval Letter ................................................................ 58

v
List of Tables
Table Page
1 Age, Height, and Weight Demographics of the Subjects ...................................... 24
2 Taste Scores for Subjects Who Preferred the Taste of Drink A or Drink B .......... 25
3 Sweetness Scores for Subjects Who Preferred the Taste of Drink A
or Drink B .............................................................................................................. 26
4 Saltiness Questionnaire Results for Subjects Who Preferred the Taste
of Drink A or Drink B ............................................................................................ 28
5 Palatability Questionnaire Results for Subjects Who Preferred the
Taste of Drink A or Drink B .................................................................................. 30
6 Pre-Match Consumption Results For Subjects Who Preferred the Taste
of Drink A or Drink B ........................................................................................... 32
7 Post-Match Consumption Results for Subject Who Preferred the Taste
of Drink A or Drink B ............................................................................................ 34
8 Carbohydrate Intake for Subjects Who Preferred the Taste of Drink A or
Drink B Pre-Match, Post-Match, and a Combination of Pre- and Post-Match ..... 40
vi
List of Figures
Figure Page
1 Visual Display of Sweetness Results for Subjects Who Preferred the Taste
of Drink A or Drink B ........................................................................................... 27
2 Visual Display of Saltiness Results for Subjects Who Preferred the Taste of
Drink A or Drink B ............................................................................................... 29
3 Visual Display of Palatability Results for Subjects Who Preferred the Taste
of Drink A or Drink B ........................................................................................... 31
4 Visual Display of Pre-Match Consumption Results of Drink A, Drink B, and
Water for Subjects Who Preferred the Taste of Drink A or Drink B ................... 33
5 Visual Display of Post-Match Consumption Results of Drink A, Drink B, and
Water for Subjects Who Preferred the Taste of Drink A or Drink B ................... 35

1
Chapter 1: Introduction
The manufacturing of sports drinks has become a powerful industry, which earned
6.3 billion dollars in revenue in 2012 (Mintel, 2012). Mintel, a market research firm, has
projected the industry to grow by 52% from 2013 to 2017. Gatorade, which is currently
owned by PepsiCo, was the first sports drink manufacturer when it introduced its product
commercially in 1967 (Kays & Philips-Han, 2003). Since then, several other
manufacturers such as All-Sport, Coca-Cola’s PowerAde, and smaller brands such as
Seattle-based Golazo have attempted to gain market share in the industry. Many of these
manufacturers incorporate similar ingredients in their drinks. Some of the homologous
ingredients include simple carbohydrates such as sugar, electrolytes such as potassium
and sodium, and water. These ingredients enhance athletic performance by providing
fuel, hydrating the body, and by replenishing minerals lost through sweat. In addition to
these ingredients, each manufacturer incorporates flavor into their products to enhance
taste, making the drink attractive to potential consumers.
One of the goals of sports drink manufacturers is to maximize sales to consumers.
According to the Mintel (2012) report, about two in five adults consume sports drinks,
with the Hispanic population being the heaviest users, as well as individuals in the 18-to-
24-year-old age group. People buy these products for several reasons. Two of the main
reasons are taste and the potential benefits for the body during athletic competitions. As
for the benefits, a study by Von Duvillard, Braun, Markofski, Beneke, and Leithäuser
(2004) advocated that athletes should consume fluids containing carbohydrates and
electrolytes for events lasting longer than an hour. The study further stated that failure to
do so may result in hampered performance and may lead to serious medical problems

2
such as dehydration. Another study by Friedman and Elliot (2008) showed that mere
exposure and not consumption of popular sports drinks increased endurance in persistent
tasks. This suggests that sports drinks have an added psychological effect on
performance (Friedman & Elliot, 2008).
Gatorade’s web site (Kays, 2003) elaborates the four main ways their product
helps improve athletic performance: rapid fluid absorption; rapid rehydration; providing
carbohydrate energy to working muscles; and encouraging consumption, due to its
palatability, until thirst is fully quenched. Rapid fluid absorption is important during
strenuous activity in order to avoid dehydration. A 6% carbohydrate level by volume
along with the presence of salt is optimal for fluid absorption (Caldwell, 1997). Rapid
rehydration is achieved through the presence of sodium, which helps maintain body
fluids. Carbohydrate energy in the form of sugar (sucrose in Gatorade) provides fuel for
the body. Lastly, the presence of glucose and sodium encourage people to drink until
they are fully hydrated as sugar makes the product sweeter therefore increasing
palatability, while salt enhances the thirst mechanism by increasing extracellular sodium
concentrations (Johnson & Thornhorst, 1997). A researcher (Caldwell, 1997) from
Vanderbilt University investigated these claims and concluded that they were largely
accurate.
The Academy of Nutrition and Dietetics, along with the Dietitians of Canada and
the American College of Sports Medicine (2009), issued a joint position statement on
nutrition and athletic performance. According to this position statement, carbohydrates
for athletes are recommended in a range from 6 to 10g/kg of body weight per day to
maintain blood glucose levels during exercise and replace muscle glycogen.

3
Furthermore, sodium is an important electrolyte as it regulates blood volume, blood
pressure, osmotic equilibrium, and pH. Potassium is also an important electrolyte that
controls fluid and electrolyte balance, nerve transmission, and active transport
mechanisms. Sports drinks containing sodium and potassium are recommended for
athletes, especially those participating in high-endurance events. Dehydration, due to
water deficits from exercising, can decrease exercise performance. Active individuals
need to drink enough fluids to replace sweat losses during exercise in order to maintain
maximum potential for athletic performance.
Taste and palatability may be another reason individuals consume sports drinks,
although according to the Mintel report mentioned earlier, only 40% of consumers
surveyed cited taste as being a major reason they consume sports drinks (Mintel, 2012).
The sensory pathway of taste begins with receptor cells which are located on taste buds
(Lindermann, 1996). Food appraisal is associated with a hedonic tone, which describes
the pleasure-related acceptance of a given taste. It involves the activation of midbrain
dopamine neurons and may be accompanied or induced by the release of endogenous
opiates in the hypothalamus. Whether positively perceived tastes can influence higher
consumption of a sports drink is not known and remains to be investigated. This is
significant as sports drink manufacturers could potentially optimize their sales by making
a better tasting product than their competitors. Other major reasons for intake of sports
drinks include being a thirst quencher, as a beverage to drink during and after exercise,
and as an anytime beverage.
The objective of this study was to determine how taste can influence how much of
a drink is consumed prior to and after sports competition. This information may help to

4
develop current and new sports drinks for optimal nutrition and marketability since
consumers cited in previous studies (Mintel, 2012) that only 40% of their choice to
consume a sports beverage was dependent on taste. It has been shown that optimal
nutrition can enhance performance in athletes (Academy of Nutrition and Dietetics,
2009). The participants of this study were athletes who competed in a sport, rather than
people in the general population. If taste is shown to influence consumption levels, then
athletes may get more of the nutrients that could help them perform better in their sport.
It should be noted that performance will not be evaluated in this study, just taste and
consumption at various points of exercise.
The two drinks that were studied were designated as “Drink A” and “Drink B,”
which were chosen for various reasons. Drink A is an established brand and a popular
sports drink. Drink B is from a smaller company based on the west coast. Drink B
specifically markets their products to soccer players, as well as their fans. Since the
participants of the study were soccer players, then a sports drink marketed toward these
players was a logical fit for testing.
Purpose and Objectives
The purpose of this study was to investigate whether a preference in taste leads to
an increased consumption of a sports drink prior to and after an endurance event such as a
recreational league soccer match. The main objective of this study was to determine
whether there was a correlation between perceptions of taste preference and consumption.
First, to determine taste preference, a taste test survey with two sports drinks was
conducted. To better understand the participants taste perceptions, a sensory evaluation

5
questionnaire was utilized during the taste test portion of this study. Subsequently in nine
separate trials, consumption levels were monitored prior to and after an exercise activity.
This study specifically determined the extent to which taste preferences and
perceptions for sports drinks play a role in pre- and post-exercise consumption.
Companies who develop sports drinks may alter their methods to consider taste as a
stronger factor when developing a product intended to supply an athlete with the nutrients
necessary to perform at an optimal level.
Research Hypothesis
Athletes who prefer the taste of one sports drink over another will drink more of
that preferred drink before and after exercise, which would then potentially provide them
with additional nutrients and fluids compared to the drink that was preferred less.

6
Chapter 2: Literature Search
A literature search was conducted using Pub Med and Proquest, accessed through
Eastern Michigan University’s online library system. Key words that were used for this
search were “sports drinks,” “taste,” and “endurance” with relevant studies appearing
from 1971 to 2015. There were few articles that directly linked taste to sports drink
consumption and exercise performance. Lee, Nio, Ang, Law, and Lim (2011) included a
taste evaluation questionnaire in their consumption and performance study, which will be
discussed later. Other articles that were chosen for review independently centered on
either taste perception or the effects of sports drinks on exercise performance.
Sensory Perception of Sports Drinks Pre- and Post-Exercise
Exercise has been shown to change sensory perceptions of sports drinks (Ali,
Duizer, Foster, Grigor, & Wei, 2011). The pleasantness of a beverage is important for
fluid replacement during exercise and the likelihood of consumption increases when the
fluid is perceived as pleasant. Ali (2011) conducted a study to examine sensory
perceptions of different formulations of sports drinks when consumed prior to, during and
after exercise. Fourteen recreational runners were recruited for this study in a single
blind counterbalanced design. Four trials were conducted with different concentrations
of carbohydrate and/or electrolyte fluids: 7.5% carbohydrate, 421 mg/L electrolyte, 7.5%
carbohydrate 140 mg/L electrolyte, 1.3% carbohydrate, 421 mg/L electrolyte, and water.
Subjects were provided with 50 ml samples of each solution to ingest. They then rated the
intensity of sweetness, saltiness, thirst-quenching ability, and overall liking of each
solution before, during, and after running on a treadmill for two hours. Ratings of

7
sweetness for the two higher carbohydrate drinks were higher during exercise relative to
pre- or post-exercise. Sweetness ratings for the low carbohydrate, high electrolyte drink
increased with duration of exercise. Saltiness intensity ratings decreased for all energy-
containing drinks during and post-exercise when compared to pre-exercise. Overall
likability and thirst-quenching ability increased with exercise when compared to pre-
conditions. The investigators concluded that significant changes in sensory perceptions
and likeability/thirst-quenching ability occurred when subjects consumed sports drinks
during and after exercise compared to pre-exercise conditions. These results may
indicate that overall consumption of sports drinks increases post-exercise when compared
to pre-exercise conditions.
Methods of Taste Comparisons and Evaluation of Taste Perceptions
The taste of a sports drink may make a difference in the amount of a drink
consumed by a subject. Taste influences caloric intake and warns the body against
ingesting harmful substances (Scott, Yan, & Rolls, 1995). It is a sense that is capable of
detecting bitter, sweet, sour, salty, and umami stimuli (Lindemann, 1996).
Distinguishing between these modalities provides valuable sensory input. When creating
a product for consumption, it is assumed that sports drink manufacturers incorporate a
pleasant taste into their drinks. In addition, a palatable intake is known to enhance fluid
intake during exercise (Minehan, Riley, & Burke, 2002). Though preference for tastes is
subjective and differs from person to person, studies have been conducted that help
objectify taste perceptions, which will be discussed in the following paragraphs.

8
Bartoshuk (2000) compared taste perceptions across individuals using
psychophysical advanced methods. Genetic variations in taste are possible as assessed by
the development of psychophysical techniques that permit comparisons across
individuals. A very early approach (Fechner, 1860) compared taste perceptions using a
simple scaling technique, which measured suprathreshold intensities. The
“suprathreshold” indicated the stimulus change necessary to produce a noticeable
difference in taste intensity (i.e., the level of sweetness, sourness, etc. of a food or drink).
This method was discounted by Stevens (1961) many years ago because intensities could
not be logically determined. For example, on a hypothetical scale of taste intensity that
ranged from 1 to 10, 10 should be twice a strong as 5, but this was not the case. A
modern ratio scale was constructed by Stevens (1969) for taste sensation, which created a
sense of relativity among the strength and weaknesses of certain tastes. Magnitude
estimates were established by asking subjects to assign numbers to perceived intensities,
where one stimulus that was twice as strong as another would be assigned a value twice
as much as the “weaker” stimulus. Since subjects provide their opinion when defining a
stimulus, relative intensities are measured within a subject and not across subjects. A
variation of this approach could be used to determine specific taste stimuli such as
sweetness and saltiness. Lee et al. (2011) provided a questionnaire to subjects who rated
sweetness, saltiness, and pleasantness/palatability of three types of fluids: a carbohydrate-
electrolyte drink (similar to a sports drink), a sugar-free and electrolyte-free sweetened
placebo drink, and water. Analysis of the questionnaire’s answers showed that sweetness
was ranked highest with the carbohydrate-electrolyte drink, intermediate with the
placebo, and lowest with water. The carbohydrate-electrolyte drink and placebo were

9
rated similarly salty and both were perceived saltier than water. Pleasantness/palatability
was rated higher with the carbohydrate-electrolyte drink than with water. Further details
of the Lee et al. (2011) study that focused on consumption and exercise performance will
be discussed in a later section. In addition, the participants of the study were “trained” in
taste evaluation methods. In the article titled “Sensory Assessment of Food Quality”
found in Food Quality Evaluations, Rao (2013) discussed the importance of training
individuals before administrating a sensory test. Brief training was required because no
instrument had been devised that can reflect the complexity of human taste perception.
Flavored Drinks on Preference and Fluid Intake in Team Sports
Palatability, including factors such as flavor has been demonstrated to influence
fluid ingestion (Minehan et al., 2002). Minehan (2002) investigated the effect of flavor
on preferences and fluid balance in athletes. They sought to determine if flavor was a
positive or negative characteristic in determining voluntary fluid intake. Nine elite
female netball players, seven female basketball players, and eight male basketball players
participated in their study. Fluid intake was measured over nine training sessions for
each individual using three formulations of fluid: a high carbohydrate-electrolyte
solution, a low carbohydrate-electrolyte solution, and water. Similar training was
undertaken in each sport in order to make valid comparisons. During these sessions,
subjects were allowed to drink as much fluid as they desired of the drink provided for that
session. At the end of each session, subjects were asked to rank the drinks provided in
that session according to taste using a 5-point Likert scale.

10
Results of the study showed no significant differences between the taste
preferences of the high and low carbohydrate drinks or water. Subjects consumed
significantly more of the flavored drinks than water. There was no difference in fluid
intake between the high carbohydrate and low carbohydrate beverages. The investigators
concluded that better fluid intake was achieved when beverages were flavored.
Electrolytes in Sports Drinks and Water Balance
Electrolytes are ions that form when salts dissolve in fluids (Longe, 2008).
Potassium and sodium are the two primary electrolytes in sports drinks. These
electrolytes can alter the flavor of sports drinks by producing an extremely mild salty
taste. The amount of electrolytes is typically small in relation to the water and sugars that
are included in sports drinks. For example, 591 ml (20 fluid ounce) of an orange flavored
Gatorade contains 250 milligrams of sodium, 65 milligrams of potassium, and 35 grams
of sugar. In addition to altering the taste of sports drinks, sodium and potassium serve
important physiological roles, especially in people who exercise. Sodium affects how
much urine the kidney produces and is involved in the transmission of nerve impulses
and muscle contractions. Potassium ions help to regulate fluid balance in cells, the
transmission of nerve impulses, and in muscle contraction. Lindinger and Sjogaard
(1991) found that increases in interstitial potassium concentrations of contracting muscles
directly stimulate heart rate and the rate of ventilation. In addition, localized potassium
causes a vasodilatation of the vascular bed within contracting muscles. This results in
increased blood flow to isometrically contracted muscles. These responses to potassium
can aid exercise performance. In addition, sodium and potassium have been shown to

11
help retain water to prevent dehydration during exercise (Maughan & Shirreffs, 1997). A
1 to 2% reduction in bodyweight due to loss of water can affect exercise performance due
to potential cramping, dizziness, etc. (Berardi & Andrews, 2010).
Carbohydrates in Sports Drinks
Carbohydrates that provide the sweet taste experienced in sports drinks are also
the primary source of fuel used to power an athlete and help them continue their
workouts when they feel fatigued. Carbohydrates are broken down into glucose
molecules, which provide energy for the body’s cells and tissues (Longe, 2008). The
consumed glucose oxidizes and contributes to energy by preventing a decline in blood
glucose concentrations (hypoglycemia), which may cause fatigue (Davison et al., 2008).
Most commercially available sports drinks have a 4 to 7% carbohydrate to volume of
fluid ratio for optimal nutrition (Ryan, 1997). Carbohydrates are used to create an
ergogenic effect on endurance, which is likely related to sparing of liver glycogen,
prevention of hypoglycemia, as well as maintaining high rates of carbohydrate oxidation
(Jeukendrup, 2008).
Athletes Who Consume Sports Drinks and Effects on Exercise Performance
Many studies have been published that examined the nutritional effects of
consuming sports drinks on athletes leading to improvements in exercise performance. A
study conducted by Lee (2011) tested the effects of sports drinks on endurance capacity.
The sports drinks were administered immediately before, during, and after the exercise
bout with 12 physically active males. Endurance was tested in a second subsequent bout.

12
Subjects adhered to the following pre-trial rules: a standardized dietary intake, avoidance
of strenuous physical activity, abstinence from alcohol 24 hours prior to each trial, an
overnight fast, and ingestion of 500 ml of water 90 min before arriving to the lab;
subjects were also prohibited from drinking liquids thereafter. Subject’s familiarized
themselves with the exercise trial prior to their actual recorded participation. The
experimental protocol consisted of three total exercise trials consisting of three phases a
piece. The participants ingested either water, sports drink, or a placebo in each of the
three trials, respectively. Each trial was randomized and spaced seven days apart,
commencing at the same time of day. The treatments were provided in a double-blind,
cross-over manner between the sports drink and the placebo. The first phase of each trial
consisted of a 75 minute bout of cycling. Portions of test fluid (sports drink, placebo, or
water) equivalent to 1.5 ml/kg of body mass were administered immediately before the
start of the exercise and at 15, 30, 60 and 75 minute mark of the cycling bout. The
second phase of the trial consisted of the five-hour recovery period. The participants
ingested an aliquot of the test fluid (sports drink, placebo, or water) during this period
and the ingestion time was standardized to minimize differences in fluid retention due to
the rate of dehydration. The amount of the test fluid was equivalent to 150% of sweat
volume. Sweat loss estimates were taken from the differences in body mass. The third
and final phase of the trial consisted of the endurance capacity test. The results showed
that endurance capacity after athletes consumed a sports drink was 25.4% greater than
with water and 19.3% greater than with a placebo.
A study by Byars, Keith, Simpson, Mooneyhan, and Greenwood (2010) examined
the effectiveness of a pre-exercise sports drink on aerobic endurance performance (time

13
to exhaustion) during a graded exercise test. Twenty-nine recreationally active college
students volunteered for this investigation using a citrus flavored drink. The ingredients
of this product were aloe vera extract, calcium citrate, L-carnitine, choline bitartrate,
citric acid, fructose, lecithin, lemon oil powder, magnesium aspartate, magnesium
succinate, medium chain triglycerides, potassium aspartate, potassium succinate, silicon
dioxide, gum ghatti, arabinogalactan, and glucosamine hydrochloride. The participants
of this study ran on a treadmill at low intensity and no incline at the beginning of the trial.
At every subsequent three-minute interval, speed and incline increased. Two trials were
conducted within a week of each other with at least 48 hours between trials. Subjects
were asked to adhere to the following pre-test conditions: wear comfortable, loose-fitting
clothing; drink plenty of fluids over the 24-hour period preceding the test; avoid food,
tobacco, alcohol, and caffeine for three hours prior to taking the test; avoid exercise or
strenuous physical activity the day of the test; and get an adequate amount of sleep (6 to 8
hours) the night before the test. Each subject was given the recommended dosage of a
pre-exercise sports drink or a placebo (citrus-flavored water). The results showed a
significant mean difference in time to exhaustion between the group who consumed the
sports drink and the group who did not. Subjects who consumed a pre-exercise sports
drink showed an average of 2.55% increase in time to exhaustion than subjects who
consumed a placebo drink. Therefore, this study observed that aerobic performance
improved and endurance activities enhanced when participants consumed a pre-exercise
sports drink prior to the test.

14
Sports Drink Consumption with Soccer Players
Siegler, Mermier, Amorim, Lovell, McNaughton, and Robergs (2008) focused on
sports drinks and exercise performance, but with an additional test treatment, glycerol.
The addition of glycerol was not relevant to the current study, but other elements of this
study, namely involvement of sports drinks, exercise, and the subjects being soccer
players were relevant. This study used athletes that performed their activities on the field
(i.e., during a scheduled practice), rather than during a separate workout protocol, such as
using a stationary bike or performing drills, like a shuttle run. Two types of sports drinks
were used: one with a 5% carbohydrate solution and another with a combination of 5%
carbohydrate and a low dose of glycerol. Both of these drinks were similar in flavor.
The drinks were supplied in a balanced, double-blind format. The subjects consisted of
ten soccer players. When these individuals arrived at the testing facility, they were asked
to void their bladders and then sit for five minutes to allow for postural stability. The
exercise protocol called for consumption of 500 ml of either the carbohydrate drink or
carbohydrate-glycerol solution before the training session trial, which consisted of four
periods of 15 minutes of training. Temperature measurements were taken at the start of
each trial using a wet bulb thermometer. At the end of the second period (halftime), an
additional 500 ml of sports drink or carbohydrate-glycerol drink was required to be
consumed. At the end of the fourth period, all subjects participated in a structured
endurance test. There was a 48-hour washout period between two trials where the drinks
were alternated for each of the trials. The results of this study showed that there were no
significant differences in time to exhaustion between the 5% carbohydrate drink and the
one with glycerol added. There was no significant difference in endurance performance

15
between the athletes who drank the carbohydrate-glycerol drink and those who drank the
carbohydrate-only drink as noted by the similar times of the time to exhaustion test.
Amount and Timing of Consumption
Many sports drink manufacturers use similar flavor profiles in their drinks. Fruit
punch, lemonade, and orange are some of the more common flavors. Although flavors
may be similar, the discrepancies in taste may make for a large difference in how much
an athlete consumes before and after their workout. If an athlete does not drink enough
fluid that contains carbohydrates and electrolytes, they may not get the benefits of turning
food energy into sustained performance. Carbohydrate consumption is especially critical
for performance. Fielding, Costill, Fink, King, Hargreaves, and Kovaleski (1985)
determined that there may be a minimum amount of 22 grams of carbohydrates per hour
required to observe a performance benefit. Their study showed that when half of this
amount was administered to subjects, no performance benefit was observed. In contrast,
there was a point of sports drink consumption where additional ingestion of
carbohydrates becomes unnecessary. Large amounts of carbohydrate administrations
greater than 75 grams per hour have shown no additional benefits in endurance capacity
(Jeukendrup, 2004). This suggests that there is an optimal and maximal amount of
carbohydrates that provides benefits for athletes. No further enhancement in
carbohydrate bioavailability was speculated to be a potential cause of the limit.
The timing of administration of a sports drink was examined in a 2004 study by
Davidson (2008). This study focused on the endurance effect of consuming a sports drink
beverage 15 minutes prior to exhaustive exercise. Ten recreationally active male subjects

16
volunteered for this randomized, double-blind experiment. The performance test called
for four intermittent shuttle runs of 15 minute blocks. Each block consisted of ten 90
second segments of 3 x 20 minute walks, 1 x 20 minute max sprints, 3 x 20 minute
jogging, and 3 x 20 minute fast runs. The final block was completed to exhaustion. Each
of the participants was provided with either a 6% carbohydrate-electrolyte drink, water,
or no fluid 15 minutes before each trial. No fluid was provided during the test. The
participants were required to follow their usual diet for three days prior to the first trial,
and each trial was spaced seven days apart. The results of the time to exhaustion test
showed that with sports drinks (649 ± 95 seconds) there was a significant improvement in
endurance over the placebo (601 ± 83 seconds) or with no fluids at all (593 ± 107
seconds). Sports drinks taken 15 minutes before exercise can therefore be beneficial to
athletes who compete in activities lasting around an hour or longer.
Summary
To summarize, the review of literature provided information on taste perception
and consumption of sports drinks on athletes. Two methods used to evaluate taste
perceptions are scaling techniques and questionnaires. In the proposed study, a
questionnaire was used to determine taste perceptions on sweetness, saltiness, and
palatability. A scale between 0 and 10 was used to quantify these perceptions.
Carbohydrates and electrolytes have shown to positively benefit exercise performance.
Electrolytes can regulate fluid balance and help to retain water to prevent dehydration.
Carbohydrates serve as fuel that propels subjects to perform longer during events that test
endurance. There is potentially a minimum amount of carbohydrate consumption that

17
provides benefits for endurance capacity. There is also potentially a maximum amount of
consumption, beyond which any additional consumption does not have any advantage on
endurance capacity. Consuming a sports drink in the period just before exercise
improved effects in endurance capacity. In all, this information was used to design the
methods of the study.

18
Chapter 3: Research Methodology
The objective of this study was to determine whether taste can influence how
much of a sports drink is consumed prior to and after sports competition.
Sample Population
Twenty-five ethnically diverse adult male participants, aged 29 to 58 years, from
various men’s soccer recreation leagues in the greater Seattle area were recruited for this
single-blind crossover study.
Research Design
Prior to the start of the study, a recruitment e-mail (see Appendix A) was sent out
to 30 prospective participants informing them of the study protocol, which included a
section discussing specific restrictions on dietary intake and physical activity. These
participants were asked to adhere to these restrictions, which were agreed upon prior to
participation of the study. Participants needed to eat three regular meals (breakfast,
lunch, and dinner) on the days that the study was conducted, as well as the prior day.
They were to have no strenuous physical activity prior to participation on the day of the
study and were to abstain from alcohol 12 hours prior to each trial. They also had to fast
for two hours prior to participation in the study. Participation in this study was
completely voluntary and individuals could choose to decline participation. This
recruitment process occurred through the investigator’s friends and family who have
participated in various men’s soccer recreation leagues. Those who replied that they
were willing to participate were contacted further. Those who chose to participate first

19
read and signed an informed consent agreement (see Appendix B) which was provided, in
person, by the investigator. The study proceeded after all agreements and informed
consent forms were received by the investigator.
For the first part of this study, a taste test survey and sensory evaluation were
conducted that compared the taste preferences between sports drinks from two different
manufacturers. They were designated as “Drink A” and “Drink B.” In addition, two
specific tastes (sweet and salty) as well as palatability of the drinks were analyzed. The
flavor of both drinks was orange in order to keep the tastes similar between the two
products. The ingredients in Drink A’s orange drink were sucrose, dextrose, citric acid,
salt, sodium citrate, natural orange flavor with other natural flavors, monopotassium
phosphate, partially hydrogenated soybean and cottonseed oils, and Yellow 6. The
ingredients in Drink B’s orange drink were water, cane sugar, coconut water concentrate,
vegetable juice, citric acid, natural flavors, and salt. To conceal the identity of the
beverages, the drinks were poured into two color-coded small cups. A different color
represented each manufacturer’s drink.
The test was administered to 25 amateur soccer players who consented to
participate in the study. To keep the participants identity concealed, they were given
random identification (ID) numbers by the investigator, which was used for the taste test
and the subsequent consumption study. Prior to consumption of the first drink, the
participants were given a written questionnaire (see appendices C and D). This
questionnaire was prepared using a combination of a standard taste test questionnaire
from “Sensory Assessment and Food Quality” in Food Quality Evaluation by Rao (2013)
and questions developed in a previous study (Lee et al., 2011), which were modified by
20
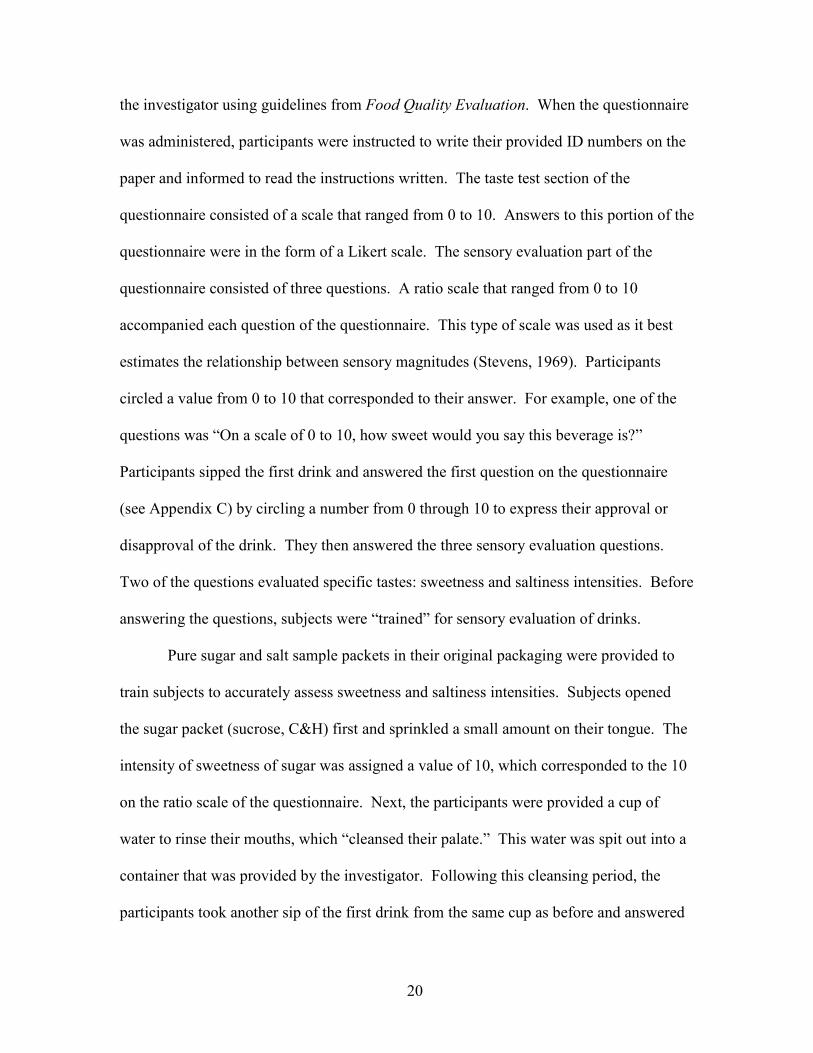
the investigator using guidelines from Food Quality Evaluation. When the questionnaire
was administered, participants were instructed to write their provided ID numbers on the
paper and informed to read the instructions written. The taste test section of the
questionnaire consisted of a scale that ranged from 0 to 10. Answers to this portion of the
questionnaire were in the form of a Likert scale. The sensory evaluation part of the
questionnaire consisted of three questions. A ratio scale that ranged from 0 to 10
accompanied each question of the questionnaire. This type of scale was used as it best
estimates the relationship between sensory magnitudes (Stevens, 1969). Participants
circled a value from 0 to 10 that corresponded to their answer. For example, one of the
questions was “On a scale of 0 to 10, how sweet would you say this beverage is?”
Participants sipped the first drink and answered the first question on the questionnaire
(see Appendix C) by circling a number from 0 through 10 to express their approval or
disapproval of the drink. They then answered the three sensory evaluation questions.
Two of the questions evaluated specific tastes: sweetness and saltiness intensities. Before
answering the questions, subjects were “trained” for sensory evaluation of drinks.
Pure sugar and salt sample packets in their original packaging were provided to
train subjects to accurately assess sweetness and saltiness intensities. Subjects opened
the sugar packet (sucrose, C&H) first and sprinkled a small amount on their tongue. The
intensity of sweetness of sugar was assigned a value of 10, which corresponded to the 10
on the ratio scale of the questionnaire. Next, the participants were provided a cup of
water to rinse their mouths, which “cleansed their palate.” This water was spit out into a
container that was provided by the investigator. Following this cleansing period, the
participants took another sip of the first drink from the same cup as before and answered

21
the questions regarding sweetness. The same design method occurred with the salt
packet (Morton’s), with the salt intensity being assigned a value of 10 on the ratio scale
of 0 to 10. This method was a standard means of conducting sensory evaluations because
it allowed participants a way of comparing what would be considered the highest
intensity of sweetness/saltiness in a sports drink. For example, if pure sugar was
considered a 10 on a scale of 0 to 10 and a participant believed that one of the sports
drinks tasted half as sweet as the sugar packet, then logically they would rate the
sweetness of that drink a 5 on the scale.
After this section of the questionnaire was filled out, each participant consumed
a plain, unsalted cracker and sipped water to cleanse his palate before tasting the second
drink. After this washout period, the participants took a sip of the second drink and
completed the second questionnaire (see Appendix D) which followed the same pattern
as the first. As previously described, the participants did not know the identity of the
drink and the investigator did not know who preferred one drink over another. The
results of the sensory evaluation were recorded, and one drink was determined to be the
preferred drink in terms of taste for that specific individual.
The second part of the study took place on multiple days when participants
engaged in physical activity by voluntarily participating in an indoor recreational league
soccer match, for which they had previously signed up. The average environmental
temperatures recorded were 65° ± 1.0° F (mean ± SE). The same subjects who
participated in the taste test participated in the second part of this study. These
participants were asked to adhere to certain restrictions that were agreed upon prior to
participation of the study, which were outlined earlier in this chapter.

22
On match days, participants were provided with a 64 fluid ounce coded container
(with their assigned number) of orange flavored Drink A or orange flavored Drink B
sports drink or tasteless tap water (as a control) 15 minutes prior to the beginning of their
match. Participants were instructed to drink only from containers with their assigned
numbers. Participants then drank as much fluid as they felt comfortable drinking. The
remaining fluid was retained and later measured using a 2-liter graduated measuring
container. Subsequently, subjects participated in a soccer match and were physically
active.
At the conclusion of the match, subjects were again provided with 64 ounces of
the same drink that was consumed earlier and asked to drink as much as they wanted.
Again, the drinks were poured into clean containers to conceal their identities from the
participants. The remaining fluid was retained and the volume measured using a 2-liter
graduated measuring container. This protocol was repeated at the next match using the
alternative sports drink as the test beverage. A water control was administered at the
following subsequent match. Volumes of sports drinks consumed for all participants was
measured and correlated with their preferred drink. A total of three trials per fluid were
administered and the results were averaged. Subjects who felt ill on any day were
excluded from participation. If a subject was not able to participate on a trial one day, the
trial was made up at the next match until all participants completed three trials of each
drink. In all, there were a total of nine trials per individual.

23
Comparisons and Statistical Analysis
In the first part of this study, preference for taste perception between orange-
flavored Drink A and orange-flavored Drink B of participants was determined. The
second part of the study compared how much of each drink was consumed prior to and
after physical activity. Specifically, an individual’s taste preference was compared to
how much of a beverage they consumed. Therefore, the second part of the method
attempted to identify correlations with the first part (i.e., the drink subjects preferred was
examined with how many milliliters were consumed of the preferred drink compared to
the non-preferred drink). Answers to the sensory evaluation questionnaires were
compared between both drinks. Specifically, sweetness and saltiness intensities of the
drinks as well as palatability were compared and analyzed to see if these traits caused
differences in preferences and consumption levels between two groups: the group that
preferred the taste of Drink A and the group that preferred the taste of Drink B. A paired
t-test was used to determine statistical significance between the differences in the sensory
evaluation of these groups, and another paired t-test was used to determine statistical
significance between preferences of the drinks and levels of consumption of the groups.
SPSS software was used to conduct the statistical analysis.

24
Chapter 4: Results
Twenty-five (n=25) subjects participated in the study. Sixteen (n=16) of the
twenty-five completed the taste test, sensory evaluation, and the three drink consumption
trials with Drink A, Drink B, and water, respectively. Results of those who did not
complete all the trials were not included in the study. All results are provided as mean ±
standard error (SE).
Demographics
The subjects’ average age, height, and weight are shown in Table 1. The average
age of subjects was 42.1 ± 10.5 years, their average height was 67.1 ± 10.5 inches, and
their average weight was 171.6 ± 19.2 pounds.
Table 1
Age, Height, and Weight Demographics of the Subjects
Mean (n = 16)
Age (years) 42.1 ± 10.5
Height (inches) 67.1 ± 4.3
Weight (lbs) 171.6 ± 19.2
Note. Sixteen subjects participated in the study. Age, height, and weight statistics were collected and
averaged. Results are provided as mean ± SE.
Preference for the Sports Drinks
To determine drink taste preference, subjects were provided with samples of both
sports drinks and then asked to evaluate their tastes using written surveys/questionnaires
on a scale of 0 to 10. Zero indicated they extremely disliked the taste, 10 indicated they
extremely enjoyed the taste, and 5 indicated a neutral taste representation. The subject’s
preferred drink was determined by the higher score given between the two drinks on the

25
questionnaires. Seven of the 16 subjects preferred the taste of Drink A (n = 7), while
nine preferred Drink B (n = 9). No subjects rated the tastes of each drink equally.
The subjects who preferred the taste of Drink A rated it with a score of 7.43 on a
scale of 10 for Drink A, which suggested that they enjoyed the taste. They rated the taste
of Drink B as 5.00 on the scale, indicating a neutral taste perception for Drink B. There
was a significant (p = .0001) difference between the taste of Drink A and Drink B for
subjects who preferred the taste of Drink A. Subjects who preferred the taste of Drink B
rated the taste of Drink A as 4.0 on the scale, which suggested a mild dislike of the taste
versus 7.33 for Drink A, which suggested they enjoyed the taste (Table 2). There was a
significant (p = .020) difference between the taste of Drink A and Drink B for subjects
who preferred the taste of Drink B.
Table 2
Taste scores for subjects who preferred the taste of Drink A or Drink B
Preferred Drink A (n = 7) Preferred Drink B (n = 9)
Drink A Taste Score 7.43 ± .787* 4.00 ± 2.64**
Drink B Taste Score 5.00 ± 1.12* 7.33 ± 1.00**
Note. Taste scores from subjects who preferred the taste of either Drink A or Drink B were averaged for
Drink A and Drink B. Scores were based on a scale from 0 to 10, where 0 represents extreme dislike, 10
represents extreme like and 5 is neutral. Paired t-test between the taste scores of Drink A and Drink B
resulted in a significant difference for subjects who preferred the taste of Drink A or Drink B (P<.05).
Results are provided as mean ± SE.
* Taste scores of Drink A and Drink B were significantly different (p = .0001) for subjects who preferred
the taste of Drink A.
** Taste scores of Drink A and Drink B were significantly different (p=.020) for subjects who preferred the
taste of Drink B.
All subjects filled out a questionnaire that evaluated the sweetness, saltiness, and
palatability of the drinks on a scale from 0 to 10. Table sugar and salt samples were
provided for the subjects as references for what constituted a 10 on the sweetness and
saltiness scales. The subjects were grouped based on their taste preferences, and the

26
results were tabulated into an average score. It was then determined whether subjects
who preferred the taste of Drink A or Drink B found the drinks “sweet” or “salty.”
Sweetness of the Drinks
The group that preferred the taste of Drink A reported a sweetness score on their
questionnaire of 6.14 for Drink A and 4.14 for Drink B. The group that preferred the taste
of Drink B reported a sweetness score of 4.44 for Drink A and 5.22 for Drink B (Table
3).
Table 3
Sweetness Scores for Subjects Who Preferred the Taste of Drink A or Drink B
Preferred Drink A (n = 7) Preferred Drink B (n = 9)
Sweetness of Drink A 6.14 ± 0.71 4.44 ± 0.80
Sweetness of Drink B 4.14 ± 0.91 5.22 ± 0.52
Note. Table showing sweetness intensity scores for Drink A and Drink B of subjects who preferred the taste
of Drink A or Drink B. Scores were based on a scale from 0 to 10, where 0 represented no sweetness
relative to sugar, 10 represented the sweetness of sugar, and 5 represented a value that is half as sweet as
sugar. Results are provided as mean ± SE.

27
0
1
2
3
4
5
6
7
8
Preferred Drink A Preferred Drink B
Sc
ale
Drink A
Drink B
Figure 1. Visual display of sweetness results for subjects who preferred the taste of Drink A or Drink B. Bar graph showing sweetness intensity scores for Drink A and Drink B of subjects who preferred the taste
of Drink A or Drink B. No significant differences in sweetness by paired sample t-test were evident (P >
.05) for Drink A and Drink B by subjects who preferred the taste of Drink A or Drink B.
Subjects who preferred the taste of Drink A marked that Drink A was slightly
more than three-fifths as sweet as table sugar and they marked the sweetness of Drink B
to be slightly less than half of that of sugar. Subjects who preferred Drink B marked that
the sweetness of Drink A was slightly less than half the sweetness of sugar and Drink B
was slightly more than half the sweetness of sugar.
The sweetness of a drink may be a trend of taste preference since those subjects
who preferred the taste of Drink A gave sweetness a higher average score for Drink A
than Drink B. Subjects who preferred taste of Drink B marked that Drink B was sweeter
than Drink A. A paired t-test indicated that there was no significant difference between

28
sweetness intensity scores for Drink A and Drink B by subjects who preferred the taste of
Drink A or Drink B.
Saltiness of the Drinks
The group that preferred the taste of Drink A reported a saltiness score on their
questionnaire of 5.29 for Drink A and 4.14 for Drink B. The group that preferred the taste
of Drink B reported a saltiness score of 1.22 for Drink A and 2.20 for Drink B (Table 4).
Table 4
Saltiness Questionnaire Results for Subjects Who Preferred the Taste of Drink A or Drink
B
Preferred Drink A (n = 7) Preferred Drink B (n = 9)
Saltiness of Drink A 5.29 ± 0.68 1.22 ± 0.47
Saltiness of Drink B 4.14 ± 1.03 2.20 ± 0.69
Note. Table showing saltiness intensity scores for Drink A and Drink B of subjects who preferred the taste
of Drink A or Drink B. Scores were based on a scale from 0 to 10, where 0 represented no saltiness
relative to table salt, 10 represented the saltiness of table salt, and 5 represented a value that is half as salty
as table salt. Results are provided as mean ± SE.

29
0
1
2
3
4
5
6
7
Preferred Drink A Preferred Drink B
Scale
Drink A
Drink B
Figure 2. Visual Display of Saltiness Results for Subjects Who Preferred the Taste of Drink A or Drink B.
Bar graph showing saltiness intensity scores for Drink A and Drink B of subjects who preferred the taste of
Drink A or Drink B. No significant differences in saltiness by paired sample t-test were evident (P > .05)
for Drink A and Drink B by subjects who preferred the taste of Drink A or Drink B.
Subjects who preferred the taste of Drink A indicated that Drink A was about half
as salty as table salt. The subjects indicated that Drink B was a little less than half as
salty as pure salt. Subjects preferring the taste of Drink B indicated that Drink A was
barely salty, but they found Drink B to be nearly a quarter as salty as pure salt.
The saltiness of a drink may be a trend of taste preference since those subjects
who preferred the taste of Drink A gave saltiness a higher score for Drink A than Drink
B. Subjects who preferred the taste of Drink B marked that Drink B was saltier than
Drink A. A paired t-test indicated that there was no significant difference between
saltiness intensity scores for Drink A and Drink B by subjects who preferred the taste of
Drink A or Drink B.

30
Palatability of the Drinks
The group that preferred the taste of Drink A reported a palatability score on their
questionnaire of 7.86 for Drink A and 5.29 for Drink B. The group that preferred the taste
of Drink B reported a palatability score of 6.55 for Drink A and 8.11 for Drink B (Table
5).
Table 5
Palatability Questionnaire Results for Subjects Who Preferred the Taste of Drink A or
Drink B
Preferred Drink A (n = 7)
Preferred Drink B (n = 9)
Palatability of Drink A 7.86 ± 0.80 6.55 ± 0.62
Palatability of Drink B 5.29 ± 1.04 8.11 ± 0.65
Note. Table showing palatability scores for Drink A and Drink B of subjects who preferred the taste of
Drink A or Drink B. Scores based on a scale from 0 to 10, where 0 represents that the drink was extremely
difficult to consume, 10 represents the drink was extremely easy to consume and 5 represents that the drink
was neither easy nor difficult to consume. Results are provided as mean ± SE.

31
0
1
2
3
4
5
6
7
8
9
10
Preferred Drink A Preferred Drink B
Sc
ale
Drink A
Drink B
Figure 3. Visual Display of Palatability Results for Subjects Who Preferred the Taste of Drink A or Drink
B. Bar graph showing palatability scores for Drink A and Drink B of subjects who preferred the taste of
Drink A or Drink B. No significant differences in palatability by paired sample t-test were evident (P >
.05) for Drink A and Drink B by subjects who preferred the taste of Drink A or Drink B.
Subjects who preferred the taste of Drink A indicated the palatability of Drink A
was greater and that it was consumed fairly easily. These subjects indicated that Drink B
was neither difficult nor easy to consume. Subjects preferring the taste of Drink B
indicated that Drink A was mildly easy to consume, while Drink B was very easy to
consume.
The palatability of a drink may be a trend of taste preference since subjects who
preferred the taste of Drink A gave palatability a higher score for Drink A than Drink B.
A paired t-test indicated that there was no significant difference between palatability
32
scores for Drink A and Drink B by subjects who preferred the taste of Drink A or Drink
B.
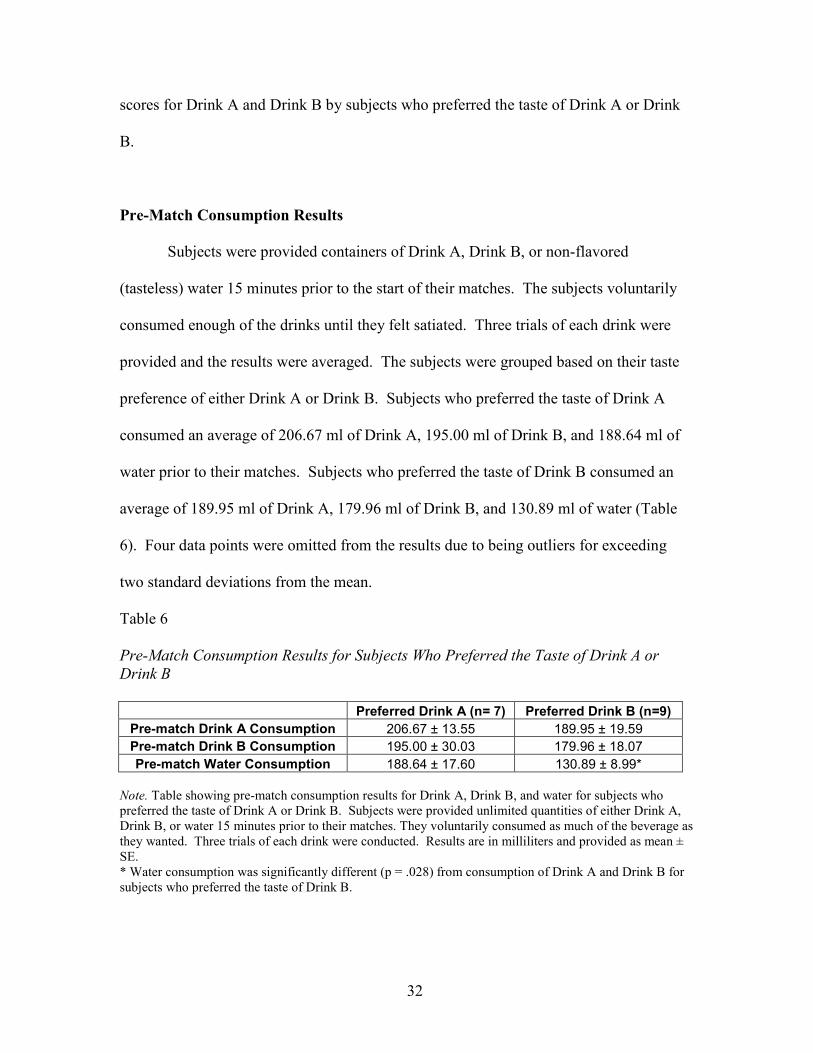
Pre-Match Consumption Results
Subjects were provided containers of Drink A, Drink B, or non-flavored
(tasteless) water 15 minutes prior to the start of their matches. The subjects voluntarily
consumed enough of the drinks until they felt satiated. Three trials of each drink were
provided and the results were averaged. The subjects were grouped based on their taste
preference of either Drink A or Drink B. Subjects who preferred the taste of Drink A
consumed an average of 206.67 ml of Drink A, 195.00 ml of Drink B, and 188.64 ml of
water prior to their matches. Subjects who preferred the taste of Drink B consumed an
average of 189.95 ml of Drink A, 179.96 ml of Drink B, and 130.89 ml of water (Table
6). Four data points were omitted from the results due to being outliers for exceeding
two standard deviations from the mean.
Table 6
Pre-Match Consumption Results for Subjects Who Preferred the Taste of Drink A or
Drink B
Note. Table showing pre-match consumption results for Drink A, Drink B, and water for subjects who
preferred the taste of Drink A or Drink B. Subjects were provided unlimited quantities of either Drink A,
Drink B, or water 15 minutes prior to their matches. They voluntarily consumed as much of the beverage as
they wanted. Three trials of each drink were conducted. Results are in milliliters and provided as mean ±
SE. * Water consumption was significantly different (p = .028) from consumption of Drink A and Drink B for
subjects who preferred the taste of Drink B.
Preferred Drink A (n= 7) Preferred Drink B (n=9)
Pre-match Drink A Consumption 206.67 ± 13.55 189.95 ± 19.59
Pre-match Drink B Consumption 195.00 ± 30.03 179.96 ± 18.07
Pre-match Water Consumption 188.64 ± 17.60 130.89 ± 8.99*
33
0
50
100
150
200
250
Preferred Drink A Preferred Drink B
Am
ou
nt
Co
ns
um
ed
(m
l)
Drink A
Drink B
Water
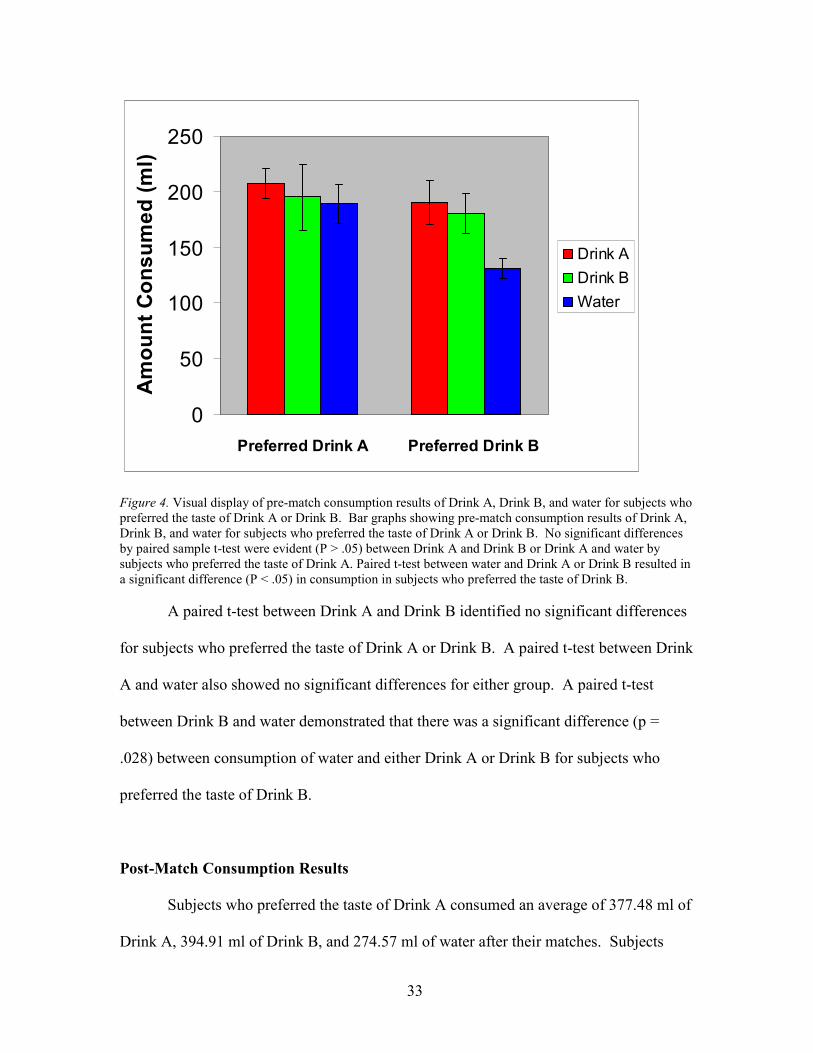
Figure 4. Visual display of pre-match consumption results of Drink A, Drink B, and water for subjects who
preferred the taste of Drink A or Drink B. Bar graphs showing pre-match consumption results of Drink A,
Drink B, and water for subjects who preferred the taste of Drink A or Drink B. No significant differences
by paired sample t-test were evident (P > .05) between Drink A and Drink B or Drink A and water by
subjects who preferred the taste of Drink A. Paired t-test between water and Drink A or Drink B resulted in
a significant difference (P < .05) in consumption in subjects who preferred the taste of Drink B.
A paired t-test between Drink A and Drink B identified no significant differences
for subjects who preferred the taste of Drink A or Drink B. A paired t-test between Drink
A and water also showed no significant differences for either group. A paired t-test
between Drink B and water demonstrated that there was a significant difference (p =
.028) between consumption of water and either Drink A or Drink B for subjects who
preferred the taste of Drink B.
Post-Match Consumption Results
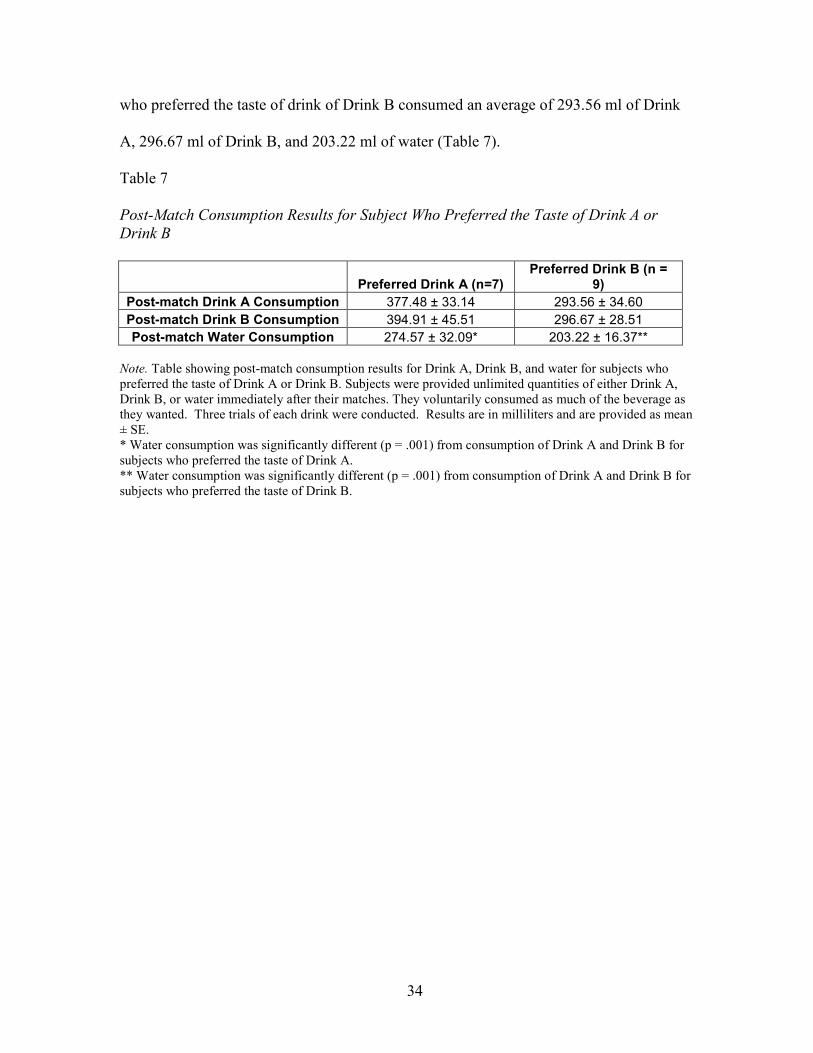
Subjects who preferred the taste of Drink A consumed an average of 377.48 ml of
Drink A, 394.91 ml of Drink B, and 274.57 ml of water after their matches. Subjects
34
who preferred the taste of drink of Drink B consumed an average of 293.56 ml of Drink
A, 296.67 ml of Drink B, and 203.22 ml of water (Table 7).
Table 7
Post-Match Consumption Results for Subject Who Preferred the Taste of Drink A or
Drink B
Preferred Drink A (n=7) Preferred Drink B (n =
9)
Post-match Drink A Consumption 377.48 ± 33.14 293.56 ± 34.60
Post-match Drink B Consumption 394.91 ± 45.51 296.67 ± 28.51
Post-match Water Consumption 274.57 ± 32.09* 203.22 ± 16.37**
Note. Table showing post-match consumption results for Drink A, Drink B, and water for subjects who
preferred the taste of Drink A or Drink B. Subjects were provided unlimited quantities of either Drink A,
Drink B, or water immediately after their matches. They voluntarily consumed as much of the beverage as
they wanted. Three trials of each drink were conducted. Results are in milliliters and are provided as mean
± SE.
* Water consumption was significantly different (p = .001) from consumption of Drink A and Drink B for
subjects who preferred the taste of Drink A.
** Water consumption was significantly different (p = .001) from consumption of Drink A and Drink B for
subjects who preferred the taste of Drink B.
35
0
100
200
300
400
500
Preferred Drink A Preferred Drink B
Am
ou
nt
Co
nsu
med
(m
l )
Drink A
Drink B
Water
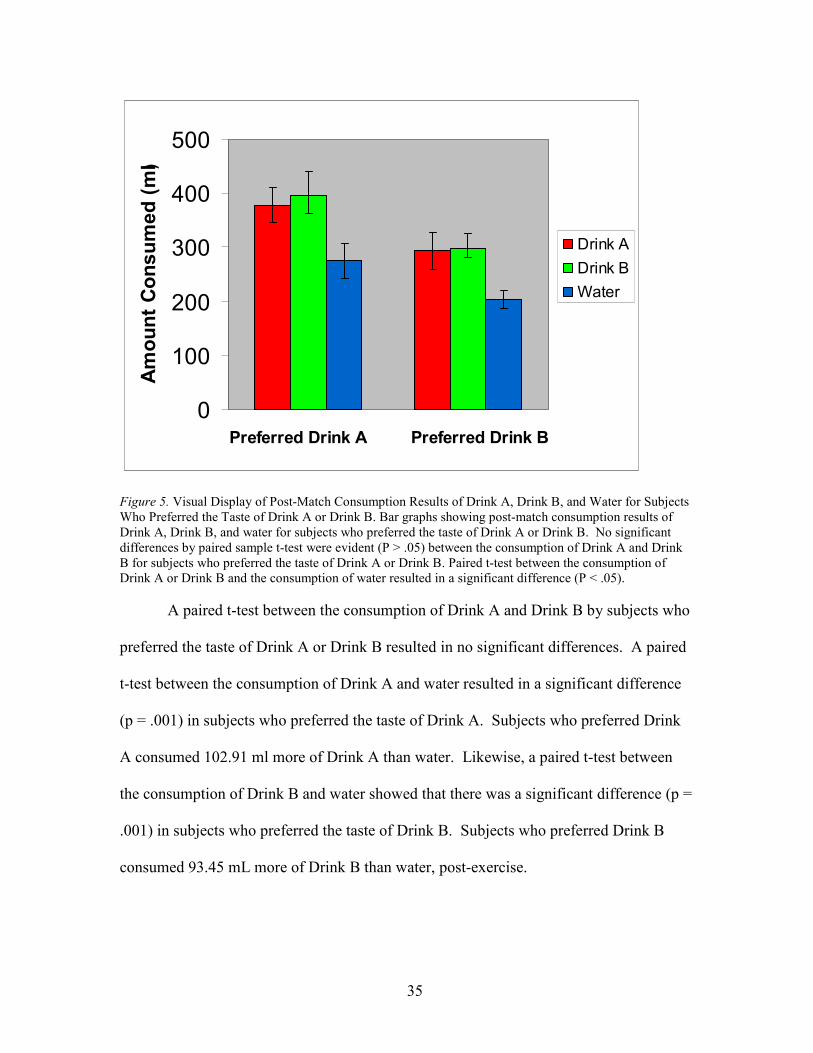
Figure 5. Visual Display of Post-Match Consumption Results of Drink A, Drink B, and Water for Subjects
Who Preferred the Taste of Drink A or Drink B. Bar graphs showing post-match consumption results of
Drink A, Drink B, and water for subjects who preferred the taste of Drink A or Drink B. No significant
differences by paired sample t-test were evident (P > .05) between the consumption of Drink A and Drink
B for subjects who preferred the taste of Drink A or Drink B. Paired t-test between the consumption of
Drink A or Drink B and the consumption of water resulted in a significant difference (P < .05).
A paired t-test between the consumption of Drink A and Drink B by subjects who
preferred the taste of Drink A or Drink B resulted in no significant differences. A paired
t-test between the consumption of Drink A and water resulted in a significant difference
(p = .001) in subjects who preferred the taste of Drink A. Subjects who preferred Drink
A consumed 102.91 ml more of Drink A than water. Likewise, a paired t-test between
the consumption of Drink B and water showed that there was a significant difference (p =
.001) in subjects who preferred the taste of Drink B. Subjects who preferred Drink B
consumed 93.45 mL more of Drink B than water, post-exercise.

36
Chapter 5: Discussion
All subjects distinctly preferred either Drink A or Drink B. Saltiness and
sweetness intensities, as well as the palatability of a drink may be trends of taste
preference. In all cases, the subjects who preferred one drink over the other marked a
higher intensity or palatability on the sensory evaluation questionnaire, on average.
However, paired t-tests indicated that the intensity and palatability results for subjects
who preferred the taste of either Drink A or Drink B were not significantly different for
Drink A or Drink B when compared. A lower than expected number of subjects who
participated in this study may account for the lack of significance. Also, the taste
perception subtleties caused by the amount of sugar and sodium added to these drinks
may not have been apparent to subjects. Drink A used in this study contained 35 grams
of sugar and 250 milligrams of sodium per 591 ml (20 fluid ounces). Drink B contained
33 grams of sugar and 125 milligrams of sodium per 591 ml (20 fluid ounces). Drink A
only contained two grams more sugar and although Drink A had twice as much sodium
than Drink B, the relative amount of sodium to other taste altering nutrients may have
caused the perception of saltiness intensity difficult to distinguish between the two
drinks.
The study conducted by Lee (2011) showed no significant differences in saltiness
intensities and palatability between two similarly flavored drinks when subjects rated
each on a questionnaire, which corroborates with the above results. It may be proposed
that subjects perceive saltiness and palatability of similarly flavored drinks as equal,
independent of taste preferences. The study found sweetness to be perceived higher in a

37
carbohydrate drink, as opposed to an artificially sweetened drink with no carbohydrates.
The study did not use taste preferences as a factor between these drinks.
The pre-match consumption by subjects who preferred the taste of Drink A or
Drink B was not significantly different between Drink A and Drink B. Subjects
consumed significantly more of Drink B than water, but there were no significant
differences between the consumption of Drink A and water. The subjects who preferred
the taste of Drink B had two additional subjects and therefore a higher number of data
points. The post-match consumption results for subjects who preferred the taste of Drink
A or Drink B also showed no significant differences between the consumption of Drink A
and Drink B. It may be suggested that thirst was a stronger factor in consumption of the
two drinks than taste preference. Subjects may have exerted more energy during one trial
as opposed to another trial causing them to lose more water through sweat and inciting a
stronger response to thirst independent of whether they enjoyed the taste of one drink to
the other. However, there was a significant difference in the level of consumption
between both Drink A and Drink B with water in both groups, irrespective of taste
preference. Participants preferred to drink the sports drinks compared to water.
When consuming a product, subjects may interpret the taste of an unknown drink
similarly. For example, both drinks were scored on the questionnaire as high in
sweetness and palatability, while low in saltiness between the groups that preferred the
taste of Drink A and Drink B, respectively. Thus, when subjects consumed a flavored
drink, they drank based on how easy the drink was to consume and the fact that it was
relatively sweet. This can further be explained by subjects consuming far less water,
which contains no taste intensities (i.e., sugar, sodium), compared to Drink B of the pre-

38
match consumption period and compared to both Drink A and Drink B of the post-match
periods. These results corroborate the findings in the study by Ali (2011) that athletes
drink significantly less water than flavored drinks.
Greater voluntary intake of flavored beverages has previously been reported in the
literature (Passe, Horn, & Murray, 1998). In the study by Ali (2011), the investigator
conducted taste surveys on flavored drinks and water. The results showed no significant
differences in taste preference between flavored drinks and water. This may indicate that
taste has no bearings on how much a flavored drink is consumed in relation to tasteless
water. One study by Horswill (1988) postulated that water suppresses thirst signals
before enough fluid has been consumed to completely replace fluid loss. Another study
(Wilk, Kriemler, Keller, & Bar-Or, 1998) discussed that a lack of sodium chloride in
water may diminish the osmotic drive for drinking. A third study (Nose, Mack, Shi, &
Nadel, 1988) speculated that a lack of flavoring may provide fewer stimuli for voluntary
fluid intake of water. The present study did not conduct a taste test with water.
Fielding (1985) determined that there may be a minimum amount of 22 grams of
carbohydrates per hour required to observe performance benefits. A study by Maughan,
Bethell, and Leiper (1996) determined that 16 grams of carbohydrates per hour was
sufficient to provide performance benefits. The study found that ingesting 16 grams of
carbohydrates per hour improved endurance capacity of subjects by 14% compared to
water. In the current study, Drink A contained 38 grams of carbohydrates per 591 ml of
the beverage and Drink B contained 33 grams of carbohydrates per 591 ml. Subjects who
preferred the taste of Drink A thus consumed a pre-match average of 13.29 grams of
carbohydrates for Drink A and 10.61 grams for Drink B. Subjects who preferred the taste

39
of Drink A consumed a post-match average of 24.27 grams of carbohydrates for Drink A
and 16.39 grams for Drink B. According to the Fielding (1985) and Maughan (1996)
studies, subjects who preferred the taste of Drink A did not ingest enough carbohydrates
during their pre-match consumption of either Drink A or Drink B to provide performance
benefits. However, these subjects ingested the minimum amount of carbohydrates during
their post-match consumption of Drink A and Drink B necessary for performance
benefits.
Subjects who preferred the taste of Drink B consumed a pre-match average of
12.54 grams of carbohydrates for Drink A and 10.05 grams for Drink B. Subjects who
preferred the taste of Drink A consumed a post-match average of 25.39 grams of
carbohydrates for Drink A and 16.56 grams for Drink B. Similar to the subjects who
preferred the taste of Drink A, subjects who preferred Drink B did not ingest enough
grams of carbohydrates during their pre-match consumption of either Drink A or Drink
B, but ingested the minimum amount of carbohydrates during their post-match
consumption of Drink A and Drink B necessary for performance benefits.
When combining pre- and post-match consumption, subjects who preferred the
taste of Drink A consumed 37.56 grams of carbohydrates for Drink A and 27.00 grams
for Drink B. Subjects who preferred the taste of Drink B consumed 37.93 grams of
carbohydrates for Drink A and 26.61 grams for Drink B. Both groups of subjects
consumed the minimum amount of carbohydrates per hour necessary for performance
benefits for both Drink A and Drink B. In addition, neither group eclipsed the 75 grams
of carbohydrates that results in no additional performance benefits according to a 2004
article by Jeukendrup (2008). In the current study, subjects performed in their matches

40
for one hour. If they were to continue playing for much longer periods of time, then
higher sports drink consumption would be necessary for performance benefits. Table 8
summarizes the amount of carbohydrates ingested for Drink A and Drink B by subjects
who preferred the taste of Drink A or Drink B pre-match, post-match, and a combination
of pre- and post-match.
Table 8
Carbohydrate Intake for Subjects Who Preferred the Taste of Drink A or Drink B Pre-
Match, Post-Match, and a Combination of Pre- and Post-Match
Preferred Drink A (n=7) Preferred Drink B (n =
9)
Pre-match Drink A 13.29 12.54
Pre-match Drink B 10.61 10.05
Post-match Drink A 24.27 25.39
Post-match Drink B 16.39 16.56
Combined pre- and post match Drink A 37.56 37.93
Combined pre- and post match Drink B 27.00 26.61
Note. Carbohydrate intake between subjects that preferred the taste of Drink A or Drink B. Pre-match,
post-match, and a combination of pre- and post match carbohydrate intake was calculated. When pre- and
post-match amount are combined, both groups obtained the necessary amount of carbohydrates for Drink A
and Drink B. Amounts are in grams and provided as a mean.
A study by Wallis, Yeo, Blannin, and Jeukendrup (2007) showed that the highest
rates of exogenous glucose oxidation and the greatest endogenous carbohydrate sparring
was observed when carbohydrates were ingested at rates of 60 grams per hour during
exercise. No group in the pre-match, post-match, or in the pre- and post-match combined
for Drink A or Drink B consumed enough carbohydrates to reach this optimal level.
However, as evident from Table 8, both groups consumed approximately similar amounts
of carbohydrate prior to or after a match.
There were no significant differences between the amounts of Drink A and Drink
B consumed by subjects who preferred the taste of either Drink A or Drink B. Thus, the

41
hypothesis that subjects who preferred one drink over the other would consume
significantly more of the preferred drink was disproved.
Limitations in this study included a small sample size due to poor attendance by
some subjects, inconsistent level of physical activity, and potential past drink recognition
creating bias toward one or both drinks.
There were a total of 16 subjects who completed all three consumption study
trials of Drink A, Drink B, and water. Some subjects did not complete all the trials
because they did not show up to several of the matches due to unspecified reasons. This
resulted in a smaller sample size than anticipated. A larger sample may have been a
better indicator of how a population may react to consuming a sports drink with regards
to taste.
In future taste and consumption studies, increasing the sample size could result in
a better understanding of how the two variables may correlate. To retain more of the
initial subjects, a monetary sum or other incentive could be provided to the subjects if
they agree to attend all of their research appointments to completion.
The subjects were on the field exerting physical activity for one hour each game.
The physical activity included running, jumping, kicking, diving, walking, and sprinting.
In the one hour period, most subjects were mainly running and occasionally sprinting.
Short periods of walking were observed at times between the running and sprinting. The
goalie of each team rarely ran and was observed to exert less energy than the other
subjects. The level of physical exertion may have affected post-workout drink
consumption during each game. Due to the nature of the game, it was difficult to account
for equal levels of physical exertion during each game. For example, in one game, a

42
subject may exert more energy toward the end of the game than the beginning, and in
another game, the subject may exert more energy in the beginning of the game than the
end.
In future studies, the methodology of how the subjects exert energy could be
changed to display a higher level of consistency. One example of this could be running
on a treadmill for a specific amount of time at a specific speed and duration.
While all precautions were taken into account to prevent the subjects from
identifying the drinks, potential identification may have occurred due to recognizing the
taste of one or both drinks prior to the study. Drink A is a well known sports drink that
many individuals who exercise consume regularly. Drink B markets their product
specifically for soccer players and some of the subjects may have previously consumed
the drink. On one occasion during the taste test portion of the study, a subject informed
the investigator that he may have known the identity of both of the drinks. The
investigator asked the subject to not reveal his beliefs to the investigator as this would
create bias in the study. If a subject believed he knew the identity of a drink, they may
have provided a taste score that was different than if the subject did not know the
identity. In addition, during the consumption phase of the study, a subject may have
consumed more or less of a drink if they were aware of the brand they were consuming.
In future studies, to help prevent prior drink recognition bias, investigators could
use less widely recognized brands from smaller manufacturers. Although this method
would not ensure a complete absence of bias since less known brands could still be
recognized by some subjects, it would help reduce the recognition potential.

43
To better utilize water as the control drink, future studies should consider
performing a taste test on water prior to the consumption study. Although water is
assumed to be tasteless due to a lack of taste intensities, it should not be assumed that the
taste of water is enjoyed or disliked by people.
In conclusion, although subjects had distinct preferences for drink A or drink B,
there were no significant differences between the taste perceptions of sweetness,
saltiness, and palatability between subjects who preferred the taste of Drink A or Drink
B. Similar levels of sugar in both drinks and relatively low sodium additions compared
to other nutrients may have been a factor. There were also no significant differences
between consumption levels of Drink A and Drink B between subjects who preferred the
taste of either Drink A or Drink B. The thirst mechanism may have been a stronger
factor to consumption, independent of taste preference. Subjects did not consume enough
of either Drink A or Drink B pre-match to receive performance benefits, regardless of
taste preferences. When pre- and post-match consumption of sports drinks are combined,
both groups that preferred the taste of one drink over the other received enough
carbohydrates to generate performance benefits had they continued performing in a
match beyond one hour. Changes that could improve this study include providing a
monetary sum or some other incentive to subjects to promote better attendance thereby
increasing data; standardizing the exercise portion, so that all subjects exert a similar
amount of energy throughout all trials; preventing taste recognition by using smaller
sports drink manufacturers that subjects are unfamiliar with; and adding water to the taste
test portion of the study.

44
References
Ali, A., Duizer, L., Foster, K., Grigor, J., & Wei, W. (2011). Changes in sensory
perception of sports drinks when consumed pre, during and post exercise. Physiology
& Behavior. 102(5), 437-443.
Bartoshuk, L.M. (2000). Comparing sensory experiences across individuals: Recent
psychophysical advances illuminate genetic variation in taste perception. Chemical
Senses, 25(4), 447-460.
Berardi J., & Andrews R. (2010). The Essentials of Sport and Exercise Nutrition.
Toronto, CAN: Precision Nutrition.
Byars, A., Keith, S., Simpson, W., Mooneyhan, A., & Greenwood, M. (2010). The
influence of a pre-exercise sports drink of factors related to maximal aerobic
performance. Journal of the International Society of Sports Nutrition, 7, 12.
Caldwell, J. (1997, April 21). Sports Drinks: Are they effective in improving athletic
performance? Retrieved from
http://www.vanderbilt.edu/AnS/psychology/health_psychology/gatorade.htm
Davison, G.W., McClean, C., Brown, J., Madigan, S, Gamble, D., Trinick, T., & Duly, E.
(2008). The effects of ingesting a carbohydrate-electrolyte beverage 15 minutes prior
to high-intensity exercise performance. Research in Sports Medicine, 16(3), 155-166.
Fechner, G.T. (1860). Elemente der pychophysik. Leipzig, Germany: Breitkopf und
Härterl.

45
Fielding, R.A., Costill, D.L., Fink, W.J., King, D.S., Hargreaves, & M., Kovaleski, J.E.
(1985). Effects of carbohydrate feeding frequencies and dosage on muscle glycogen
use during exercise. Medicine& Science in Sports & Exercise, 17(4), 472-476.
Friedman, R., Elliot, A.J. (2008). Exploring the influence on sports drink exposure on
physical endurance. Psychology o f Sport and Exercise, 9(6), 749–759.
Horswill, C.A. (1988). Effective fluid replacement. International Journal of Sport
Nutrition, 8(2), 175-195.
Jeukendrup, A.E. (2008). Carbohydrate feeding during exercise. European Journal of
Sport Science, 8(2), 77-86.
Jeukendrup, A.E. (2004). Carbohydrate intake during exercise and performance.
Nutrition, 20(7-8), 669-677.
Johnson, A.K., & Thornhorst, R.L. (1997). The neuroendocrinology of thirst and salt
appetite: Visceral sensory signals and mechanisms of central integration. Frontiers in
Neuroendocrinology, 18(3), 292-353.
Kays, J., & Philips-Han, A. (2003). Gatorade: The idea that launched an industry.
Retrieved from
http://www.research.ufl.edu/publications/explore/v08n1/gatorade.html.
Lee, J.K.W., Nio, A.Q.X., Ang, W.H., Law, L.Y.L., & Lim, C.L. (2011). Effects of
ingesting a sports drink during exercise and recovery on subsequent endurance
capacity. European Journal of Sport Science, 11(2), 77-86.
Lindemann, B. (1996). Taste reception. Physiological Reviews, 76(3), 718–766.

46
Lindinger, M.I., & Sjogaard, G. (1991). Potassium regulation during exercise and
recovery. Sports Medicine, 11, 382-401.
Longe, J.L. (2008). Carbohydrates. In Gale encyclopedia of diets: Guide to health and
nutrition. (Vol. 1, pp. 170-173). Detroit, MI: Thomas Gale.
Longe, J.L. (2008). Electrolytes. In Gale encyclopedia of diets: Guide to health and
nutrition. (Vol. 1, pp. 342-346). Detroit, MI: Thomas Gale.
Maughan, R.J., Bethell, L.R., & Leiper, J.B. (1996). Effects of ingested fluids on
exercise capacity and on cardiovascular and metabolic responses to prolonged
exercise in man. Experimental Physiology, 81(5), 847-859.
Maughan, R.J., & Shirreffs, S.M. (1997). Recovery from prolonged exercise: restoration
of water and electrolyte balance. Journal of Sports Sciences. 15(3), 297–303.
Minehan, M.R., Riley, M.R., & Burke, L.M. (2002). Effect of flavor and awareness of
kilojoule content of drinks on preference and fluid balance in team sports.
International Journal of Sport Nutrition and Exercise Metabolism, 12(1), 81-92.
Mintel. (2012). The US Sports Drink Market - September 2012. Retrieved March 3 2013
from Mintel Reports database.
Nose, H., Mack, G.W., Shi, X.R., & Nadel, E.R. (1998). Role of osmolality and plasma
volume during rehydration in humans. Journal of Applied Physiology, 65(1), 325-
331.
Passe, D.H., Horn, M., & Murray, R. Effect of beverage palatability on voluntary fluid
intake during exercise. (1998). Medicine & Science in Sports & Exercise, 30, S156.
47
Position of the Academy of Nutrition and Dietetics, Dietitians of Canada, and the
American College of Sports Medicine: Nutrition and Athletic Performance. (2009).
Journal of the American Dietetic Association, 109(3), 509-526.
Rao, E.S. (2013). Sensory Assessment of Food Quality. In Food Quality Evaluation (pp.
35-56). Variety Books.
Ryan, M. (1997). Sports drinks: Research asks for reevaluation of current
recommendations. Journal of the American Dietetic Association, 97(10), S197-S198.
Scott, T.R., Yan, Y., & Rolls, E.T. (1995). Brain mechanisms of satiety and taste in
macaques. Neurobiology, 3(3-4), 281-292.
Siegler, J.C., Mermier, C.M., Amorim, F.T., Lovell, R.J., McNaughton, L.R., & Robergs,
R.A. (2008). Hydration, thermoregulation, and performance effects of two sports
drinks during soccer training sessions. The Journal of Strength and Conditioning
Research, 22(5), 1394-1401.
Stevens, S.S. (1961). To honor Fechner and repeal his law: a power function, not a log
function, describes the operating characteristics of a sensory system. Science,
133(3446), 80-86.
Stevens, S.S. (1969). Sensory scales of taste intensity. Perceptions & Phychophysics,
6(5), 302-308.
Von Duvillard, S.P., Braun, W.A., Markofski, M., Beneke, R., & Leithäuser, R. (2004).
Fluid and hydration in prolonged endurance performance. Nutrition, 20(7-8), 651-
656.

48
Wallis, G.A., Yeo, S.E., Blannin, A.K., & Jeukendrup, A.E. (2007). Dose-response
effects of ingested carbohydrate on exercise metabolism in women. Medicine and
Science in Sport and Exercise, 39, 131-138.
Wilk, B.S., Kriemler, S., Keller, H., & Bar-Or, O. (1998). Consistency in preventing
voluntary dehydration in boys who drink a flavored carbohydrate-NaCl beverage
during exercise in the heat. International Journal of Sport Nutrition, 8(1), 1-9.

49
Appendix A: Recruitment E-mail
Hello,
My name is Kiarash Molavi and I am a graduate student earning my master’s
degree in human nutrition at Eastern Michigan University. I am currently working on my
thesis project and I would like to invite you to participate in a research study on taste
perceptions and consumption levels on male recreational soccer players. The correlation
between taste preferences and consumption of two commercially available sports drinks
will be investigated. Participation in this research is completely voluntary and you may
opt out of the project at any time. Your names and personal information will be kept
confidential during this study. You will be required to sign an informed consent form
prior to participation. There are a few stipulations that must be agreed upon and followed
in order to participate. The stipulations are as follows:
• Do not eat or drink any food or water in the two hours before arriving to the
facility on match days.
• Do not drink alcohol for at least 12 hours prior to participating in the study.
• Do not engage in extreme physical activity for at least 12 hours prior to
participating in the study.
• Arrive at the facility at least 20 minutes prior to the start of the match in order to
have sufficient time to participate in the study.
In addition to the above stipulations, participants are requested to consume an
unspecified dietary intake of three regular meals (breakfast, lunch, and dinner) on the
days the study will be conducted. There will be two parts to this study. The first part is a
taste test between the two sports drinks. Participants will fill out a short taste

50
questionnaire after the taste test. This is estimated to take about 4 - 7 minutes. This part
of the study will only occur one time. The second part of the study is a consumption
evaluation of the sports drinks. Participants will be provided 64 fluid ounce drinks in
clean containers. They will be asked to consume the drinks prior to, during, and after
participation in a men’s recreational league soccer match. The remaining balance of the
drinks will be collected, to be measured later by the researcher. For this part of the study,
there will be 9 total trials which will happen on match days. For three of the trials, water
will be provided (as a control) rather than sports drinks. The purpose of this research
study is to examine the relationship between taste and consumption of two different
sports drinks with regard to performing in an endurance activity. Specifically, I am
researching how taste preferences of participants affect their overall consumption of a
sports drink.
I will be providing the drinks free of charge to everyone who chooses to
participate in the study. If you have any questions or would like to see a copy of the
informed consent, please contact the investigator via e-mail at [email protected].
Further details of this study will be provided to you at a later date if you choose to
participate.
Thank You,
Kiarash Molavi

51
Appendix B: Informed Consent
INFORMED CONSENT FOR PARTICIPATION IN RESEARCH
Influence of Sports Drink Taste Preference on Consumption in Adult
Male Soccer Players Kiarash Molavi, Eastern Michigan University – Principal Investigator
1. Purpose of Study and How Long It Will Last: The purpose of this research study is to
examine the relationship between taste and consumption of two different sports drinks with
regard to performing in an endurance activity. Specifically, the investigator is researching how
taste preferences of participants affect their overall consumption of a sports drink. The first part
of this study is a taste test between two sports drinks. Participants will fill out a short taste
questionnaire during the test. This is estimated to take about 4 - 7 minutes. The second part of the
study is a consumption evaluation of the sports drinks. Participants will be provided 64 fluid
ounce drinks, which will be poured into clean containers, and asked to consume the drink prior to,
at half-time, and after participation in a men’s recreational league soccer match. The time it will
take to drink the beverage is estimated to take about two minutes each time.
2. Participation Withdrawal or Refusal to Participate: Participation in this study is completely
voluntary and you may choose to quit the research project at any time without any penalty.
3. Description of Study Procedures: To complete the first part of the study, you will meet at the
facility where the match is played. The investigator will provide two sports drinks that will be
poured into small clean cups that will have either a red or black dot drawn on the cup (for
identifying purposes). You will drink from one of the cups, and then fill out a taste-test/sensory
evaluation questionnaire. You will then eat an unsalted cracker and rinse your mouth with water.
You will then drink the other sports drink from the second cup and finish filling out the
questionnaire. Samples of sugar and salt in their original packaging will be provided in order to
help participants evaluate taste sensations of “sweet” and “salty” and answer the questionnaire.
This questionnaire will only be completed one time.
The second part of the study occurs on nine match days that participants voluntarily
participate in. When you arrive at the facility where you will play in a match, you will be
provided with 64 fluid ounces of either one of two different sports drinks or water which will be
poured into clean containers. These drinks will have the standard ingredients found in
commercial sports drinks or water. You will be asked to consume as much of the beverage to the
point that they feel satiated (satisfied). Following the consumption, the principal investigator will
collect the containers for measurement of the remaining liquid at a later time. During halftime
and after the match or practice, you will again be provided with 64 ounces of a sports drink or
water and asked to consume enough where you feel satiated. Afterwards, the containers will be
collected again for measurement of the remaining liquid at a later time.
Ingredients in sports drink #1: Water, Cane Sugar, Coconut Water Concentrate, Vegetable Juice
(Color), Citric Acid, Natural Flavors, Salt.
Ingredients in sports drink #2: Sucrose, Dextrose, Citric Acid, Salt, Sodium Citrate, Natural
Orange Flavor with Other Natural Flavors, Monopotassium Phosphate, Partially Hydrogenated
Soybean and Cottonseed Oils, Yellow 6

52
_____ I agree to participate in this study and to allow Kia Molavi to provide sports drinks, water,
crackers, and salt/sugar packets for a test taste (part 1). I allow Kia Molavi to provide sports
drinks and water before, during half-time, and after (part 2). I understand that my name and
identifying information will not be included in the database analyzed for this study.
4. Guidelines of participation: A requirement of participation is to follow these guidelines
which correspond to activities occurring prior to participation in the study:
• Do not eat or drink any food or water in the two hours before arriving to the facility on
match days.
• Do not drink alcohol for at least 12 hours prior to participating in the study.
• Do not engage in extreme physical activity for at least 12 hours prior to participating in
the study.
• Arrive at the facility at least 20 minutes prior to the start of the match in order to have
sufficient time to participate in the study.
_____ I agree to follow the guidelines mentioned above to the best of my abilities.
5. Confidentiality of Information Obtained: Results of the surveys and amount of drink
consumed will be kept confidential. You will be given a random identification number for
identification purposes and the researcher will use this number on all survey materials. Individual
survey responses and drink consumption amounts will be kept separately from any identifying
information. All information obtained will be stored in a folder and kept in a locked cabinet
accessed only by the principal investigator. Information from this study may be reported or
published in aggregate form, but your identity will be kept confidential in any publications or
presentations.
6. Expected Risks of the Study: There are no known or anticipated risks for participating in the
study. All consumables (i.e. drinks, salt/sugar samples) will be in their factory sealed containers
prior to administration thereby minimizing any potential risk from possible containments in the
products. Sports drinks will be poured into clean containers prior to administration.
Disclaimer: Although every precaution will be taken by the investigator to ensure the safety of
the consumables, the investigator will not be responsible for any manufacturing flaws that could
lead to potential illness from the consumables. All products provided are commercially available
in the marketplace.
Allergy Warning: A list of all ingredients in the drinks is provided above. If you are allergic or
sensitive to any of the ingredients, do not participate in the study.
7. Expected Benefits of the Study: There are no direct benefits expected to the participants. The
rationale for conducting this study is to provide some information on taste perception and sports
drink consumption.
8. Compensation: Sports drinks will be provided to you free of charge to participate in this study.
There will be no additional compensation provided.
9. Use of Research Results: Findings from this study may be published in journals and may also
be presented at professional conferences. Research results from this study will be used in
aggregate form and participants will not be individually identified. Research results will be
submitted to EMU as part of a thesis analysis.

53
10. Future Questions: If, at any time, you have questions about study procedures or your
participation in the study, please contact the principal investigator (Kiarash Molavi; Phone: 206-
818-2452; Email: [email protected]).
11. Human Subjects Review Board: This research protocol and informed consent document has
been reviewed and approved by the Eastern Michigan University Human Subjects Review
Committee for use from _________ to _________. If you have questions about the approval
process, please contact Jayne Yatczak (734.487.0461, [email protected]).
CONSENT TO PARTICIPATE: I understand my rights as a research participant and I
voluntarily consent to participate in this study and follow its requirements. I additionally
understand the purpose, intent, and necessity of the present study. I will receive a copy of this
consent form for my future reference.
________________________________ ______________ Participant Signature Date
_______________________________ Participant Name (Print)
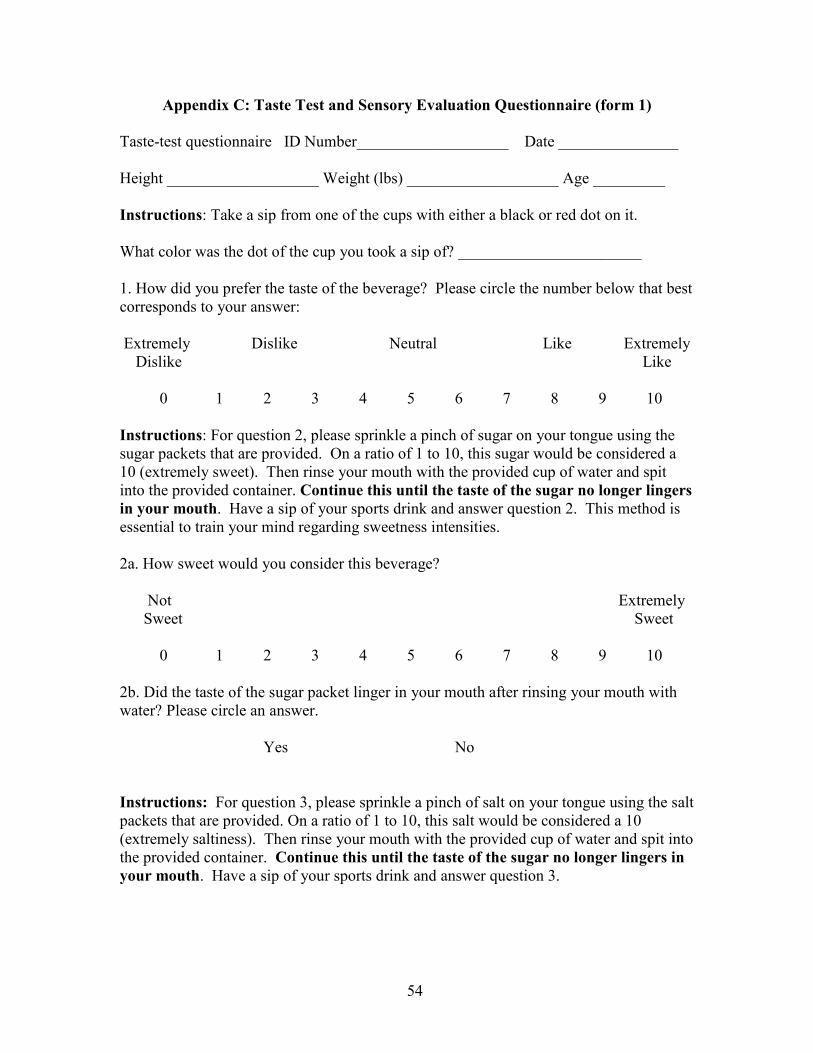
54
Appendix C: Taste Test and Sensory Evaluation Questionnaire (form 1)
Taste-test questionnaire ID Number___________________ Date _______________
Height ___________________ Weight (lbs) ___________________ Age _________
Instructions: Take a sip from one of the cups with either a black or red dot on it.
What color was the dot of the cup you took a sip of? _______________________
1. How did you prefer the taste of the beverage? Please circle the number below that best
corresponds to your answer:
Extremely Dislike Neutral Like Extremely
Dislike Like
0 1 2 3 4 5 6 7 8 9 10
Instructions: For question 2, please sprinkle a pinch of sugar on your tongue using the
sugar packets that are provided. On a ratio of 1 to 10, this sugar would be considered a
10 (extremely sweet). Then rinse your mouth with the provided cup of water and spit
into the provided container. Continue this until the taste of the sugar no longer lingers
in your mouth. Have a sip of your sports drink and answer question 2. This method is
essential to train your mind regarding sweetness intensities.
2a. How sweet would you consider this beverage?
Not Extremely
Sweet Sweet
0 1 2 3 4 5 6 7 8 9 10
2b. Did the taste of the sugar packet linger in your mouth after rinsing your mouth with
water? Please circle an answer.
Yes No
Instructions: For question 3, please sprinkle a pinch of salt on your tongue using the salt
packets that are provided. On a ratio of 1 to 10, this salt would be considered a 10
(extremely saltiness). Then rinse your mouth with the provided cup of water and spit into
the provided container. Continue this until the taste of the sugar no longer lingers in
your mouth. Have a sip of your sports drink and answer question 3.

55
3. How salty would you consider this beverage?
Not Extremely
Salty Salty
0 1 2 3 4 5 6 7 8 9 10
3b. Did the taste of the salt packet linger in your mouth after rinsing your mouth with
water? Please circle an answer.
Yes No
Instructions: Take a gulp of the drink and answer question 4
4. How palatable (easily consumed) would you consider this drink?
Hard to Consumed
Drink Easily
0 1 2 3 4 5 6 7 8 9 10
Wash-out period Instructions: Eat a plain, unsalted cracker and rinse your mouth out
with water.

56
Appendix D: Taste Test and Sensory Evaluation Questionnaire (form 2)
Instructions: Take a sip from the cup with the colored dot that you did NOT take a sip
from in form 1. (i.e. if you took a sip from a cup with a blue dot, then take a sip from a
cup with a black dot)
What color was the dot of the cup you took a sip of? _______________________
1. How did you prefer the taste of the beverage? Please circle the number below that best
corresponds to your answer:
Extremely Dislike Neutral Like Extremely
Dislike Like
0 1 2 3 4 5 6 7 8 9 10
Instructions: For question 2, please sprinkle a pinch of sugar on your tongue using the
sugar packets that are provided. On a ratio of 1 to 10, this sugar would be considered a
10 (extremely sweet). Then rinse your mouth with the provided cup of water and spit
into the provided container. Continue this until the taste of the sugar no longer lingers
in your mouth. Have a sip of your sports drink and answer question 2. This method is
essential to train your mind regarding sweetness intensities.
2a. How sweet would you consider this beverage?
Not Extremely
Sweet Sweet
0 1 2 3 4 5 6 7 8 9 10
2b. Did the taste of the sugar packet linger in your mouth after rinsing your mouth with
water? Please circle an answer.
Yes No
Instructions: For question 3, please sprinkle a pinch of salt on your tongue using the salt
packets that are provided. On a ratio of 1 to 10, this salt would be considered a 10
(extremely saltiness). Then rinse your mouth with the provided cup of water and spit into
the provided container. Continue this until the taste of the sugar no longer lingers in
your mouth. Have a sip of your sports drink and answer question 3.

57
3. How salty would you consider this beverage?
Not Extremely
Salty Salty
0 1 2 3 4 5 6 7 8 9 10
3b. Did the taste of the salt packet linger in your mouth after rinsing your mouth with
water? Please circle an answer.
Yes No
Instructions: Take a gulp of the drink and answer question 4
4. How palatable (easily consumed) would you consider this drink?
Hard to Consumed
Drink Easily
0 1 2 3 4 5 6 7 8 9 10

58
Appendix E Human Subjects Approval Letter
6/26/14
Dear Kiarash,
Congratulations! After careful review, your proposal "Influence of taste of sports drinks
on their consumption in adult male soccer players" has been accepted by the College of
Health and Human Services Human Subjects committee.
The current version of your submission is available here:
http://commons.emich.edu/cgi/preview.cgi?article=1158&context=chhs_hs
To view attachments to this decision, click here:
http://commons.emich.edu/cgi/preview.cgi?article=1158&context=chhs_hs&wi
ndow=viewdecision&decision=0
We stress that you do not stray from your proposed plan. Good luck with your research
effort.
Jayne Yatczak, PhD, OTRL
Chair, CHHS-HSRC