Embed Size (px)
Citation preview
The Pennsylvania State University
The Graduate School
Department of Mechanical and Nuclear Engineering
INFLUENCE OF STEAM ON THE FLAMMABILTY LIMITS OF
PREMIXED NATURAL GAS/OXYGEN/STEAM MIXTURES
A Thesis in
Mechanical Engineering
by
Matthew J. Degges
2010 Matthew J. Degges
Submitted in Partial Fulfillment
of the Requirements
for the Degree of
Master of Science
May 2010
ii
The thesis of Matthew J. Degges was reviewed and approved* by the following:
Kenneth K. Kuo
Distinguished Professor of Mechanical Engineering
Thesis Advisor
Horacio Perez-Blanco
Professor of Mechanical Engineering
Karen A. Thole
Professor of Mechanical Engineering
Head of the Department of Mechanical and Nuclear Engineering
*Signatures are on file in the Graduate School
iii
ABSTRACT
Synthesis gas (syngas), a mixture of CO and H2, is an intermediate in a variety of
industrial processes. Its production is energy and capital intensive. Any improvement of existing
technologies allowing simpler and economic production is of great interest. Recently, a method
known as Short Contact Time – Catalytic Partial Oxidation (SCT-CPO) has been developed into a
commercial technology. SCT-CPO is an entirely heterogeneous catalytic process converting
premixed flammable feedstocks inside a very small reactor. In order to ensure operator safety
with a high selectivity towards CO and H2, it has been important to determine and understand
flammability properties of the gaseous reactant mixtures. A unique test chamber has allowed the
study of ignition, flame propagation, and explosion characteristics of gas mixtures similar to
those used as reactants in the SCT-CPO reactor. The tests were conducted at various pressures
with different mole fractions of steam and two different compositions of natural gas (NG). A
flammability boundary for the mixtures, based on normalized pressure and mole fraction of
steam, was determined. Previous studies indicate that steam can be used to suppress the
flammability of a mixture by both physical and chemical processes. To examine the chemical
processes, Chemkin Code calculations were executed. Similar to the experimentally observed
phenomena, the Chemkin calculations also showed that more steam was required to suppress the
flammability of the mixture with the higher adiabatic flame temperature. The results show highly
non-linear flammability boundaries for both hydrocarbon/oxygen/steam mixtures were very
sensitive to equivalence ratio and pressure, as the mechanism for flammability suppression by
steam is also strongly dependent on these parameters.
iv
TABLE OF CONTENTS
List of Figures .......................................................................................................................... vi
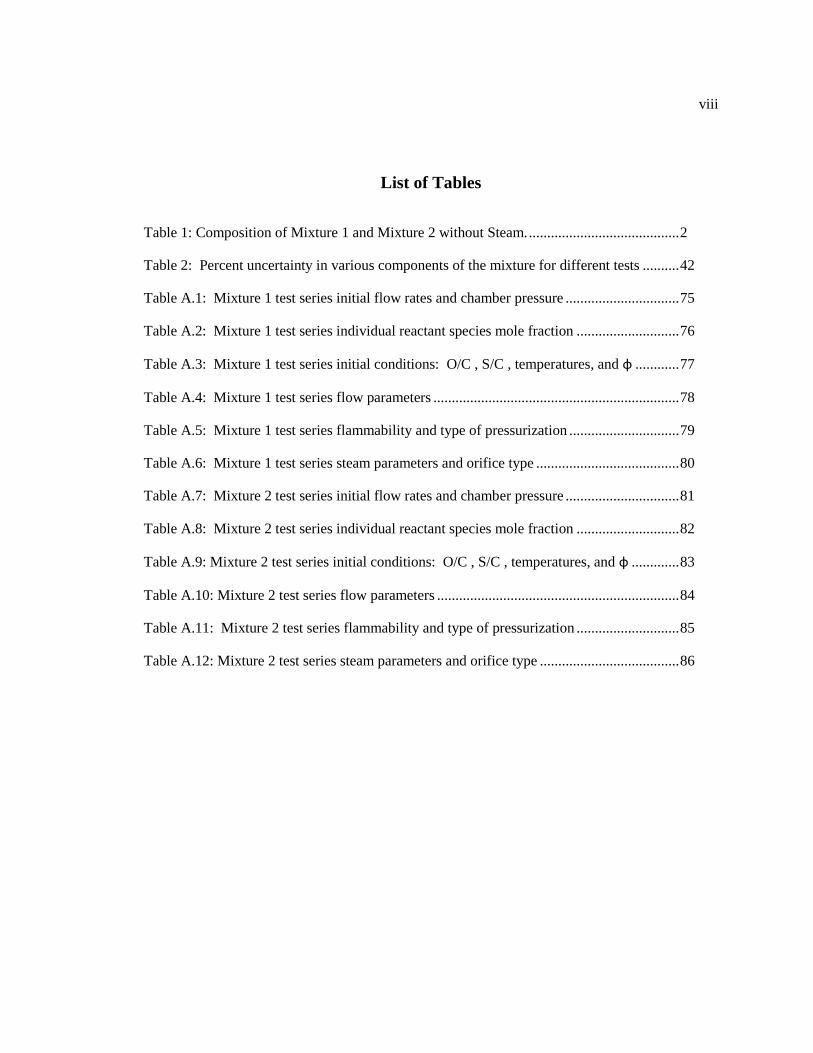
List of Tables ........................................................................................................................... viii
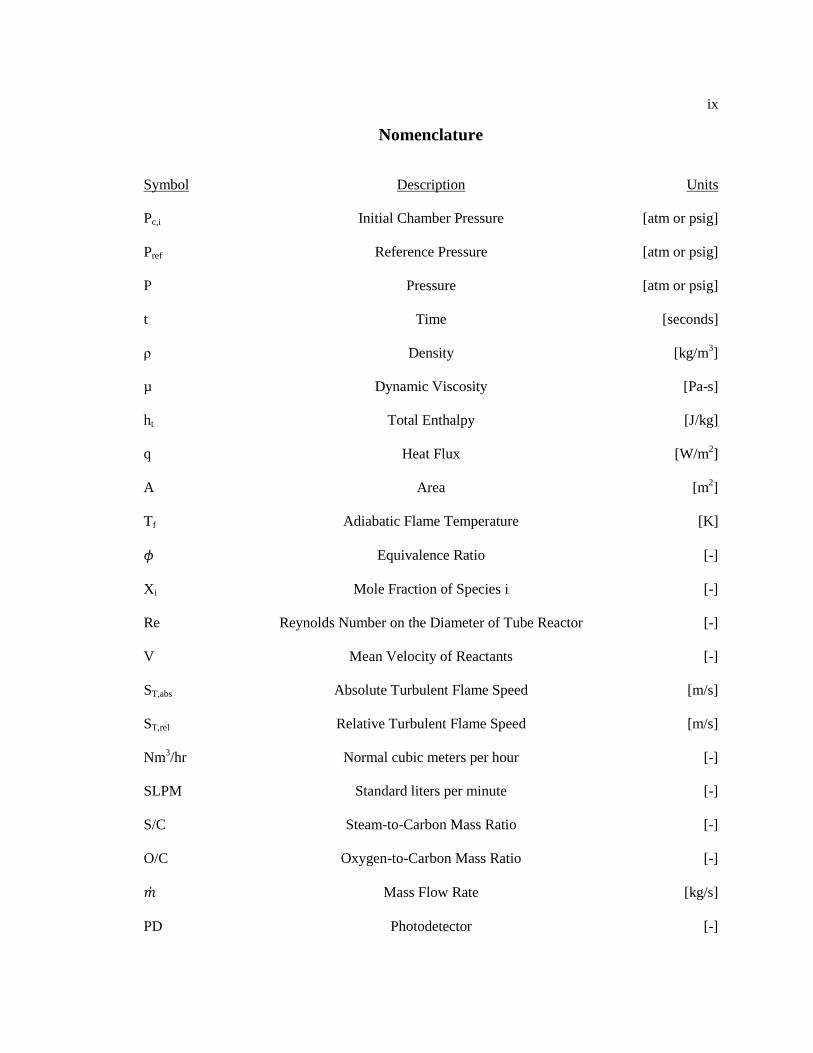
Nomenclature ........................................................................................................................... ix
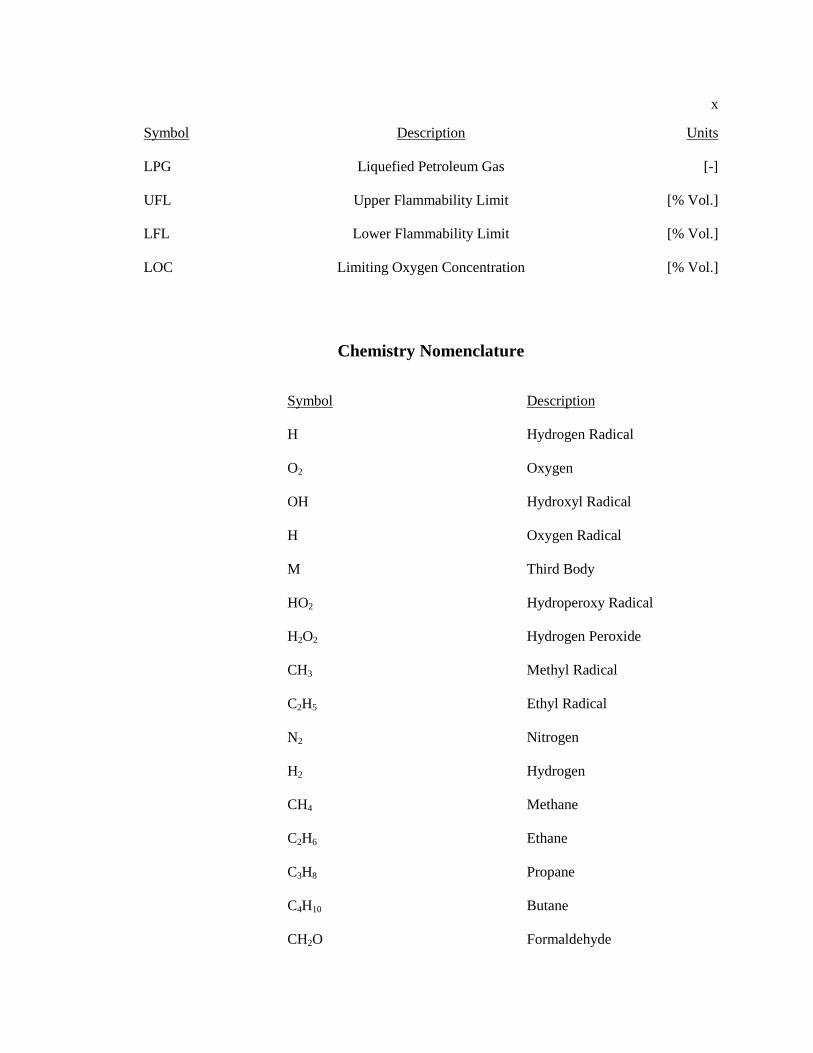
Chemistry Nomenclature ......................................................................................................... x
Acknowledgements .................................................................................................................. xii
Chapter 1 Introduction ............................................................................................................ 1
1.1 Overview of Experimentation .................................................................................... 2 1.2 Overview of Chemkin Calculations ........................................................................... 3 1.3 Research Goals ........................................................................................................... 3
Chapter 2 Literature Review ................................................................................................... 4
2.1 Ignition and Flammability .......................................................................................... 4 2.2 Influence of Steam on Flammability Limits .............................................................. 5 2.3 Flammability Limit Dependence on Equivalence Ratio ............................................ 7 2.4 Influence of Pressure on Flammability Limits ........................................................... 8 2.5 Influence of Reaction Zone Temperature on Flammability Limits ............................ 10 2.6 Cool Flame Phenomenon ........................................................................................... 13 2.7 Flammability Experiments ......................................................................................... 16 2.8 Summary of Processes Governing Flammability Limits ........................................... 17 2.9 Chemical Process Safety Characterization of Flammability Limits .......................... 19 2.10 Flammability Modeling ............................................................................................ 22
Chapter 3 Method of Approach .............................................................................................. 24
3.1 Experimental Method of Approach ............................................................................ 24 3.2 Computational Method of Approach ......................................................................... 30
Chapter 4 Experimentation ..................................................................................................... 32
4.1 Instrumentation .......................................................................................................... 32 4.1.1 Pressurization Data .......................................................................................... 32 4.1.2 Photodetector Flame Spreading Data .............................................................. 36 4.1.3 Flow Rate Data ................................................................................................ 39 4.1.4 Ignition Source ................................................................................................ 41
4.2 Summary of Uncertainties.......................................................................................... 42 4.3 Safety Analysis .......................................................................................................... 45
Chapter 5 Chemkin Code Calculations ................................................................................... 48
5.1 Overview of Calculations ........................................................................................... 48
v
5.2 Premixed Laminar Flame Speed Calculations ........................................................... 48 5.3 Homogenous Batch Reactor Calculations .................................................................. 54
5.3.1 Sensitivity Studies ........................................................................................... 55 5.3.2 Flammability Limits Using Homogenous Batch Reactor Model .................... 59
Chapter 6 Discussion of Flammability Results ....................................................................... 61
6.1 Flammability Results Compared with Chemkin Model ............................................. 61 6.2 Summary of Flammability Results ............................................................................. 65
Chapter 7 Conclusions ............................................................................................................ 68
References ................................................................................................................................ 71
Appendix A Experimental Test Matrix ................................................................................... 74
Appendix B Individual Test Summaries ................................................................................. 87
B.1 Test Summaries with Mixture 1 Test Series .............................................................. 87 B.2 Test Summaries with Mixture 2 Test Series .............................................................. 88
Appendix C Test Data Sheet ................................................................................................... 91
Appendix D Premixed Gas Reactor Test Checklist ................................................................ 92
Appendix E Error and Uncertainty ......................................................................................... 96
Appendix F General Calculations ........................................................................................... 98
vi
List of Figures
Figure 1: Effect of temperature and pressure on the flammability of hexane in air [23]. ........ 14
Figure 2: Ignition limits for hydrocarbons [24] ....................................................................... 15
Figure 3: Schematic of chemical and physical processes governing flammability test ........... 19
Figure 4: Flammability Triangle Diagram for a mixture of methane vapor in air [16] ........... 21
Figure 5: A 135o-sectional view of the windowed high-pressure tube reactor ........................ 25
Figure 6: Process flow diagram for flammability study of hydrocarbon/steam/oxygen
mixtures ............................................................................................................................ 26
Figure 7: Liquid petroleum gas (LPG) reservoirs and stock tanks, and methane and
hydrogen manifolds .......................................................................................................... 26
Figure 8: Test reactor experimental setup with flow controls, pre-heater, and steam
generator........................................................................................................................... 27
Figure 9: Three representative P-t traces recorded from the tube reactor ................................ 28
Figure 10: High-speed camera visualization of turbulent premixed flame front [35] ............. 28
Figure 11: Representative photodetector intensity-time traces [35] ........................................ 29
Figure 12: Representative linear fit of flame-propagation speed [35] ..................................... 29
Figure 13: Recorded pressure traces of Test #55 ..................................................................... 32
Figure 14: Recorded dynamic pressure traces of Test #53 ...................................................... 33
Figure 15: Recorded dynamic pressure traces of Test #73 ...................................................... 34
Figure 16: Recorded dynamic pressure traces of Test #56 ...................................................... 35
Figure 17: Photodetector intensity-time traces of Test #43 ..................................................... 36
Figure 18: Photodetector intensity-time traces of Test #55 ..................................................... 37
Figure 19: Photodetector intensity-time traces of Test #53 ..................................................... 38
Figure 20: Linear fit of flame-propagation speed for Test #43 ................................................ 39
Figure 21: Time variations of flow rates of reactants of Test #43 ........................................... 40
Figure 22: Vaporization curves for propane and butane .......................................................... 43
vii
Figure 23: Theoretically calculated maximum pressures for equilibrium reaction of
NG+LPG/steam/O2 as a function of initial chamber pressure with two different fuel
ratios of LPG .................................................................................................................... 47
Figure 24: Conceptual diagram of the Chemkin premixed laminar flame speed model .......... 49
Figure 25: Solution sensitivity to initial number of grids ....................................................... 50
Figure 26: Solution sensitivity to value of curvature and gradient ......................................... 51
Figure 27: Comparison of multi-component diffusion and mixture average transport ........... 52
Figure 28: Chemkin Code calculated evolution of temperature profile with different
amounts of steam addition ............................................................................................... 53
Figure 29: Chemkin calculated evolution of centerline velocity with increasing steam ......... 54
Figure 30: A-Factor sensitivity studies for Mixture 2 ............................................................. 56
Figure 31: Temperature sensitivity study for Mixture 1 and 2 at 15 atm ................................ 57
Figure 32: Chemkin Code Flammability Limit study for Mixture 2 ...................................... 60
Figure 33: Flammability Limits of Mixture 1 ......................................................................... 61
Figure 34: Flammability Limits of Mixture 2 .......................................................................... 63
Figure 35: Glass tube liner post-test from Test #37 ................................................................. 87
viii
List of Tables
Table 1: Composition of Mixture 1 and Mixture 2 without Steam. ......................................... 2
Table 2: Percent uncertainty in various components of the mixture for different tests .......... 42
Table A.1: Mixture 1 test series initial flow rates and chamber pressure ............................... 75
Table A.2: Mixture 1 test series individual reactant species mole fraction ............................ 76
Table A.3: Mixture 1 test series initial conditions: O/C , S/C , temperatures, and φ ............ 77
Table A.4: Mixture 1 test series flow parameters ................................................................... 78
Table A.5: Mixture 1 test series flammability and type of pressurization .............................. 79
Table A.6: Mixture 1 test series steam parameters and orifice type ....................................... 80
Table A.7: Mixture 2 test series initial flow rates and chamber pressure ............................... 81
Table A.8: Mixture 2 test series individual reactant species mole fraction ............................ 82
Table A.9: Mixture 2 test series initial conditions: O/C , S/C , temperatures, and φ ............. 83
Table A.10: Mixture 2 test series flow parameters .................................................................. 84
Table A.11: Mixture 2 test series flammability and type of pressurization ............................ 85
Table A.12: Mixture 2 test series steam parameters and orifice type ...................................... 86
ix
Nomenclature
Symbol Description Units
Pc,i Initial Chamber Pressure [atm or psig]
Pref Reference Pressure [atm or psig]
P Pressure [atm or psig]
t Time [seconds]
ρ Density [kg/m3]
µ Dynamic Viscosity [Pa-s]
ht Total Enthalpy [J/kg]
q Heat Flux [W/m2]
A Area [m2]
Tf Adiabatic Flame Temperature [K]
Equivalence Ratio [-]
Xi Mole Fraction of Species i [-]
Re Reynolds Number on the Diameter of Tube Reactor [-]
V Mean Velocity of Reactants [-]
ST,abs Absolute Turbulent Flame Speed [m/s]
ST,rel Relative Turbulent Flame Speed [m/s]
Nm3/hr Normal cubic meters per hour [-]
SLPM Standard liters per minute [-]
S/C Steam-to-Carbon Mass Ratio [-]
O/C Oxygen-to-Carbon Mass Ratio [-]
Mass Flow Rate [kg/s]
PD Photodetector [-]
x
Symbol Description Units
LPG Liquefied Petroleum Gas [-]
UFL Upper Flammability Limit [% Vol.]
LFL Lower Flammability Limit [% Vol.]
LOC Limiting Oxygen Concentration [% Vol.]
Chemistry Nomenclature
Symbol Description
H Hydrogen Radical
O2 Oxygen
OH Hydroxyl Radical
H Oxygen Radical
M Third Body
HO2 Hydroperoxy Radical
H2O2 Hydrogen Peroxide
CH3 Methyl Radical
C2H5 Ethyl Radical
N2 Nitrogen
H2 Hydrogen
CH4 Methane
C2H6 Ethane
C3H8 Propane
C4H10 Butane
CH2O Formaldehyde

xi
Symbol Description
CH3OH Methanol
CH3HCO Acetaldehyde
xii
Acknowledgements
This research has been supported by Eni Div. R&M. Input from Dr. Luca Basini and Mr.
Andrea Lainati of Eni Div. R&M is greatly appreciated. I would like to also acknowledge Mr.
Patrick Kutzler of PSU for his participation in the early phase of this project. I would personally
like to thank Dr. Kenneth Kuo for his guidance and support throughout my time at the High
Pressure Combustion Laboratory. Dr. Eric Boyer’s hard work and dedication to this research is
greatly appreciated. I would also like to thank Trevor Wachs for many hours spent cleaning,
assembling, and helping run these tests. Also thanks to all of my associates and friends at the
HPCL: Mr. Scott Blakeslee, Mr. Alex Colletti, Mr. Drew Cortapassi, Mr. Jon Essel, Mr. Brian
Evans, Mr. Ryan Houim, Mr. Jeff Krug, Mr. Heath Martin, Mr. Matt Sirignano, and Prof. Bao Qi
Zhang.
Chapter 1
Introduction
As natural gas (NG) is a highly available resource, new methods for processing it into
forms that are more efficient has been of great interest recently. The ability to convert NG into an
easily storable liquid form would benefit the global economy due to the dependence on oil for
liquid fuels. Also, NG can be converted to hydrogen to be used to power fuel cells; another
alternative power generation method. Processing NG into these two useful energetic materials
requires the production of the intermediate material known as synthesis gas or syngas [1,2].
Syngas is composed of H2 and CO.
Several methods for creating syngas are known, but of interest in this research is the
process of Catalytic Partial Oxidation (CPO). CPO is a heterogeneous catalytic process in which
a reactant is flowed over a rhodium coated surface, which acts as a catalyst to initiate a partial
oxidation reaction [2]. The partial oxidation of a natural gas/oxygen/diluent mixture will mainly
produce the products H2 and CO. The CPO method used with the correct mixture composition
will create syngas with a H2/CO ratio of 2, which is a favorable ratio for further processing [2].
Recently a process known as short contact time catalytic partial oxidation, SCT-CPO, has
been developed for use in industry. This process is similar to CPO, except it forces the reactant
mixture over a very hot rhodium surface for only few milliseconds. This short contact time with a
hot catalyst favors the formation of primary reactions and inhibits degradation of their products;
further degradation would cause chain reactions that would lead to loss of production of syngas
and introduce safety issues [3]. SCT-CPO is a process that is very efficient and flexible in the
creation of syngas.
2
The main objective of this study was to define the flammability boundaries of natural gas
(NG), steam, and oxygen mixtures in conditions very close to those that could be adopted in
industrial SCT-CPO processes [3,4,5,6]. The effect of steam on combustion processes is an
increasingly important issue which is not limited to the SCT-CPO case. For other technologies,
steam can affect the combustion processes in: exhaust gas recirculation in I.C. engines; in nuclear
power plant accident suppression systems; and in the operation of combined cycle gas turbine
(IGCC) fed with synthesis gas [7]. It is important to determine the suitable amount of steam used
in the SCT-CPO reactor for the mixture to be non-flammable. Understanding the flammability of
a mixture can be used to enhance safety. The main objective of this study is to characterize the
flammability boundaries of two types of mixtures composed of natural gas simulant combined
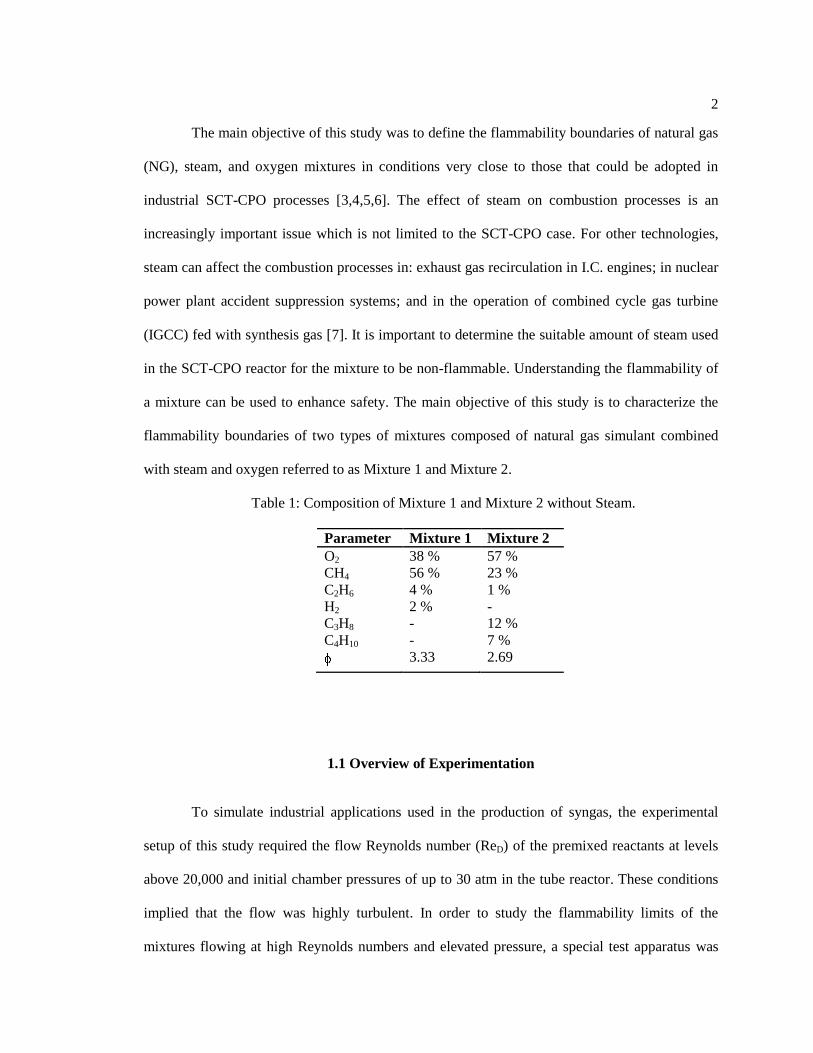
with steam and oxygen referred to as Mixture 1 and Mixture 2.
Table 1: Composition of Mixture 1 and Mixture 2 without Steam.
Parameter Mixture 1 Mixture 2
O2 38 % 57 %
CH4 56 % 23 %
C2H6 4 % 1 %
H2 2 % -
C3H8 - 12 %
C4H10
-
3.33
7 %
2.69
1.1 Overview of Experimentation
To simulate industrial applications used in the production of syngas, the experimental
setup of this study required the flow Reynolds number (ReD) of the premixed reactants at levels
above 20,000 and initial chamber pressures of up to 30 atm in the tube reactor. These conditions
implied that the flow was highly turbulent. In order to study the flammability limits of the
mixtures flowing at high Reynolds numbers and elevated pressure, a special test apparatus was
3
designed to sustain any rapid pressurizations caused by ignition. The operating temperature of the
tube reactor was required to be around 450 K so gas mixtures must be pre-heated to within this
temperature range. The heat loss from the gas supply system needed to be minimized so the
reactor was preheated before each flammability test. Another requirement was that the gaseous
components of the mixture needed to be well mixed prior to injection into the reactor. If the
original states of certain chemical ingredients were stored in a liquid form, these ingredients
needed to be vaporized before mixing with other components. All of these requirements for
experimentation were incorporated into a tube reactor test rig at the High Pressure Combustion
Lab at the Pennsylvania State University and are explained in detail in Chapter 3.
1.2 Overview of Chemkin Calculations
In addition to experimental investigation, Chemkin Code [8] calculations were performed
to analyze the flammability limits of these mixtures. Two different types of Chemkin models, the
homogenous batch reactor and the flame speed model, were used to determine which method
would best determine a flammability limit. In addition, the homogenous batch reactor calculations
were coupled with sensitivity studies to understand the reaction paths of the two mixtures. The
calculations were compared to experimental results and were useful as a heuristic study of the
flammability limit of the two mixtures.
1.3 Research Goals
Overall, this study had the following research goals:
1. Experimentally define the flammability boundary for Mixture 2.
2. Compare the flammability boundaries of Mixture 1 and Mixture 2.
4
3. Use Chemkin Code calculations to assist in analysis and interpretation.
4. Make conclusions on how steam affects the flammability of the two mixtures.
Chapter 2
Literature Review
2.1 Ignition and Flammability
In determining the flammability limits of Mixture 1 and Mixture 2, tests were performed
to observe the conditions that will allow for ignition to occur. An ignition of a mixture will occur
in a combustion system if the rate of chemical reactions and heat release is sustained or increased
[9]. Every combustion system has different mechanisms for energy loss, for which the energy
addition by chemical reactions must overcome for an ignition to occur. Chemical reactions
generate radicals that collect in a “pool.” As this radical pool grows, reaction rates also increase,
since the radical species can promote reactions. For an ignition to occur, the radical pool growth
has to overcome any loss mechanisms [10]. Losses can be associated with transport mechanisms
for energy and mass, like heat losses by conduction, convection, or radiation. These losses could
also be caused by chain-terminating reactions that remove radicals from the pool.
The process of radical growth occurs in the induction period. This is a time frame in
which it takes the chemical reactions to initiate some stage of chain branching. The induction
time of any ignition experiment can be seen as the combination of two time periods: chemical
time, , and thermal time, . The chemical time is the time to build to a critical concentration of
radicals that would cause ignition. The thermal time is the time it takes subsequent reactions to
heat the mixture to its final stage via exothermic heat release or an extremely fast heat release
process called thermal explosion. Generally, , but in certain cases the thermal time can
5
be longer to bring the system to a thermal explosion, especially if the energy losses in the system
are high. A two-stage ignition can occur; in the first stage, the chemical reactions can produce a
relatively small pressure rise initially and after the accumulation of a greater amount of thermal
energy in the mixture, a second stage more violent ignition follows[10].
2.2 Influence of Steam on Flammability Limits
Despite the relevance of steam in syngas production (particularly with autothermal
reforming and non-catalytic partial oxidation technologies), there is a lack of detailed information
and experimental data on the effect of steam on the flammability of gaseous mixtures at high
pressures. Instead there is a general knowledge on the possibility of reducing the flammability
limits in the presence of steam [11,12,13,14].
In the process safety literature, the inerting effect of steam lowers the likelihood of
explosion [15]. The inerting effect is the process of adding an inert mixture, like N2, CO2, or
steam to reduce the concentration of oxygen below the limiting oxygen concentration (LOC)
where there is not enough oxygen required to propagate a flame [16]. Also, previous studies
indicated that the steam serves as both an energy sink for absorbing heat generated by the gaseous
chemical reactions and as a chemical reactant or suppressant that can affect the chemistry of the
mixture [7].
The energy balance between the chemical and physical effects is shown in Eq. (1). It
includes a pressure storage term on the left hand side; while the terms on the right hand side
represent the change in energy due to changes in total enthalpy and the heat loss term [17].
(1)
This equation assumes invisicid flow, neglects Dufour effect, assumes no external heat addition,
and no body forces. In summary, this equation can be interpreted to say that any rate of increase
6
in pressure is caused by the increase in total enthalpy of the system due to chemical reactions,
which overcome the heat losses from the system. The addition of steam to a flammable mixture
can affect both the enthalpy and the heat conduction terms in this equation.
Seiser and Seshardi (7) refer to the effect of steam on enthalpy change as the chemical
and the effect on heat loss as the physical effect on the flammability of a mixture. The addition of
water vapor to a premixed or non-premixed flame lowers the temperature in the reaction zone,
which increases the heat loss by conduction. The chemical effect of steam on the flammability of
the mixture is associated in the way steam interacts with the combustible mixture changing the
enthalpy of the system. Steam is unique as it has a higher chaperon efficiency than other reactants
and products found in hydrocarbon combustion. The chaperon efficiency is a parameter that
indicates the effectiveness of third body reactions (M). Steam addition can increase the
effectiveness of 3rd
body reactions, which can lead to new reaction paths.
The presence of steam in a combustible mixture greatly increases third body reactions
which can increase or decrease the flammability depending on the composition of the mixture [7].
In the case of mixtures with adiabatic flame temperatures around 2000 K, the addition of steam
makes the mixture more difficult to extinguish [7]. In the case of mixtures with adiabatic flame
temperatures around 1350 K, the addition of steam makes the mixture easier to extinguish [7].
This was observed in calculations and experiments by Seiser and Seshardi [7]. They posed that as
the adiabatic flame temperature is increased from 1350 K to 2000 K, the influence of the chain-
terminating reaction (R1) diminishes. Additionally in this range of increasing adiabatic
temperatures, the influence of the chain branching reaction (R2) increases.
(R1)
(R2)
If the terminating or branching reaction is more dominant, the flame would be harder or easier to
ignite, respectively. Additionally, it is known that the adiabatic flame temperature is strongly
7
dependent on the equivalence ratio of the mixture [17]. This means that the chemical effect on
flammability is strongly dependent on the equivalence ratio.
2.3 Flammability Limit Dependence on Equivalence Ratio
The flammability of the mixtures should be sensitive to small changes in equivalence
ratio ( ), which determines the adiabatic flame temperature of a given mixture. A NASA-CEA2
calculation [18] was performed for each mixture, without steam, at 1.01 MPa and the adiabatic
flame temperatures were calculated as 1357 and 2021 K for Mixtures 1 and 2, respectively. From
the large differences in calculated flame temperatures, it is anticipated that these two mixtures
have drastically different flammability limits.
Many studies have been conducted to determine an adiabatic flame temperature limit,
below which the mixture is not flammable. Chen et al. [15] summarized that the lower
flammability limit (LFL) and the upper flammability limit (UFL) are defined as the lean and rich
flammability limits of the mixture below or above which a flame cannot be sustained. For this
research, Mixture 1 and Mixture 2 are both fuel-rich mixtures, so investigation into UFL is of
interest. In the literature, there is a range of acceptable UFL adiabatic flame temperatures from
1000 to 1600 K. This indicates that Mixture 1 (Tf =1357 K) at 1.01 MPa would lie in this range of
temperatures implying that Mixture 1 is very close to the UFL without steam addition.
As shown by Seiser and Seshardi (7), the adiabatic flame temperature, which is directly
related to the equivalence ratio, determines the major chemical reaction paths taken in the
combustion process. If the equivalence ratio is closer to the stoichiometric value, the chain
branching reactions will be most effective during combustion. If the equivalence ratio is closer to
the UFL, the chain terminating reactions will be more dominant and slow the combustion process.
8
The literature shows that the equivalence ratio is a major determining factor in reaction paths of
the combustible mixture.
2.4 Influence of Pressure on Flammability Limits
The flammability limits for hydrocarbon/air have been shown to broaden at higher
pressures and reaction paths are also dependent on pressure [14,17]. The influence of steam on
flammability limits at higher pressures (P ~ 30 atm) is not available in the literature. For the
purpose of the present work, it is relevant to summarize some points concerning the role of steam
addition and initial chamber pressure on the chemistry of the hydrocarbon/oxygen mixtures. A
first point is made by observing that the hydrogen oxidation mechanism [17,19] is at the core of
hydrocarbon combustion chemistry. The driving chain-branching reaction is:
(R3)
The hydrocarbons in the mixture break down into hydrocarbon radicals, which then
produce a pool of hydrogen radicals through hydrogen abstraction. These hydrogen radicals
combine with the oxygen in the mixture and create hydroxyl radicals and oxygen atoms (R3),
thus branching the reaction paths and releasing thermal energy. The reaction, which is chain
terminating at pressures lower than 1.32 MPa (13 atm), along a 450 K isotherm in the classical
hydrogen-oxygen flammability limit [17], is the R1 reaction.
R1 competes with R3 for hydrogen radicals as pressure is increased, as the 3rd body
reactions (M) occur more frequently at higher pressures. The terminating reaction (R1) produces
the hydroperoxy radical (HO2). This is a heavy radical that can diffuse to the wall and will not
propagate the reaction at pressures less than 1.32 MPa and temperatures at the 450 K isotherm. At
pressures greater than 1.32 MPa, still along the 450 K isotherm, the hydroperoxy radical will no
9
longer diffuse to the wall, but can propagate reactions in the mixture through the following
overall chain propagating path:
(R4)
(R5)
The hydroperoxy radical combines with the hydrogen radicals to produce hydrogen
peroxide (R4) which easily decomposes to hydroxyl radicals (R5). R4 and R5 form an overall
chain propagating reaction causing the mixture to be flammable above 1.32 MPa along the 450 K
isotherm. In summary, the classical hydrogen-oxygen flammability limit, which is at the core of
hydrocarbon chemistry, shows that mixtures are non-flammable between 0.25 kPa and 1.32 MPa
along a 450 K isotherm and flammable at pressures higher than 1.32 MPa along the same
isotherm. These classical flammability limits dependency on pressure is due to the reaction path
selection of the HO2 molecule as pressure increases.
Shebko et al. [20,21] also shows that hydrocarbon combustion systems involve two
competing reaction paths that involve the reactions of HO2. Shebko [20,21] shows that once the
HO2 molecule is generated in R1, it can take one of the following paths:
(R6)
(R7)
(R8)
(R9)
Reactions R6 and R9 are both chain propagating, while R7 and R8 are both chain
terminating. From both the classical mechanism study and the work of Shebko [20,21] it is
known that the reaction path selection of HO2 is important in determining the flammability of a
hydrocarbon mixture.
The generation of the HO2 molecule is controlled by R1 which depends on 3rd
-body
reactions (M). These 3rd
-body reactions are more effective with increasing pressure. They are also
10
increased with increasing steam, due to its high chaperon efficiency as mentioned earlier. So,
pressure affects the reaction path selection of the HO2 molecule and the generation rate of HO2
molecules through more effective 3rd
-body reactions at higher pressures.
2.5 Influence of Reaction Zone Temperature on Flammability Limits
The amount of heat release and thermal energy losses for a given test can change the
induction time for ignition, as well as the temperature of the reaction zone. Additionally, the
presence of steam can lower the temperature of the reaction zone [7]. Westbrook et al. [9] and
Simmie [22] give summaries of hydrocarbon kinetic mechanisms at different reaction zone
temperatures.
Westbrook et al. [9] reports that at reaction-zone temperatures above 1200K, alkyl
radicals (R), like CH3, are produced by the hydrocarbon fuel due to beta decomposition. The
complex sequence of reactions in this high-temperature regime, is then initiated by R10:
(R10)
The major chain branching reactions in this regime are R3 and R11:
(R11)
Additionally in this temperature regime, an important reaction that retards ignition is R1. There
are also many other reactions that inhibit the chain branching by competing for H radicals.
At lower reaction-zone temperatures, less than 1000 K, the chain branching reaction, R3,
is quite slow. This reaction has a relatively high activation energy (70.3 kJ/mol), so it is not as
reactive at lower temperatures. Instead, the reaction R1 is most important in this temperature
regime as it has almost no temperature dependence. This reaction can initiate a branch by
colliding with RH in the following way:
(R12)
11
The H2O2 generated in R12 can then react by R5, depending on the pressure. This is the dominant
branching reaction mechanism at lower temperatures.
Simmie [22] gives a more recent, very detailed, review of chemical kinetic models. In
this review, the work of Petersen et al. [1] is of interest to this research. This research was for
CH4/O2/diluent (N2, He, Ar) mixtures at high pressures (4-26 MPa), high equivalence ratios (0.4-
6.0), and intermediate temperatures (1040-1500K) [1]. They show that at lower temperatures,
reactions involving acetaldehyde are important. They also show that the most important reactions
in determining ignition delay times at high pressures are the following:
(R13)
(-R5)
(R14)
It is important to note that all of these reactions depend on M.
At higher temperatures (1400K), they found that the dominant promoters of ignition are
the following reactions:
(R15)
(R16)
(R17)
(R18)
The most dominant inhibitor to these reactions is R14. The controlling radicals of ignition in this
fuel-rich, high pressure, high-temperature regime are the slow and inhibiting CH3 and HO2
radicals and the fast, chain-branching H and OH radicals. Pre-ignition build up of chain branching
H radicals is mainly due to the following reaction:
(R19)
12
At lower reaction temperatures (1100K) the most influential reactions change [1]. At
higher pressures and lower temperatures the following reaction occurs:
(R20)
which then produces the dominant chain branching path in the lower temperature regime:
(R21)
CH3O then branches in R19. Other chain branching reactions that are important here are R5 and
R22:
(R22)
At even lower temperatures (<1100 K), the fuel-rich data exhibited negative temperature
exponent behavior. The chemical kinetics in this regime was not explained by their work. The
addition of acetaldehyde chemistry, which was to account for the lower temperature regime had
insignificant effect. Understanding this regime requires more measurements of reaction rates. The
reaction rate of R21 needs to be experimentally determined as it is the most important reaction for
fuel-rich mixtures in the lower temperature, higher pressure regime.
Petersen’s work shows that as temperature is lowered, the reaction mechanism depends
more on the concentration of the 3rd
-body M for the branching reactions. At 1400 K, the reactions
R15-R18 do not involve M, since the temperature is high enough to overcome the activation
energy of these reaction paths. In both temperature regimes, the concentration of M plays a chain
terminating role in R14. In the lower temperature regime (~1100K), R5 and R19 are chain
branching reactions that also depend on M concentration. The propagation of a reaction in the low
temperature regime depends on the concentration of M to act as a catalyst to initiate reactions.
13
2.6 Cool Flame Phenomenon
A useful summary of the cool flame phenomenon was given by Fawcett and Wood [23];
certain important observations are summarized in this section. Autoignition and “cool flames” are
two different manifestations of the similar process of oxidation. A cool flame is a visual
phenomenon associated with the low-temperature oxidation of a hydrocarbon mixture in oxygen
or air. It is accompanied by a very small rise in temperature and pressure as compared to normal
ignitions. It is often referred to as a partial oxidation reaction. The cool flame can be seen with the
proper setup, as it emits a pale blue luminescence caused by the formation of excited
formaldehyde (CH2O) molecules. The formaldehyde molecules result from the decomposition of
hydroperoxides (H2O2 => 2OH) combining with the CH from aldhydes (O=CH-) which have a
weak oxygen bond. This chemical reaction is summarized as OH + CH => CH2O => pale blue
luminescence.
The cool flame phenomenon has explained the causes of many unexpected fires and
explosions. In high-speed jet fighter planes, the leading edge of fuel tanks on aircraft wing
becomes quite hot at Mach 2. This aerodynamic heating can initiate a cool flame that can
transition to an explosion as the jet plane lowers its altitude, which raises the pressure of the tank.
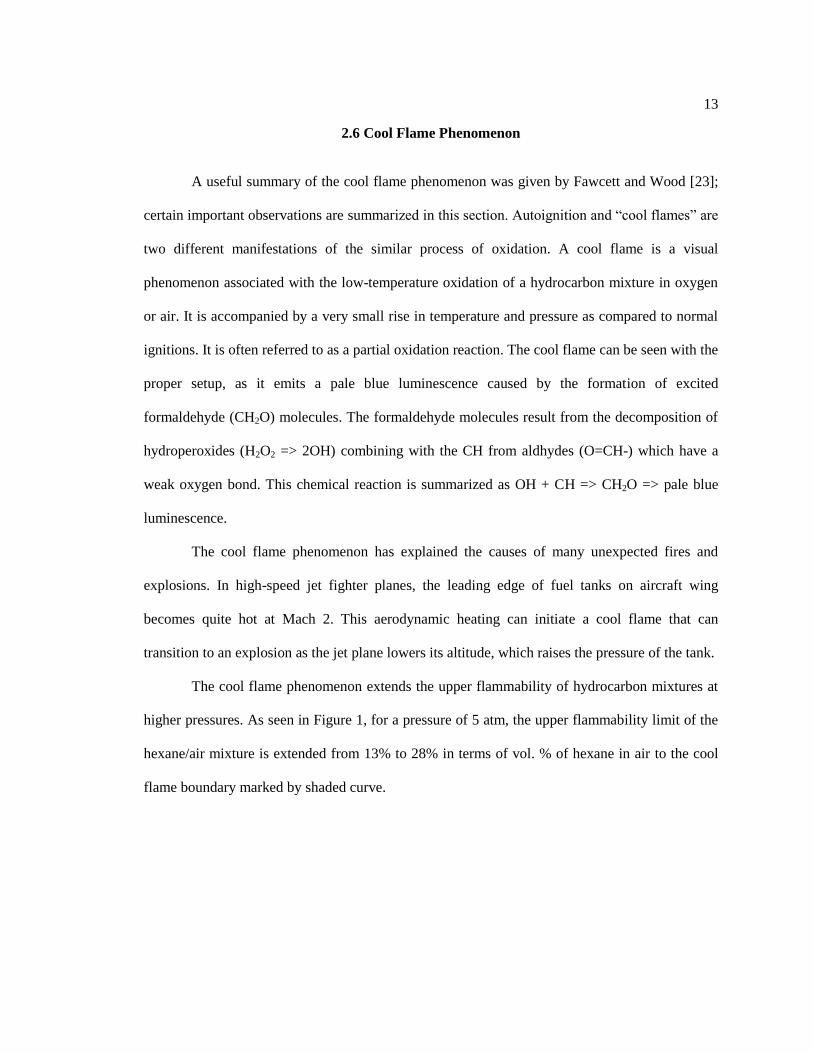
The cool flame phenomenon extends the upper flammability of hydrocarbon mixtures at
higher pressures. As seen in Figure 1, for a pressure of 5 atm, the upper flammability limit of the
hexane/air mixture is extended from 13% to 28% in terms of vol. % of hexane in air to the cool
flame boundary marked by shaded curve.
14
Figure 1: Effect of temperature and pressure on the flammability of hexane in air [23].
The cool flame phenomenon can exist in higher pressures and rich hydrocarbon mixtures. It is
characterized by very small changes in temperature and pressure. This phenomenon is usually not
visible in normal lighting condition, but can be seen with the specialized optical setup.
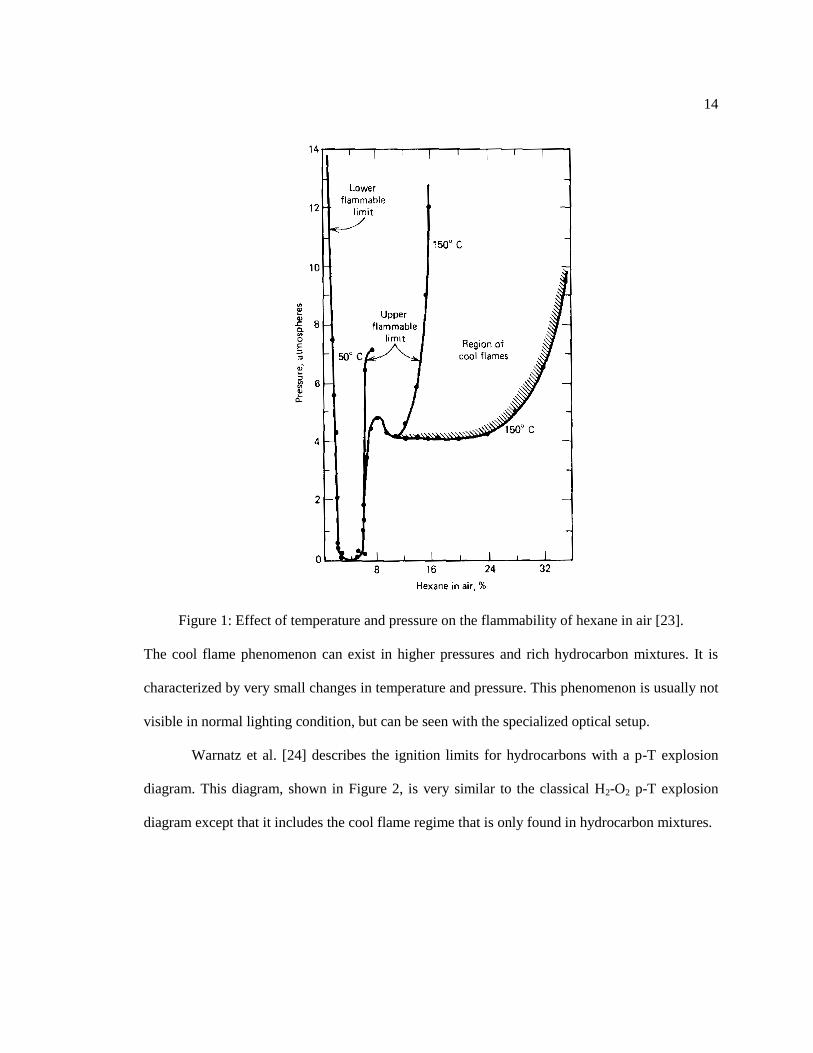
Warnatz et al. [24] describes the ignition limits for hydrocarbons with a p-T explosion
diagram. This diagram, shown in Figure 2, is very similar to the classical H2-O2 p-T explosion
diagram except that it includes the cool flame regime that is only found in hydrocarbon mixtures.
15
Figure 2: Ignition limits for hydrocarbons [24]
Multistage or multiple ignition is a phenomenon found in the 3rd
explosion limit where ignition
takes place after the emission of short visible light pulses. The cool flame regime is where
combustion takes place at low temperatures.
In these phenomena at the 3rd
explosion limit, the reaction R20 controls the chain
reactions that govern the ignition process. If the temperatures are high enough, the CH3O2
molecule will decompose and terminate reaction paths associated with this molecule. If the
temperatures are low enough the following degenerate chain branching path can be taken, i.e.:
CH3O2 + CH4 => CH3OOH + CH3 then CH3OOH => CH3O + OH. A degenerate path is one that
fails to branch at higher temperatures.
16
From reviewing the topic of cool flames, it was found that in hydrocarbon mixtures odd
flame spreading can be observed at higher pressures, lower temperatures, and fuel-rich mixtures.
The degenerate chain branching path, described above, that can only function at lower
temperatures, causes odd flame spreading. The OH produced in this chain reaction can then
combine with a CH radical to generate formaldehyde, which emits pale blue luminescence. Also,
multiple pulses of light are indicative that this same chemical mechanism is involved.
2.7 Flammability Experiments
Bartknecht [25] highlights important parameters of explosion testing, which is directly
related to the flammability testing in this research. A change in pressure of the test chamber can
occur if a flammable mixture ignites. The rate of pressure change and maximum pressure
observed characterizes the amount of energy released from the exothermic reactions. The volume
of the reactor governs the rate of pressurization as well. Lower rates of pressure change (dP/dt)
are usually observed as the mixture’s composition approaches its flammability limits. The
flammability limits of a mixture can be broadened with greater energy release from the igniter
[25]. Also, a richer mixture usually has a higher minimum ignition energy required than a
stoichiometric mixture [26].
Information for these experiments performed in a tube reactor was found in reference to
explosions in pipelines [25]. In pipelines carrying potentially flammable mixtures, protective
measures should be taken to confine an explosion to a limited volume. This can be achieved by
using gaps or clearances, called flame barriers, for flames to expand into and then be quenched.
Two processes are important in causing a flame to quench as it is being ejected from a
pressurized enclosure into a flame barrier:
1. heat loss to the walls; and
17
2. reduction of temperature due to expansion of the hot combustion gases leaving the
enclosure.
The dimensions of the flame barriers are highly influenced by the concentration of the mixture. A
less flammable mixture could be quenched by a flame barrier that could not quench a more
flammable mixture. In addition, the velocity of the product gases and the residence time during
which the combustion gases are in contact with the reactant mixture affects the possibility of
onset of ignition. As contact time between the reactants and hot products increases, the mixture is
more flammable. This contact time decreases with increasing product gas velocity [25].
2.8 Summary of Processes Governing Flammability Limits
From this literature review, flammability of a mixture is governed by the rate of radical
growth. The accumulation of radicals occurs in the chemical induction time, , and the radical
concentration can either increase or decrease during the thermal induction time, .
Steam can affect the rate of radical accumulation in two main ways. Firstly, steam, in
high enough quantity, can act as an inerting agent, which lowers the available oxygen content of
the system. This reduces the productivity of chemical reactions as well as the amount of radicals
generated, and hence lowers the reaction-zone temperature. Secondly, steam has a high chaperon
efficiency, this makes 3rd
-body reactions much more effective and increase the rate of both chain-
branching and chain-terminating reactions involving the 3rd
body M.
The equivalence ratio of the mixture governs the rates of chemical reactions in generating
radicals. The closer the equivalence ratio is to the stoichiometric value, the higher the production
rate of radicals. Conversely, if the equivalence ratio is close to the UFL, the production rate of
radicals is low.
18
Initial chamber pressure governs the effect of 3rd
body reactions (M). The higher the
pressure, the faster the reaction rates of paths that involve M. In the classical H2/O2 reaction
mechanism, the HO2 and H2O2 molecules become much more reactive under higher pressures, as
their collision rates are increased. 3rd
body reactions are very important in this study as their rates
are greatly enhanced with increased initial pressure and steam content.
The chemical kinetic reaction mechanisms that lead to ignition are very sensitive to the
temperature of the reaction zone. The work of Simmie [22], Westbrook et al. [9], and Petersen
[1], showed that small changes in reaction-zone temperature can drastically change the chemical
kinetic mechanism. It was determined that for fuel-rich mixtures at high pressure, as the
temperature is decreased from 1400 to 1100K, the reaction mechanism transitions from M
playing a chain-terminating role to M playing a chain-branching role. As temperature is
decreased, reactions need the catalytic energy of the 3rd
-body M to initiate most reactions.
Conversely, at higher temperatures, 3rd
body reactions are not required for chemical reaction to
occur since the required activation energy is available due to the higher temperature.
Additionally, fuel-rich, high-pressure, low-temperature reactions can involve
acetaldehyde, which produces formaldehyde. This product emits a pale blue luminescence and is
the signature of the cool flame regime. Ignitions that occur in the cool flame regime are beyond
the upper flammability limit.
Ignition experiments emphasize the importance of total induction time ( ) in
flammability tests. Reactions that occur slowly are more likely to be near the flammability limits.
Also, the amount of time hot products are in contact with the unburnt reactants increases the
production of radicals in the chamber thus increasing the probability for onset of ignition.
Overall, the flammability of a mixture depends on the rate at which radicals accumulate.
This can be increased or decreased by steam depending on the vol.% of steam. The rate of
accumulation decreases with increasing equivalence ratio, decreasing pressure, and decreasing
19
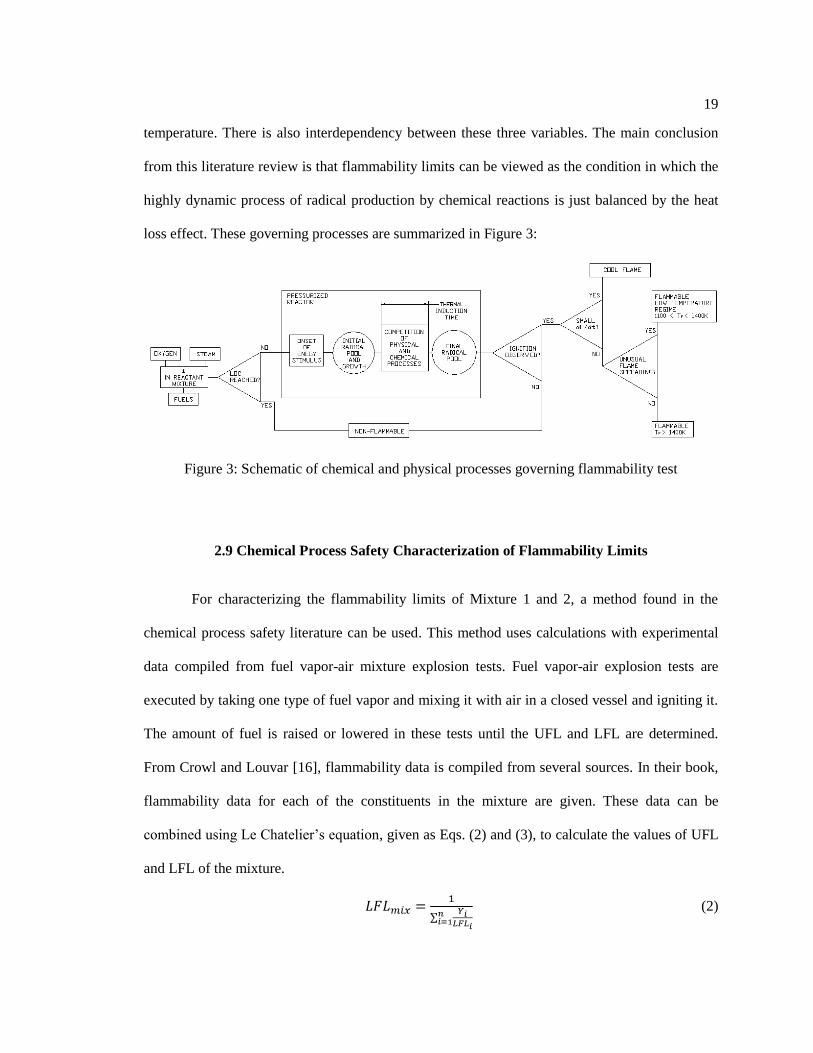
temperature. There is also interdependency between these three variables. The main conclusion
from this literature review is that flammability limits can be viewed as the condition in which the
highly dynamic process of radical production by chemical reactions is just balanced by the heat
loss effect. These governing processes are summarized in Figure 3:
Figure 3: Schematic of chemical and physical processes governing flammability test
2.9 Chemical Process Safety Characterization of Flammability Limits
For characterizing the flammability limits of Mixture 1 and 2, a method found in the
chemical process safety literature can be used. This method uses calculations with experimental
data compiled from fuel vapor-air mixture explosion tests. Fuel vapor-air explosion tests are
executed by taking one type of fuel vapor and mixing it with air in a closed vessel and igniting it.
The amount of fuel is raised or lowered in these tests until the UFL and LFL are determined.
From Crowl and Louvar [16], flammability data is compiled from several sources. In their book,
flammability data for each of the constituents in the mixture are given. These data can be
combined using Le Chatelier’s equation, given as Eqs. (2) and (3), to calculate the values of UFL
and LFL of the mixture.
(2)
20
(3)
where Yi is the mass fraction of the ith species. In addition, correction factors can be added to
these limits that account for effects of pressure and temperature, as shown in Eqs. (4), (5), and
(6).
(4)
(5)
(6)
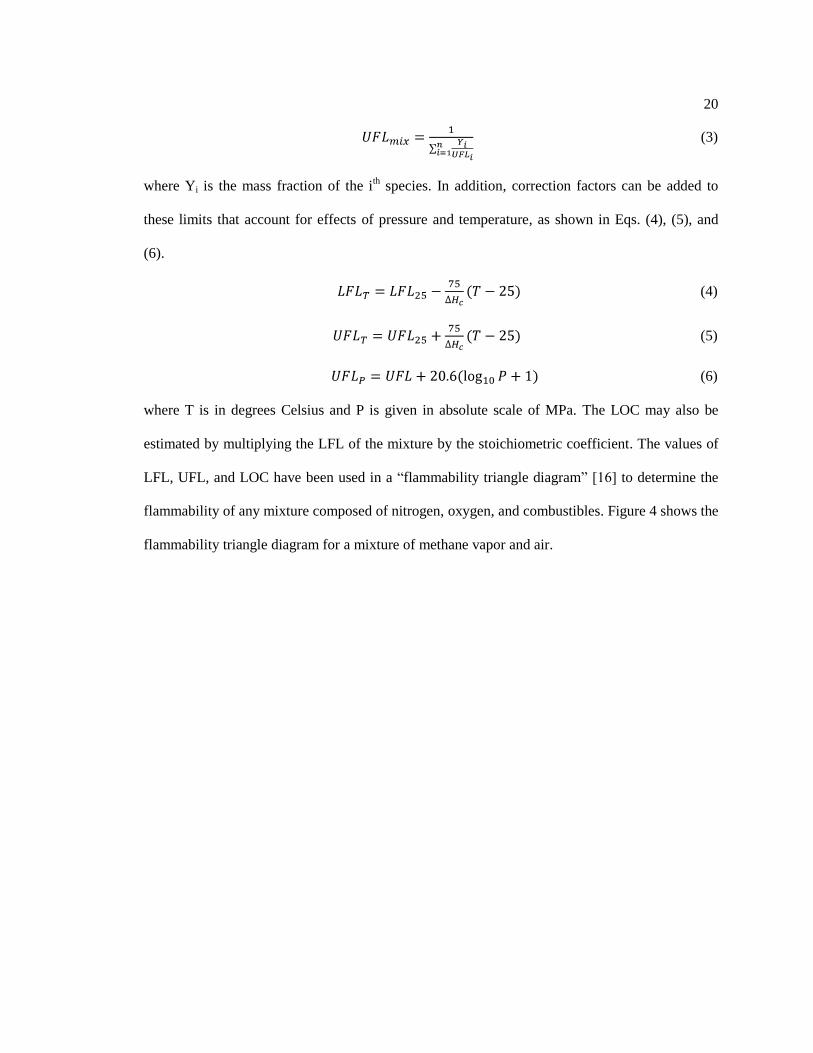
where T is in degrees Celsius and P is given in absolute scale of MPa. The LOC may also be
estimated by multiplying the LFL of the mixture by the stoichiometric coefficient. The values of
LFL, UFL, and LOC have been used in a “flammability triangle diagram” [16] to determine the
flammability of any mixture composed of nitrogen, oxygen, and combustibles. Figure 4 shows the
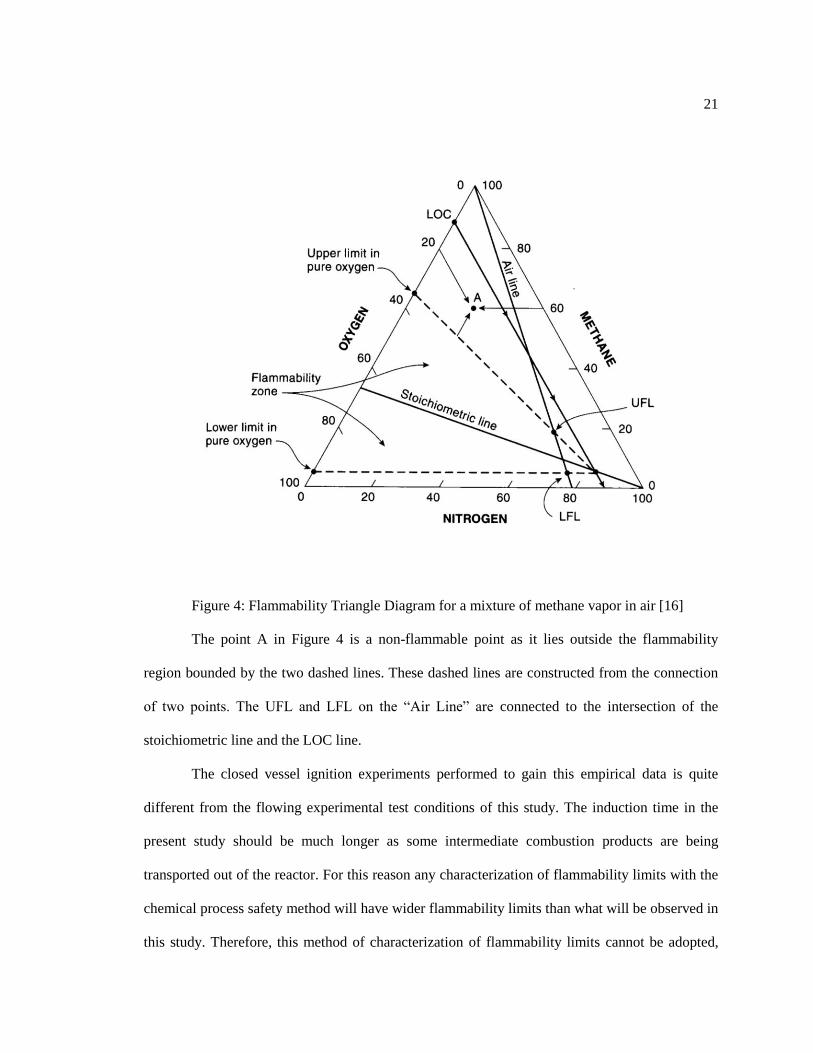
flammability triangle diagram for a mixture of methane vapor and air.
21
Figure 4: Flammability Triangle Diagram for a mixture of methane vapor in air [16]
The point A in Figure 4 is a non-flammable point as it lies outside the flammability
region bounded by the two dashed lines. These dashed lines are constructed from the connection
of two points. The UFL and LFL on the “Air Line” are connected to the intersection of the
stoichiometric line and the LOC line.
The closed vessel ignition experiments performed to gain this empirical data is quite
different from the flowing experimental test conditions of this study. The induction time in the
present study should be much longer as some intermediate combustion products are being
transported out of the reactor. For this reason any characterization of flammability limits with the
chemical process safety method will have wider flammability limits than what will be observed in
this study. Therefore, this method of characterization of flammability limits cannot be adopted,
22
unless a correlation between the induction times of the fuel-vapor/air experiments could relate the
test results from the present study.
2.10 Flammability Modeling
The following references were useful in determining the best way for utilizing the well-
established Chemkin code to define flammability boundaries. To achieve this goal it was
necessary to select the criteria for defining flammability limits. For this, the work of Law and
Egolfopoulos was referenced [27]. They define a flammability limit to exist when the major chain
branching reaction has a rate of production of radical species, which is equal to that of the major
chain terminating reaction. They refer to this condition as the “turning point” in which there is a
balance between the two reactions causing the energy generation rate to sharply decrease after
this point.
Westbrook [28] showed that a qualitative rule can be defined. Based upon experimental
observations, a premixed hydrocarbon/air flame with one-dimensional adiabatic laminar flame
speed lower than 50 mm/s can be considered non-flammable [28]. Womeldorf and Grosshandler
[29] used this rule, with Chemkin code, in their study of flammability limits of CH2F2 / air
mixtures.
Bui-Pham and Miller [30] studied the flammability limits of rich methane/air mixtures by
using the flammability limit definition of both Law and Egolfopoulos [27] and Westbrook [28].
They found very good agreement in the upper flammability limit between the two methods. When
using Law and Egolfopoulos’ method [27] they defined the chain branching reaction and chain
terminating reaction as the following:
(R3)
(R23)
23
Their work was very useful to determine the definition of the flammability limit in the Chemkin
code calculations performed in this study.
Liang and Zeng [11] used the Chemkin batch reactor coupled with GRI-Mech 3.0 to
show that water addition to a gas explosion would increase the time to induce an explosion. They
used a methane and air mixture and showed that 10% water addition decreased the explosion
pressure from 2.15 atm for the dry mixture to 0.15 atm with 10% water. From a sensitivity study,
they found that the dilution effect (or physical effect) water addition to reduce the reaction zone
temperature is the cause of the observed decrease in explosion pressure.
24
Chapter 3
Method of Approach
The influence of steam on the flammability of Premixed Natural Gas/Oxygen/Steam
mixtures was investigated experimentally for Mixture 2 and computationally for both Mixture 1
and Mixture 2.
3.1 Experimental Method of Approach
In this study, a tube reactor with a 40-mm diameter bore was used to study ignition, flame
propagation, and explosion characteristics of the two simulated NG mixtures as inputs to the
SCT-CPO reactor. The composition of NG delivered to the pilot plant can vary [31]; thus,
multiple compositions were investigated in the present study. Variation in the initial chamber
pressure and gaseous flow rates were also studied.
The reactor (shown in Figure 5) is equipped with multiple ports housing fast-response
photodetectors and dynamic pressure gauges to verify the onset of ignition and to measure flame
propagation rate. The initial pressure was measured with static diaphragm pressure gauges. The
test rig is also instrumented with multiple K-type thermocouples to verify the temperatures of all
the reactants individually, before mixing. The temperature of the gaseous mixture was measured
at several locations, including: the mixer section, the top, and bottom of the reactor. The reactor
was a stainless steel, thick-walled cylinder and the reactor portion of the chamber was lined with
a Pyrex glass tube to ensure a chemically inert test environment. Through two slit windows, the
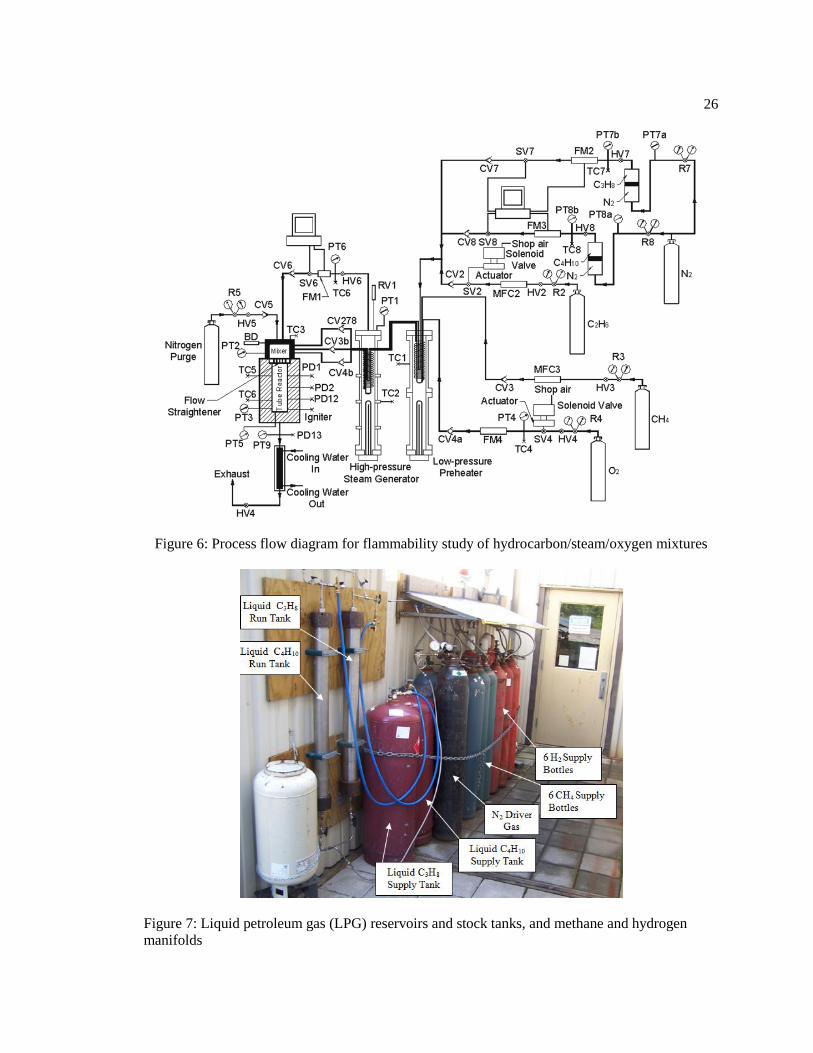
flame propagation process was viewed and recorded with a high-speed camera. The process flow
diagram of the experimental setup is shown in Figure 6. The components of the mixture are
preheated through the steam generator heat exchanger and pre-heater to elevated temperatures
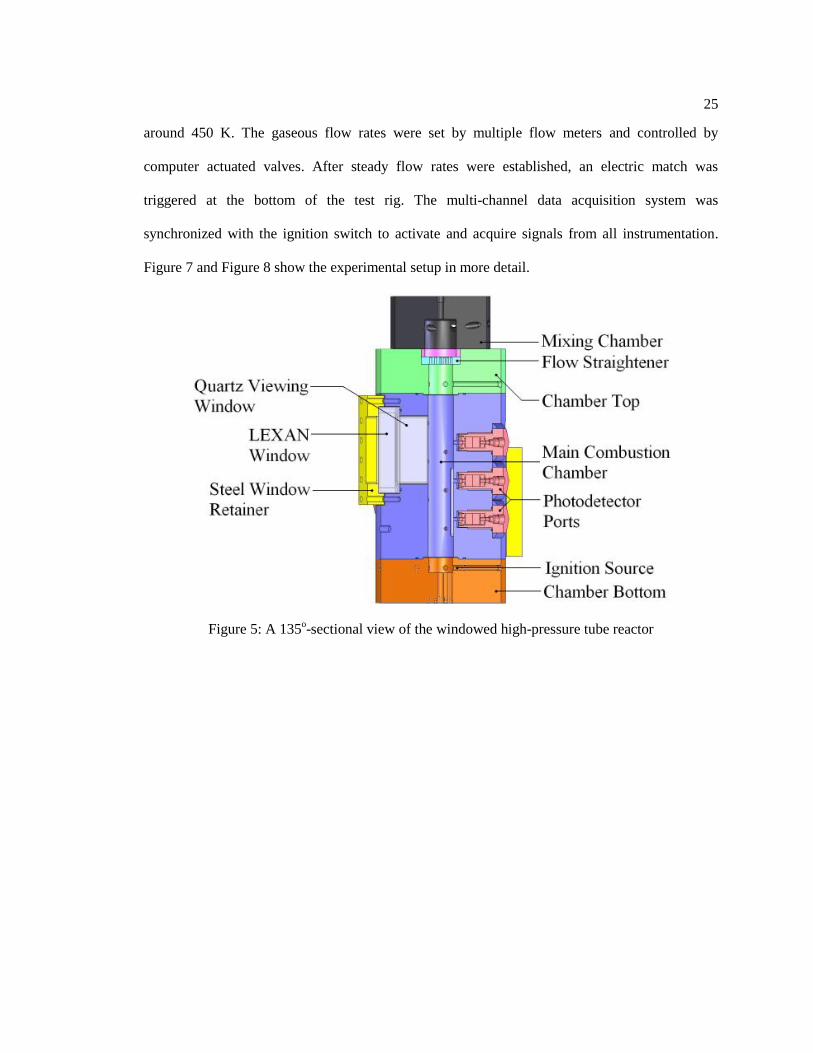
25
around 450 K. The gaseous flow rates were set by multiple flow meters and controlled by
computer actuated valves. After steady flow rates were established, an electric match was
triggered at the bottom of the test rig. The multi-channel data acquisition system was
synchronized with the ignition switch to activate and acquire signals from all instrumentation.
Figure 7 and Figure 8 show the experimental setup in more detail.
Figure 5: A 135o-sectional view of the windowed high-pressure tube reactor
26
Figure 6: Process flow diagram for flammability study of hydrocarbon/steam/oxygen mixtures
Figure 7: Liquid petroleum gas (LPG) reservoirs and stock tanks, and methane and hydrogen
manifolds
27
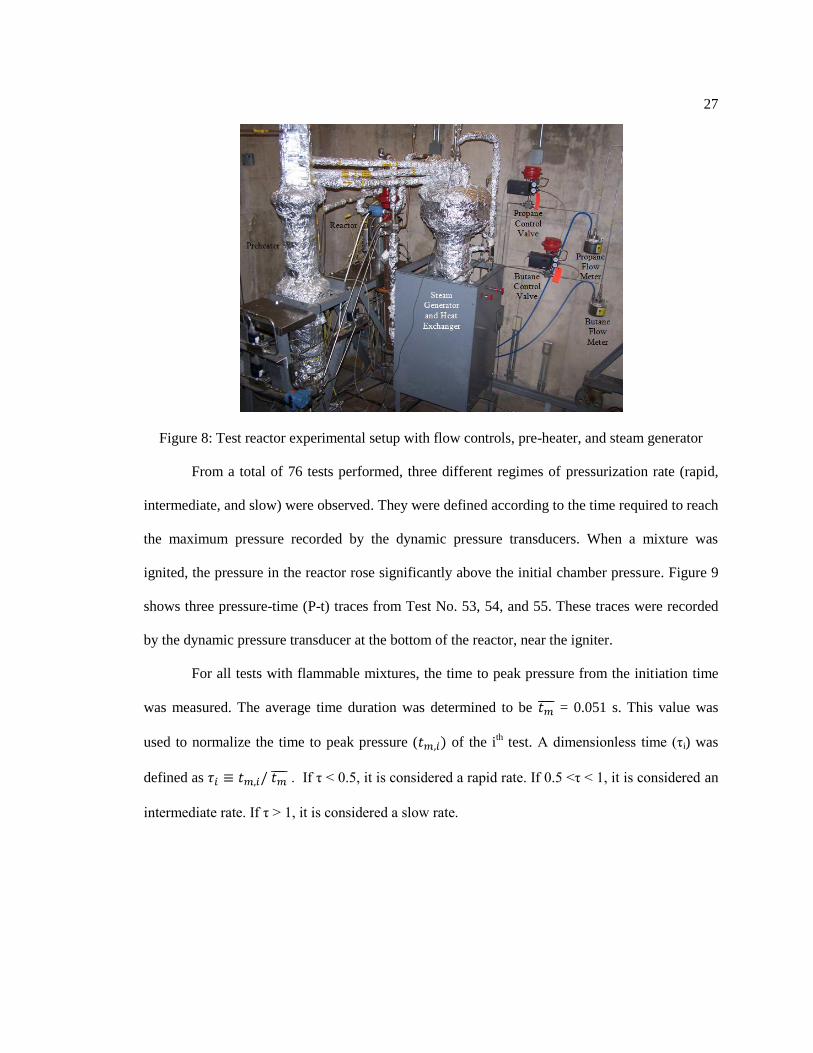
Figure 8: Test reactor experimental setup with flow controls, pre-heater, and steam generator
From a total of 76 tests performed, three different regimes of pressurization rate (rapid,
intermediate, and slow) were observed. They were defined according to the time required to reach
the maximum pressure recorded by the dynamic pressure transducers. When a mixture was
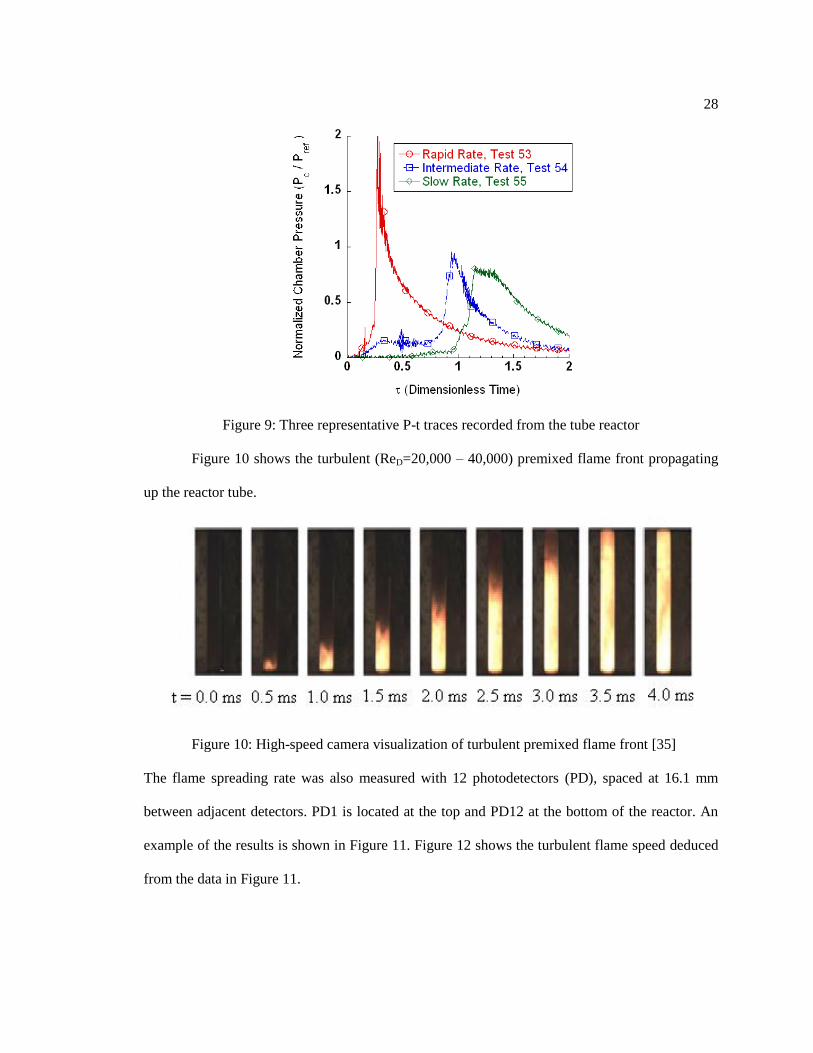
ignited, the pressure in the reactor rose significantly above the initial chamber pressure. Figure 9
shows three pressure-time (P-t) traces from Test No. 53, 54, and 55. These traces were recorded
by the dynamic pressure transducer at the bottom of the reactor, near the igniter.
For all tests with flammable mixtures, the time to peak pressure from the initiation time
was measured. The average time duration was determined to be = 0.051 s. This value was
used to normalize the time to peak pressure ( of the ith test. A dimensionless time (τi) was
defined as . If τ < 0.5, it is considered a rapid rate. If 0.5 <τ < 1, it is considered an
intermediate rate. If τ > 1, it is considered a slow rate.
28
Figure 9: Three representative P-t traces recorded from the tube reactor
Figure 10 shows the turbulent (ReD=20,000 – 40,000) premixed flame front propagating
up the reactor tube.
Figure 10: High-speed camera visualization of turbulent premixed flame front [35]
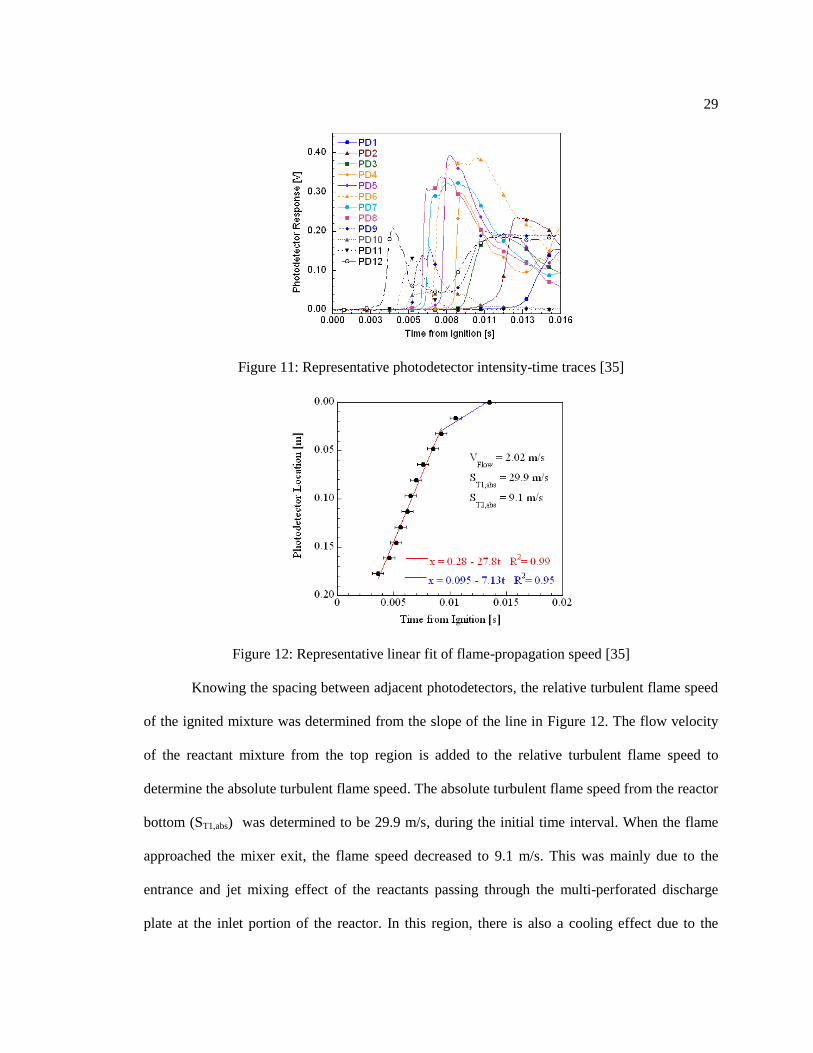
The flame spreading rate was also measured with 12 photodetectors (PD), spaced at 16.1 mm
between adjacent detectors. PD1 is located at the top and PD12 at the bottom of the reactor. An
example of the results is shown in Figure 11. Figure 12 shows the turbulent flame speed deduced
from the data in Figure 11.
29
Figure 11: Representative photodetector intensity-time traces [35]
Figure 12: Representative linear fit of flame-propagation speed [35]
Knowing the spacing between adjacent photodetectors, the relative turbulent flame speed
of the ignited mixture was determined from the slope of the line in Figure 12. The flow velocity
of the reactant mixture from the top region is added to the relative turbulent flame speed to
determine the absolute turbulent flame speed. The absolute turbulent flame speed from the reactor
bottom (ST1,abs) was determined to be 29.9 m/s, during the initial time interval. When the flame
approached the mixer exit, the flame speed decreased to 9.1 m/s. This was mainly due to the
entrance and jet mixing effect of the reactants passing through the multi-perforated discharge
plate at the inlet portion of the reactor. In this region, there is also a cooling effect due to the
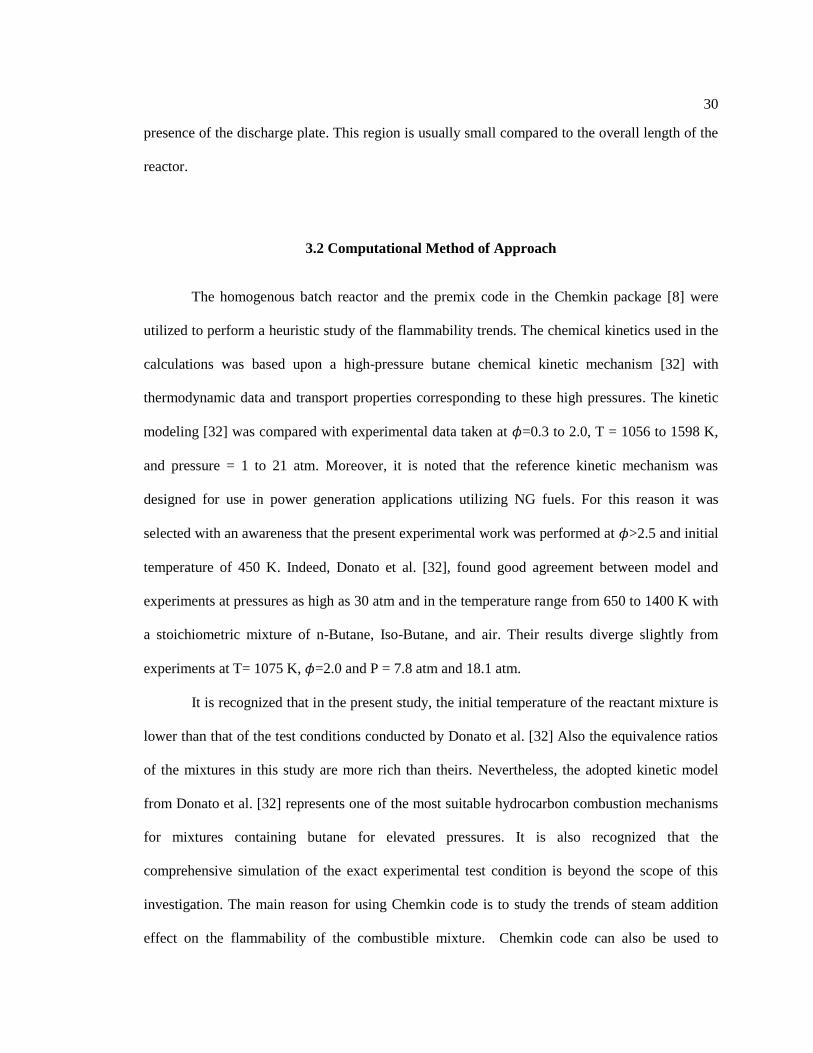
30
presence of the discharge plate. This region is usually small compared to the overall length of the
reactor.
3.2 Computational Method of Approach
The homogenous batch reactor and the premix code in the Chemkin package [8] were
utilized to perform a heuristic study of the flammability trends. The chemical kinetics used in the
calculations was based upon a high-pressure butane chemical kinetic mechanism [32] with
thermodynamic data and transport properties corresponding to these high pressures. The kinetic
modeling [32] was compared with experimental data taken at =0.3 to 2.0, T = 1056 to 1598 K,
and pressure = 1 to 21 atm. Moreover, it is noted that the reference kinetic mechanism was
designed for use in power generation applications utilizing NG fuels. For this reason it was
selected with an awareness that the present experimental work was performed at >2.5 and initial
temperature of 450 K. Indeed, Donato et al. [32], found good agreement between model and
experiments at pressures as high as 30 atm and in the temperature range from 650 to 1400 K with
a stoichiometric mixture of n-Butane, Iso-Butane, and air. Their results diverge slightly from
experiments at T= 1075 K, =2.0 and P = 7.8 atm and 18.1 atm.
It is recognized that in the present study, the initial temperature of the reactant mixture is
lower than that of the test conditions conducted by Donato et al. [32] Also the equivalence ratios
of the mixtures in this study are more rich than theirs. Nevertheless, the adopted kinetic model
from Donato et al. [32] represents one of the most suitable hydrocarbon combustion mechanisms
for mixtures containing butane for elevated pressures. It is also recognized that the
comprehensive simulation of the exact experimental test condition is beyond the scope of this
investigation. The main reason for using Chemkin code is to study the trends of steam addition
effect on the flammability of the combustible mixture. Chemkin code can also be used to

31
perform sensitivity studies, which were beneficial in the investigation of reaction mechanisms
that could suppress flammability.
32
Chapter 4
Experimentation
4.1 Instrumentation
The data obtained from experimentation was organized into pressure, photodetector, and
flow rate data. Other data, such as temperature, was recorded immediately before triggering the
system with omega K-type thermocouples at various locations, given in Appendix A.
4.1.1 Pressurization Data
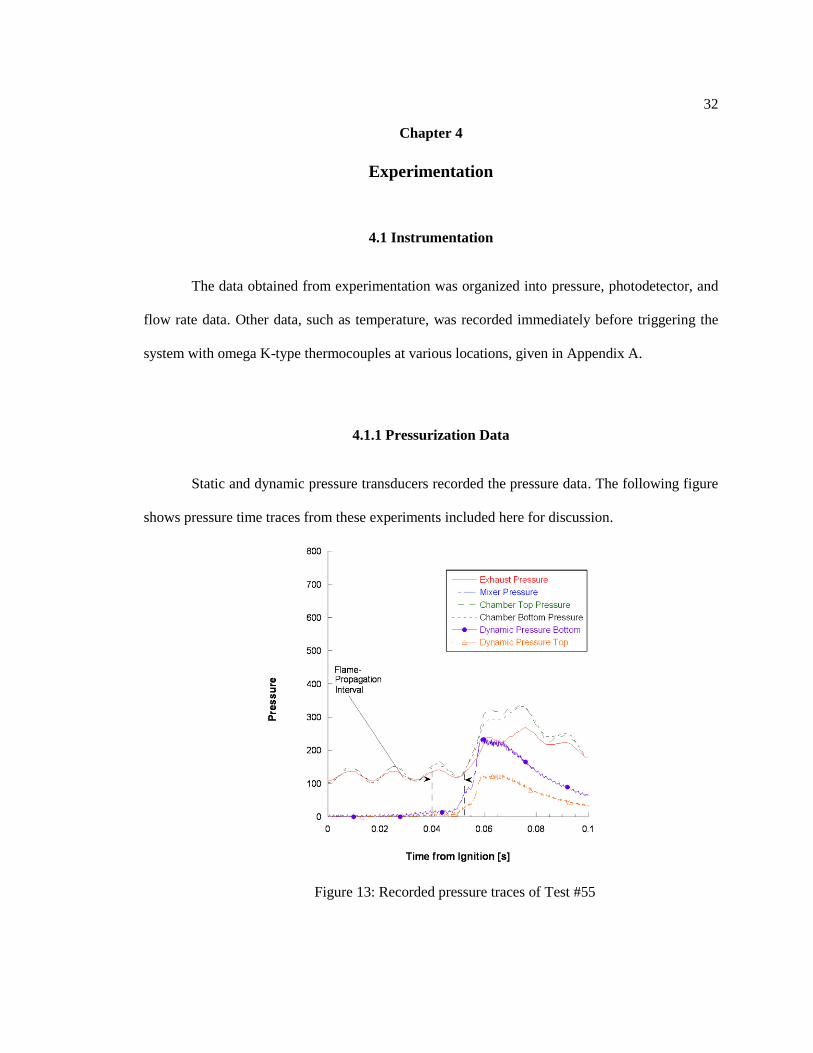
Static and dynamic pressure transducers recorded the pressure data. The following figure
shows pressure time traces from these experiments included here for discussion.
Figure 13: Recorded pressure traces of Test #55
33
The output from setra model # 206 static pressure transducers contained a 60-Hz noise as
in Test # 55, Figure 13. These oscillations in the static gauges could be smoothed graphically, but
as they were used mainly for initial chamber pressure readings corrections were performed by
averaging over 0.1 seconds before ignition. The dynamic pressure gauge p-t traces show a period
of slow rise followed by a flame propagation interval, and then by a sharp rise in pressure. At a
time of 0 seconds the igniter is triggered, the chemical reactions occur in a time scale on the order
of . The initial chemical reactions, that occur in , build a pool of radicals. The thermal
induction period, , then increases the growth rate of this pool until an ignition occurs. As
mentioned in the literature review, induction time is a key parameter in understanding any
ignition observed. Also, the rate of pressure rise, dP/dt, after the induction period indicates the
extent of the heat release of the reactions.
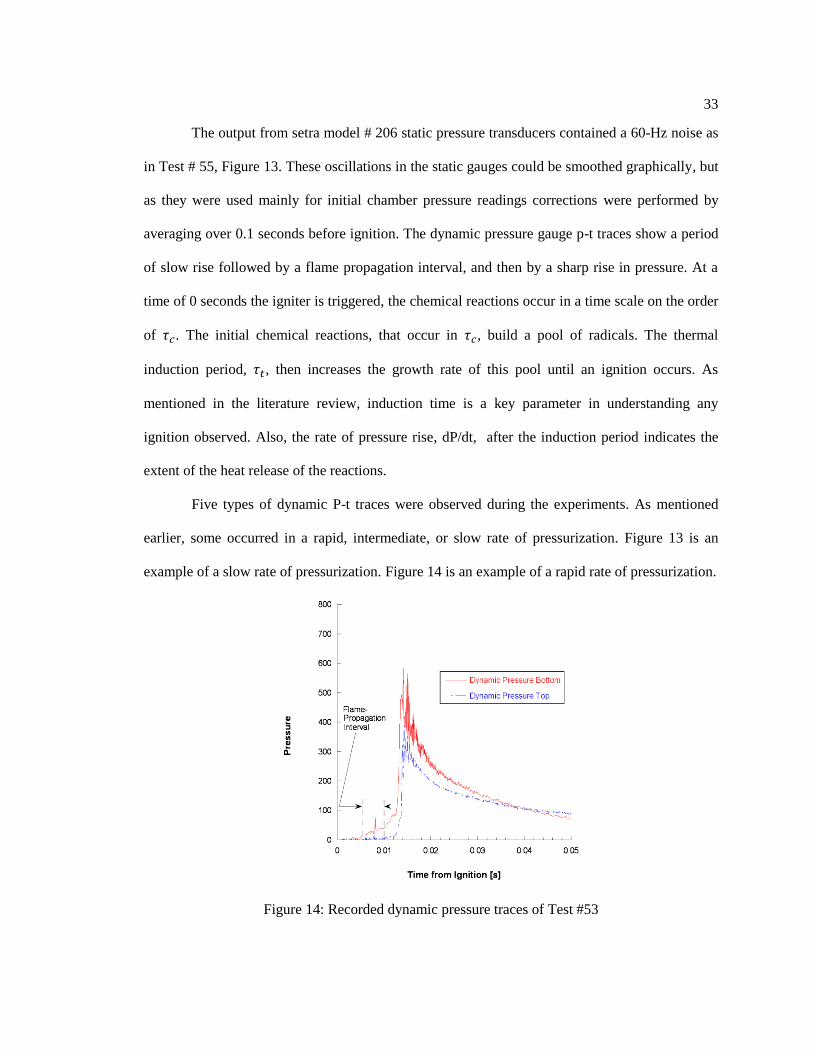
Five types of dynamic P-t traces were observed during the experiments. As mentioned
earlier, some occurred in a rapid, intermediate, or slow rate of pressurization. Figure 13 is an
example of a slow rate of pressurization. Figure 14 is an example of a rapid rate of pressurization.
Figure 14: Recorded dynamic pressure traces of Test #53
34
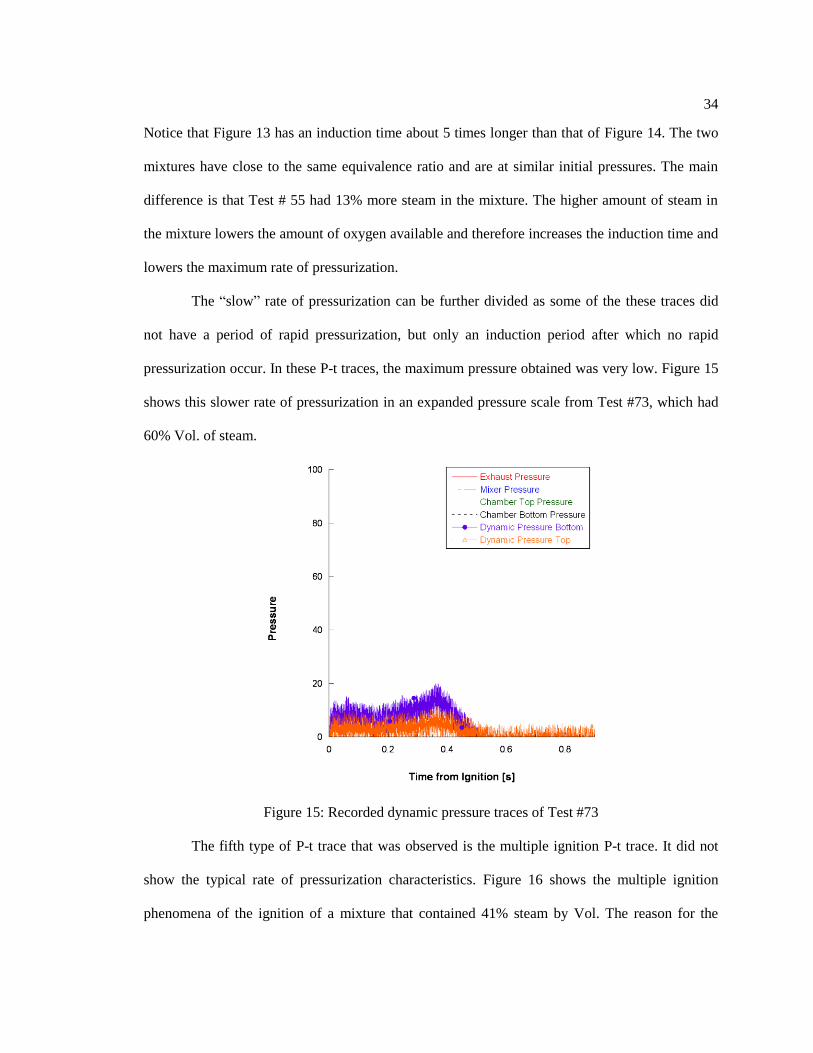
Notice that Figure 13 has an induction time about 5 times longer than that of Figure 14. The two
mixtures have close to the same equivalence ratio and are at similar initial pressures. The main
difference is that Test # 55 had 13% more steam in the mixture. The higher amount of steam in
the mixture lowers the amount of oxygen available and therefore increases the induction time and
lowers the maximum rate of pressurization.
The “slow” rate of pressurization can be further divided as some of the these traces did
not have a period of rapid pressurization, but only an induction period after which no rapid
pressurization occur. In these P-t traces, the maximum pressure obtained was very low. Figure 15
shows this slower rate of pressurization in an expanded pressure scale from Test #73, which had
60% Vol. of steam.
Figure 15: Recorded dynamic pressure traces of Test #73
The fifth type of P-t trace that was observed is the multiple ignition P-t trace. It did not
show the typical rate of pressurization characteristics. Figure 16 shows the multiple ignition
phenomena of the ignition of a mixture that contained 41% steam by Vol. The reason for the
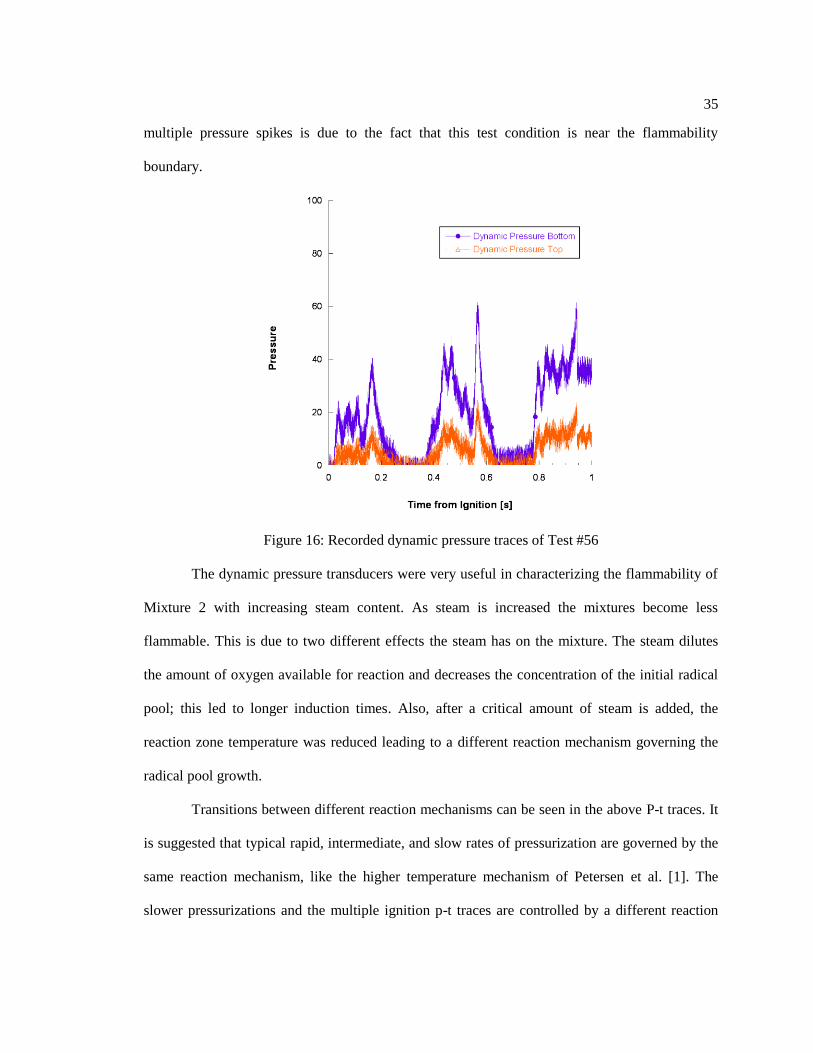
35
multiple pressure spikes is due to the fact that this test condition is near the flammability
boundary.
Figure 16: Recorded dynamic pressure traces of Test #56
The dynamic pressure transducers were very useful in characterizing the flammability of
Mixture 2 with increasing steam content. As steam is increased the mixtures become less
flammable. This is due to two different effects the steam has on the mixture. The steam dilutes
the amount of oxygen available for reaction and decreases the concentration of the initial radical
pool; this led to longer induction times. Also, after a critical amount of steam is added, the
reaction zone temperature was reduced leading to a different reaction mechanism governing the
radical pool growth.
Transitions between different reaction mechanisms can be seen in the above P-t traces. It
is suggested that typical rapid, intermediate, and slow rates of pressurization are governed by the
same reaction mechanism, like the higher temperature mechanism of Petersen et al. [1]. The
slower pressurizations and the multiple ignition p-t traces are controlled by a different reaction
36
mechanism, like the intermediate and low-temperature mechanisms described by Petersen et al.
[1]
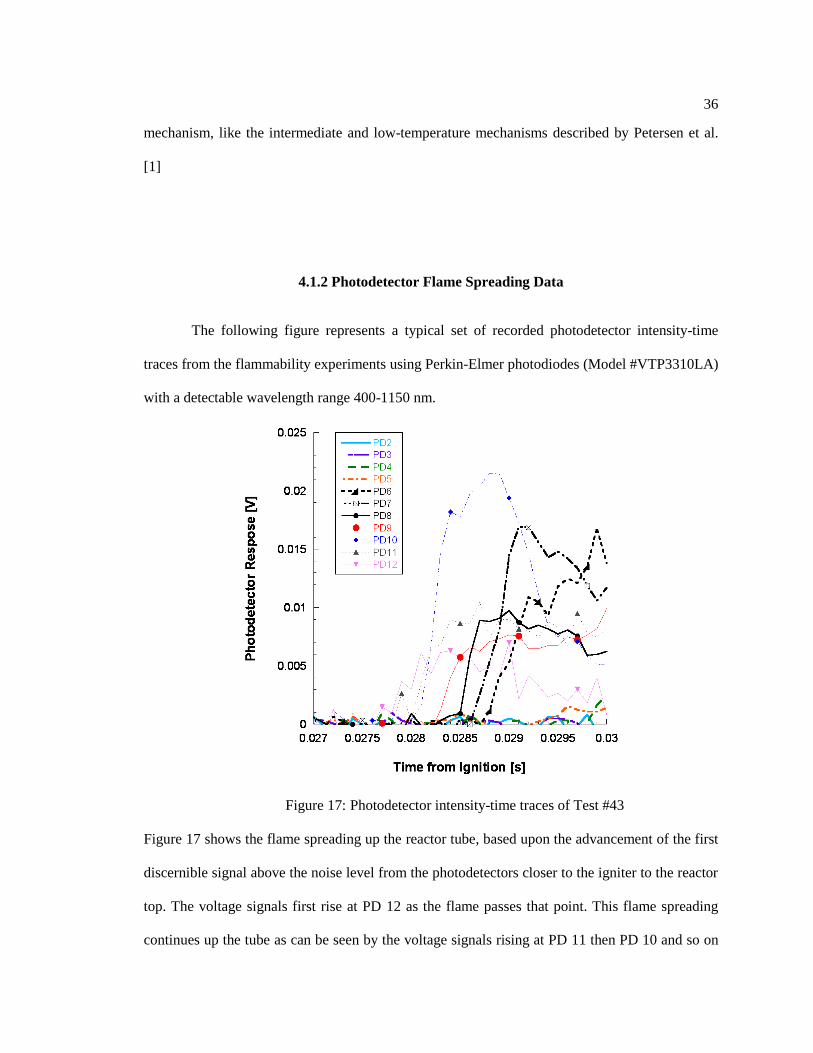
4.1.2 Photodetector Flame Spreading Data
The following figure represents a typical set of recorded photodetector intensity-time
traces from the flammability experiments using Perkin-Elmer photodiodes (Model #VTP3310LA)
with a detectable wavelength range 400-1150 nm.
Figure 17: Photodetector intensity-time traces of Test #43
Figure 17 shows the flame spreading up the reactor tube, based upon the advancement of the first
discernible signal above the noise level from the photodetectors closer to the igniter to the reactor
top. The voltage signals first rise at PD 12 as the flame passes that point. This flame spreading
continues up the tube as can be seen by the voltage signals rising at PD 11 then PD 10 and so on
37
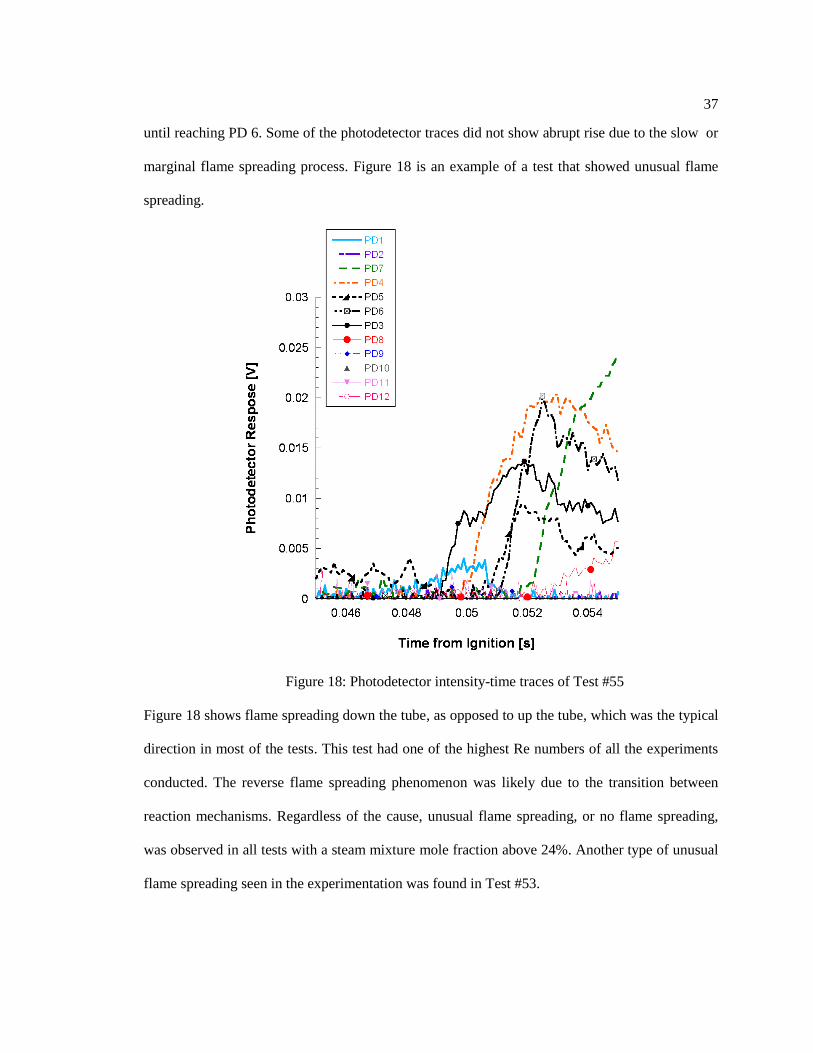
until reaching PD 6. Some of the photodetector traces did not show abrupt rise due to the slow or
marginal flame spreading process. Figure 18 is an example of a test that showed unusual flame
spreading.
Figure 18: Photodetector intensity-time traces of Test #55
Figure 18 shows flame spreading down the tube, as opposed to up the tube, which was the typical
direction in most of the tests. This test had one of the highest Re numbers of all the experiments
conducted. The reverse flame spreading phenomenon was likely due to the transition between
reaction mechanisms. Regardless of the cause, unusual flame spreading, or no flame spreading,
was observed in all tests with a steam mixture mole fraction above 24%. Another type of unusual
flame spreading seen in the experimentation was found in Test #53.
38
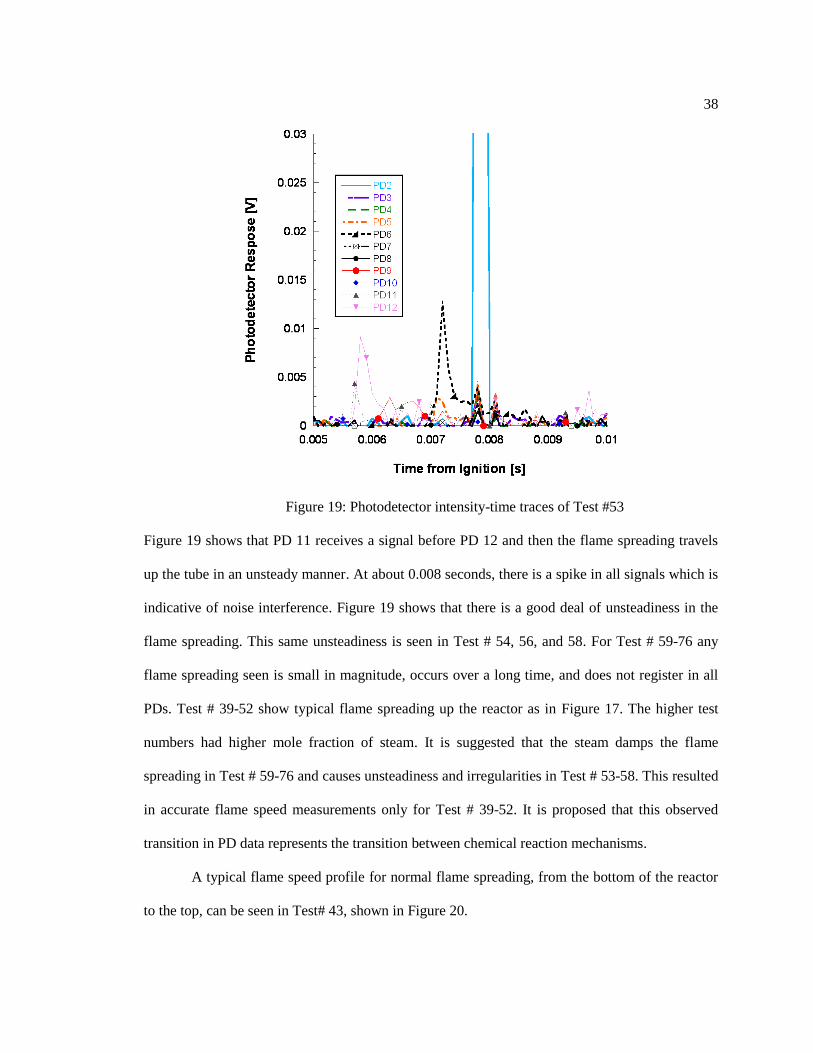
Figure 19: Photodetector intensity-time traces of Test #53
Figure 19 shows that PD 11 receives a signal before PD 12 and then the flame spreading travels
up the tube in an unsteady manner. At about 0.008 seconds, there is a spike in all signals which is
indicative of noise interference. Figure 19 shows that there is a good deal of unsteadiness in the
flame spreading. This same unsteadiness is seen in Test # 54, 56, and 58. For Test # 59-76 any
flame spreading seen is small in magnitude, occurs over a long time, and does not register in all
PDs. Test # 39-52 show typical flame spreading up the reactor as in Figure 17. The higher test
numbers had higher mole fraction of steam. It is suggested that the steam damps the flame
spreading in Test # 59-76 and causes unsteadiness and irregularities in Test # 53-58. This resulted
in accurate flame speed measurements only for Test # 39-52. It is proposed that this observed
transition in PD data represents the transition between chemical reaction mechanisms.
A typical flame speed profile for normal flame spreading, from the bottom of the reactor
to the top, can be seen in Test# 43, shown in Figure 20.
39
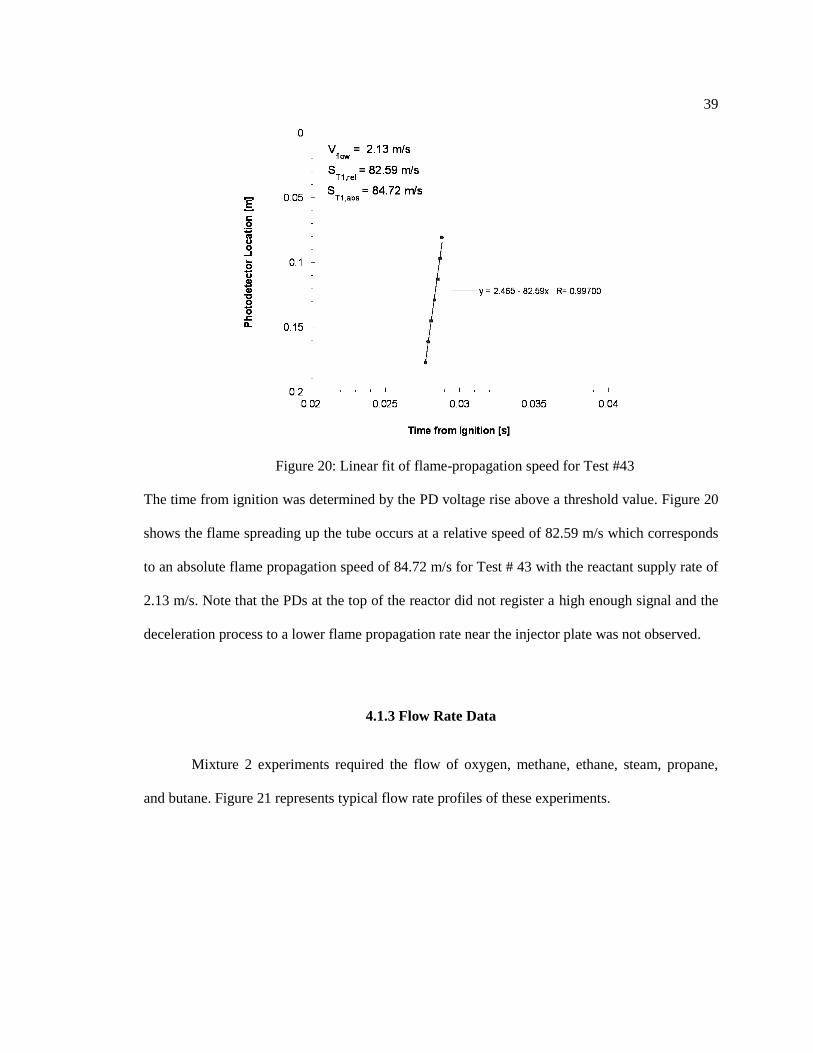
Figure 20: Linear fit of flame-propagation speed for Test #43
The time from ignition was determined by the PD voltage rise above a threshold value. Figure 20
shows the flame spreading up the tube occurs at a relative speed of 82.59 m/s which corresponds
to an absolute flame propagation speed of 84.72 m/s for Test # 43 with the reactant supply rate of
2.13 m/s. Note that the PDs at the top of the reactor did not register a high enough signal and the
deceleration process to a lower flame propagation rate near the injector plate was not observed.
4.1.3 Flow Rate Data
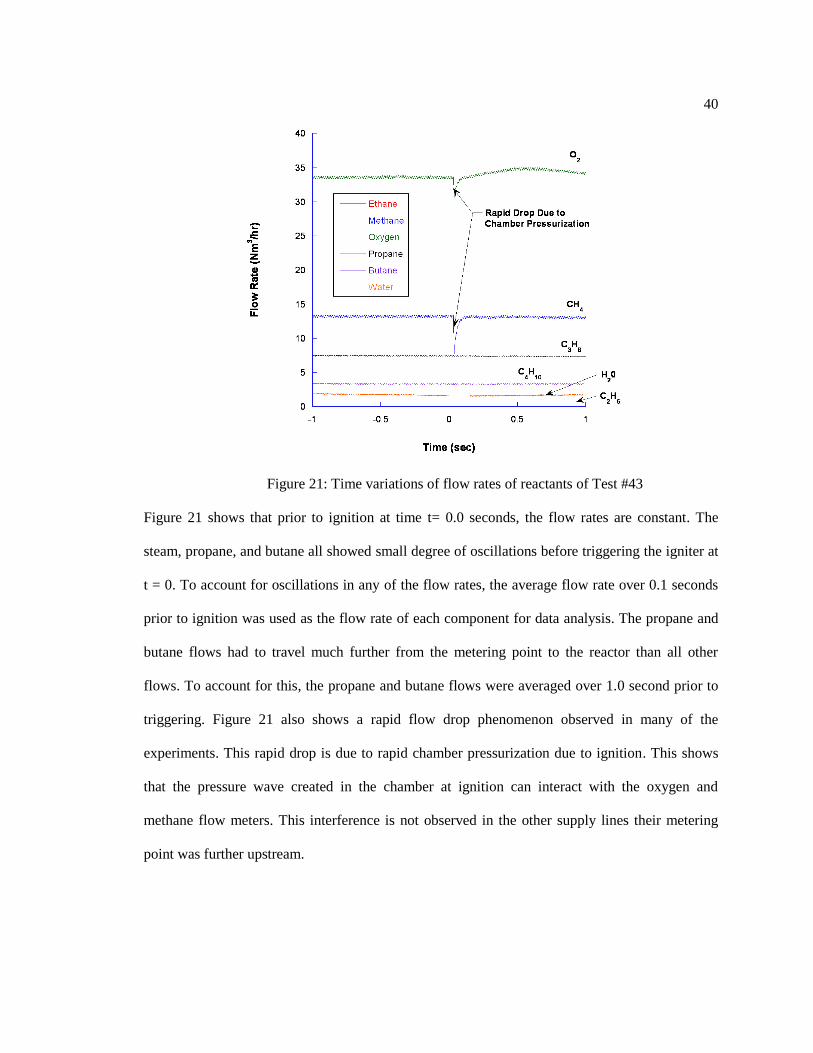
Mixture 2 experiments required the flow of oxygen, methane, ethane, steam, propane,
and butane. Figure 21 represents typical flow rate profiles of these experiments.
40
Figure 21: Time variations of flow rates of reactants of Test #43
Figure 21 shows that prior to ignition at time t= 0.0 seconds, the flow rates are constant. The
steam, propane, and butane all showed small degree of oscillations before triggering the igniter at
t = 0. To account for oscillations in any of the flow rates, the average flow rate over 0.1 seconds
prior to ignition was used as the flow rate of each component for data analysis. The propane and
butane flows had to travel much further from the metering point to the reactor than all other
flows. To account for this, the propane and butane flows were averaged over 1.0 second prior to
triggering. Figure 21 also shows a rapid flow drop phenomenon observed in many of the
experiments. This rapid drop is due to rapid chamber pressurization due to ignition. This shows
that the pressure wave created in the chamber at ignition can interact with the oxygen and
methane flow meters. This interference is not observed in the other supply lines their metering
point was further upstream.
41
4.1.4 Ignition Source
One major point of interest that was not fully investigated in these experiments was the
effect of the igniter location on flammability of the mixture. In Mixture 1 testing, the igniter (a J-
tek electric match with its head covered with a thin layer of RTV as protective coating) was
inserted from the bottom plate, vertically into the lower portion of the reactor. In Mixture 2 test
series, the igniter was inserted from the side of the bottom plate, horizontally into the reactor. The
head of the electric match was recessed into the bottom plate and also covered by a protective
layer of RTV, so that the hot steam would not heat the electric match to initiate ignition. It is
thought that the configuration in Mixture 2 would create a more even plane of ignition. While,
both igniters release the same amount of minimum energy (4 mJ minimum energy release for J-
tek electric match) it was not shown that the two configurations yielded the same results. In fact,
two of the tests performed for Mixture 1 with the horizontal igniter configuration resulted in a
flammable mixture observation, which was seen as nonflammable with the vertical igniter
configuration. This difference could be due to the hot particles, generated from the electric match,
interacting with a large volume of the relatively cooler mixture in the reactor. For the horizontal
igniter configuration, the hot particles are interacting with a smaller amount of gaseous mixture.
Determining which igniter orientation is more effective at igniting the mixture would be a useful
study for future research. As the literature [23] shows, the flammability limits can be expanded
with greater ignition energy. Ideally, the experiments would incorporate a planar sheet of ignition
energy that would release at least 1 joule of energy [23], which is much higher than the ignition
energy used in this study.
42
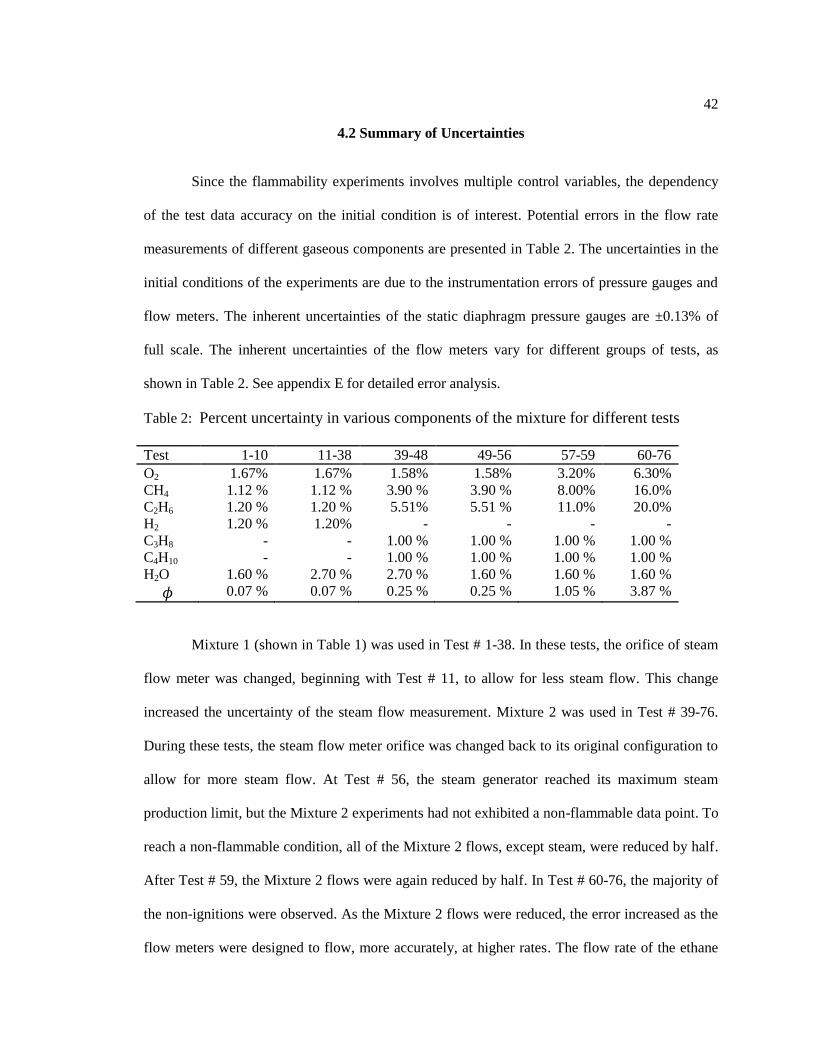
4.2 Summary of Uncertainties
Since the flammability experiments involves multiple control variables, the dependency
of the test data accuracy on the initial condition is of interest. Potential errors in the flow rate
measurements of different gaseous components are presented in Table 2. The uncertainties in the
initial conditions of the experiments are due to the instrumentation errors of pressure gauges and
flow meters. The inherent uncertainties of the static diaphragm pressure gauges are ±0.13% of
full scale. The inherent uncertainties of the flow meters vary for different groups of tests, as
shown in Table 2. See appendix E for detailed error analysis.
Table 2: Percent uncertainty in various components of the mixture for different tests
Test 1-10 11-38 39-48 49-56 57-59 60-76
O2 1.67% 1.67% 1.58% 1.58% 3.20% 6.30%
CH4 1.12 % 1.12 % 3.90 % 3.90 % 8.00% 16.0%
C2H6 1.20 % 1.20 % 5.51% 5.51 % 11.0% 20.0%
H2 1.20 % 1.20% - - - -
C3H8 - - 1.00 % 1.00 % 1.00 % 1.00 %
C4H10 - - 1.00 % 1.00 % 1.00 % 1.00 %
H2O 1.60 % 2.70 % 2.70 % 1.60 % 1.60 % 1.60 %
0.07 % 0.07 % 0.25 % 0.25 % 1.05 % 3.87 %
Mixture 1 (shown in Table 1) was used in Test # 1-38. In these tests, the orifice of steam
flow meter was changed, beginning with Test # 11, to allow for less steam flow. This change
increased the uncertainty of the steam flow measurement. Mixture 2 was used in Test # 39-76.
During these tests, the steam flow meter orifice was changed back to its original configuration to
allow for more steam flow. At Test # 56, the steam generator reached its maximum steam
production limit, but the Mixture 2 experiments had not exhibited a non-flammable data point. To
reach a non-flammable condition, all of the Mixture 2 flows, except steam, were reduced by half.
After Test # 59, the Mixture 2 flows were again reduced by half. In Test # 60-76, the majority of
the non-ignitions were observed. As the Mixture 2 flows were reduced, the error increased as the
flow meters were designed to flow, more accurately, at higher rates. The flow rate of the ethane
43
and methane was reduced to a level that lies in the lower limit of the flow meter’s control
capability. This resulted in relatively high error of the methane and ethane flow rates in Test # 57-
76. The error in the measurement of ethane has a small effect on the flammability of the mixture
as it constitutes a very small fraction of the mixture. This resulted in a maximum error on the
equivalence ratio of the mixture, which was found to be 3.87% in Test # 60-76.
Other error found in the experiments is due to human error in controlling multiple
variables. As seen in Appendix D, an efficient checklist for controlling these experiments was
developed. Following this checklist ensured success by overcoming difficulties in the control of
the Liquid Petroleum Gas (LPG) system, eliminating potential auto-ignitions, and maintaining
run conditions at initiation. Accurate control of the LPG system was one of the most challenging
issues in this research. The saturation properties of Propane and Butane complicate the
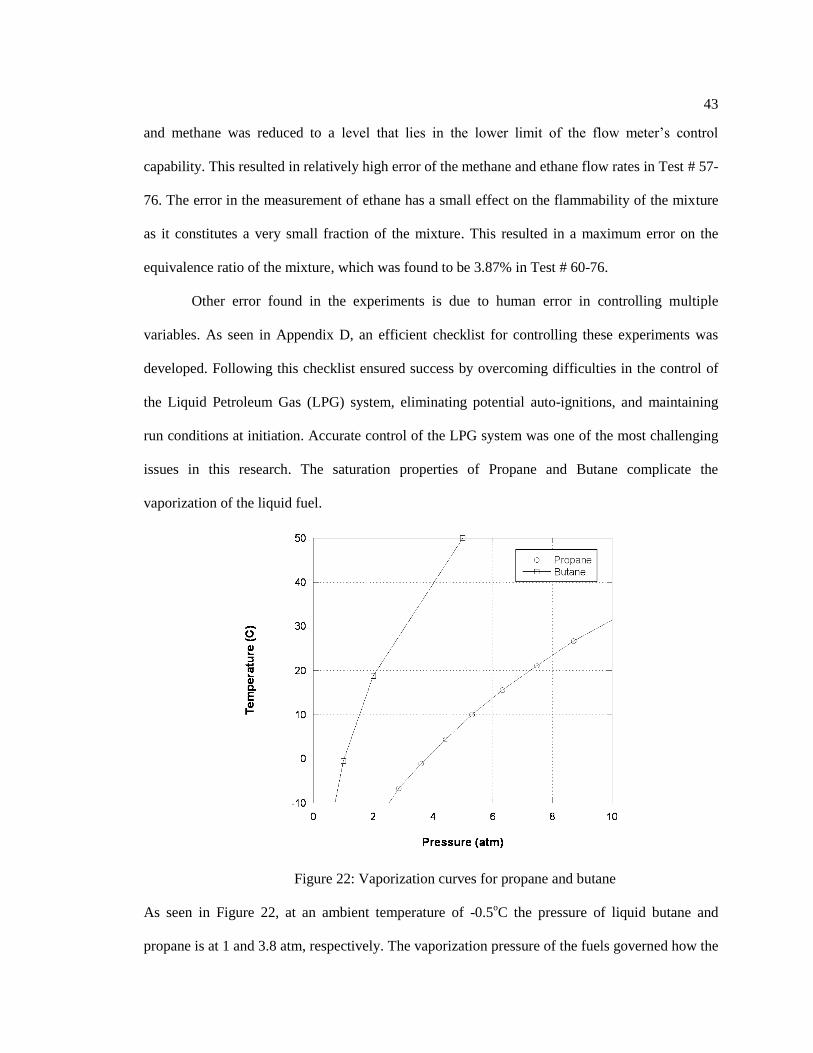
vaporization of the liquid fuel.
Figure 22: Vaporization curves for propane and butane
As seen in Figure 22, at an ambient temperature of -0.5oC the pressure of liquid butane and
propane is at 1 and 3.8 atm, respectively. The vaporization pressure of the fuels governed how the
44
run tanks, seen in Figure 7, were filled. If the vaporization pressure is too low, around 1 atm, the
piston in the run tank cannot be compressed by the fuel vapor. Therefore, the run tank cannot be
filled by the liquid supply tank. If the vapor pressure is too high (e.g., warm propane during the
summer time), the run tank would contain mostly the vapor rather than liquid. This situation
causes the run time to be shorter than required test duration. To solve these problems, in relatively
cold ambient conditions (<10 oC ), the butane tank was wrapped in a hot water heat exchanger
and the piston in the run tank was lowered by pressurized N2 to allow the tank to be completely
filled. In warmer conditions (>20 oC), the propane piston was forced to the top of the run tank
with pressurized N2. As the propane was filling the run tank, the nitrogen vent was slightly
cracked open allowing the propane to fill with more liquid than vapor. Both of these methods
were incorporated in all test preparation to ensure proper filling of the run tanks.
In addition to this issue with the LPG system, the LPG control valves have integrated
controls that interfere with the Proportional Integral Derivative (PID) Labview controller, causing
oscillations in the flows. The PID controller was then tuned to damp out the oscillations within 1
minute of flow initiation.
In the first few tests, the oxygen flow rate was set to the specified value in just one step.
In one of the earlier tests, a rapid increase in oxygen flow caused an autoignition. This resulted in
changing the procedure to increasing the oxygen flow in two steps and also flowing nitrogen
while the oxygen flow was being initiated. This procedure prevented the occurrence of
autoignition in any subsequent tests.
Another major issue with these experiments was the difficulty in controlling the steam
flow rate. During Mixture 2 testing, it was found that the required steam flow rates were
significantly higher than those necessary to prevent ignition in the Mixture 1 study. In the
Mixture 1 configuration, the steam flow control system was capable of accurately flowing and
measuring up to ~1.4 Nm3/hr. By moving the Rosemount fixed orifice flow meter to a location
45
upstream of the control valve, the higher-density state of the steam allowed the flow to be
accurately measured up to values of approximately 40 Nm3/hr. The work performed in changing
the maximum flow rate of the steam flow meter was assisted by Mr. Robert Hutchinson of the
Office of the Physical Plant at Penn State University. His familiarity with the Rosemount steam
flow meters was very helpful and he allowed us to borrow his laptop which contained software
that enlightened the team on the odd problems that were occurring with the steam flow meter. It
was found that if the pressure drop across the orifice was higher than a critical value, the steam
flow rate could jump to the full value, which is not the actual metered value. This problem was
solved by using adequate orifice size to limit the magnitude of the pressure drop.
4.3 Safety Analysis
From a safety operation point-of-view, a study was conducted to predict the maximum
chamber pressure if the reactant mixture is detonated upon the initiation of the igniter. In this
study, the baseline gas mixtures were given in Table 1 in Chapter 1. NASA’s Chemical
Equilibrium with Applications (CEA2) Code was used to predict the theoretical maximum
chamber pressures that could be reached if all reactants burned instantaneously to equilibrium
products. The constant-volume (uv) option was used to model the system. Results of these
calculations for the two different baseline gas mixtures containing different proportions of
propane and butane are shown in
Figure 23. In this figure the red line corresponds to Mixture 2 and the blue line corresponds to
another proposed mixture, which has a greater volumetric supply rate of butane than propane in
the Mixture 2. As shown in this figure, if there is no heat loss or mass loss, the reactor pressure
could reach very high levels (P ~400 atm) for an initial pressure of 30 atm. Real-world maximum
pressures will always be lower due to the realistic conditions of finite-rate chemistry, non-
46
equilibrium products, heat loss, and the vented steady-flow chamber condition. However, an
efficiency factor can be developed at lower initial pressures based on measured pressure jumps
compared to the calculated values. For example, the Test# 42 with initial pressure of 9.4 atm
resulted in peak pressure of about 41 atm. This efficiency factor is about 40%. However, earlier
tests with less steam resulted in a peak pressure of over 54 atm, yielding an efficiency of over
50%. The efficiency factor is expected to increase with the initial chamber pressure, as the
reaction rates become faster at higher pressures. Conservatively applied, this factor can then be
used to estimate a safe upper operating limit for the system. By controlling the initial chamber
pressure to be below 18 atm, the maximum chamber pressure will be safely below 100 atm,
which corresponds to maximum operating pressure of the test facility by using the dry mixture.
With the addition of steam higher initial pressures could be utilized since the steam significantly
lowered the efficiency factor. The highest initial chamber pressure tested for Mixture 2 was 21
atm, while Mixture 1 tests had a maximum initial pressure of 30 atm, since it is less energetic
than Mixture 2.
47
Figure 23: Theoretically calculated maximum pressures for equilibrium reaction of
NG+LPG/steam/O2 as a function of initial chamber pressure with two different fuel ratios of LPG
48
Chapter 5
Chemkin Code Calculations
5.1 Overview of Calculations
Two separate methods of calculation were attempted with Chemkin Code to show general
flammability trends of the mixtures. The premix code in the Chemkin package was used to look
at the chemical reactions that occur in the experiment and how they could affect flammability of
the mixture. The homogenous batch reactor model was used to study flammability trends and also
give a simple method for performing sensitivity studies.
5.2 Premixed Laminar Flame Speed Calculations
The following is a conceptual diagram illustrating the steps and options involved in the
development of the premixed laminar flame speed reactor model in Chemkin:
49
Figure 24: Conceptual diagram of the Chemkin premixed laminar flame speed model
Once the model was specified, a temperature, axial velocity, and species solution to the
conservation equations was solved. The initial guess of the temperature profile and flame
thickness was very important to obtain a converged solution. The profile guess has to be close to
the actual solution for convergence. The Chemkin premix code was used to find the point in
which the steam content of the mixture was high enough to reduce the axial velocity (laminar
flame speed) to below 50 mm/s in order to suppress ignition.
As seen in Figure 24, Chemkin gives several viable options for the premixed laminar
flame speed model. To determine the solution options and grid criteria that provide a reliable
solution, the following studies were conducted. These studies were performed at a pressure of 10
atm, which was the average pressure used in the reaction mechanism. A grid convergence study
was conducted on the sensitivity of the flame-front temperature and axial velocity to the number
Flame Speed Calculation Model
Solution Model Options
•Use Intermediate Fixed Temperature solution
•Use Mixture average or Multicomponent Diffusion
•Use Correction Velocity Formalism or Trace Species Approximation
Reactor Physical Properties
• Initial Temperature
• Initial Pressure
•Guess Temperature Profile
Initial Grid Properties
•Grid Points
•Gradient and Curvature
• Flame Thickness Descriptioin
Species Specific Properies
• Product Species (Calculated from CEA)
• Intermediate Species Assumptions
Inlet Description
Inlet Velocity
Inlet Reactants
Solver
Specify Solution
Convergence Criteria
Windward or Central
Differenceing
Output Control
Option used for Sensitivity
Studies
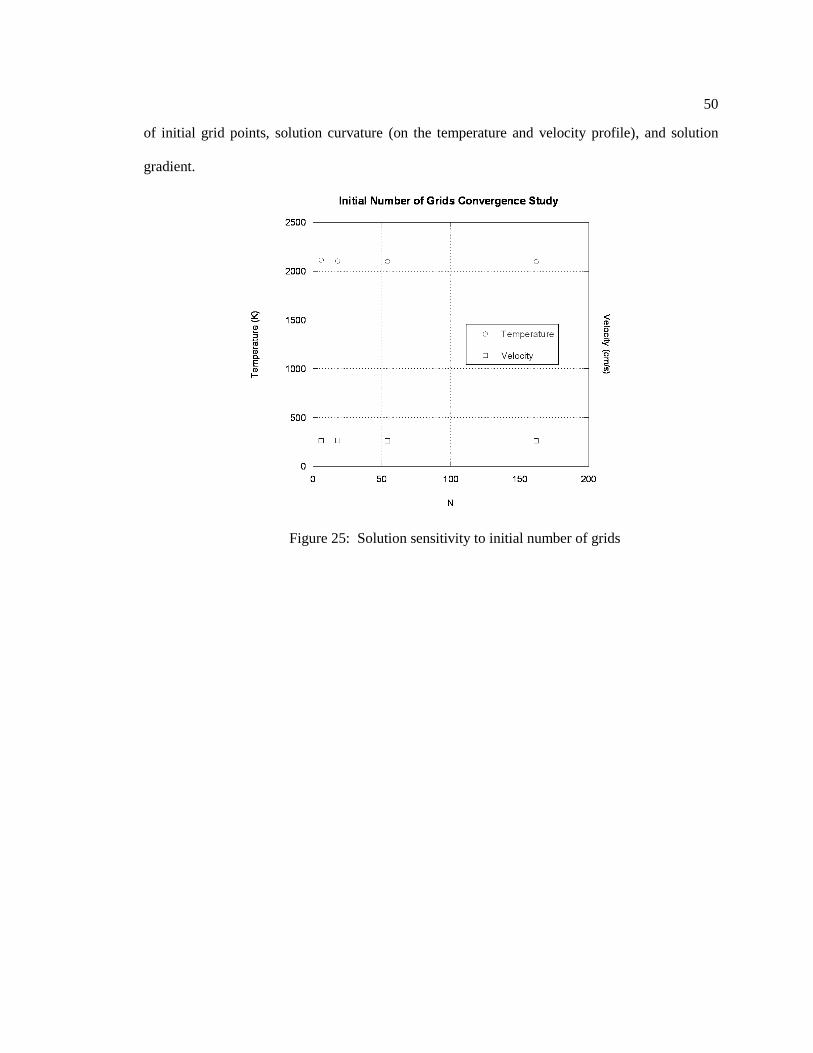
50
of initial grid points, solution curvature (on the temperature and velocity profile), and solution
gradient.
Figure 25: Solution sensitivity to initial number of grids
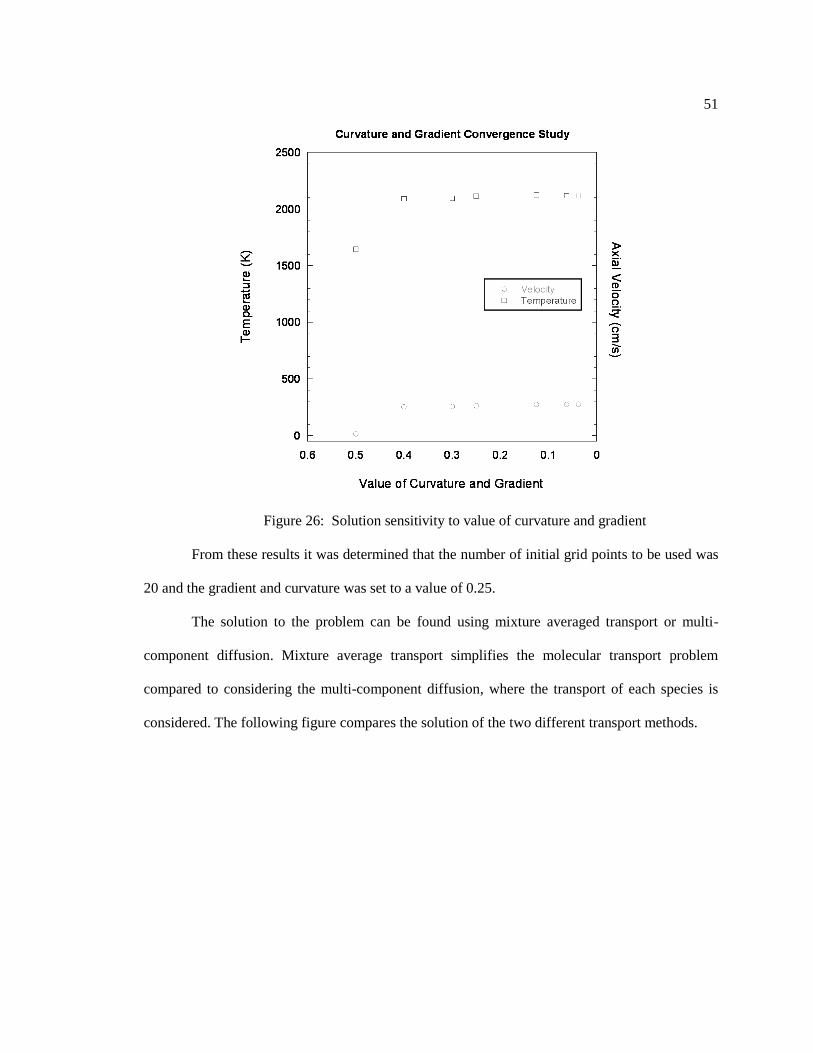
51
Figure 26: Solution sensitivity to value of curvature and gradient
From these results it was determined that the number of initial grid points to be used was
20 and the gradient and curvature was set to a value of 0.25.
The solution to the problem can be found using mixture averaged transport or multi-
component diffusion. Mixture average transport simplifies the molecular transport problem
compared to considering the multi-component diffusion, where the transport of each species is
considered. The following figure compares the solution of the two different transport methods.
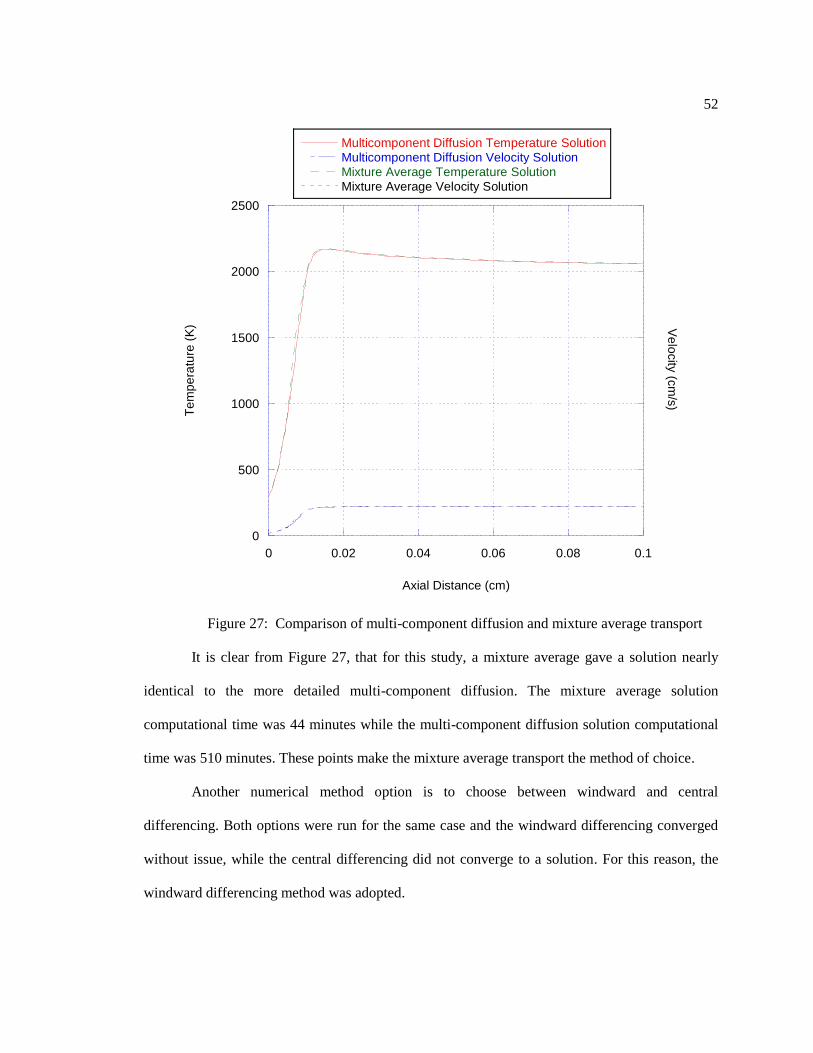
52
Figure 27: Comparison of multi-component diffusion and mixture average transport
It is clear from Figure 27, that for this study, a mixture average gave a solution nearly
identical to the more detailed multi-component diffusion. The mixture average solution
computational time was 44 minutes while the multi-component diffusion solution computational
time was 510 minutes. These points make the mixture average transport the method of choice.
Another numerical method option is to choose between windward and central
differencing. Both options were run for the same case and the windward differencing converged
without issue, while the central differencing did not converge to a solution. For this reason, the
windward differencing method was adopted.
0
500
1000
1500
2000
2500
0 0.02 0.04 0.06 0.08 0.1
Data 2 4:35:43 PM 10/23/2009
Multicomponent Diffusion Temperature SolutionMulticomponent Diffusion Velocity SolutionMixture Average Temperature SolutionMixture Average Velocity Solution
Te
mp
era
ture
(K
)
Axial Distance (cm)
Ve
locity
(cm
/s)
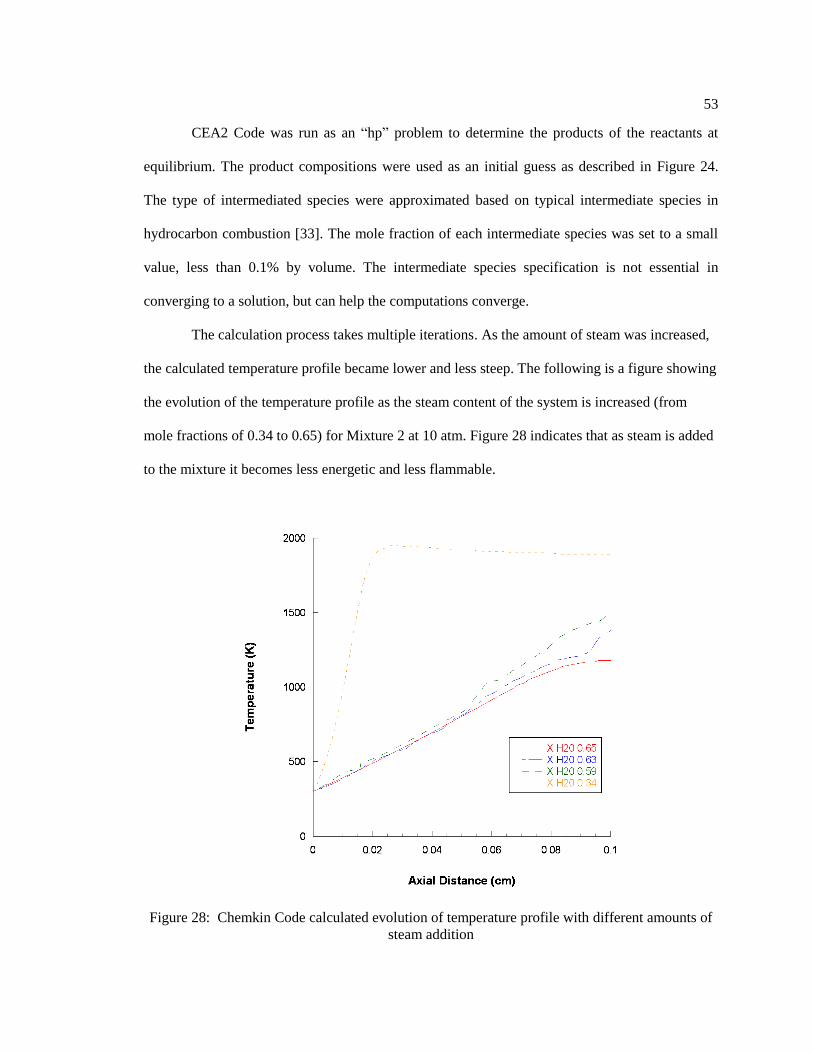
53
CEA2 Code was run as an “hp” problem to determine the products of the reactants at
equilibrium. The product compositions were used as an initial guess as described in Figure 24.
The type of intermediated species were approximated based on typical intermediate species in
hydrocarbon combustion [33]. The mole fraction of each intermediate species was set to a small
value, less than 0.1% by volume. The intermediate species specification is not essential in
converging to a solution, but can help the computations converge.
The calculation process takes multiple iterations. As the amount of steam was increased,
the calculated temperature profile became lower and less steep. The following is a figure showing
the evolution of the temperature profile as the steam content of the system is increased (from
mole fractions of 0.34 to 0.65) for Mixture 2 at 10 atm. Figure 28 indicates that as steam is added
to the mixture it becomes less energetic and less flammable.
Figure 28: Chemkin Code calculated evolution of temperature profile with different amounts of
steam addition
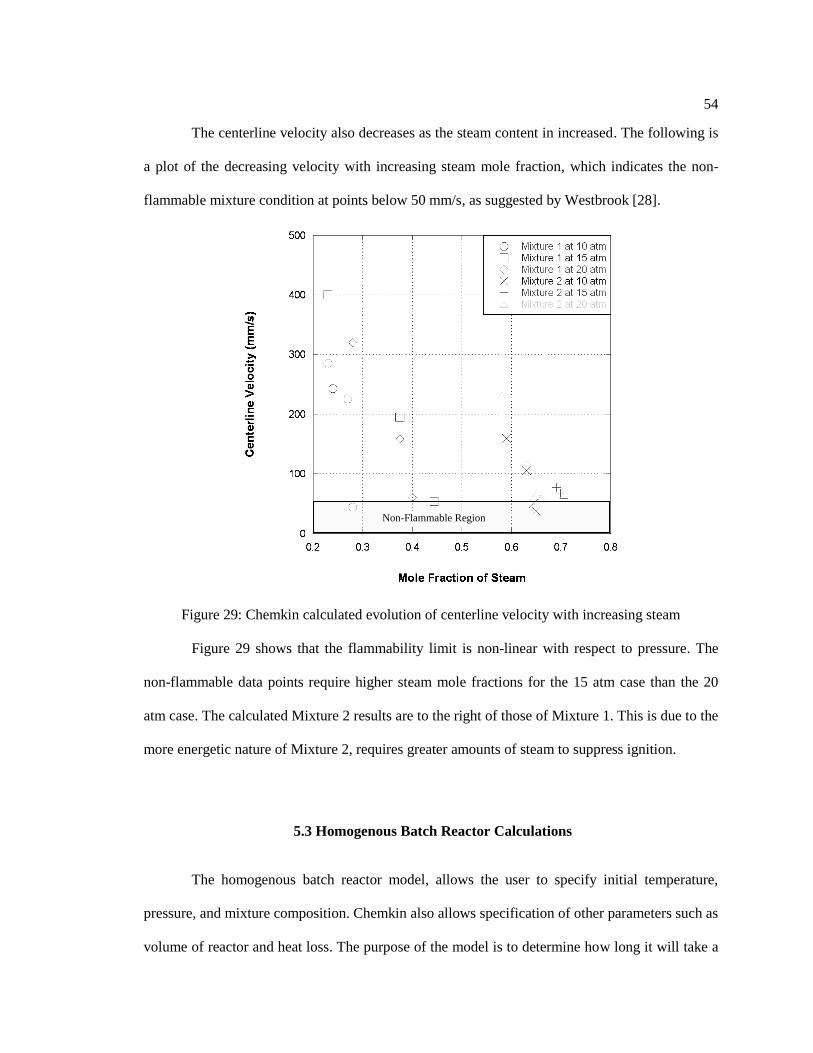
54
The centerline velocity also decreases as the steam content in increased. The following is
a plot of the decreasing velocity with increasing steam mole fraction, which indicates the non-
flammable mixture condition at points below 50 mm/s, as suggested by Westbrook [28].
Figure 29: Chemkin calculated evolution of centerline velocity with increasing steam
Figure 29 shows that the flammability limit is non-linear with respect to pressure. The
non-flammable data points require higher steam mole fractions for the 15 atm case than the 20
atm case. The calculated Mixture 2 results are to the right of those of Mixture 1. This is due to the
more energetic nature of Mixture 2, requires greater amounts of steam to suppress ignition.
5.3 Homogenous Batch Reactor Calculations
The homogenous batch reactor model, allows the user to specify initial temperature,
pressure, and mixture composition. Chemkin also allows specification of other parameters such as
volume of reactor and heat loss. The purpose of the model is to determine how long it will take a
Non-Flammable Region
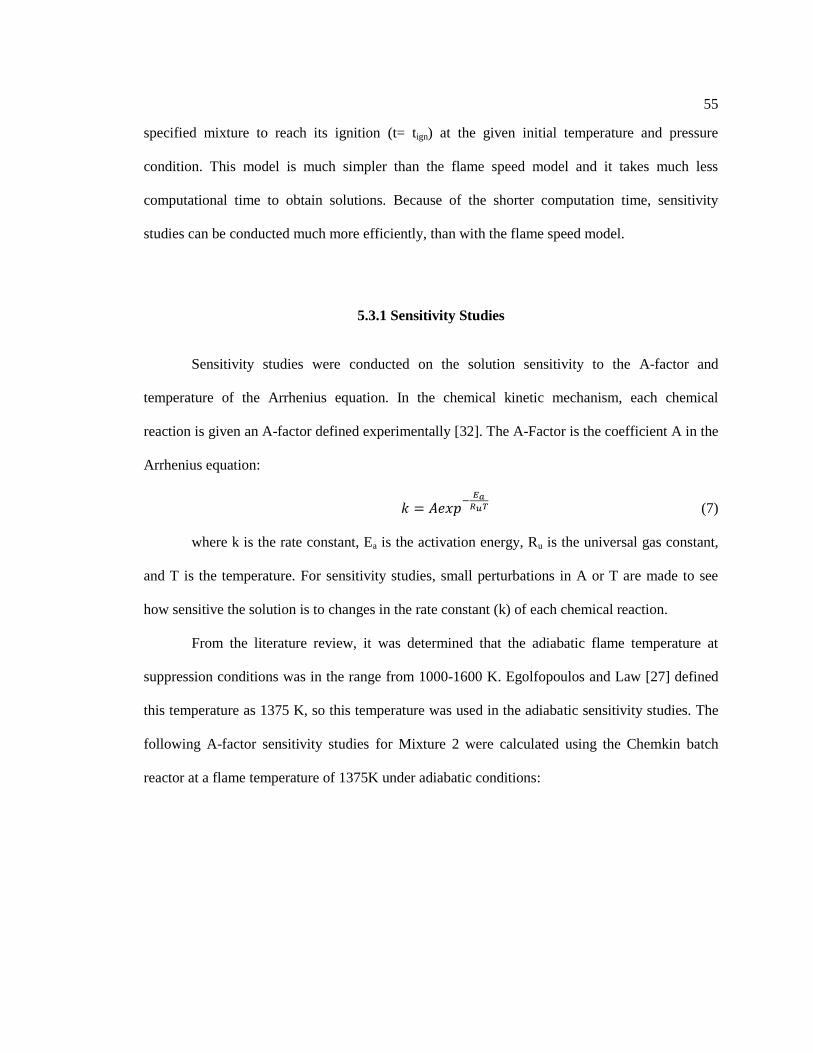
55
specified mixture to reach its ignition (t= tign) at the given initial temperature and pressure
condition. This model is much simpler than the flame speed model and it takes much less
computational time to obtain solutions. Because of the shorter computation time, sensitivity
studies can be conducted much more efficiently, than with the flame speed model.
5.3.1 Sensitivity Studies
Sensitivity studies were conducted on the solution sensitivity to the A-factor and
temperature of the Arrhenius equation. In the chemical kinetic mechanism, each chemical
reaction is given an A-factor defined experimentally [32]. The A-Factor is the coefficient A in the
Arrhenius equation:
(7)
where k is the rate constant, Ea is the activation energy, Ru is the universal gas constant,
and T is the temperature. For sensitivity studies, small perturbations in A or T are made to see
how sensitive the solution is to changes in the rate constant (k) of each chemical reaction.
From the literature review, it was determined that the adiabatic flame temperature at
suppression conditions was in the range from 1000-1600 K. Egolfopoulos and Law [27] defined
this temperature as 1375 K, so this temperature was used in the adiabatic sensitivity studies. The
following A-factor sensitivity studies for Mixture 2 were calculated using the Chemkin batch
reactor at a flame temperature of 1375K under adiabatic conditions:
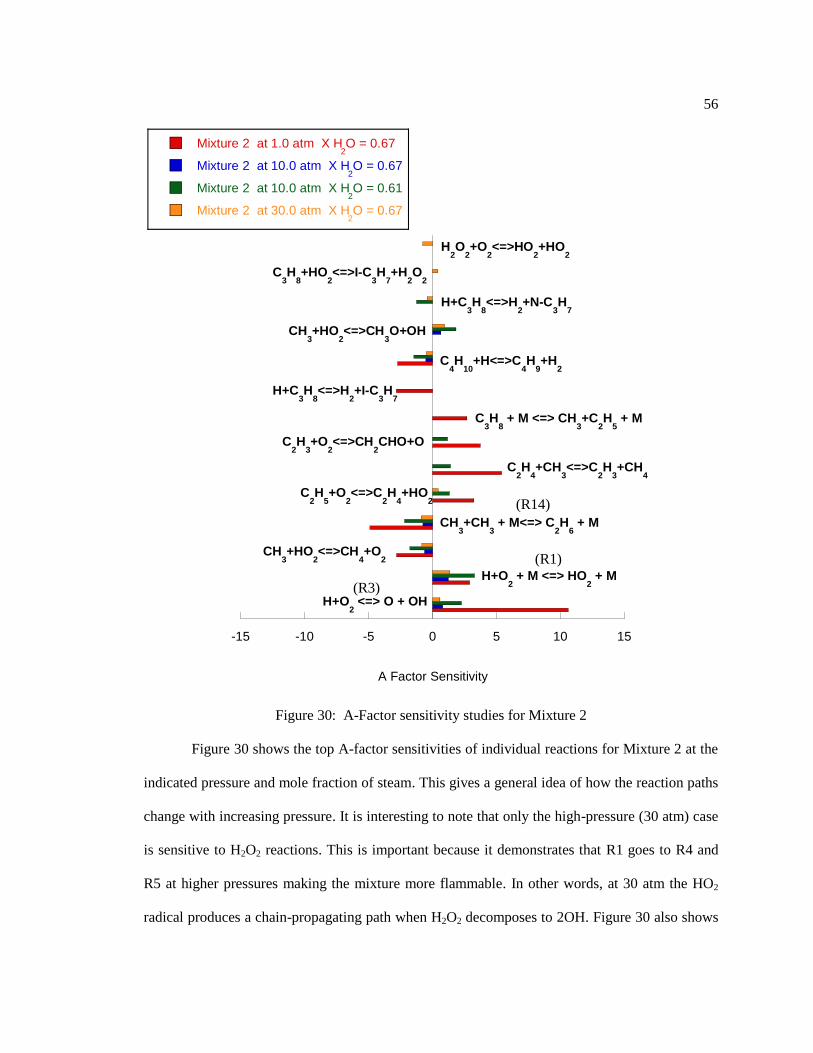
56
Figure 30: A-Factor sensitivity studies for Mixture 2
Figure 30 shows the top A-factor sensitivities of individual reactions for Mixture 2 at the
indicated pressure and mole fraction of steam. This gives a general idea of how the reaction paths
change with increasing pressure. It is interesting to note that only the high-pressure (30 atm) case
is sensitive to H2O2 reactions. This is important because it demonstrates that R1 goes to R4 and
R5 at higher pressures making the mixture more flammable. In other words, at 30 atm the HO2
radical produces a chain-propagating path when H2O2 decomposes to 2OH. Figure 30 also shows
-15 -10 -5 0 5 10 15
Mixture 2 at 1.0 atm X H2O = 0.67
Mixture 2 at 10.0 atm X H2O = 0.67
Mixture 2 at 10.0 atm X H2O = 0.61
Mixture 2 at 30.0 atm X H2O = 0.67
A Factor Sensitivity
H+O2 <=> O + OH
H+O2 + M <=> HO
2 + M
CH3+HO
2<=>CH
4+O
2
CH3+CH
3 + M<=> C
2H
6 + M
C2H
5+O
2<=>C
2H
4+HO
2
C2H
4+CH
3<=>C
2H
3+CH
4
C2H
3+O
2<=>CH
2CHO+O
C3H
8 + M <=> CH
3+C
2H
5 + M
H+C3H
8<=>H
2+I-C
3H
7
C4H
10+H<=>C
4H
9+H
2
CH3+HO
2<=>CH
3O+OH
H+C3H
8<=>H
2+N-C
3H
7
C3H
8+HO
2<=>I-C
3H
7+H
2O
2
H2O
2+O
2<=>HO
2+HO
2
(R3)
(R1)
(R14)
57
multiple chain-branching reactions that could be most dominant depending on the pressure. This
means that the “turning point” could be defined by multiple chain branching reactions.
This A-factor sensitivity study shows that the HO2 molecule goes from a chain-
terminating path to a chain-propagating path as pressure is increased to 30 atm. It also shows that
the “turning point” dominant reactions could potentially change with pressure and steam mole
fraction. These calculated results agree with the information obtained from the literature survey.
Temperature sensitivity studies were also performed on Mixture 1 and 2. These results
can be seen in the figure below.
Figure 31: Temperature sensitivity study for Mixture 1 and 2 at 15 atm
-1 -0.5 0 0.5 1
Mixture 2 at 15 atm , X H20 = 0.86
Mixture 1 at 15 atm , X H20 = 0.012
Mixture 1 at 15 atm , X H20 = 0.197
Temperature Sensitivity
H+O2<=>O+OH
H+O2 + M <=> HO
2 + M
C2H
6+CH
3CO
3<=>C
2H
5+CH
3CO
3H
CH3+HO
2<=>CH
3O+OH
CH3+HO
2<=>CH
4+O
2
CH3+CH
3 + M<=>C
2H
6 + M
C2H
6+CH
3<=>C
2H
5+CH
4
CH3+O
2<=>CH
2O+OH
CH4+H<=>CH
3+H
2
(R3)
(R1)
(R24)
(R16) (R14)
(R26)
(R18)
(R23)
)
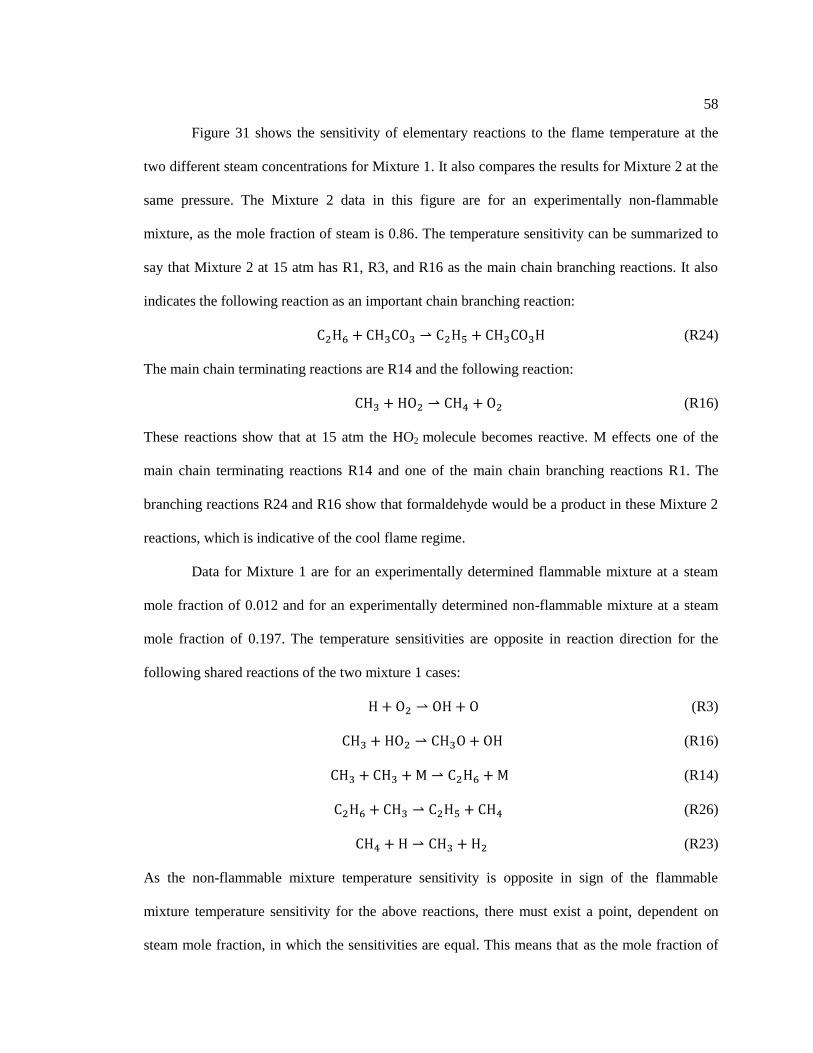
58
Figure 31 shows the sensitivity of elementary reactions to the flame temperature at the
two different steam concentrations for Mixture 1. It also compares the results for Mixture 2 at the
same pressure. The Mixture 2 data in this figure are for an experimentally non-flammable
mixture, as the mole fraction of steam is 0.86. The temperature sensitivity can be summarized to
say that Mixture 2 at 15 atm has R1, R3, and R16 as the main chain branching reactions. It also
indicates the following reaction as an important chain branching reaction:
(R24)
The main chain terminating reactions are R14 and the following reaction:
(R16)
These reactions show that at 15 atm the HO2 molecule becomes reactive. M effects one of the
main chain terminating reactions R14 and one of the main chain branching reactions R1. The
branching reactions R24 and R16 show that formaldehyde would be a product in these Mixture 2
reactions, which is indicative of the cool flame regime.
Data for Mixture 1 are for an experimentally determined flammable mixture at a steam
mole fraction of 0.012 and for an experimentally determined non-flammable mixture at a steam
mole fraction of 0.197. The temperature sensitivities are opposite in reaction direction for the
following shared reactions of the two mixture 1 cases:
(R3)
(R16)
(R14)
(R26)
(R23)
As the non-flammable mixture temperature sensitivity is opposite in sign of the flammable
mixture temperature sensitivity for the above reactions, there must exist a point, dependent on
steam mole fraction, in which the sensitivities are equal. This means that as the mole fraction of
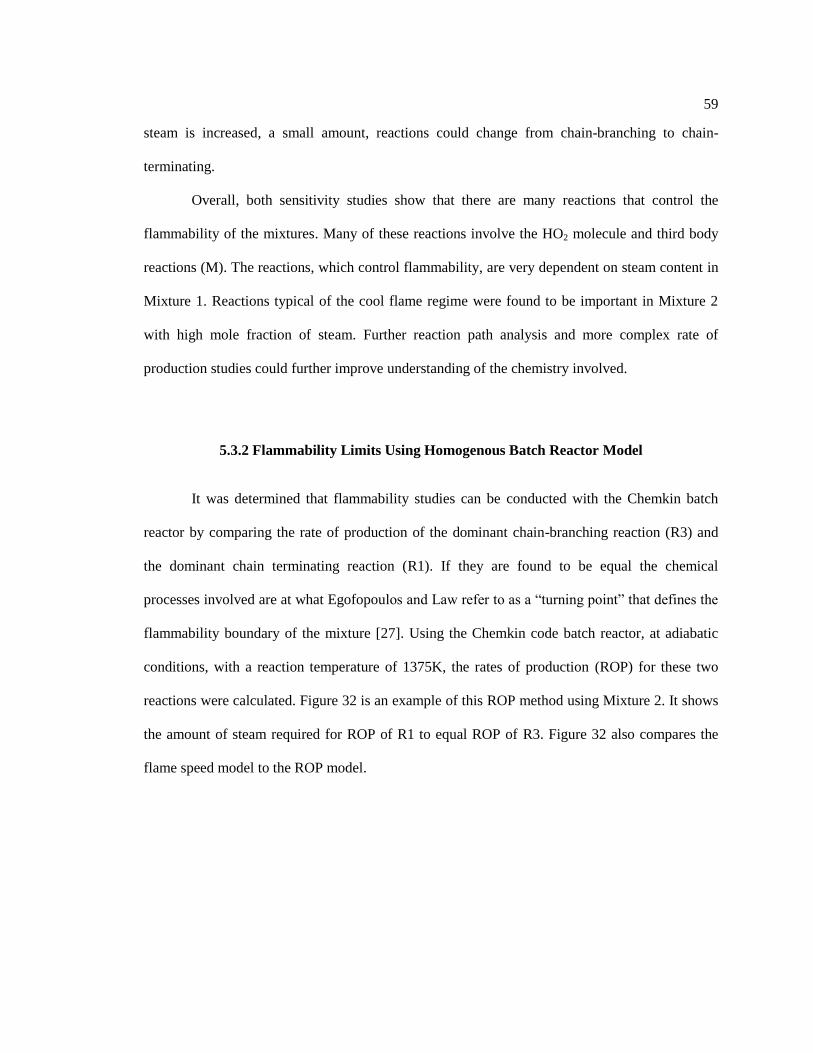
59
steam is increased, a small amount, reactions could change from chain-branching to chain-
terminating.
Overall, both sensitivity studies show that there are many reactions that control the
flammability of the mixtures. Many of these reactions involve the HO2 molecule and third body
reactions (M). The reactions, which control flammability, are very dependent on steam content in
Mixture 1. Reactions typical of the cool flame regime were found to be important in Mixture 2
with high mole fraction of steam. Further reaction path analysis and more complex rate of
production studies could further improve understanding of the chemistry involved.
5.3.2 Flammability Limits Using Homogenous Batch Reactor Model
It was determined that flammability studies can be conducted with the Chemkin batch
reactor by comparing the rate of production of the dominant chain-branching reaction (R3) and
the dominant chain terminating reaction (R1). If they are found to be equal the chemical
processes involved are at what Egofopoulos and Law refer to as a “turning point” that defines the
flammability boundary of the mixture [27]. Using the Chemkin code batch reactor, at adiabatic
conditions, with a reaction temperature of 1375K, the rates of production (ROP) for these two
reactions were calculated. Figure 32 is an example of this ROP method using Mixture 2. It shows
the amount of steam required for ROP of R1 to equal ROP of R3. Figure 32 also compares the
flame speed model to the ROP model.
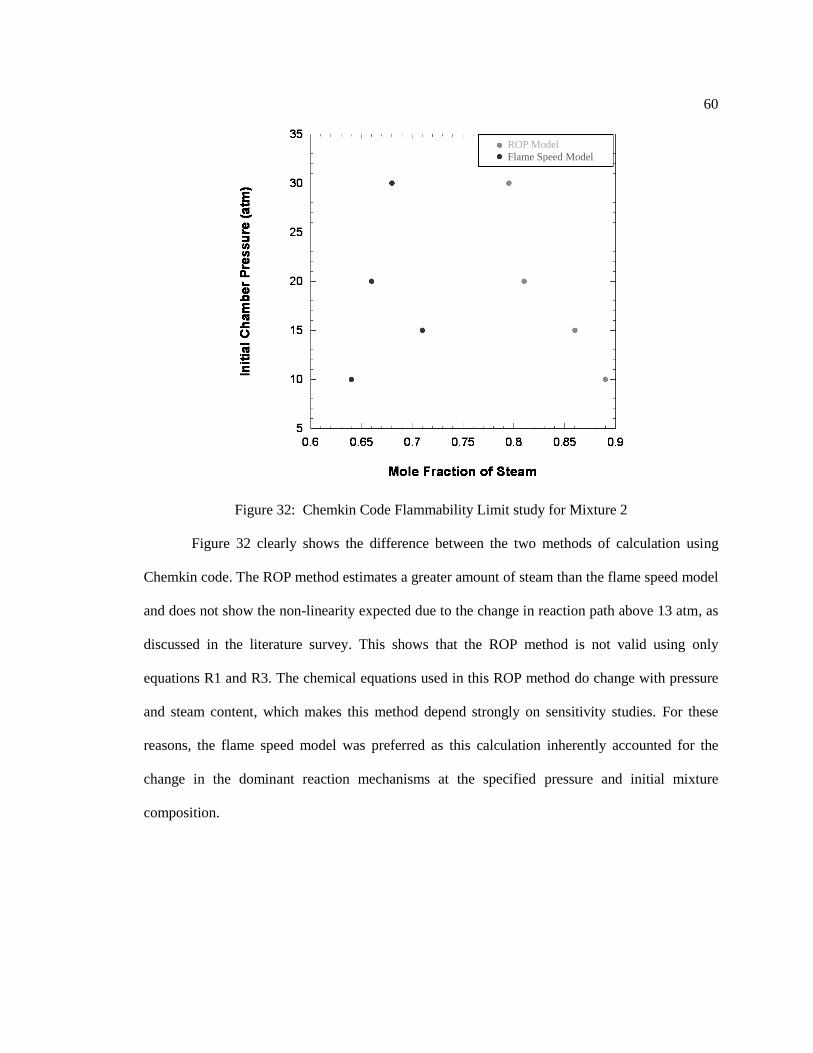
60
Figure 32: Chemkin Code Flammability Limit study for Mixture 2
Figure 32 clearly shows the difference between the two methods of calculation using
Chemkin code. The ROP method estimates a greater amount of steam than the flame speed model
and does not show the non-linearity expected due to the change in reaction path above 13 atm, as
discussed in the literature survey. This shows that the ROP method is not valid using only
equations R1 and R3. The chemical equations used in this ROP method do change with pressure
and steam content, which makes this method depend strongly on sensitivity studies. For these
reasons, the flame speed model was preferred as this calculation inherently accounted for the
change in the dominant reaction mechanisms at the specified pressure and initial mixture
composition.
ROP Model
Flame Speed Model
61
Chapter 6
Discussion of Flammability Results
6.1 Flammability Results Compared with Chemkin Model
Figure 33 shows the Mixture 1 flammability boundary on the plot of pressure vs. mole
fraction of steam. The data points that define the flammability boundary are described by their
regime of combustion defined in Chapter 4. The experimentally determined flammability limit for
Mixture 1 shows that a very small amount of steam (less than 2%) was needed to create a non-
flammable mixture for any of the initial pressures. The limit shows highly non-linear behavior
with increasing pressure. This is similar to the non-linear trends found in the flammability limits
of hydrocarbon combustion discussed in Chapter 2.
Figure 33: Flammability Limits of Mixture 1
62
Figure 34 shows the Mixture 2 flammability limits on the plot of pressure vs. steam mole
fraction. The data points defining the flammability boundary were described by their regime of
combustion as indicated by the symbols in the legend. If a data point has a symbol that is of a
different color than that found in the legend, an abnormality in that result was observed. Details
regarding the abnormality can be seen by the tables in Appendix A. Figure 34 had a flammable
region that was divided into lower and higher reaction temperature regions. The division was
defined at the point in which abnormal ignitions began to be observed.
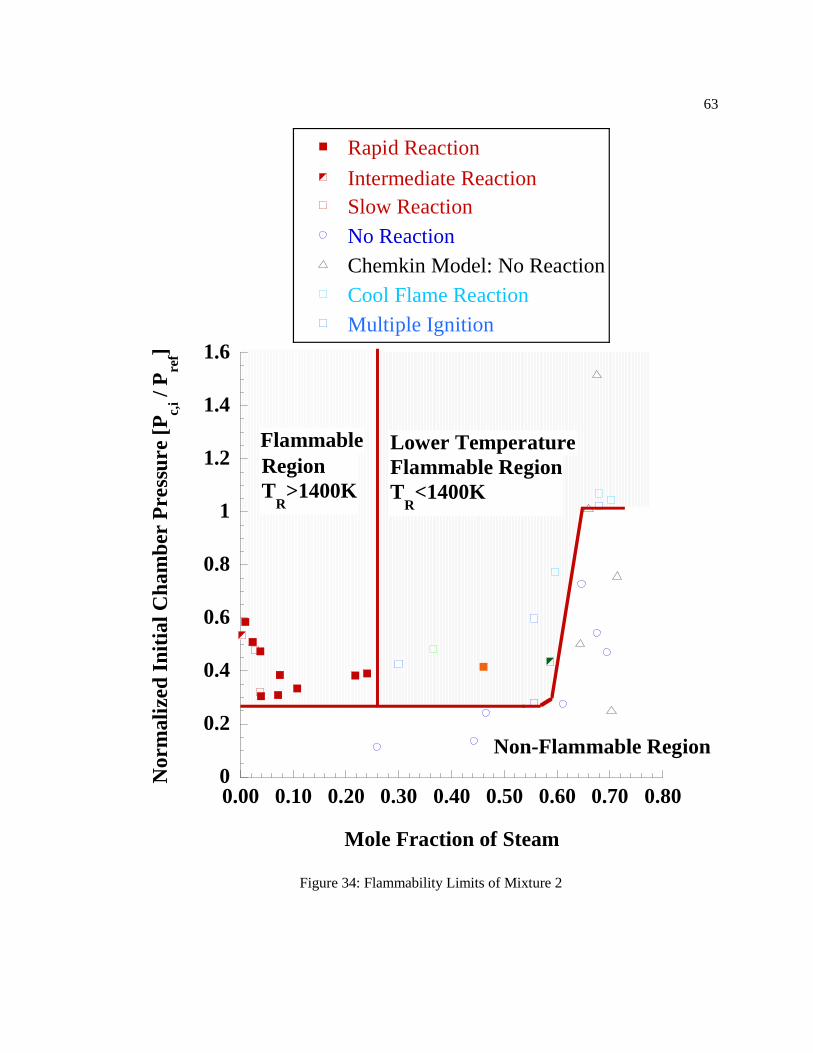
63
Figure 34: Flammability Limits of Mixture 2
0
0.2
0.4
0.6
0.8
1
1.2
1.4
1.6
0.00 0.10 0.20 0.30 0.40 0.50 0.60 0.70 0.80
Intermediate Reaction
Rapid Reaction
Slow Reaction
No Reaction
Chemkin Model: No Reaction
Cool Flame Reaction
Multiple Ignition
Norm
ali
zed
In
itia
l C
ham
ber
Pre
ssu
re
[Pc,
i / P
ref]
Mole Fraction of Steam
Non-Flammable Region
Flammable
Region
TR>1400K
Lower Temperature
Flammable Region
TR<1400K
64
As indicated in the Introduction, it was anticipated that Mixture 1 would require less
steam to be non-flammable than Mixture 2. This is verified experimentally, by comparing the
scale of steam mole fraction between Figures 33 and 34. The required steam mole fraction for
Mixture 2 to be non-flammable is about 35 times higher than that of Mixture 1. No ignitions were
observed below Pc,i /Pref =0.25. This could be due to the dependency of the rich limit on pressure.
The Chemkin code results in Figure 33 show a flammability boundary similar to the
experimentally determined profile, except this boundary is shifted to the right to much higher
(~102) mole fractions of steam. The Chemkin code results in Figure 34 show a similar
flammability boundary as experimental data except for the Pc,i /Pref = 1.5 data point. Comparing
the two Chemkin calculations, it was found that more steam is needed for Mixture 2 to be non-
flammable than Mixture 1. The Chemkin flame speed model overestimates the flammability
boundary for both mixtures below 20 atm. This overestimation is primarily due to the fact that the
experiments sweep away reactive radicals due to the open flow through the chamber. The
Chemkin flame speed model does not account for this loss so it overestimates the flammability
limit. The Chemkin flame speed model is a better estimate in Mixture 2 as the reactive radicals
are not swept away as fast as in Mixture 1 tests. The residence time for the experiments
performed near the flammability boundaries are 4 times shorter in Mixture 1 than in Mixture 2
tests.
These calculations overestimated the experimental trends, which showed, as expected,
that the laminar premixed flame model did not accurately represent the physical processes
involved in the experiments. The model does not accurately estimate the losses in the experiment.
Additionally, it is assumed that more complicated processes, such as turbulent mixing and short-
time scale ignition phenomena are of vital importance in defining the flammability limits.
Both Chemkin calculations show a non-linearity in the flammability boundary, which
matches the proposed theory that the limits will be non-linear due to the non-linear flammability
65
limits of the classical hydrogen-oxygen mechanism that is at the core of hydrocarbon-oxygen
flammability limits. The experimental trend in the Mixture 1 boundary also shows this non-
linearity.
6.2 Summary of Flammability Results
It was shown, from the literature review, that the steam controls the flammability of any
hydrocarbon mixture with two mechanisms: 1) the steam affects the reactions chemically, by
increasing the 3rd
-body collisions that increases the number of chain-terminating or chain
branching reaction paths; and 2) physically, by lowering the reaction-zone temperature through
dilution. The flammability limits are also controlled by initial chamber pressure. The increase of
initial chamber pressure can change the dominant chemical reaction mechanisms involved. While
the steam and initial chamber pressure determine what reaction paths are available, the
equivalence ratio determines which path is taken to complete the reaction. The reaction paths
taken determine the flammability limits of the mixture, and which steam suppression mechanism
is more dominant.
In the Mixture 1 flammability boundary, shown in Figure 33, the non-linearity has to be
due to the change in the chemical reaction mechanisms with increasing initial chamber pressure.
The mixture is within its empirically determined flammability limits and there is not enough
steam to allow for the physical effect to suppress ignition. The Mixture 2 boundary is mainly
controlled by the physical suppression mechanism and does not seem to be suppressed by chain
terminating reactions as the indicative non-linearity trend is not found in the boundary in Figure
34. Further evidence that Mixture 2 is suppressed by the physical mechanism lies in the fact that
the temperature of the reaction zone is clearly lowered with increasing steam. With above 25%
66
Vol. steam, Mixture 2 transitions to different chemical reaction mechanism as seen by the change
in flame spreading and pressurization discussed in Chapter 4.
The two mixtures are suppressed by different mechanisms because the amount of
available oxygen per volume for chain branching and propagation is higher in Mixture 2 than in
Mixture 1 as seen in the difference in equivalence ratio. This means that the amount of chain
branching and propagation of reactions is too high in Mixture 2 to be effected by the chain
terminating reactions, so Mixture 2 was mainly suppressed by the physical effect of steam. At
higher pressures, Mixture 2 is more difficult to completely suppress as the cool flame regime
exists well above the upper flammability limits.
In Mixture 1 the chain terminating reactions, increased by steam content, are able to
compete with the smaller amount of chain propagating and branching reactions due to the smaller
mole fraction of oxygen in the mixture. This competition between chain-branching and chain-
terminating reactions creates a non-flammable condition depending on the steam content of the
mixture, the initial chamber pressure, and the thermal induction time.
For both Mixtures 1 and 2 the test results indicated that steam can be used to control the
flammability. However, Mixture 2 requires such a large mole fraction of steam that using it to
control the flammability limits would be inefficient for industrial processes, such as SCT-CPO.
Newson and Truong [34] show that for safety in industrial CPO processes the oxygen content in
the system should remain below 10% Vol.
To determine if steam can effectively be used to control the flammability of a mixture
used in an industrial process, the equivalence ratio of the mixture without steam is the most
important parameter. If the equivalence ratio of Mixture 2 was increased it would require less
steam to make a non-flammable mixture. In addition, there must be some point in between the
two equivalence ratios that the chain-terminating suppression mechanism and the physical
suppression mechanism have an equal effect on the mixture’s flammability. Further investigation

67
of mixtures with equivalence ratios between these two mixtures is needed to support this
hypothesis.
68
Chapter 7
Conclusions
The highly non-linear flammability boundaries for two different
hydrocarbon/oxygen/steam mixtures were determined through a series of tests performed at
operating conditions close to those adopted in a SCT-CPO reactor. The tests demonstrated that
steam can be used to control and suppress the flammability of hydrocarbon/oxygen mixtures. For
mixtures with lower adiabatic flame temperature (Mixture 1), less steam is required to achieve a
non-flammable condition. In the Mixture 2 tests, unusual flame spreading was observed with
steam mole fraction greater than 24%, indicating that steam is physically affecting the flame
spreading processes by lowering the reaction zone temperature. Also in these tests, the pressure
threshold was observed from these flammability tests, below which a self sustained ignition was
not possible due to insufficient energy release at lower initial pressures.
Similar to the experimentally observed phenomena, the Chemkin calculations also show
that more steam is required to suppress the flammability of Mixture 2 than Mixture 1. The
sensitivity studies performed with the homogenous batch reactor showed that the dominant
chemical reaction mechanisms change with increasing pressure and steam content. Because of
these dependencies, flammability studies using the homogenous batch reactor rate of production
(ROP) flammability limit method needed to be coupled with sensitivity studies for every
condition tested in order to determine the dominant chain-branching and chain terminating
reactions. The ROP flammability limit method using only R1 and R3 overestimated the steam
content required for suppression and therefore could not be used to illustrate the non-linear
dependency on pressure.
The flame speed model was more accurate in calculating the flammability limits as it did
not rely on assuming certain reaction mechanisms are most dominant, as in the ROP method. The
69
flame speed model calculations overestimated the trends seen in the experiments, but they did
account for the expected non-linearity in the trend. The flame speed model was found to be
useful, but its flammability limit solution is an overestimate of the experiments as the solution
does not account for the steady flow of reactant through the reactor. Turbulent combustion and
small time scale ignition phenomena were not considered due to the fact that it is beyond the
scope of the current program.
The results of the experiments and Chemkin calculations showed that the flammability of
these mixtures is a strong function of the equivalence ratio and its effect on the sensitivity of the
mixture to the two possible suppression mechanisms: the chain-terminating chemical suppression
mechanism and the dilution or physical mechanism. Mixture 1 was suppressed by the chemical
suppression mechanism, where small amounts of steam greatly increased the rates of chain-
terminating reactions by increasing 3rd
-body reaction effectiveness. In particular R14 is increased
by small increase in steam and absorbs available CH3 radicals causing overall chain termination.
Mixture 2 was mainly suppressed by the physical suppression mechanism, where the heat release
from the chemical reactions was diluted by the addition of a significant amount of steam causing
the reaction zone temperature to decrease and thereby creating a non-flammable condition.
Further research into mixtures of similar composition but different equivalence ratios is
required to validate the existence of these mechanisms and their dependence on equivalence ratio.
It is proposed that there exists a mixture with a certain equivalence ratio that will allow it to be
suppressed equally by both mechanisms. Further research could incorporate laser diagnostics to
measure radical concentrations in the flame front that would be indicative of certain chemical
suppression mechanisms. Incorporating a spectrometer in the experimental setup could be highly
beneficial in identifying formaldehyde species, which is indicative of the lower temperature
regime. Using different inert agents, other than steam, like N2, could be useful for comparison to
gain a better understanding of the chemical effect steam has on a mixture. In addition, more

70
accurate modeling could be investigated to include effects of turbulence, thermal induction time,
and ignition phenomena.
71
References
[1] Petersen, E., Davidson, D., Hanson, R., Combustion and Flame 117 (1999) 272-290.
[2] Horn, R., Williams, K., Degenstein, N., Schmidt, L., Journal of Catalysis 242 (2006) 92-
102.
[3] L. Basini, Catalysis Today 117 (2006) 384–393
[4] L. Basini, Catalysis Today 106 (2005) 34–40
[5] D.A. Hickman, L.D. Schmidt, Science 259 (1993) 343
[6] L.D. Schmidt, JR, Salge, B.J. Dreyer, P.J. Dauenhauer, Science 314(5800) (2006) 801
[7] R. Seiser, K. Seshadri, Proc. Combust. Inst. 30 (2005) 407-414.
[8] R. J. Kee, F. M. Rupley, J. A. Miller, M. E. Coltrin, J. F. Grcar, E. Meeks, H. K. Moffat,
A. E. Lutz, G. Dixon-Lewis, M. D. Smooke, J. Warnatz, G. H. Evans, R. S. Larson, R. E.
Mitchell, L. R. Petzold, W. C. Reynolds, M. Caracotsios, W. E. Stewart, P. Glarborg, C.
Wang, O. Adigun, W. G. Houf, C. P. Chou, S. F. Miller, P. Ho, and D. J. Young,
CHEMKIN Release 4.0.1, Reaction Design, Inc., San Diego, CA (2004).
[9] Westbrook C.K., Pitz W.J., Curran H.J., Gaffuri P., Marinov N.M.. Chemical kinetic
modeling of hydrocarbon ignition. In: Wolfrum J., Volpp H.R., Rannacher R., Warnatz
J., editors. Gas phase chemical reaction systems. Springer Series in Chemical Physics,
vol. 61; 1996. 279-290.
[10] Glassman, I., Combustion, Academic Press, Orlando, U.S.A., 1987.
[11] Liang, Y., & Zeng, W., Journal of Hazardous Materials 174 (1-3) (2010) 386-92.
[12] Marshall, J. B., Hydrogen:Air:Steam Flammability Limits and Combustion
Charachteristics in the FITS Vessel, Nuclear Regulatory Commision, Albuquerque:
Sandia National Lab, 1986.
72
[13] Sapko, M. J., Furno, A. L., & Kuchta, J. M.,Quenching Methane-Air Ignitions with
Water Sprays. United States Department of the Interior, Bureau of Mines, 1977.
[14] Yamamoto, T. K., Kobayashi, N., Arai, N., & Tanaka, T., Energy Conversion
Management 38 (1997) 1093-1100.
[15] Chen, C., Wang, T., Liaw, H., Chen, H., Journal of Hazardous Materials 166 (2009) 880-
890.
[16] D.A. Crowl, J.F. Louvar, Chemical Process Safety-Fundamentals with Applications, 2nd
ed., Prentice Hall, New Jersey, 2002.
[17] Kuo, K. K., Principles of Combustion, John Wiley and Sons, Hoboken, U.S.A., 2005.
[18] NASA Computer Program CEA (Chemical Equilibrium with Applications).
<http://www.grc.nasa.gov/WWW/CEAWeb/ceaHome.htm> (version 05/21/04).
[19] C. K. Westbrook, F.L Dryer, Proc. Combust. Inst. 18 (1981) 749-767.
[20] Shebeko, Y. et al., Journal of Combustion, Explostion, and Shock Waves 30 (1994) 183-
188.
[21] Shebko, Y. et al. Fire safety Journal 37 (2002) 549-568.
[22] Simmie, J., Progress in Energy and Combustion Science 29 (2006) 599-634.
[23] Fawcett, H. and Wood, S., Safety and Accident Prevention in Chemical Operations,
Wiley, New York, U.S.A., 1982.
[24] Warnatz, J., Maas, U., Dibble, R.W., Combustion, 2nd
Edition Springer, Berlin, Germany.
1999.
[25] Bartknecht, W., Explosions, Springer, Berlin, Germany., 1981.
[26] Lewis, B. and Elbe, G., Combustion, Flames, and Explosions of Gases, Academic Press,
New York, U.S.A., 1961
[27] C. Law, F. Egolfopoulos, Proc. Combust. Inst. 24 (1992) 137-144.
[28] Westbrook, C. K., Proc. Combust. Inst. 30 (1982) 127-141.
73
[29] Womeldorf, C., Grosshandler, W., Combustion and Flame 118 (1999) 25-36.
[30] Bui-Pham, M. N., Lutz, A. E., Miller, J. A., Desjardin, M., O’Shaugnessey, D. M., and
Zondlak, R. J., Combust. Sci. Technol. 109:71–91 (1995).
[31] Petersen, E.L., Kalitan, D.M., Simmons, S., Bourque, G., Curran, H.J., Simmie, J.M.,
Proc. Combust. Inst. 31 (2007) 447-454.
[32] N. Donato, C. Aul, E. Petersen, C. Zinner, H. Curran, & G. Bourque. (2009). Ignition and
Oxidation of 50/50 Butane Isomer Blends. Proceedings of ASME Turbo Expo 2009:
Power for Land, Sea, and Air (1-13). Orlando: ASME.
[33] Law, C. K., Combustion Physics, Cambridge University Press, New York, U.S.A., 2006.
[34] Newson, E., Troung, B., International Journal of Hydrogen Energy 28 (2002) 1379-1386.
[35] Kutzler, Patrick M. "Flammability Limits of a Premixed Gas with Steam Addition."
Thesis. The Pennsylvania State University, 2008.
[36] Kline, S.J. and McClintok, F.A., “Describing Uncertainties in Single-Sample
Experiments,” Mechanical Engineering, ASME, Vol. 75, No. 1, 1953, p. 3-8.
[37] Reference Fluid Thermodynamic and Transport Properties. NIST Standard Reference
Database 23, Version 8.0.
74
Appendix A
Experimental Test Matrix
The tables given in Appendix A show all the calculations and data collected for every test
executed in both Mixture 1 and Mixture 2 testing. These tables are useful as finalized records of
all observations made during testing. See Appendix E and F for how the calculations were made.
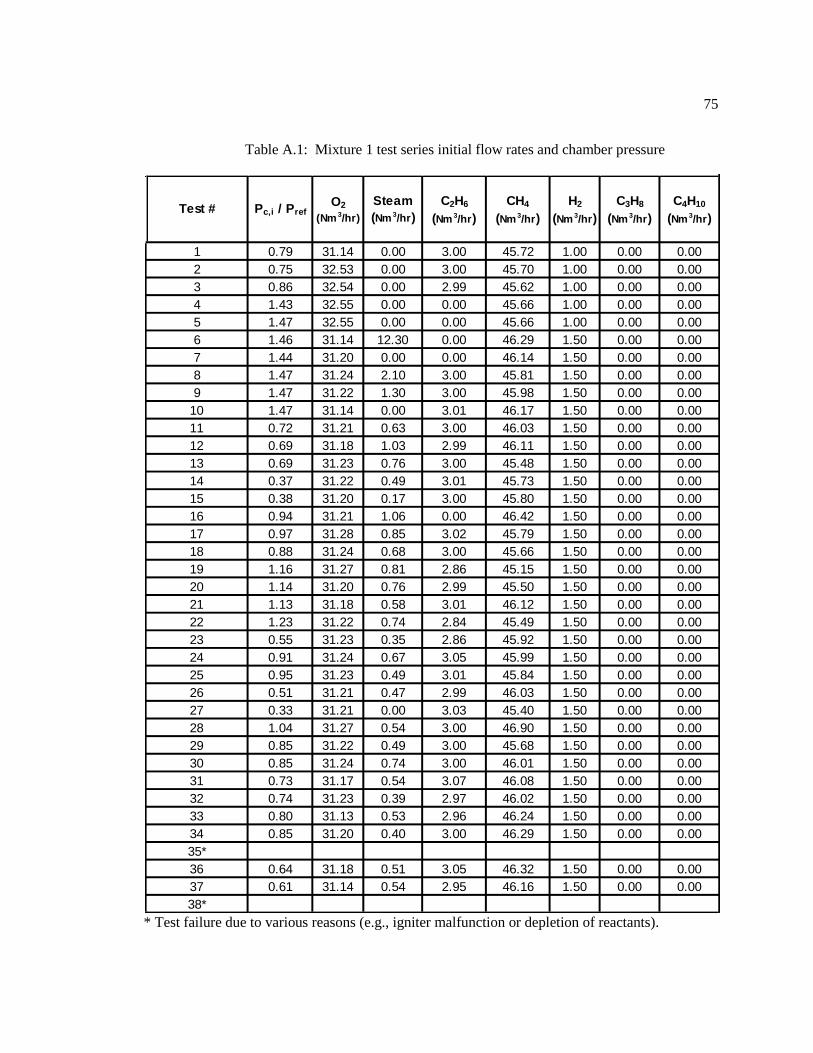
75
Table A.1: Mixture 1 test series initial flow rates and chamber pressure
* Test failure due to various reasons (e.g., igniter malfunction or depletion of reactants).
1 0.79 31.14 0.00 3.00 45.72 1.00 0.00 0.00
2 0.75 32.53 0.00 3.00 45.70 1.00 0.00 0.00
3 0.86 32.54 0.00 2.99 45.62 1.00 0.00 0.00
4 1.43 32.55 0.00 0.00 45.66 1.00 0.00 0.00
5 1.47 32.55 0.00 0.00 45.66 1.00 0.00 0.00
6 1.46 31.14 12.30 0.00 46.29 1.50 0.00 0.00
7 1.44 31.20 0.00 0.00 46.14 1.50 0.00 0.00
8 1.47 31.24 2.10 3.00 45.81 1.50 0.00 0.00
9 1.47 31.22 1.30 3.00 45.98 1.50 0.00 0.00
10 1.47 31.14 0.00 3.01 46.17 1.50 0.00 0.00
11 0.72 31.21 0.63 3.00 46.03 1.50 0.00 0.00
12 0.69 31.18 1.03 2.99 46.11 1.50 0.00 0.00
13 0.69 31.23 0.76 3.00 45.48 1.50 0.00 0.00
14 0.37 31.22 0.49 3.01 45.73 1.50 0.00 0.00
15 0.38 31.20 0.17 3.00 45.80 1.50 0.00 0.00
16 0.94 31.21 1.06 0.00 46.42 1.50 0.00 0.00
17 0.97 31.28 0.85 3.02 45.79 1.50 0.00 0.00
18 0.88 31.24 0.68 3.00 45.66 1.50 0.00 0.00
19 1.16 31.27 0.81 2.86 45.15 1.50 0.00 0.00
20 1.14 31.20 0.76 2.99 45.50 1.50 0.00 0.00
21 1.13 31.18 0.58 3.01 46.12 1.50 0.00 0.00
22 1.23 31.22 0.74 2.84 45.49 1.50 0.00 0.00
23 0.55 31.23 0.35 2.86 45.92 1.50 0.00 0.00
24 0.91 31.24 0.67 3.05 45.99 1.50 0.00 0.00
25 0.95 31.23 0.49 3.01 45.84 1.50 0.00 0.00
26 0.51 31.21 0.47 2.99 46.03 1.50 0.00 0.00
27 0.33 31.21 0.00 3.03 45.40 1.50 0.00 0.00
28 1.04 31.27 0.54 3.00 46.90 1.50 0.00 0.00
29 0.85 31.22 0.49 3.00 45.68 1.50 0.00 0.00
30 0.85 31.24 0.74 3.00 46.01 1.50 0.00 0.00
31 0.73 31.17 0.54 3.07 46.08 1.50 0.00 0.00
32 0.74 31.23 0.39 2.97 46.02 1.50 0.00 0.00
33 0.80 31.13 0.53 2.96 46.24 1.50 0.00 0.00
34 0.85 31.20 0.40 3.00 46.29 1.50 0.00 0.00
35*
36 0.64 31.18 0.51 3.05 46.32 1.50 0.00 0.00
37 0.61 31.14 0.54 2.95 46.16 1.50 0.00 0.00
38*
CH4
(Nm 3/hr)
H2
(Nm 3/hr)
C3H8
(Nm 3/hr)
C4H10
(Nm 3/hr)
O2
(Nm 3/hr)
Steam
(Nm 3/hr)
C2H6
(Nm 3/hr)Pc,i / PrefTest #
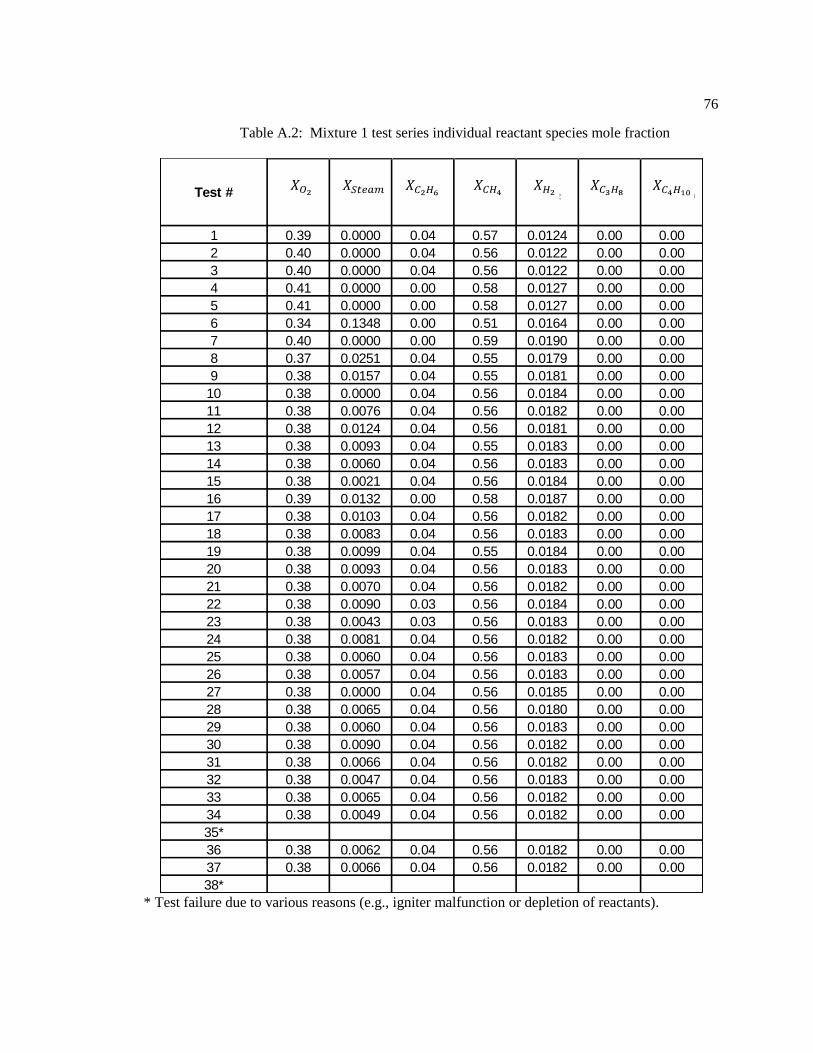
76
Table A.2: Mixture 1 test series individual reactant species mole fraction
* Test failure due to various reasons (e.g., igniter malfunction or depletion of reactants).
1 0.39 0.0000 0.04 0.57 0.0124 0.00 0.00
2 0.40 0.0000 0.04 0.56 0.0122 0.00 0.00
3 0.40 0.0000 0.04 0.56 0.0122 0.00 0.00
4 0.41 0.0000 0.00 0.58 0.0127 0.00 0.00
5 0.41 0.0000 0.00 0.58 0.0127 0.00 0.00
6 0.34 0.1348 0.00 0.51 0.0164 0.00 0.00
7 0.40 0.0000 0.00 0.59 0.0190 0.00 0.00
8 0.37 0.0251 0.04 0.55 0.0179 0.00 0.00
9 0.38 0.0157 0.04 0.55 0.0181 0.00 0.00
10 0.38 0.0000 0.04 0.56 0.0184 0.00 0.00
11 0.38 0.0076 0.04 0.56 0.0182 0.00 0.00
12 0.38 0.0124 0.04 0.56 0.0181 0.00 0.00
13 0.38 0.0093 0.04 0.55 0.0183 0.00 0.00
14 0.38 0.0060 0.04 0.56 0.0183 0.00 0.00
15 0.38 0.0021 0.04 0.56 0.0184 0.00 0.00
16 0.39 0.0132 0.00 0.58 0.0187 0.00 0.00
17 0.38 0.0103 0.04 0.56 0.0182 0.00 0.00
18 0.38 0.0083 0.04 0.56 0.0183 0.00 0.00
19 0.38 0.0099 0.04 0.55 0.0184 0.00 0.00
20 0.38 0.0093 0.04 0.56 0.0183 0.00 0.00
21 0.38 0.0070 0.04 0.56 0.0182 0.00 0.00
22 0.38 0.0090 0.03 0.56 0.0184 0.00 0.00
23 0.38 0.0043 0.03 0.56 0.0183 0.00 0.00
24 0.38 0.0081 0.04 0.56 0.0182 0.00 0.00
25 0.38 0.0060 0.04 0.56 0.0183 0.00 0.00
26 0.38 0.0057 0.04 0.56 0.0183 0.00 0.00
27 0.38 0.0000 0.04 0.56 0.0185 0.00 0.00
28 0.38 0.0065 0.04 0.56 0.0180 0.00 0.00
29 0.38 0.0060 0.04 0.56 0.0183 0.00 0.00
30 0.38 0.0090 0.04 0.56 0.0182 0.00 0.00
31 0.38 0.0066 0.04 0.56 0.0182 0.00 0.00
32 0.38 0.0047 0.04 0.56 0.0183 0.00 0.00
33 0.38 0.0065 0.04 0.56 0.0182 0.00 0.00
34 0.38 0.0049 0.04 0.56 0.0182 0.00 0.00
35*
36 0.38 0.0062 0.04 0.56 0.0182 0.00 0.00
37 0.38 0.0066 0.04 0.56 0.0182 0.00 0.00
38*
X Steam X C2H6 X CH4 X H2 X C3H8 X C4H10Test # X O2
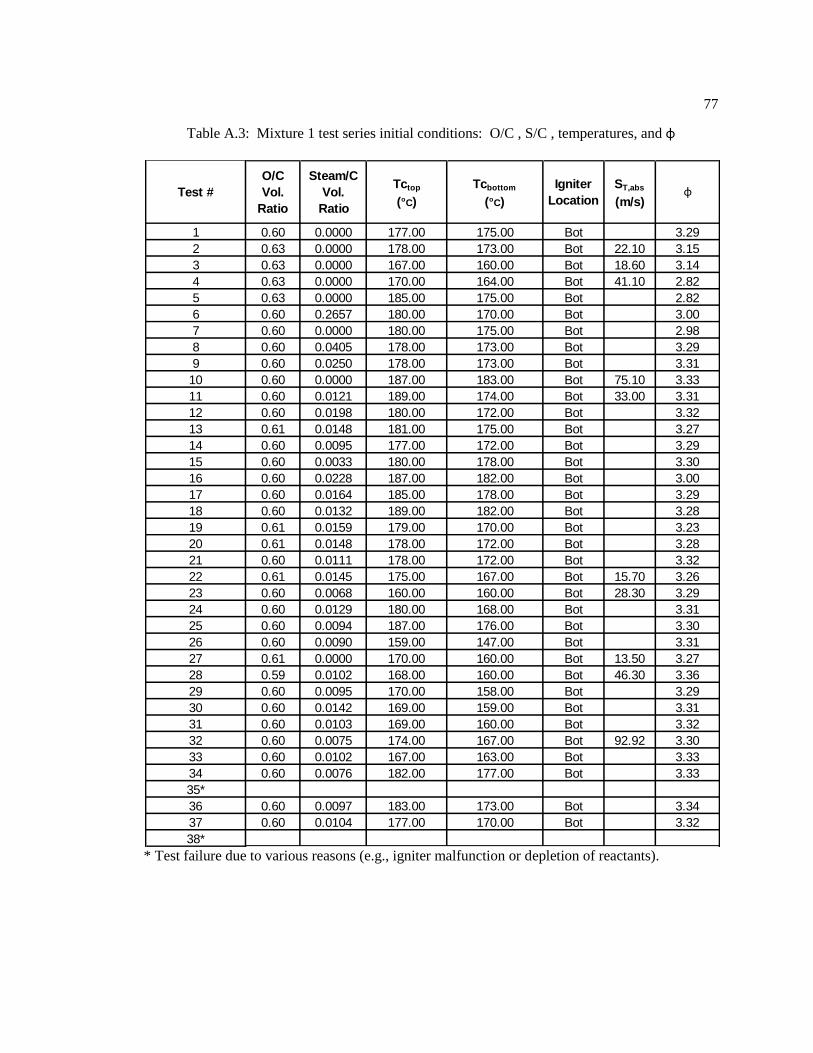
77
Table A.3: Mixture 1 test series initial conditions: O/C , S/C , temperatures, and φ
* Test failure due to various reasons (e.g., igniter malfunction or depletion of reactants).
1 0.60 0.0000 177.00 175.00 Bot 3.29
2 0.63 0.0000 178.00 173.00 Bot 22.10 3.15
3 0.63 0.0000 167.00 160.00 Bot 18.60 3.14
4 0.63 0.0000 170.00 164.00 Bot 41.10 2.82
5 0.63 0.0000 185.00 175.00 Bot 2.82
6 0.60 0.2657 180.00 170.00 Bot 3.00
7 0.60 0.0000 180.00 175.00 Bot 2.98
8 0.60 0.0405 178.00 173.00 Bot 3.29
9 0.60 0.0250 178.00 173.00 Bot 3.31
10 0.60 0.0000 187.00 183.00 Bot 75.10 3.33
11 0.60 0.0121 189.00 174.00 Bot 33.00 3.31
12 0.60 0.0198 180.00 172.00 Bot 3.32
13 0.61 0.0148 181.00 175.00 Bot 3.27
14 0.60 0.0095 177.00 172.00 Bot 3.29
15 0.60 0.0033 180.00 178.00 Bot 3.30
16 0.60 0.0228 187.00 182.00 Bot 3.00
17 0.60 0.0164 185.00 178.00 Bot 3.29
18 0.60 0.0132 189.00 182.00 Bot 3.28
19 0.61 0.0159 179.00 170.00 Bot 3.23
20 0.61 0.0148 178.00 172.00 Bot 3.28
21 0.60 0.0111 178.00 172.00 Bot 3.32
22 0.61 0.0145 175.00 167.00 Bot 15.70 3.26
23 0.60 0.0068 160.00 160.00 Bot 28.30 3.29
24 0.60 0.0129 180.00 168.00 Bot 3.31
25 0.60 0.0094 187.00 176.00 Bot 3.30
26 0.60 0.0090 159.00 147.00 Bot 3.31
27 0.61 0.0000 170.00 160.00 Bot 13.50 3.27
28 0.59 0.0102 168.00 160.00 Bot 46.30 3.36
29 0.60 0.0095 170.00 158.00 Bot 3.29
30 0.60 0.0142 169.00 159.00 Bot 3.31
31 0.60 0.0103 169.00 160.00 Bot 3.32
32 0.60 0.0075 174.00 167.00 Bot 92.92 3.30
33 0.60 0.0102 167.00 163.00 Bot 3.33
34 0.60 0.0076 182.00 177.00 Bot 3.33
35*
36 0.60 0.0097 183.00 173.00 Bot 3.34
37 0.60 0.0104 177.00 170.00 Bot 3.32
38*
Igniter
Location
ST,abs
(m/s)φTest #
O/C
Vol.
Ratio
Steam/C
Vol.
Ratio
Tctop
(oC)
Tcbottom
(oC)
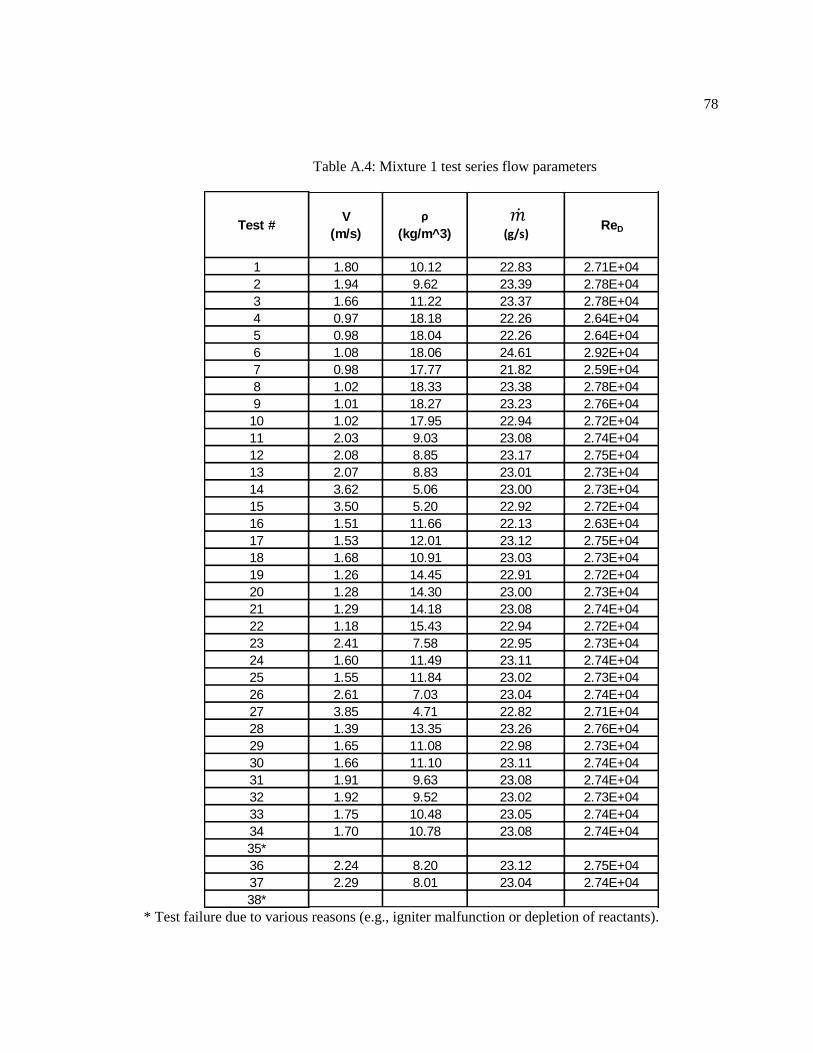
78
Table A.4: Mixture 1 test series flow parameters
* Test failure due to various reasons (e.g., igniter malfunction or depletion of reactants).
1 1.80 10.12 22.83 2.71E+04
2 1.94 9.62 23.39 2.78E+04
3 1.66 11.22 23.37 2.78E+04
4 0.97 18.18 22.26 2.64E+04
5 0.98 18.04 22.26 2.64E+04
6 1.08 18.06 24.61 2.92E+04
7 0.98 17.77 21.82 2.59E+04
8 1.02 18.33 23.38 2.78E+04
9 1.01 18.27 23.23 2.76E+04
10 1.02 17.95 22.94 2.72E+04
11 2.03 9.03 23.08 2.74E+04
12 2.08 8.85 23.17 2.75E+04
13 2.07 8.83 23.01 2.73E+04
14 3.62 5.06 23.00 2.73E+04
15 3.50 5.20 22.92 2.72E+04
16 1.51 11.66 22.13 2.63E+04
17 1.53 12.01 23.12 2.75E+04
18 1.68 10.91 23.03 2.73E+04
19 1.26 14.45 22.91 2.72E+04
20 1.28 14.30 23.00 2.73E+04
21 1.29 14.18 23.08 2.74E+04
22 1.18 15.43 22.94 2.72E+04
23 2.41 7.58 22.95 2.73E+04
24 1.60 11.49 23.11 2.74E+04
25 1.55 11.84 23.02 2.73E+04
26 2.61 7.03 23.04 2.74E+04
27 3.85 4.71 22.82 2.71E+04
28 1.39 13.35 23.26 2.76E+04
29 1.65 11.08 22.98 2.73E+04
30 1.66 11.10 23.11 2.74E+04
31 1.91 9.63 23.08 2.74E+04
32 1.92 9.52 23.02 2.73E+04
33 1.75 10.48 23.05 2.74E+04
34 1.70 10.78 23.08 2.74E+04
35*
36 2.24 8.20 23.12 2.75E+04
37 2.29 8.01 23.04 2.74E+04
38*
Test #V
(m/s)
ρ
(kg/m^3)
m dot
(g/s)ReD
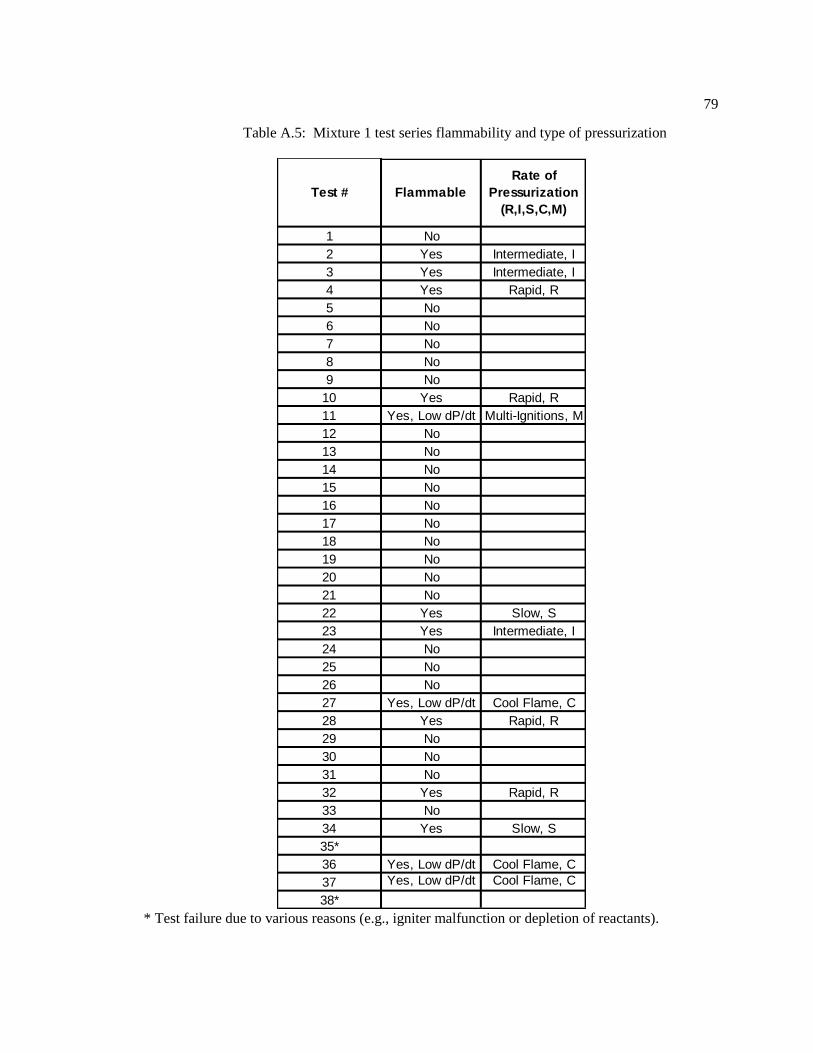
79
Table A.5: Mixture 1 test series flammability and type of pressurization
* Test failure due to various reasons (e.g., igniter malfunction or depletion of reactants).
1 No
2 Yes Intermediate, I
3 Yes Intermediate, I
4 Yes Rapid, R
5 No
6 No
7 No
8 No
9 No
10 Yes Rapid, R
11 Yes, Low dP/dt Multi-Ignitions, M
12 No
13 No
14 No
15 No
16 No
17 No
18 No
19 No
20 No
21 No
22 Yes Slow, S
23 Yes Intermediate, I
24 No
25 No
26 No
27 Yes, Low dP/dt Cool Flame, C
28 Yes Rapid, R
29 No
30 No
31 No
32 Yes Rapid, R
33 No
34 Yes Slow, S
35*
36 Yes, Low dP/dt Cool Flame, C
37 Yes, Low dP/dt Cool Flame, C
38*
Flammable
Rate of
Pressurization
(R,I,S,C,M)
Test #
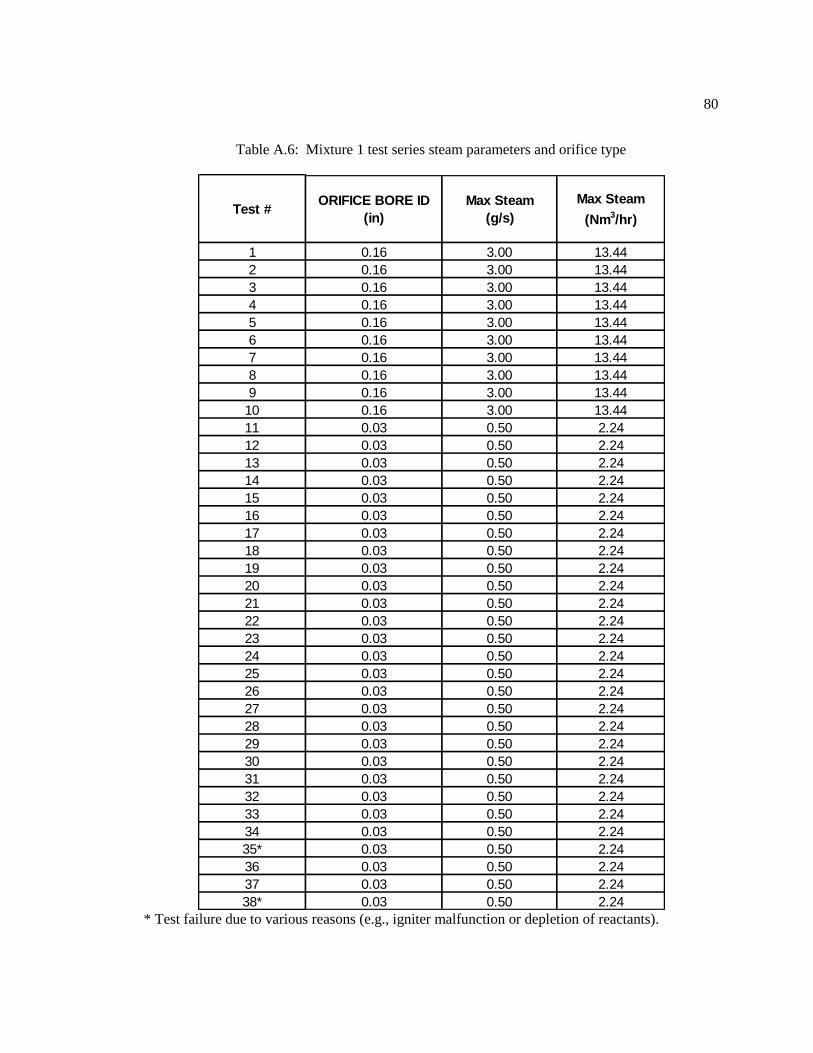
80
Table A.6: Mixture 1 test series steam parameters and orifice type
* Test failure due to various reasons (e.g., igniter malfunction or depletion of reactants).
1 0.16 3.00 13.44
2 0.16 3.00 13.44
3 0.16 3.00 13.44
4 0.16 3.00 13.44
5 0.16 3.00 13.44
6 0.16 3.00 13.44
7 0.16 3.00 13.44
8 0.16 3.00 13.44
9 0.16 3.00 13.44
10 0.16 3.00 13.44
11 0.03 0.50 2.24
12 0.03 0.50 2.24
13 0.03 0.50 2.24
14 0.03 0.50 2.24
15 0.03 0.50 2.24
16 0.03 0.50 2.24
17 0.03 0.50 2.24
18 0.03 0.50 2.24
19 0.03 0.50 2.24
20 0.03 0.50 2.24
21 0.03 0.50 2.24
22 0.03 0.50 2.24
23 0.03 0.50 2.24
24 0.03 0.50 2.24
25 0.03 0.50 2.24
26 0.03 0.50 2.24
27 0.03 0.50 2.24
28 0.03 0.50 2.24
29 0.03 0.50 2.24
30 0.03 0.50 2.24
31 0.03 0.50 2.24
32 0.03 0.50 2.24
33 0.03 0.50 2.24
34 0.03 0.50 2.24
35* 0.03 0.50 2.24
36 0.03 0.50 2.24
37 0.03 0.50 2.24
38* 0.03 0.50 2.24
Test #ORIFICE BORE ID
(in)
Max Steam
(g/s)
Max Steam
(Nm3/hr)
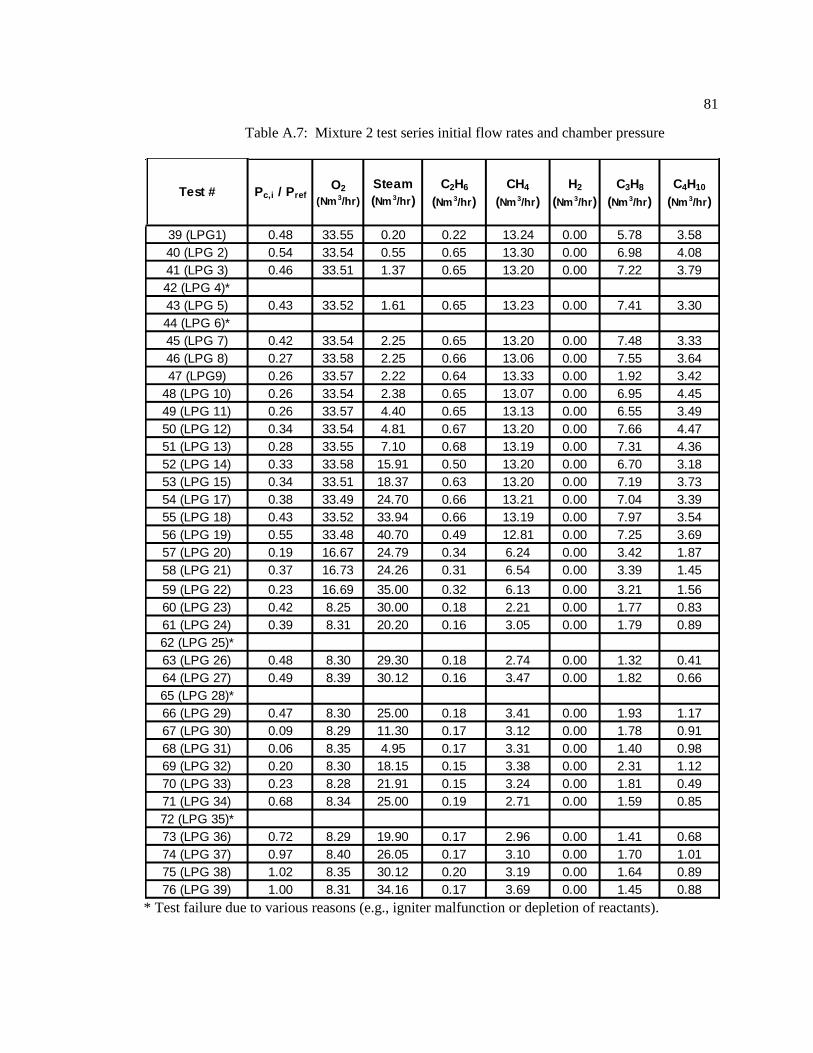
81
Table A.7: Mixture 2 test series initial flow rates and chamber pressure
* Test failure due to various reasons (e.g., igniter malfunction or depletion of reactants).
39 (LPG1) 0.48 33.55 0.20 0.22 13.24 0.00 5.78 3.58
40 (LPG 2) 0.54 33.54 0.55 0.65 13.30 0.00 6.98 4.08
41 (LPG 3) 0.46 33.51 1.37 0.65 13.20 0.00 7.22 3.79
42 (LPG 4)*
43 (LPG 5) 0.43 33.52 1.61 0.65 13.23 0.00 7.41 3.30
44 (LPG 6)*
45 (LPG 7) 0.42 33.54 2.25 0.65 13.20 0.00 7.48 3.33
46 (LPG 8) 0.27 33.58 2.25 0.66 13.06 0.00 7.55 3.64
47 (LPG9) 0.26 33.57 2.22 0.64 13.33 0.00 1.92 3.42
48 (LPG 10) 0.26 33.54 2.38 0.65 13.07 0.00 6.95 4.45
49 (LPG 11) 0.26 33.57 4.40 0.65 13.13 0.00 6.55 3.49
50 (LPG 12) 0.34 33.54 4.81 0.67 13.20 0.00 7.66 4.47
51 (LPG 13) 0.28 33.55 7.10 0.68 13.19 0.00 7.31 4.36
52 (LPG 14) 0.33 33.58 15.91 0.50 13.20 0.00 6.70 3.18
53 (LPG 15) 0.34 33.51 18.37 0.63 13.20 0.00 7.19 3.73
54 (LPG 17) 0.38 33.49 24.70 0.66 13.21 0.00 7.04 3.39
55 (LPG 18) 0.43 33.52 33.94 0.66 13.19 0.00 7.97 3.54
56 (LPG 19) 0.55 33.48 40.70 0.49 12.81 0.00 7.25 3.69
57 (LPG 20) 0.19 16.67 24.79 0.34 6.24 0.00 3.42 1.87
58 (LPG 21) 0.37 16.73 24.26 0.31 6.54 0.00 3.39 1.45
59 (LPG 22) 0.23 16.69 35.00 0.32 6.13 0.00 3.21 1.56
60 (LPG 23) 0.42 8.25 30.00 0.18 2.21 0.00 1.77 0.83
61 (LPG 24) 0.39 8.31 20.20 0.16 3.05 0.00 1.79 0.89
62 (LPG 25)*
63 (LPG 26) 0.48 8.30 29.30 0.18 2.74 0.00 1.32 0.41
64 (LPG 27) 0.49 8.39 30.12 0.16 3.47 0.00 1.82 0.66
65 (LPG 28)*
66 (LPG 29) 0.47 8.30 25.00 0.18 3.41 0.00 1.93 1.17
67 (LPG 30) 0.09 8.29 11.30 0.17 3.12 0.00 1.78 0.91
68 (LPG 31) 0.06 8.35 4.95 0.17 3.31 0.00 1.40 0.98
69 (LPG 32) 0.20 8.30 18.15 0.15 3.38 0.00 2.31 1.12
70 (LPG 33) 0.23 8.28 21.91 0.15 3.24 0.00 1.81 0.49
71 (LPG 34) 0.68 8.34 25.00 0.19 2.71 0.00 1.59 0.85
72 (LPG 35)*
73 (LPG 36) 0.72 8.29 19.90 0.17 2.96 0.00 1.41 0.68
74 (LPG 37) 0.97 8.40 26.05 0.17 3.10 0.00 1.70 1.01
75 (LPG 38) 1.02 8.35 30.12 0.20 3.19 0.00 1.64 0.89
76 (LPG 39) 1.00 8.31 34.16 0.17 3.69 0.00 1.45 0.88
Steam
(Nm 3/hr)
C2H6
(Nm 3/hr)
CH4
(Nm 3/hr)
H2
(Nm 3/hr)
C3H8
(Nm 3/hr)
C4H10
(Nm 3/hr)
O2
(Nm 3/hr)Pc,i / PrefTest #
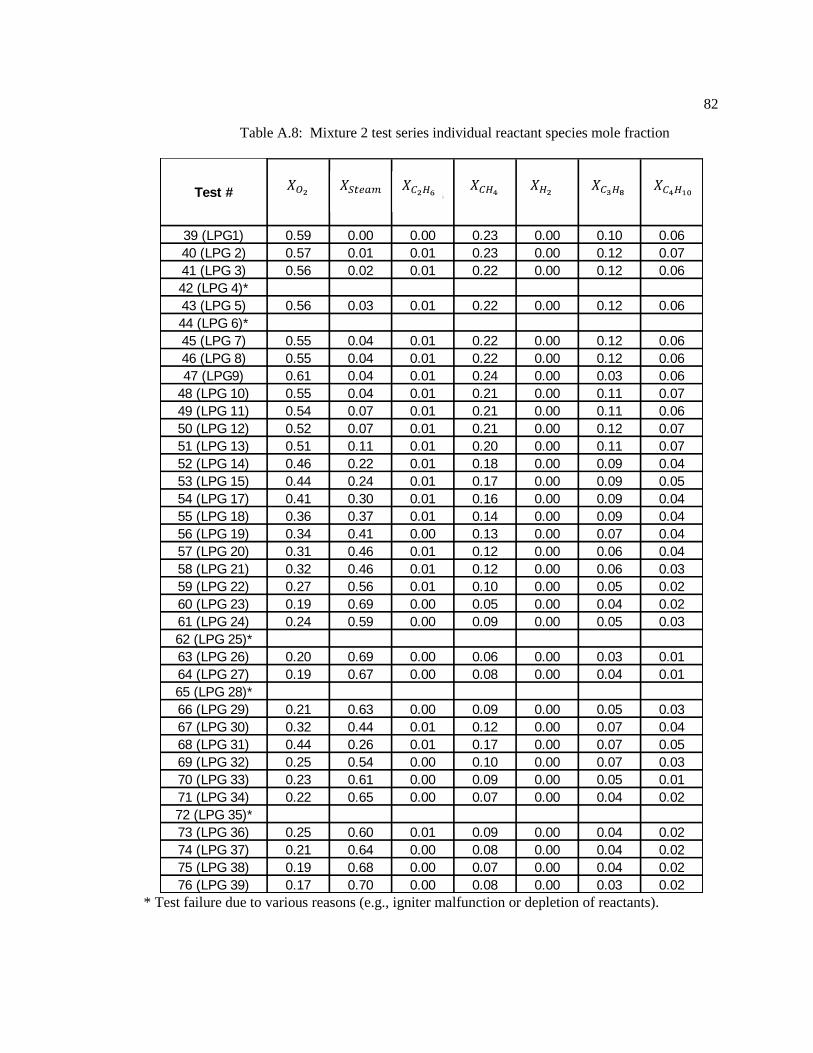
82
Table A.8: Mixture 2 test series individual reactant species mole fraction
* Test failure due to various reasons (e.g., igniter malfunction or depletion of reactants).
39 (LPG1) 0.59 0.00 0.00 0.23 0.00 0.10 0.06
40 (LPG 2) 0.57 0.01 0.01 0.23 0.00 0.12 0.07
41 (LPG 3) 0.56 0.02 0.01 0.22 0.00 0.12 0.06
42 (LPG 4)*
43 (LPG 5) 0.56 0.03 0.01 0.22 0.00 0.12 0.06
44 (LPG 6)*
45 (LPG 7) 0.55 0.04 0.01 0.22 0.00 0.12 0.06
46 (LPG 8) 0.55 0.04 0.01 0.22 0.00 0.12 0.06
47 (LPG9) 0.61 0.04 0.01 0.24 0.00 0.03 0.06
48 (LPG 10) 0.55 0.04 0.01 0.21 0.00 0.11 0.07
49 (LPG 11) 0.54 0.07 0.01 0.21 0.00 0.11 0.06
50 (LPG 12) 0.52 0.07 0.01 0.21 0.00 0.12 0.07
51 (LPG 13) 0.51 0.11 0.01 0.20 0.00 0.11 0.07
52 (LPG 14) 0.46 0.22 0.01 0.18 0.00 0.09 0.04
53 (LPG 15) 0.44 0.24 0.01 0.17 0.00 0.09 0.05
54 (LPG 17) 0.41 0.30 0.01 0.16 0.00 0.09 0.04
55 (LPG 18) 0.36 0.37 0.01 0.14 0.00 0.09 0.04
56 (LPG 19) 0.34 0.41 0.00 0.13 0.00 0.07 0.04
57 (LPG 20) 0.31 0.46 0.01 0.12 0.00 0.06 0.04
58 (LPG 21) 0.32 0.46 0.01 0.12 0.00 0.06 0.03
59 (LPG 22) 0.27 0.56 0.01 0.10 0.00 0.05 0.02
60 (LPG 23) 0.19 0.69 0.00 0.05 0.00 0.04 0.02
61 (LPG 24) 0.24 0.59 0.00 0.09 0.00 0.05 0.03
62 (LPG 25)*
63 (LPG 26) 0.20 0.69 0.00 0.06 0.00 0.03 0.01
64 (LPG 27) 0.19 0.67 0.00 0.08 0.00 0.04 0.01
65 (LPG 28)*
66 (LPG 29) 0.21 0.63 0.00 0.09 0.00 0.05 0.03
67 (LPG 30) 0.32 0.44 0.01 0.12 0.00 0.07 0.04
68 (LPG 31) 0.44 0.26 0.01 0.17 0.00 0.07 0.05
69 (LPG 32) 0.25 0.54 0.00 0.10 0.00 0.07 0.03
70 (LPG 33) 0.23 0.61 0.00 0.09 0.00 0.05 0.01
71 (LPG 34) 0.22 0.65 0.00 0.07 0.00 0.04 0.02
72 (LPG 35)*
73 (LPG 36) 0.25 0.60 0.01 0.09 0.00 0.04 0.02
74 (LPG 37) 0.21 0.64 0.00 0.08 0.00 0.04 0.02
75 (LPG 38) 0.19 0.68 0.00 0.07 0.00 0.04 0.02
76 (LPG 39) 0.17 0.70 0.00 0.08 0.00 0.03 0.02
X C3H8 X C4H10Test # X O2 X Steam X C2H6 X CH4 X H2
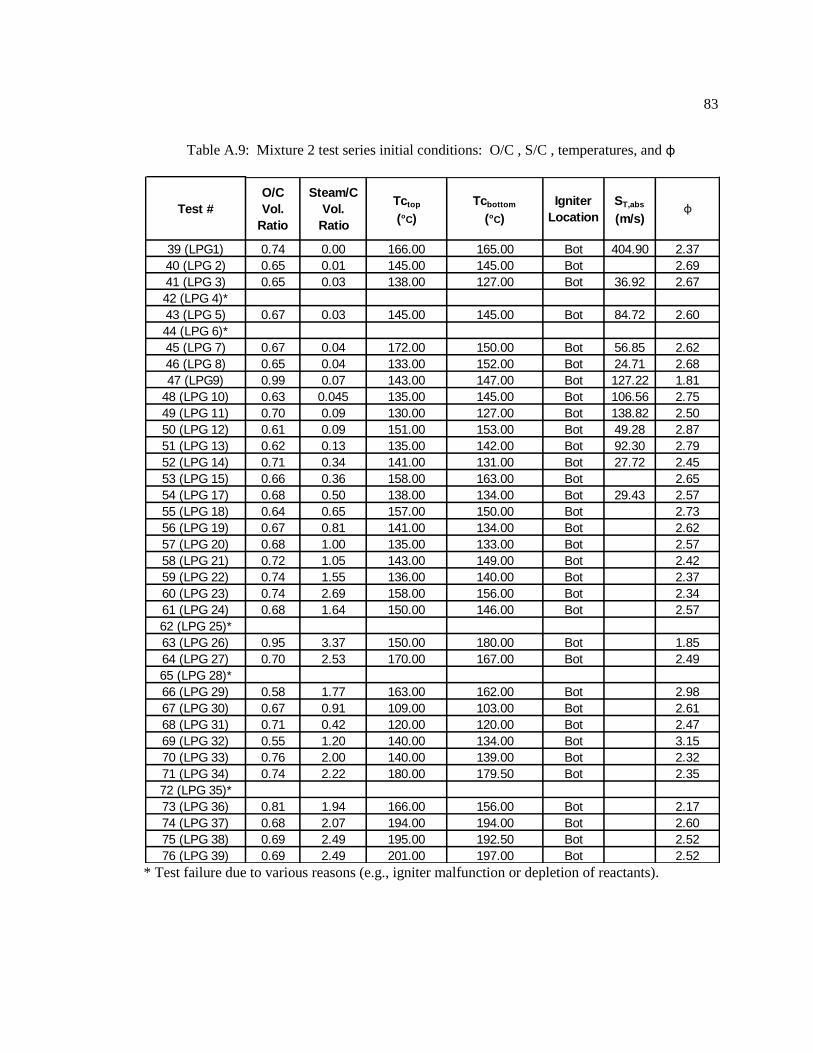
83
Table A.9: Mixture 2 test series initial conditions: O/C , S/C , temperatures, and φ
* Test failure due to various reasons (e.g., igniter malfunction or depletion of reactants).
39 (LPG1) 0.74 0.00 166.00 165.00 Bot 404.90 2.37
40 (LPG 2) 0.65 0.01 145.00 145.00 Bot 2.69
41 (LPG 3) 0.65 0.03 138.00 127.00 Bot 36.92 2.67
42 (LPG 4)*
43 (LPG 5) 0.67 0.03 145.00 145.00 Bot 84.72 2.60
44 (LPG 6)*
45 (LPG 7) 0.67 0.04 172.00 150.00 Bot 56.85 2.62
46 (LPG 8) 0.65 0.04 133.00 152.00 Bot 24.71 2.68
47 (LPG9) 0.99 0.07 143.00 147.00 Bot 127.22 1.81
48 (LPG 10) 0.63 0.045 135.00 145.00 Bot 106.56 2.75
49 (LPG 11) 0.70 0.09 130.00 127.00 Bot 138.82 2.50
50 (LPG 12) 0.61 0.09 151.00 153.00 Bot 49.28 2.87
51 (LPG 13) 0.62 0.13 135.00 142.00 Bot 92.30 2.79
52 (LPG 14) 0.71 0.34 141.00 131.00 Bot 27.72 2.45
53 (LPG 15) 0.66 0.36 158.00 163.00 Bot 2.65
54 (LPG 17) 0.68 0.50 138.00 134.00 Bot 29.43 2.57
55 (LPG 18) 0.64 0.65 157.00 150.00 Bot 2.73
56 (LPG 19) 0.67 0.81 141.00 134.00 Bot 2.62
57 (LPG 20) 0.68 1.00 135.00 133.00 Bot 2.57
58 (LPG 21) 0.72 1.05 143.00 149.00 Bot 2.42
59 (LPG 22) 0.74 1.55 136.00 140.00 Bot 2.37
60 (LPG 23) 0.74 2.69 158.00 156.00 Bot 2.34
61 (LPG 24) 0.68 1.64 150.00 146.00 Bot 2.57
62 (LPG 25)*
63 (LPG 26) 0.95 3.37 150.00 180.00 Bot 1.85
64 (LPG 27) 0.70 2.53 170.00 167.00 Bot 2.49
65 (LPG 28)*
66 (LPG 29) 0.58 1.77 163.00 162.00 Bot 2.98
67 (LPG 30) 0.67 0.91 109.00 103.00 Bot 2.61
68 (LPG 31) 0.71 0.42 120.00 120.00 Bot 2.47
69 (LPG 32) 0.55 1.20 140.00 134.00 Bot 3.15
70 (LPG 33) 0.76 2.00 140.00 139.00 Bot 2.32
71 (LPG 34) 0.74 2.22 180.00 179.50 Bot 2.35
72 (LPG 35)*
73 (LPG 36) 0.81 1.94 166.00 156.00 Bot 2.17
74 (LPG 37) 0.68 2.07 194.00 194.00 Bot 2.60
75 (LPG 38) 0.69 2.49 195.00 192.50 Bot 2.52
76 (LPG 39) 0.69 2.49 201.00 197.00 Bot 2.52
Igniter
Location
ST,abs
(m/s)Test #
O/C
Vol.
Ratio
Steam/C
Vol.
Ratio
Tctop
(oC)
Tcbottom
(oC)φ
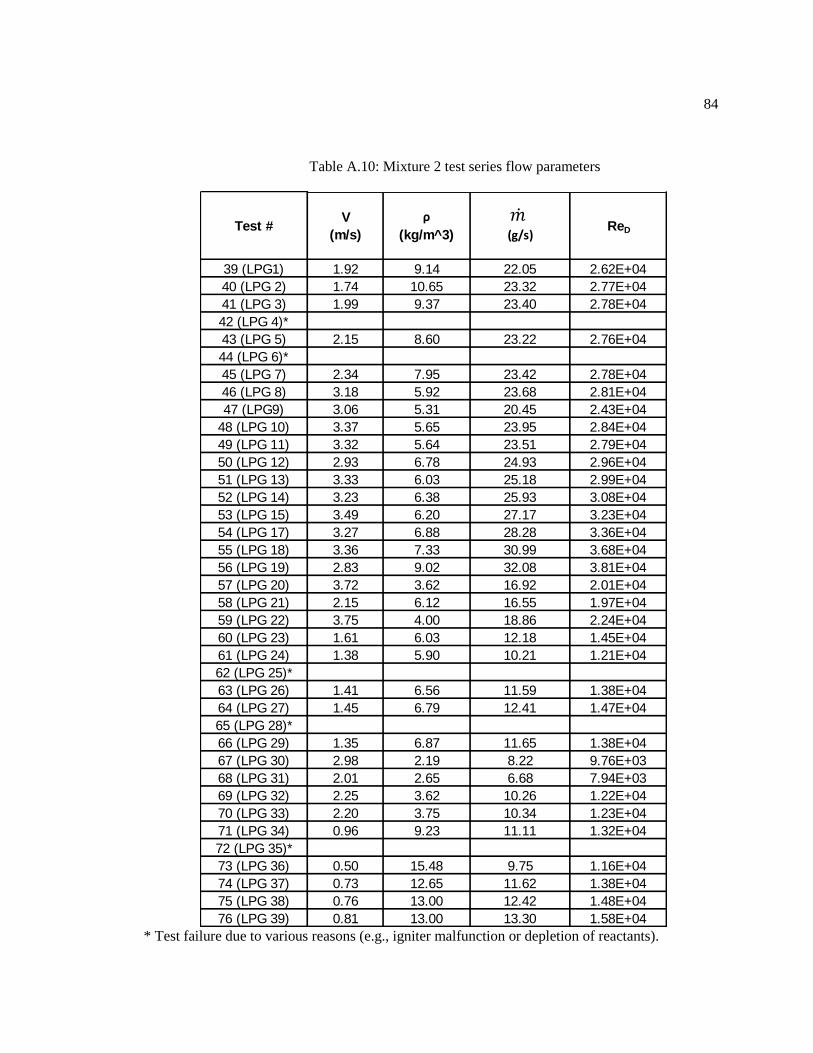
84
Table A.10: Mixture 2 test series flow parameters
* Test failure due to various reasons (e.g., igniter malfunction or depletion of reactants).
39 (LPG1) 1.92 9.14 22.05 2.62E+04
40 (LPG 2) 1.74 10.65 23.32 2.77E+04
41 (LPG 3) 1.99 9.37 23.40 2.78E+04
42 (LPG 4)*
43 (LPG 5) 2.15 8.60 23.22 2.76E+04
44 (LPG 6)*
45 (LPG 7) 2.34 7.95 23.42 2.78E+04
46 (LPG 8) 3.18 5.92 23.68 2.81E+04
47 (LPG9) 3.06 5.31 20.45 2.43E+04
48 (LPG 10) 3.37 5.65 23.95 2.84E+04
49 (LPG 11) 3.32 5.64 23.51 2.79E+04
50 (LPG 12) 2.93 6.78 24.93 2.96E+04
51 (LPG 13) 3.33 6.03 25.18 2.99E+04
52 (LPG 14) 3.23 6.38 25.93 3.08E+04
53 (LPG 15) 3.49 6.20 27.17 3.23E+04
54 (LPG 17) 3.27 6.88 28.28 3.36E+04
55 (LPG 18) 3.36 7.33 30.99 3.68E+04
56 (LPG 19) 2.83 9.02 32.08 3.81E+04
57 (LPG 20) 3.72 3.62 16.92 2.01E+04
58 (LPG 21) 2.15 6.12 16.55 1.97E+04
59 (LPG 22) 3.75 4.00 18.86 2.24E+04
60 (LPG 23) 1.61 6.03 12.18 1.45E+04
61 (LPG 24) 1.38 5.90 10.21 1.21E+04
62 (LPG 25)*
63 (LPG 26) 1.41 6.56 11.59 1.38E+04
64 (LPG 27) 1.45 6.79 12.41 1.47E+04
65 (LPG 28)*
66 (LPG 29) 1.35 6.87 11.65 1.38E+04
67 (LPG 30) 2.98 2.19 8.22 9.76E+03
68 (LPG 31) 2.01 2.65 6.68 7.94E+03
69 (LPG 32) 2.25 3.62 10.26 1.22E+04
70 (LPG 33) 2.20 3.75 10.34 1.23E+04
71 (LPG 34) 0.96 9.23 11.11 1.32E+04
72 (LPG 35)*
73 (LPG 36) 0.50 15.48 9.75 1.16E+04
74 (LPG 37) 0.73 12.65 11.62 1.38E+04
75 (LPG 38) 0.76 13.00 12.42 1.48E+04
76 (LPG 39) 0.81 13.00 13.30 1.58E+04
Test #V
(m/s)
ρ
(kg/m^3)
m dot
(g/s)ReD
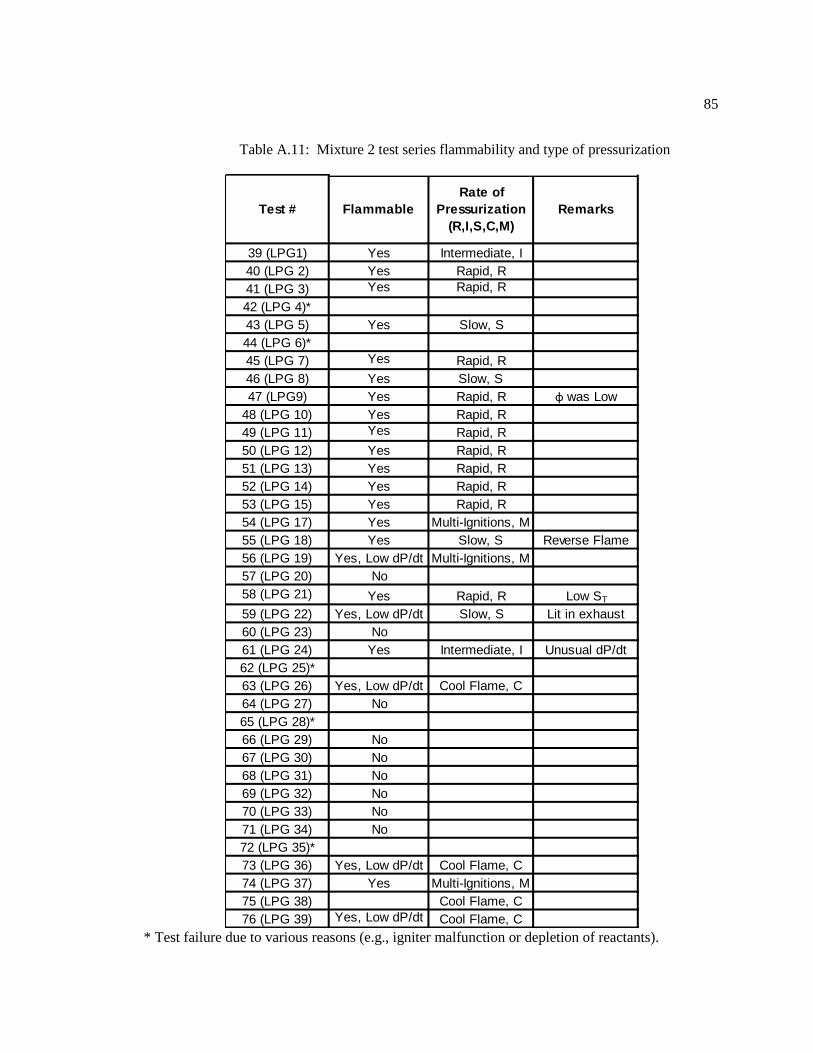
85
Table A.11: Mixture 2 test series flammability and type of pressurization
* Test failure due to various reasons (e.g., igniter malfunction or depletion of reactants).
39 (LPG1) Yes Intermediate, I
40 (LPG 2) Yes Rapid, R
41 (LPG 3) Yes Rapid, R
42 (LPG 4)*
43 (LPG 5) Yes Slow, S
44 (LPG 6)*
45 (LPG 7) Yes Rapid, R
46 (LPG 8) Yes Slow, S
47 (LPG9) Yes Rapid, R φ was Low
48 (LPG 10) Yes Rapid, R
49 (LPG 11) Yes Rapid, R
50 (LPG 12) Yes Rapid, R
51 (LPG 13) Yes Rapid, R
52 (LPG 14) Yes Rapid, R
53 (LPG 15) Yes Rapid, R
54 (LPG 17) Yes Multi-Ignitions, M
55 (LPG 18) Yes Slow, S Reverse Flame
56 (LPG 19) Yes, Low dP/dt Multi-Ignitions, M
57 (LPG 20) No
58 (LPG 21) Yes Rapid, R Low ST
59 (LPG 22) Yes, Low dP/dt Slow, S Lit in exhaust
60 (LPG 23) No
61 (LPG 24) Yes Intermediate, I Unusual dP/dt
62 (LPG 25)*
63 (LPG 26) Yes, Low dP/dt Cool Flame, C
64 (LPG 27) No
65 (LPG 28)*
66 (LPG 29) No
67 (LPG 30) No
68 (LPG 31) No
69 (LPG 32) No
70 (LPG 33) No
71 (LPG 34) No
72 (LPG 35)*
73 (LPG 36) Yes, Low dP/dt Cool Flame, C
74 (LPG 37) Yes Multi-Ignitions, M
75 (LPG 38) Cool Flame, C
76 (LPG 39) Yes, Low dP/dt Cool Flame, C
Flammable
Rate of
Pressurization
(R,I,S,C,M)
RemarksTest #
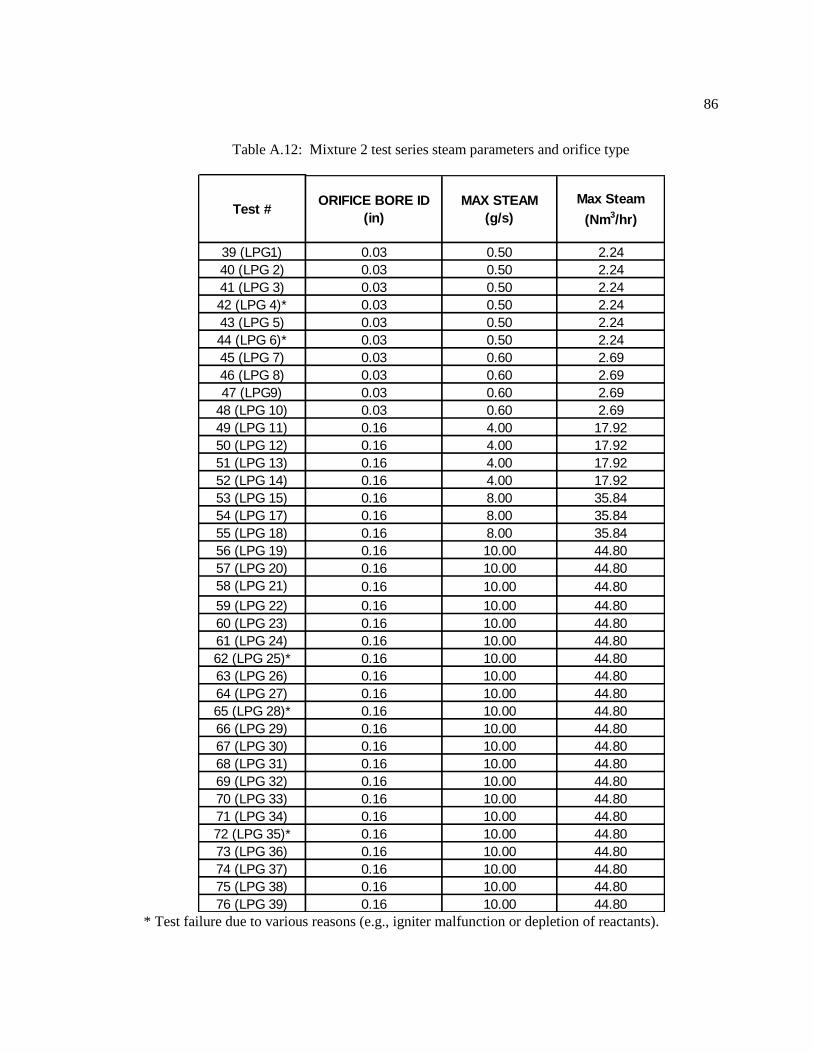
86
Table A.12: Mixture 2 test series steam parameters and orifice type
* Test failure due to various reasons (e.g., igniter malfunction or depletion of reactants).
39 (LPG1) 0.03 0.50 2.24
40 (LPG 2) 0.03 0.50 2.24
41 (LPG 3) 0.03 0.50 2.24
42 (LPG 4)* 0.03 0.50 2.24
43 (LPG 5) 0.03 0.50 2.24
44 (LPG 6)* 0.03 0.50 2.24
45 (LPG 7) 0.03 0.60 2.69
46 (LPG 8) 0.03 0.60 2.69
47 (LPG9) 0.03 0.60 2.69
48 (LPG 10) 0.03 0.60 2.69
49 (LPG 11) 0.16 4.00 17.92
50 (LPG 12) 0.16 4.00 17.92
51 (LPG 13) 0.16 4.00 17.92
52 (LPG 14) 0.16 4.00 17.92
53 (LPG 15) 0.16 8.00 35.84
54 (LPG 17) 0.16 8.00 35.84
55 (LPG 18) 0.16 8.00 35.84
56 (LPG 19) 0.16 10.00 44.80
57 (LPG 20) 0.16 10.00 44.80
58 (LPG 21) 0.16 10.00 44.80
59 (LPG 22) 0.16 10.00 44.80
60 (LPG 23) 0.16 10.00 44.80
61 (LPG 24) 0.16 10.00 44.80
62 (LPG 25)* 0.16 10.00 44.80
63 (LPG 26) 0.16 10.00 44.80
64 (LPG 27) 0.16 10.00 44.80
65 (LPG 28)* 0.16 10.00 44.80
66 (LPG 29) 0.16 10.00 44.80
67 (LPG 30) 0.16 10.00 44.80
68 (LPG 31) 0.16 10.00 44.80
69 (LPG 32) 0.16 10.00 44.80
70 (LPG 33) 0.16 10.00 44.80
71 (LPG 34) 0.16 10.00 44.80
72 (LPG 35)* 0.16 10.00 44.80
73 (LPG 36) 0.16 10.00 44.80
74 (LPG 37) 0.16 10.00 44.80
75 (LPG 38) 0.16 10.00 44.80
76 (LPG 39) 0.16 10.00 44.80
Test #ORIFICE BORE ID
(in)
MAX STEAM
(g/s)
Max Steam
(Nm3/hr)
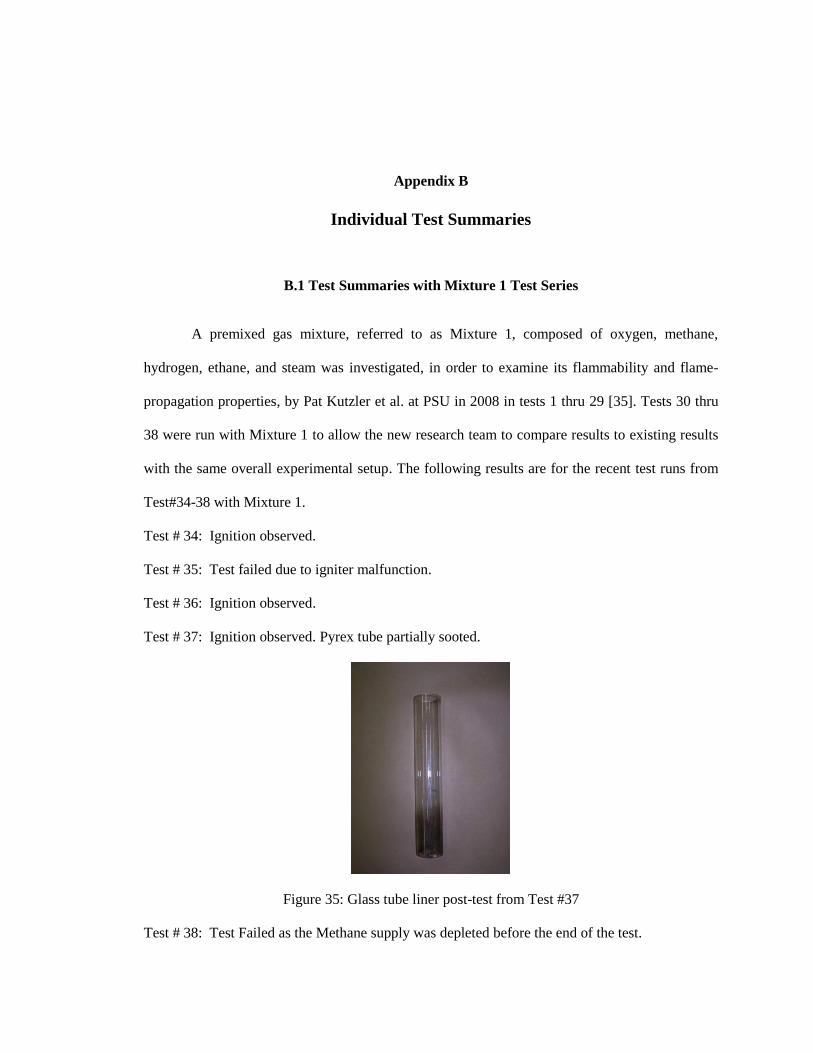
Appendix B
Individual Test Summaries
B.1 Test Summaries with Mixture 1 Test Series
A premixed gas mixture, referred to as Mixture 1, composed of oxygen, methane,
hydrogen, ethane, and steam was investigated, in order to examine its flammability and flame-
propagation properties, by Pat Kutzler et al. at PSU in 2008 in tests 1 thru 29 [35]. Tests 30 thru
38 were run with Mixture 1 to allow the new research team to compare results to existing results
with the same overall experimental setup. The following results are for the recent test runs from
Test#34-38 with Mixture 1.
Test # 34: Ignition observed.
Test # 35: Test failed due to igniter malfunction.
Test # 36: Ignition observed.
Test # 37: Ignition observed. Pyrex tube partially sooted.
Figure 35: Glass tube liner post-test from Test #37
Test # 38: Test Failed as the Methane supply was depleted before the end of the test.
88
B.2 Test Summaries with Mixture 2 Test Series
A premixed gas mixture, referred to as Mixture 2, composed of oxygen, methane,
propane, butane, ethane, and steam was investigated in order to examine its flammability and
flame-propagation properties.
Test # 39: Ignition observed. There was a loud noise when ignition occurred that indicated high
chamber pressures were reached.
Test # 40: Ignition observed. PD5 was not aligned, therefore did not produce reliable results. The
flame propagation interval was not identified as the photodetectors did not register signals. This
failure in the photodetectors is due to windows being obstructed by debris generated from Test
#39. Even though the Chamber was cleaned after Test #39 the photodetectors were not cleaned
individually. Due to the lack of photodetector signals no flame speed was calculated for this test.
At ignition a loud noise was again associated with high pressurization of the chamber.
Test # 41: Ignition Observed. The typical rapid flow loss immediately after ignition is not
observed in this test.
Test # 42: Test failed due to erratic steam behavior.
Test # 43: Ignition observed.
Test # 44: Unplanned ignition observed. Possible autoignition. This incident led to the
development of a test procedure to slowly step up the oxygen flow.
Test # 45: Ignition observed. Loud noise heard.
Test # 46: Ignition observed. Had to clean exhaust line and exhaust valve of shattered glass from
Test # 45.
Test # 47: Ignition observed. Flame spreading was very unsteady.
89
Test # 48: Ignition observed. Very large noise oscillation seen in dynamic pressure transducer
data. Any oscillations of this magnitude were determined to be due to a loose connection at the
gauge.
Test # 49: Ignition observed.
Test # 50: Ignition observed.
Test # 51: Ignition observed. Changed to H trim on Steam "Badger" Valve to allow for more
steam flow.
Test # 52: Ignition observed. Mixer static pressure gauge failed in previous test.
Test # 53: Ignition observed. PD data indicated very turbulent, unsteady flame spreading.
Test # 54: Ignition observed.
Test # 55: Ignition observed.
Test # 56: Ignition observed. Highly oscillatory pressurization and flame spreading. This
indicates a different type of flame spreading, or combustion regime.
Test # 57: No ignition observed.
Test # 58: Ignition observed.
Test # 59: Ignition observed. Odd rate of pressurization and flame spreading was observed. As
the steam content increased, photodetector and dynamic pressure data appeared highly unsteady
as in this test.
Test # 60: No ignition observed.
Test # 61: Ignition observed.
Test # 62: No ignition observed by Vision DAQ.
Test # 63: Ignition observed.
Test # 64: No ignition observed.
Test # 65: Test failed due to igniter malfunction.
Test # 66: No ignition observed.
90
Test # 67: No ignition observed. Lower temperatures were observed during ignition due to lower
pressure decreasing the temperature of the steam which controls the mixture temperature.
Test # 68: No ignition observed. Lower temperatures during trigger initiation.
Test # 69: No ignition observed.
Test # 70: No ignition observed.
Test # 71: No ignition observed.
Test # 72: Ignition observed. Error with DAQ no recordings obtained.
Test # 73: Ignition observed. Nitrogen purge accidentally on during test.
Test # 74: Ignition observed. Burst disk failure occurred about 1 second after trigger, when flows
were shut off.
Test # 75: Ignition observed, dynamic pressure recordings failed due to operator error.
Test # 76: Ignition observed with very small pressure rise.
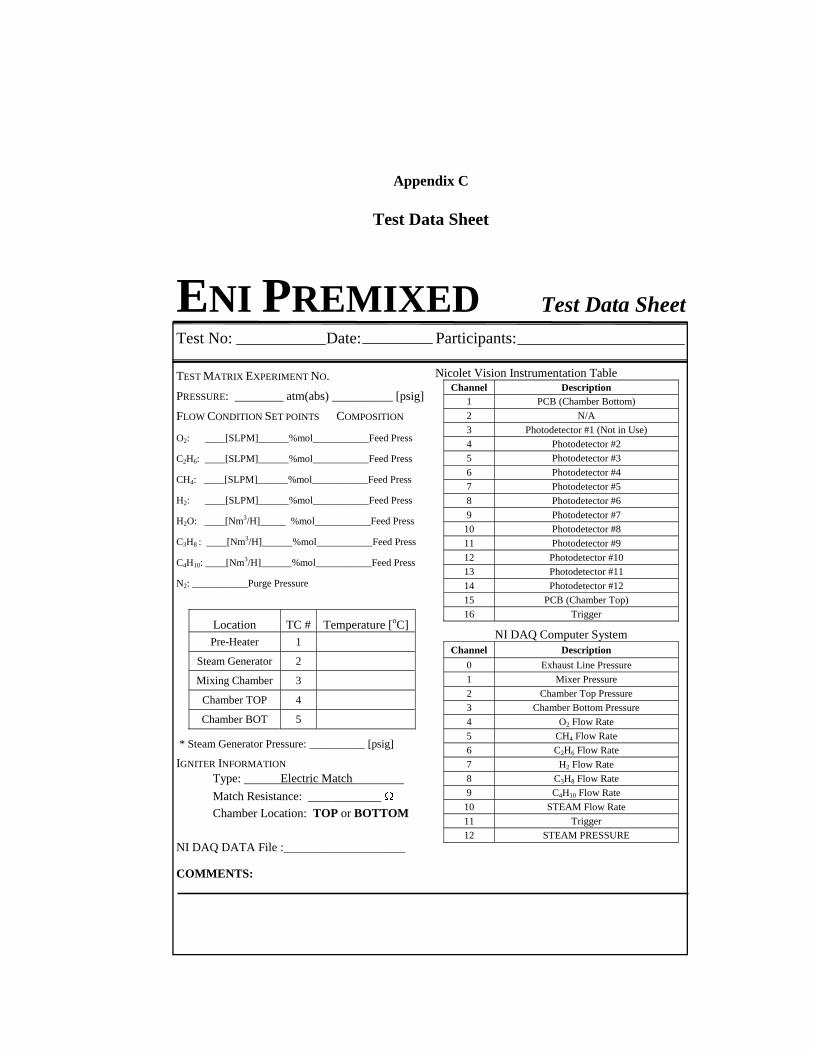
Appendix C
Test Data Sheet
ENI PREMIXED Test Data Sheet
Test No: Date: Participants:
TEST MATRIX EXPERIMENT NO.
PRESSURE: ________ atm(abs) __________ [psig]
FLOW CONDITION SET POINTS COMPOSITION
O2: ____[SLPM]______%mol___________Feed Press
C2H6: ____[SLPM]______%mol___________Feed Press
CH4: ____[SLPM]______%mol___________Feed Press
H2: ____[SLPM]______%mol___________Feed Press
H2O: ____[Nm3/H]_____ %mol___________Feed Press
C3H8 : ____[Nm3/H]______%mol___________Feed Press
C4H10: ____[Nm3/H]______%mol___________Feed Press
N2: ___________Purge Pressure
Location TC # Temperature [oC]
Pre-Heater 1
Steam Generator 2
Mixing Chamber 3
Chamber TOP 4
Chamber BOT 5
* Steam Generator Pressure: __________ [psig]
IGNITER INFORMATION
Type: Electric Match h
Match Resistance: ____________
Chamber Location: TOP or BOTTOM
NI DAQ DATA File :____________________
Nicolet Vision Instrumentation Table
Channel Description
1 PCB (Chamber Bottom)
2 N/A
3 Photodetector #1 (Not in Use)
4 Photodetector #2
5 Photodetector #3
6 Photodetector #4
7 Photodetector #5
8 Photodetector #6
9 Photodetector #7
10 Photodetector #8
11 Photodetector #9
12 Photodetector #10
13 Photodetector #11
14 Photodetector #12
15 PCB (Chamber Top)
16 Trigger
NI DAQ Computer System
Channel Description
0 Exhaust Line Pressure
1 Mixer Pressure
2 Chamber Top Pressure
3 Chamber Bottom Pressure
4 O2 Flow Rate
5 CH4 Flow Rate
6 C2H6 Flow Rate
7 H2 Flow Rate
8 C3H8 Flow Rate
9 C4H10 Flow Rate
10 STEAM Flow Rate
11 Trigger
12 STEAM PRESSURE
COMMENTS:
Appendix D
Premixed Gas Reactor Test Checklist
TEST NO.: DATE: OPERATORS:
Pre-Test Procedure
Photodetector box
Setra box
Validyne box
PCB signal conditioners
Teledyne-Hastings mass flow controller
Siemens mass flow meter power box
Load new Pyrex tube into chamber connecting the heat exchanger and exhaust line
install new igniter in bottom plate
Verify steam generator and pre-heater have sufficient water levels
Verify that the gas bottles have sufficient pressures to run the test
Verify the shop air pressure is around 90 psig and the air supply for the I/P controller and
Badger control valve is set to 22 psig
Make sure that igniter is electrically continuous and not grounded to the chamber
Make sure that the igniter is not connected to the igniter extension cord
Check that the transducer, photodetector, and TC probe wires are connected to the correct
channels in the data acquisition systems
Confirm Methane Plug Valve is open to Chamber
Prepare video camera systems for remotely monitoring the test facility and steam
pressure
Prepare Data Acquisition Systems (NI and Vision)
93
Test Procedure
Display Testing Signs on Room 128 doors
Turn on the steam generator well in advance of test time. Set Controller on Panel to 200
psig
Slightly Open the Vent Valve on the Steam Generator for Safe Heating Procedure
Open valve on water line to supply water to the exhaust heat exchanger
Main operator should keep the control panel arming key in his pocket
Check igniter resistance and continuity to ensure it is unfired
Turn on the Preheater when The Steam Generator Pressure is around 100 psig.
Preheat reactor with N2 flow and preheat steam line until suitable temperatures are
reached
Open N2 Cluster and confirm valves in Compressor Room are directing flow to lab
Run N2 flow to purge system of any condensation in the reactor from the steam flow
Once Chamber Temperatures are at 40 C and Steam Generator at 200 psig, Set steam
pressure controller to 450 psig
Open Steam Ball Valve to flow to chamber and Vent out water in lines
Set steam flow to 20-40% to get steam to start flowing through chamber
Prepare Fuel System
Open Ethane and set Regulator
Methane (& N2 for regulator) hold on setting regulator
Prepare LPG system
Close Plug Valves to Test Chamber
Close N2 fill valve to Butane
Open N2 fill valve to Propane
Open N2 Bottle, Set 2-way valve to fill
Pressurize Propane to 400 psig (Listen for piston to move to top)
Open Propane Bottle
94
Set 2-way valve to vent and slightly open vent gate valve as propane fills (5
mins)
Confirm Propane Piston is at bottom (no more venting)
Close N2 fill valve to Propane
Open N2 fill valve to Butane
Remove Butane plug above fill tank (Allow to fully vent)
Attach fitting and N2 fill line to push piston to bottom
Reassemble and fill Butane by Opening the Butane Bottle
Close N2 fill valve to Butane (Hold on setting regulator)
Do Final Visual Check of Test Cell
Turn off Pre-heater, Close N2 preheat bottle, let N2 flow out, close solenoid valve
Open oxygen bottles and keep regulator around 500 psig
Make announcement of the upcoming test using microphone and Public Address system
Test operators should go to test stations and assign the duties to all participants
Bring the flow rates of the gases and steam to the pre-selected values by setting the mass
flow controller channels and LabVIEW-controlled valves
Open Fuel Solenoid Valve
Set flow of Ethane
Set flow of Methane, coordinate with person setting methane regulator
Pressurize LPG flow system, open Valves to Test chamber
Set flow of Oxygen, coordinate with N2 Flow
Set flow of Steam
Set flow of LPG
Turn off N2 diluent flow
Bring the chamber to pre-selected pressure by slowly adjusting the exhaust valve on the
control area wall
Begin Recording with Vision DAQ System
Activate NI DAQ (Must hit trigger within 2 minutes of this step)
Record Temperatures
Turn Igniter safety key switch to ARMED (RED LIGHT) position
Countdown the test firing and activate the igniter switch
95
Post-test Procedure
Open the exhaust valve fully to depressurize the test chamber
Immediately set all flows to zero on the mass flow controller channels
Open N2 purge valve to discharge residual gases (allow N2 gas to flow until chamber is
cleared of exhaust gases)
Turn off power supply to low-pressure pre-heater and high-pressure steam
generator
Close all the gas bottle valves and turn off valve in water line to heat exchanger
Save the data files and copy to the appropriate HPCL network project folder
Disassemble chamber and prepare for next test run
Remove Test Signs on Room 128 doors
REMARKS:
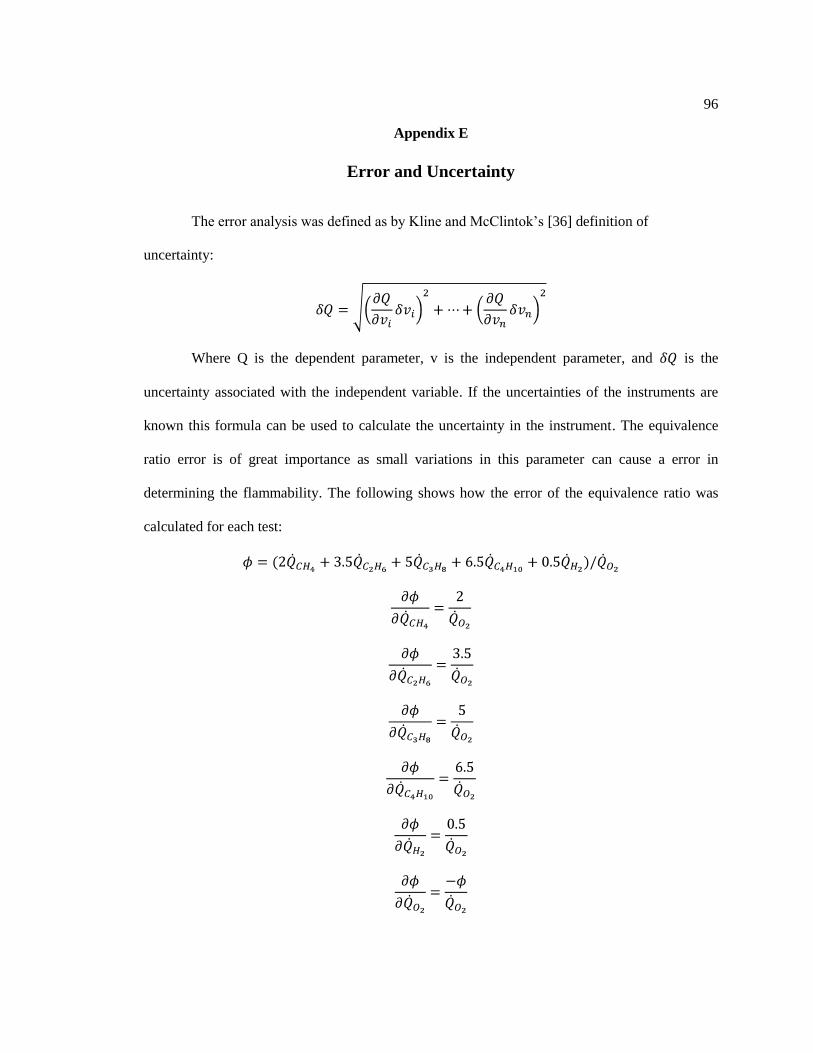
96
Appendix E
Error and Uncertainty
The error analysis was defined as by Kline and McClintok’s [36] definition of
uncertainty:
Where Q is the dependent parameter, v is the independent parameter, and is the
uncertainty associated with the independent variable. If the uncertainties of the instruments are
known this formula can be used to calculate the uncertainty in the instrument. The equivalence
ratio error is of great importance as small variations in this parameter can cause a error in
determining the flammability. The following shows how the error of the equivalence ratio was
calculated for each test:
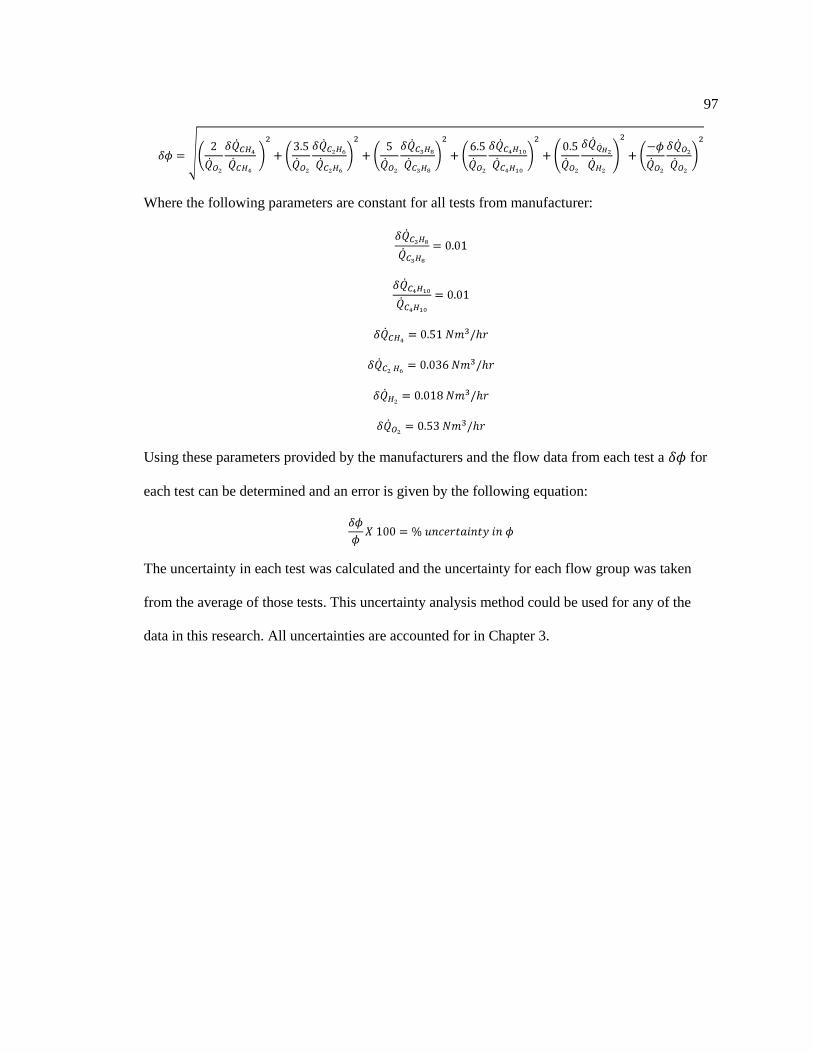
97
Where the following parameters are constant for all tests from manufacturer:
Using these parameters provided by the manufacturers and the flow data from each test a for
each test can be determined and an error is given by the following equation:
The uncertainty in each test was calculated and the uncertainty for each flow group was taken
from the average of those tests. This uncertainty analysis method could be used for any of the
data in this research. All uncertainties are accounted for in Chapter 3.
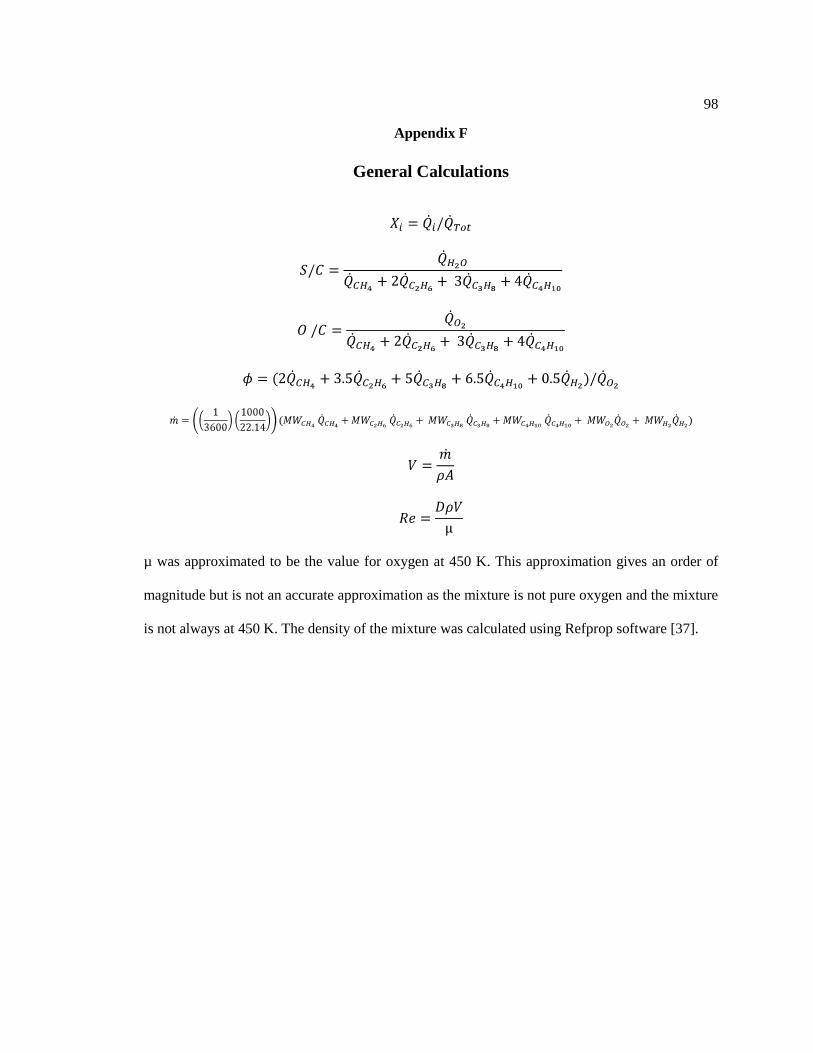
98
Appendix F
General Calculations
µ was approximated to be the value for oxygen at 450 K. This approximation gives an order of
magnitude but is not an accurate approximation as the mixture is not pure oxygen and the mixture
is not always at 450 K. The density of the mixture was calculated using Refprop software [37].