Embed Size (px)
Citation preview

i
INFLUENCE OF SUGAR FACTORIES ON IMPROVEMENT OF CANE
FARMERS LIVELIHOOD IN KENYA. A CASE OF BUNGOMA EAST
SUB COUNTY
JACKSON PEMBERE WANYONYI
A RESEARCH PROJECT REPORT SUBMITTED IN PARTIAL FULFILMENT
OF THE REQUIREMENTS FOR THE AWARD OF THE DEGREE OF MASTER
OF ARTS IN PROJECT PLANNING AND MANAGEMENT OF THE
UNIVERSITY OF NAIROBI
2016

ii
DECLARATION
This research project report is my original work and has never been presented for any
examination in any university for academic award.
Signature……………………….…… Date …………………………………….
PEMBERE J. WANYONYI
L50/76613/2014
This research project has been submitted for examination with my approval as the
University Supervisor
Signature……………..…………………….. Date……………………………………..
DR. OKELLO STEPHEN
Lecturer, University of Nairobi

iii
DEDICATION
I dedicate this project to my dear Roby and my dear wife for giving me another chance to
live through organ donation and support respectively.

iv
ACKNOWLEDGEMENT
My acknowledgement goes to my able supervisor Dr. Okello for his mature criticism
and guidance during the writing of this research project. My gratitude also goes to
the University of Nairobi for providing space and enabling environment for my studies.
My recognition also goes to my 2015 fellow course mates who have been always
there for me when I required their support.
I also wish to heartily register my acknowledgement to the efforts of my fellow MPPM
students for their encouragement and team work that fuelled me through this work and in
a special way Issa and Marcus at Bungoma Sub-Centre. I also appreciate the conducive
environment the institution provided me with to enable me pursue my studies. Much
acknowledgement goes to all my lecturers for this course for their tireless efforts to
impart the necessary knowledge in me that has been of much importance in this study.
They have really been a source of inspiration to me. My thanks also go to my work
mates and colleagues at Matulo Girls Sec. school, for their continued encouragement
and support during this course work. To all of the aforementioned, I say may God bless
you abundantly

v
TABLE OF CONTENTS
DECLARATION……………………….……………………………………………......ii
DEDICATION…..............................................................................................................iii
ACKNOWLEDGEMENTS…………………………………………………………….iv
TABLE OF CONTENT………………………………………..……………………….v
LIST OF FIGURES ………………………………..…………………………….........xi
LIST OF TABLES …..………………………………………………………………..xii
LIST OF ABBREVIATIONS AND ACRONYMS………………………….…......xiv
ABSTRACT……………………………………………….………………….………...xv
CHAPTER ONE:
INTRODUCTION……………………………………………………...….……….…..1
1.1 Background of the study…………………………………………………………......1
1.2 Statement of the problem………………………………………………………….....4
1.3 Purpose of the study….................................................................................................5
1.4 Research objectives ………………………………………………............................5
1.5 Research questions……………………………………………………….……….….5
1.6 Significance of the study………………………………………………………..........5
1.7 Limitation of the study ……………………………………………………….…...…6
1.8 Basic assumptions of the study ……………………………………………….…......6
1.9 Delimitation of the study …………………………………………………………....7
1.10 Definitions of significant terms used in the study……………………………....….7
1.11 Organization of the study…………………………………………..…………...... 8

vi
CHAPTER TWO: LITERATURE REVIEW…………………………………...9
2.1 Introduction……………………………………………………………………..9
2.2 Improvement of Farmers Livelihood ……………………………………...……9
2.3 Income from cane delivered and improvement of farmers‟ livelihood ……......11
2.4 Influence on education and improvement of cane farmers‟ livelihood……........14
2.5Influence on food security and improvement of Cane farmers‟ livelihood
………………………………………………………………………………………19
2.6 Influence ofsugar factories input on improvement of farmers‟ livelihood………22
2.7 Theoretical Framework…………………………………………………………....26
2.8 Conceptual Framework………………………………………………….….……...26
2.9 Summary of Literature Review. …………………………………………….…….28
CHAPTER THREE: RESEARCH METHODOLOGY…………….…………......29
3.1 Introduction …………………………………………………………………….....29
3.2 Research design……………………………………………………………….…..29
3.3 Target population ………………………………………………………...……….29
3.4 Sample size and Sampling procedure…………………………………..………...30
3.4.1 Sample size …………………………………………………………………….30
3.4.2 Sampling procedure……………………………………………………………30
3.5 Data Collection Instruments………………………………………………….....31
3.5.1 Pilot study…......................................................................................................32
3.5.2 Validity of the instruments……………………………………………….…....32
3.5.3 Reliability of the instruments………………………………………………….32
3.6 Data Collection Procedure ……………………………………………………......33
vii
3.7 Data Analysis Techniques ……………………………………………………...33
3.8 Ethical Consideration…………………………………………………………...34
3.9 Operational definition of variables ……………………………………….….....34
CHAPTER FOUR
DATA ANALYSIS, PRESENTATION, INTERPRETATION AND DISCUSSIONS
4.1Introduction……………………………………….……………………………36
4.2Questionnaire Return Rate ………………………………………………..…...36
4.3 Demographic Characteristics of Respondents…………………………………37
4.3.1 Distribution of Respondents by gender…………………………..……………….37
4.3.2 Distribution of Respondents by age ……………………………………………..38
4.3.3 Respondents by education level ………………………………………………….39
4.4 Income from cane supplied to sugar factories and improvement
Of cane farmers‟ livelihood ……………………………………………………….…….39
4.4.1 Income earned by farmers‟ from cane harvested …………………………………39
4.4.3 Duration of cane payment after delivery to millers……………………….……...41
4.4.5 Rating of the importance of sugarcane income…………………………………….42
4.4.6 Main source of the income of the family………………………….…………..….43
4.4.7 Pricing formula of the cane supplied to the sugar factories…………………….44
4.5 The influence of Sugar factories practices on education improvement
of cane farmers‟ livelihood…………………………………………………….……….45
4.5.1 School Attendance………………………………………….……………….……..45
4.5.2 Affordability of Education ………………………………………………….……47
4.5.3 Enrollment in schools in the region ……………………………………………….48

viii
4.5.4 Barriers to School Enrolment …………………………………………………………49
4.5.5 Role of sugar factories in improving infrastructure development
in schools……………………………………………………………50
4.5.6 Facilities repaired/maintained by sugar factories to Enhance Teaching/Learning
in the Schools………………………………..………………….….52
4.5.7 Items Donated by sugar factories to Enhance Teaching/Learning
in the Schools…………………………………………………………………….53
4.6 Sugar factories influence on improvement of food security as a livelihood
Enhancement of sugarcane farmers…………………………..……54
4.6.1 Respondents‟ overall farm size……………………………..…….54
4.6.2 Management advice to farmers‟ to leave a third of total land
area for food crop production…………………………..………57
4.6.3 Effect of sugarcane management on food availability …………....58
4.6.4 Ways through which sugar factories‟ management has contributed
towards achieving food security to farmers…………..…….59
4.6.4.1 Sugar factories addressing food security by education the farmers…….59
4.6.4.2 Addressing food insecurity on providing dairy animals………..……..60
4.6.5 The source of food to sugar cane farmers………………………….…..61
4.7Influence of Sugar factories input in improvement of Livelihood of cane farmers
…………………………………..……62
4.7.1 Infrastructure improvement……………………………..…..…63
4.7.1.1 Improving road network in the region…………………………………63
4.7.1.2 Access to information in relation to sugar factories……….…..63

ix
4.7.1.3 Source of water/provision………….…………………………………....64
4.7.1.4 Material that used of residence of the sugarcane farmers……..65
4.7.2 Extension services by sugar factories………………………………..….66
4.7.2.1 Operations as advised by factories staff…………………..…..66
4.7.2.2 Appropriate extension method of improving cane production…….…68
4.7.2.3 Level of technology adoption by farmers………………………………….…69
4.7.3 Agricultural inputs………………………………………………………………………..…69
4.7.3.1 Cane transportation to sugar factories……………………………………………..70
4.7.3.2 Supply of cane seed for planting…………………………………………………....70
4.7.3.3 Supply of fertilizer…………………………………………………………………....71
4.7.3.4 Quality of land preparation…………………………………………………………72
4.7.4 Environmental initiative by sugar factories……………………………………….73
4.7.4.1 Factories role in conserving the environment………………………………..73
4.7.4.2 Diversifications with agroforestry to curb environmental degradation……………..74
CHAPTER FIVE
SUMMARY OF FINDINGS, DISCUSSIONS, CONCLUSION AND
RECOMMENDATION
5.1 Introduction………………………………………………………………………… 76
5.2 Summary of Findings………………………………………………………………..76
5.3 Conclusion…………………………………………………………………………78
5.4 Recommendations……………………………………………………………………80
5.6 Suggestions for Further Research……………………………………………………81
REFERENCES…………………………………………………………………………82

x
APPENDICES…………………………………………………………………………..87
Appendix I: Letter of Transmittal ………………………….…………………………87
Appendix II: Questionnaire………………………………………………………....88
Appendix III: Table of Sample Size Selection…………….………………………..99
Appendix V: Work Plan …………………………………………………………….100
Appendix VI Letter of authorization…………………………………………………101

xi
LIST OF FIGURES
Figure Page
Figure 2.1 - Conceptual framework………………………………….…………….27

xii
LIST OF TABLES
Table Page
Table 3.1 Selecting sample size…………………………………………………......31
Table 3.2 Operational Definition of Variables………………………………….…..35
Table 4.2Questionnaire return rate ………………………………………………...36
Table 4.2Gender……………………………………………………………………..37
Table4.3Age…………………………………………………………………………38
Table 4.4 Education level ………………………………….39
Table 4.5 Income earned by farmers‟ from cane harvested…………….…….40
Table 4.7 Duration of cane proceeds payment after harvesting……………...41
Table 4.9Importance of sugarcane income…………………………………..42
Table 4.10 Main source of the income of the family…………………………43
Table 4.11Pricing formula of the cane supplied to the sugar factories…..…...44
Table 4.12 Children at risk of dropping out of school due to
Lack of school fees………………………………………….…....45
Table 4.13Child/Children at risk of dropping out of school and rating ofthe level
Of satisfaction on what is offered by the sugar factories………….46
Table 4.14 Rating on affordability of education ……………………………..47
Table 4.15Children who attend school…………………………………………… 48
Table 4.16 Barriers to School Enrolment………………………………………..50
Table 4.17 Infrastructure improvement in schools………………………………50
Table 4.18 Facilities repaired by the Companies………………………………..52
Table 4.19 Donations by the Companies‟ to Schools…………………………...53

xiii
Table 4.20 Overall farm size…………………………………………………......54
Table 4.21 Acres under sugarcane per individual farmer.......................................…...55
Table 4.22 Acres under food crops per individual farmer……………………..56
Table 4.23 Advice to leave a third of land for food crop production …………….57
Table 4.24 Effect of sugarcane management on food availability…….…………58
Table 4.25 Addressing food security by education………………………….………59
Table 4.26Sugar factories addressing food insecurity on providing dairy
animals…………………………………………………………………………..….60
Table 4.27 Addressing food insecurity by providing maize/bean
seeds…………………………………………………………..…61
Table 4.28 Source of food to the sugar cane farmers…………………………..62
Table 4.29improvement of road network…………………………………........63
Table 4.30Access to information………………………………………………64
Table 4.31Source of water/ provision ……………………………………………65
Table 4.32Material used of residence……………………………………………66
Table 4.33operations as advised by extension officers………………………..67
Table 4.34 Appropriate extension method………………………………………68
Table 4.35 Adoption of new technology…………………………….………...69
Table 4.36 Transportation to factories……………………………………….....70
Table 4.37 Supply of cane seeds…………………………………………….…71
Table 4.38 supply of fertilizer…………………………………………………….71
Table 4.39 Land preparation…………………………………………………72
Table 4.40 Environmental conservation…………………………………………...73

xiv
Table 4.41 Agroforestry to curb degradation…………………74

xv
LIST OF ABBREVIATONS AND ACRONYMS
AEOs Agriculture Extension Officers
BUSCO Butali Sugar Company
CBS Central Bureau of Statistics
EPZ Export Processing Zones
EU European Union
FAO Food and Agriculture Organization
GDP Gross Domestic Product
IEA Institute of Economic Affairs
KACC Kenya Anti-Corruption Commission
KSI Kenya Sugar Industry
KSREF Kenya Sugar Research Foundation
LDCsLess Developed Countries
NIE Newly Industrialized Economy
NZUCO Nzoia Sugar Company
OECD Organization for Economic Cooperation and Development
SL Sustainable Livelihood
SUCAM Sugar Campaign for Change
UN United Nations
US United States
USDA United States Department of Agriculture
WEKSCO West Kenya Sugar Company

xvi
ABSTRACT
Sugarcane farming is an essential activity in the whole world because of the major
product it provides, that is, sugar. Sugar, which is got from processing sugarcane
mills, is planted by mainly farmers who deliver it to the processing factory after
maturity. Sugar factories are critical in uplifting the living standards of the people
as well as generating rapid economic growth through provision of healthcare
services and education facilities, social and community services as well as support
to sports in rural areas in the sugar growing zones. The purpose of this study was
to investigate the influence of sugar factories on the improvement of cane
farmers‟ livelihood in Bungoma East Sub County. This study was guided by the
following objectives: to establish how the income from cane supplied to sugar
factories influence improvement of the livelihood of the cane farmers‟ livelihood,
second was to examine how the Sugar factories influence education improvement
of cane farmers‟ livelihood, third was to assess how the Sugar factories influence
the improvement of food as a livelihood enhancement of sugarcane farmers and
lastly was to determine how the sugar factories input influence the improvement
of livelihood of sugarcane farmers. The study adopted the descriptive survey
research design to assess the influence of sugar factories on livelihood of farmers.
The target population was 9550 cane farmers and 10 AEOs hence a total of 9560.
The sample for this study was 370. The sampling technique used was stratified
sampling where farmers were grouped into locations and randomly selected. The
research instruments used in this study for data collection were questionnaire for
the farmers and AEOs. Data analysis used frequency tables and percentages to
analyze both quantitative and qualitative data. The element of reliability of the
measuring instruments was determined using the test re-test method. Statistical
Package of Social Sciences (SPSS) was used to classify and analyze the data that
was collected. It came out from the study that farmers could get some income
whenever their cane was harvested and delivered to the sugar factories and the
income depended on the acreage of the land. The income accomplished many
tasks in the family like paying school fees. It was also found that education status
in the study area had improved, as whole generation of children had been enrolled
in different schools. Sugarcane production had negative impact on food
production to most of the households. Also it came out that the sugar factories
management didn‟t provide dairy animals and maize/beans in addressing food
security so as to cushion farmers. Lastly factories influence on inputs seen
infrastructural development like of 59.1% of respondents were in agreement that
roads had improved. The construction and development of roads and
communication networks had enhanced the proper and fast marketing of farm
produce. On access to information 66.7% of head of households agreed that they
had full access and full satisfaction with reliability of information.
Recommendations for further research werethe influence of the rising cost of
energy on sugarcane farming, alternative modern farming methods that would
integrate cane farming and food production to ensure food security and factors
that led to the collapse of out growers‟ cooperative societies that championed the
plights of farmers‟.

1
CHAPTER ONE
INTRODUCTION
1.1 Background to the study
Sugarcane farming is a worldwide activity, practiced in most countries in the world. The
Sugar industries globally have had effects on the livelihood of the farmers in that it is
credited for social economic boost to communities around major production centers‟
through provision of healthcare and education facilities, training, drainage and irrigation,
social and community services as well as support to sports in rural districts. Sugarcane
growing has helped smallholder farmers to improve their household incomes, educate
their children, and expand their farms to engage in other enterprises like: vegetable and
poultry production, (Sserunkuma2007). United States has both large and well developed
sugarcane industries. According to Baucum, L.E. and Rice, (2008), sugarcane in the
United States of America, is grown mainly in Florida, Louisiana, Hawaii and Texas.
Florida contributed an estimated 48 percent of the cane sugar produced in the United
States (US) the year 2007-2008. Cash receipts for the U.S.A sugar growers vary with
sugar yields and prices. On average the sugar crops accounts for 1% of the cash receipts
received by the U.S.A farmers for all agriculture commodities. The sugar prices have
been well above world prices since 1982 because the U.S government supports domestic
sugar prices through loans and marketing allotment, (USDA 2015).
The sugarcane industry represents an important segment of the Brazilian economy. In
2012, the sugarcane sector contributed US$43.8 billion to the country‟s gross domestic
product (GDP) equivalent to almost 2% of the entire Brazilian economy, (Baer,
2008).The sugarcane sector in Brazil employs 1.09 million workers. Salaries from
sugarcane industry workers are among the highest in Brazil agriculture sector (Ministry
of Labor and employment annual report). During the past 30 years, Brazil became the
major producer of sugarcane and today it accounts for about one third of the
world‟s product. It is also the most efficient in sugar production. Brazilian sugar cane
based complex has three major product lines namely sugar, bio ethanol and bio
electricity. It is the largest exporter of bio ethanol, (Kimera, 2005).
2
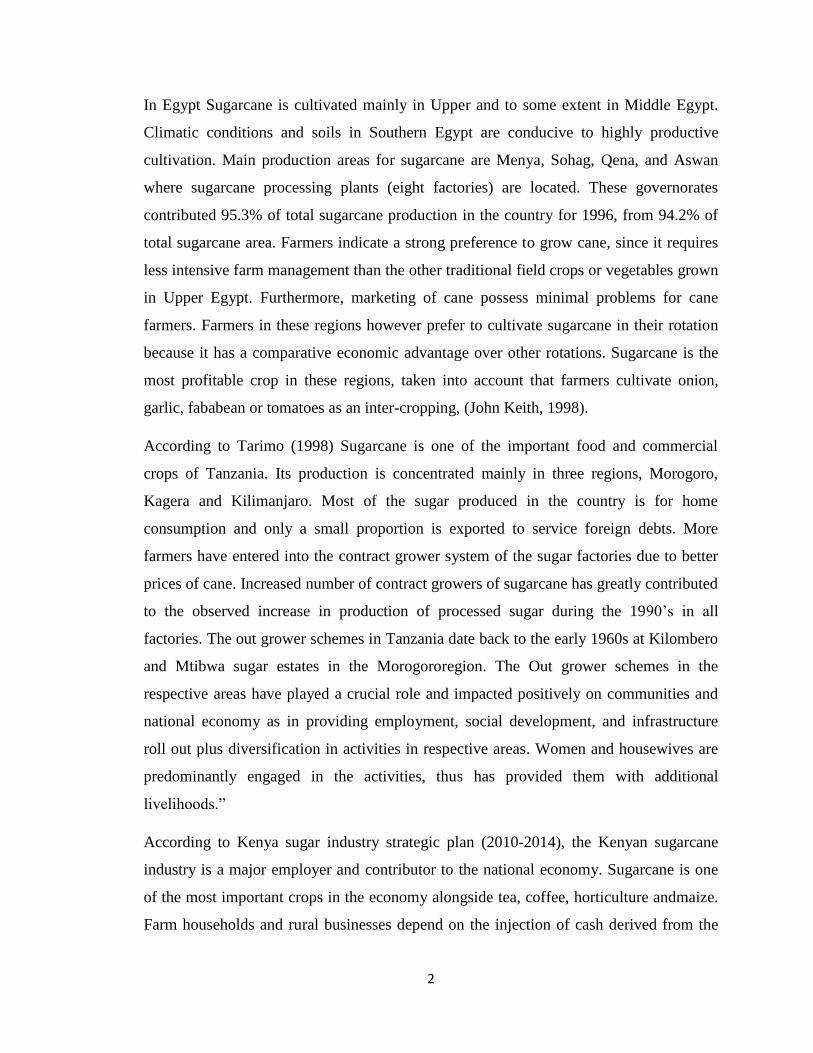
In Egypt Sugarcane is cultivated mainly in Upper and to some extent in Middle Egypt.
Climatic conditions and soils in Southern Egypt are conducive to highly productive
cultivation. Main production areas for sugarcane are Menya, Sohag, Qena, and Aswan
where sugarcane processing plants (eight factories) are located. These governorates
contributed 95.3% of total sugarcane production in the country for 1996, from 94.2% of
total sugarcane area. Farmers indicate a strong preference to grow cane, since it requires
less intensive farm management than the other traditional field crops or vegetables grown
in Upper Egypt. Furthermore, marketing of cane possess minimal problems for cane
farmers. Farmers in these regions however prefer to cultivate sugarcane in their rotation
because it has a comparative economic advantage over other rotations. Sugarcane is the
most profitable crop in these regions, taken into account that farmers cultivate onion,
garlic, fababean or tomatoes as an inter-cropping, (John Keith, 1998).
According to Tarimo (1998) Sugarcane is one of the important food and commercial
crops of Tanzania. Its production is concentrated mainly in three regions, Morogoro,
Kagera and Kilimanjaro. Most of the sugar produced in the country is for home
consumption and only a small proportion is exported to service foreign debts. More
farmers have entered into the contract grower system of the sugar factories due to better
prices of cane. Increased number of contract growers of sugarcane has greatly contributed
to the observed increase in production of processed sugar during the 1990‟s in all
factories. The out grower schemes in Tanzania date back to the early 1960s at Kilombero
and Mtibwa sugar estates in the Morogororegion. The Out grower schemes in the
respective areas have played a crucial role and impacted positively on communities and
national economy as in providing employment, social development, and infrastructure
roll out plus diversification in activities in respective areas. Women and housewives are
predominantly engaged in the activities, thus has provided them with additional
livelihoods.”
According to Kenya sugar industry strategic plan (2010-2014), the Kenyan sugarcane
industry is a major employer and contributor to the national economy. Sugarcane is one
of the most important crops in the economy alongside tea, coffee, horticulture andmaize.
Farm households and rural businesses depend on the injection of cash derived from the

3
industry. The survival of small towns and market places is also dependent on the incomes
from the same. The industry is intricately weaved into the rural economies of most areas
in westernKenya. Besidesthe socio-economic contributions, the industry also provides
raw materials for other industries suchasbagasse for power co-generation and molasses
for a wide range of industrial products including ethanol. Molasses is also a key
ingredient in the manufacturing of various industrial products such as beverages,
confectionery and pharmaceuticals.
Currently, the industry directly supports approximately 250,000 small-scale farmers who
supply over 92 percent of the cane milled by the sugar companies. An estimated six
million Kenyans derive their livelihoods directly or indirectly representing 16% of the
entire population(KSI 2010).The total area under cane in the country presently is
203,730Ha,of which 189,390Ha belongs to out-growers and 14,340 Ha.Nucleus Estates
(land owned/leased by mills to grow cane) (CBS2004). According to Export Processing
Zone Authority EPZ (2005), the growth of the sector is vital to the economic
development of a country as this ensures increased income and employment of rural
population especially small scale producers who constitute 75% of the Kenyan
population. The IEA (2005) has it that the sugar industry ensures food security and
improves rural livelihood, it also provides sustainable livelihood to millions of Kenyans.
Howevermostof the industry actors want a stakeholder system benefitting all.
Farmer‟sshouldbe given more powers to manage the industry without interference,
(Ochola, 2005).
According to Report of The Departmental Committee on Agriculture (2015), Kenya has
eleven (11) operational sugar mills in the country, 1 to be commissioned in Kwale
(KwaleInternational Sugar Company) while 2 mills,MuhoroniandMiwani are under
receivership. In this study, focus will be on the region of Bungoma East Sub County that
has farmers who supply cane to the sugar factories namely,Nzoia Butaliand West Kenya
companies and how the factories and farming venture of cane has impacted on their
livelihood. The study therefore looks at the influence of sugar factories on
theimprovement of cane farmers „livelihood in Bungoma East Sub County, so as to
provide data that will aid in policy formulation.

4
1.2 Statement of the problem
The sugar industry in Kenya supports directly or indirectly six million Kenyans,
which represents about 16% of the entire national population. The industry
contributes about 7.5% of the country's GDP and has a major impact on the economies of
Western Kenya and Nyanza regions and, to a lesser extent, Rift Valley, (Central Bureau
of Statistics 2010). In the Report of the Kenya Anti-Corruption on sugar, (2010) has it
that the subsector is a tool for social development that provides gainful employment and
wealth creation in the rural areas of Kenya. Growth of the sector is vital to the economic
development of the country as this ensures increased income and employment to the rural
population especially small scale producers thus the need for an initiative from the
stakeholders to streamline the industry for the benefit of the farmers, so that their
livelihood may be improved.
In this context, Nzoia Sugar Company (NSC), West Kenya Sugar Company (WEKSCO)
and Butali Sugar Company (BUSCO) rely heavily on the sugarcane supplied by farmers
for their sustainability. It takes one and a half years (18months) for cane to be ready for
harvesting. The farmer meets all the operational costs, land leasing/purchasing, land
preparation, planting, and maintenance then the companies takes up transportation the
cane to the millers for processing. In most cases sugarcane farmers devotes large parcels
of their land to cane farming at the expense of other crops hoping to get good returns
which turns out to be not the case. Currently payment per tonnage of cane delivered
depends on the miller ranging from Ksh3000 to Ksh2800 per ton. The government has
invested in the industry massively and its presence is expected to be reflected on the
quality of life of farmers. Even though millers have added value, farmers are yet to
experience any improvements in what they are paid for the cane and it is upon the
governments to ensure all stakeholders are brought on board and solutions to problems
affecting the industry addressed so that cane farmers may stand to benefit, (Ontomwa and
Okoth, 2013).
The sugar sector that supports over 6M livelihoods through various activities is on
decline. Cane farmers do not get the value of what they have invested in for. Much has
been done by the government like through Comesa protection but the situation has not

5
changed. Stakeholders should rise up to the occasion to salvage the industry that plays a
bigger role in people‟s livelihood.
1.3 Purpose of the Study
The purpose of this study wasto look at the influence of sugar factories on the
improvement of cane farmers‟ livelihood in Bungoma East Sub County.
1.4 Objectives of the Study
The study wasguided by the following objectives;
1. To establish how income from cane supplied to sugar factories
influenceimprovement of cane farmers‟ livelihood in Bungoma East Sub County.
2. To examine howSugarfactories influence improvementof education of cane
farmers‟ livelihood in Bungoma East Sub County.
3. To assess how Sugar factories influence improvement of food security as a
livelihood enhancement of sugarcane farmers.
4. To determine how input by sugar factories influence improvement of cane
farmers‟ livelihood in Bungoma East Sub County.
1.5 Research Questions
1. How does income from cane supplied to sugar factories improve cane farmers‟
livelihood in Bungoma East Sub County?
2. How do Sugar factories influence improvement of education of cane farmers‟
livelihood in Bungoma East Sub County?
3. In what ways do sugar factories influenceimprovement of food security as a
livelihood enhancement of cane farmers‟ in Bungoma East Sub County?
4. How do input bysugar factoriesinfluence improvement of cane farmers‟
livelihood in Bungoma East Sub County?
1.6 Significance of the Study
It is hoped that the study will help government agencies in policy formulation
regarding the welfare of sugarcane farmers by curbing cheap importation of sugar and
advocating for good payment. The knowledge gained from the study will act as a basis

6
for further research in various aspects of companies in relation to suppliers of raw
materials and improvement of cane varieties. The information in the study will also be
useful to Non-Governmental Organizations (NGOs) that advocate for economic welfare
of the citizens. Sugarcane farmers can also evaluate the viability of sugarcane farming as
compared to other economic uses of land. It is hoped that the study will assist the
government of Kenya in coming up with long term solutions to the issue of sugar
shortage, which has become a major problem in the country and which leads to
importation of large amount of sugar from outside the country. This can reduce by the
increase in the production of sugar locally by the local sugar factories in Kenya.
1.7 Basic Assumptions of the Study
The studyassumedthat sugarcane farmers in Bungoma East sub – county majorly depend
onNzoia Sugar Company, West Kenya Sugar Company and Butali Sugar Company for
their livelihood. The study assumed that participants in the research were willing to
participate freely and give honest opinions in the study. It was assumed that the sample
chosen for the study was a fair representation of the entire target population. Finally, the
instruments used in the study captured the variables under investigation. Respondents
were willing to provide accurate information and were to be looked at in the study and
that the data collection instruments were to exhibit validity and reliability.
1.8 Limitation of the Study
The study would have been carried out in all the sugar region of Western Kenya and
Nyanza to increase its external validitybutitwasnot be possible due to the vastness of the
study and the limited time span in conducting the study. The researcher reduced this
limitation by confining the study to sugarcane farmers supplying cane to NSC, WEKSCO
and BUSCOwithin Bungoma East Sub County. The other limitation was that the
respondent could give biased information and this false information might affect the
whole study. The researcher wasfriendly to the respondents so that the respondents could
be confident in him/her when disclosing their information. There was financial constrain
for example; making a number of travelling to go and collect data, telephone calls
expenses, printing of questionnaires which some of them were not returned and others

7
spoiled. The researcher ensured that he had adequate finance necessary for carrying out
the research fully to avoid short coming in the process of writing the proposal.
1.9 Delimitation of the Study
The study was carried out in Bungoma East District, of Bungoma County in Kenya. This
particular location was chosen because; it had farmers who supplied cane to West Kenya
sugar Company, Butali Sugar Company and Nzoia Sugar Company.
1.10Definitions of Significant Terms Used in the Study
Livelihood of sugarcane farmersMeans of securing necessities of life due
to Sugar production.
Sugar FactoriesMeans West Kenya Sugar Company,
ButaliSugarMills andNzoia Sugar
Company.
IncomeMeans earnings farmers get after
DeliveringCane to sugar factories.
FarmersPeople who grow and supply sugarcane
to NzoiaButali and West KenyaSugar
Companies.
Food security the ability to have access to enough
Foodby the people.
AssetsResources that people use to achieve
Livelihood objectives.
Improvement The ability to live a better quality life.

8
1.11 Organization of the Study
The study was organized into five chapters; chapter one basically gives the
introduction and described the background of the study, statement of the problem,
purpose of the study, objectives of the study, research questions, significance of
the study, basic assumptions of the study, limitations of the study and delimitations
of the study. Chapter two provided a review of literature related to the study
thematically as per the research objectives. Chapter three focused on the research
methodology discussed under the following subheadings; research design, target
population, sample size, sample selection, research instruments, data collection
procedures, data analysis technique and ethical issues in research. Chapter four
focused on the study findings, analysis, interpretations and discussions. Chapter
five, which is the last chapter, focuses on summary of the findings, conclusion,
recommendations for policy action, and suggestion.

9
CHAPTER TWO
LITERATURE REVIEW
2.1 Introduction
This chapter reviewed the literature related to the study. It covered the following themes:
Concept of the of improvement of farmers livelihood, income from cane delivered and
improvement of farmers livelihood, practices of sugar factory on education and
improvement of cane farmers‟ livelihood, sugar factory practices on improvement of food
security as a livelihood enhancement of sugarcane farmers, Input by sugar factories and
influence on improvement of farmers‟ livelihood, theoretical framework, conceptual
framework and summary of the literature review..
2.2 Improvement of Farmers Livelihood
A livelihood comprises the capabilities, assets (including both material and social
resources) and activities required for a means of living. A livelihood is sustainable when
it can cope with and recover from stress and shocks and maintain or enhance its
capabilities and assets both now and in the future, while not undermining the natural
resource base(Chambers & Conway,1991). Livelihoods are formed within social,
economic and political contexts. Institutions, processes and policies, such as markets,
social norms, and land ownership policies affect our ability to access and use assets for a
favorable outcome. As these contexts change they create new livelihood obstacles or
opportunities. (IRP 2005).
In this perspective, the diversification of agricultural and other livelihood strategies,
through community development activities, eases the pressures on weakened
environmental resources, making livelihoods more economically and environmentally
sustainable(IRP 2005).Engaging the ultra-poor and other marginalized groups in greater
market activity is one means of decreasing their economic and social vulnerability, which
strengthens the livelihood strategies of highly vulnerable groups by empowering them to
take advantage of a broader range of economic opportunities. One final important
characteristic of livelihoods is their interdependence. A given livelihood may rely on
other livelihoods to access and exchange assets. Traders rely on farmers to produce

10
goods, processors to prepare them, and consumers to buy them. Livelihoods also
compete with each other for access to assets and markets. This is a particularly important
consideration when planning livelihood assistance. Fewer and fewer households rely
on one source of income and the informal economy absorbs over half of the world‟s
labor force( Chen et al.2004).
With growing populations and the need to provide sufficient supply of food it is evident
that agricultural intensification plays a critical role in the growth of the rural economies
of developing countries (Hazell 1995). Several studies show that agriculture
intensification technologies foster and provide benefits for rural livelihoods. Among
these findings, Larson and Frisvold (1996), Wallace and Knausenberger (1997), Kelly et
al (2001), Bamire andManyong (2003), Morris et al (2009) outline the benefits derived
from fertilizer use in the intensification process. Common among these findings are
increased yields of several crops and hence improvement in income levels and general
well-being of rural people. High yielding varieties of crops is another aspect of the
intensification literature which impacts on the poor and deserves some attention.
Bourdillon et al (2003) assessing the effect of high yielding maize varieties in Zimbabwe,
found that there was improvement in the nutrition and health status among children in the
project. Incomes were marginally higher from the high yielding varieties, and participants
were able to reinvest in livestock which reduced vulnerabilities of households during time
of drought (Bourdillon et al 2003).
Poverty is widespread in the rural areas of South Africa. The extent and nature of
poverty in the rural communities has led to the implementation of a range of
development programs and projects aimed at improving rural livelihoods; thus many of
the projects have been implemented with the argument that future economic,
social, and environmental development in the rural communities is best secured by
improving rural economy, which is continuously marked by high levels of
unemployment,(May 1999).A sustainable community development project should
preferably have a positive effect not only on the involved, but also bring about
development in the community as a whole.

11
Insights on the dynamic nature of livelihoods diversification are also provided by
Koczberskiand Curry (2005). While investigating livelihood strategies among oil palm
settlers in PapuaNew Guinea, they realized that there were remarkable changes over the
years in activities pursued by householders. They identify that the ability of members‟to
diversify their on-farm activities provide opportunities to re-invest back into oil palm
andfood production. They report that palm oil and food crop production activities remain
themajor source of income with only a small proportion of these households sourcing
incomefrom the non-farm sector. Koczberski and Curry (2005) identify that there is the
need for intervention to provide a linkage between the non-farm and the palm oil sector
to encourage improved employment.
2.3Income from cane delivered and improvement of farmers’ livelihood
The sugar industry supports over 6 million Kenyans and is a major source of income for
over 200,000 small-scale farmers who account for85% of cane supply to the six
companies (KSI 2010). Sugar cane farming is not only a source of subsistence income for
millions of poor households but also provide employment to the poor living in the rural
villages of sugarcane growing zones. Kenya has predominantly been an agricultural
based economy, where almost every household is involved in some agricultural activity
particularly crop production. The contribution of crop income to total income is high and
an effective target for raising incomes through appropriate policy direction in the sector.
In kind incomes are a source of food to rural households while cash income represents
the household‟s purchasing power for the other basic necessities e.g. shelter and clothing.
Rural household incomes are complex owing to the multiple sources that it comprises of.
However, the main sources of income for the rural people are crops, livestock and off
farm activities like small businesses.
The sugar industry is intricately weaved into the rural economy of most areas in Kenya
(KSB, 2010). In Western Kenya and Nyanza sugar belt, farm households and rural
business depend on the injection of funds derived from the sugar industry. The
survival of small towns and market places in these regions is dependent on the income
from the sugar industry. A study in Nyando sugar belt revealed that cane farming is a
major source of income to the farmers, (Odenya et al. 2009). In the study, 81.3% of the

12
Nyando farmers derived income from cane farming, 16% from cane farming and business
and only2.7% from employment and other businesses. Sorre (2005) revealed that
sugarcane income enabled farmers raise sugarcane on both their own farms, leased plots
and also enabled them to invest in other businesses. According to Oniango (1987),
introduction of sugarcane led to buying of land from non-cane farming families by
cane farming families in order to increase their income.
Personal income may be defined as the sum of the market value of rights exercised in
consumption and the change in the store of property rights between the beginning and
end of the period, (Simons, 1938).Households that operate farms often receive, in
addition to their rewards from farming, income from running non-agricultural businesses,
from waged employment and from social transfers. It implies that quite a number of
people will earn their income through waged employment by working in sugar cane
farms and factories as laborers. It is important when assessing the welfare of agricultural
households not to assume that these other sources are unimportant. Empirical evidence
suggests that they can be of great significance in many countries at all levels of
development, (OECD, 2003). For example, in the United States over four fifths of the
household income of farm operator households regularly comes from non-farm sources
and in 2000 this was over 95 per cent, (Mishra et.al 2002).
According to USDA,on average, farm household income has been roughly comparable to
the median for all U.S. households since the 1970s. In 2004, the most recent year for
which comparable data exist, the average farm household had an annual net income of
$81,480, while the average U.S. household netted $60,528. However, farm households
that receive most of their income from farming experience more year-to-year fluctuations
in household income than other households. Farm household income is often determined
by a range of socio-economic and demographic factors, (Ibekwe2010).When measuring
income according to the approach to personal income outlined above, the flow of
resources towards households comes in three main forms: from gainful activities, mainly
employment and self-employment; from the ownership of property (rent from land,
interest from financial assets); and from transfers, mostly social transfers
organizedbygovernment but also private ones, such as from family members working
13
abroad. Depending on which definition of an agricultural household is applied, the farm
business may be the only source of self-employment income, the main source or a minor
source but it will always contribute a part of the total.
In economic analysis of the farm supply response study, price was a critical economic
factor that determined farmers‟ production decision (Anwar &Naeem, 2008). In Kenya,
the sugarcane pricing formula is used to determine the sugarcane price per ton. The
pricing formula is recognized in the Sugar Act 2001. The sugarcane pricing formula is
reviewed by the sugarcane pricing committee chaired by Kenya Sugar Board (Ingara,
2009). The formula used is as follows;
Sugarcane price =average price of ton sugar (prevailing month)*farmer‟s sharing ratio
(50%) /10.
But sometimes the formula is not used due to the market forces of supply and demand,
sugar imports and competition between mills for sugarcane. Introduction of new sugar
mills like Butali in Western Kenya, Sukari and Transmara in South Nyanza have brought
stiff competition in the Sugar Industry affecting use of the pricing formula in purchase of
sugarcane from farmers.Generally higher prices are expected to result in a larger output
per area and increase in area of production. Yanagida&Bhartti (1990), revealed that
official procurement price for sugarcane at mill gate and relative returns to alternative
uses of sugarcane were principal factors affecting sugarcane supply. This is further
supported by Ramulu (1994) who concluded in his study that there was significant and
positive influence of price and yield/acreage in cane production in Andhra Pradesh state
of India.
Sorre (2005) revealed that the desire to satisfy growth needs led farmers in MSC scheme
to use cane income to build houses. This is further supported by Oniang‟o (1987) who
revealed that in MSC scheme, 29.3% of houses were constructed from sugarcane
proceeds. He further confers that apart from a few salaried employees, there are very few
alternative income sources for house construction in Mumias sugar zone other than cane
proceeds.Therefore the researcher sought to investigate the various financial factors that
influence cane production by contracted farmers.

14
Agricultural activity is subject to different risks, some natural or biological in origin,
others economic. These risks affect production volumes and prices and are thought
toresult in receipts and incomes that are more variable than in many other sectors.
Farmersadopt strategies to reduce the variability of their total income. A number of
market-basedtools are at their disposal, like diversification of income sources, capital and
debtmanagement, marketing techniques, hedging on futures markets and insurance. In
most countries, agricultural policies, shield farm householdsagainst large losses of
income. Social policies play a role in providing a safety net and fiscal arrangements can
help to smooth annual income variations (OECD, 2000).The contribution of agriculture
to economic activity is concentrated in rural areas. Indeed, the presence of agriculture is a
key element in the characteristic of rurality.
In many countries a main aim of agricultural policy is to support the income of farmers
and their families. When the objective is to provide a “fair standards of living for the
agricultural community”, as is the case with the EU‟s Common Agricultural Policy, the
comparability of the incomes of farm households with those of households belonging to
other socio-professional groups is seen as important, (Hill, 2000). Where the aim is the
alleviation of poverty, again the overall income of the household is an important
indicator. The wealth of agricultural households is important because changes in the real
value of that wealth is a form of personal income and is one that is typically less heavily
taxed. In agriculture the ratio between wealth and current income is often large, implying
that capital gains and losses may be disproportionately significant for farmers. The level
of wealth is also a source of economic status, the potential ability to consume putting
farm owners into a position different from people without wealth, (UN 2002).
2.4 Influenceon education and improvement of cane farmers’ livelihood
Education in every sense is one of the fundamental factors of development. No country
can achieve sustainable economic development without substantial investment in human
capital. Education enriches people‟s understanding of themselves and world. It improves
the quality of their lives and leads to broad social benefits to individuals and society.
Education raises people‟s productivity and creativity and promotes entrepreneurship and
technological advances, (Ozturk2001). Whereas disparities in education based on gender

15
and socioeconomic status can create a significant drag on growth a disparity in education
that aligns with social, political, and economic fault lines creates resentments leading to
violence, conflict, and instability. Schools and education systems can serve as channels
for the development of peaceful societies or exacerbate the situation, depending on the
policy insertion, (Miemie 2014).
The Aga Khan Development Network (AKDN) Education Programme in partnership
with the Afghanistan government since mid-2002 helped to develop and deliver a reform
plan that focused on quality improvement in the existing public education system. The
programme pursued an approach that directly reflects the government‟s policies and
sectorial plans, aiming to assist the public education sector after years of war to improve
access and quality of basic, secondary and tertiary education in order to make it more
relevant, effective and efficient. Specifically, the AKDN aimed to improve the quality of
teaching in all government schools through strengthening education training institutions
and the provincial and county departments of education; improving local support
structures/systems for schools through increased community involvement; and ensuring a
safe and healthy environment for students through the rehabilitation of destroyed
infrastructure. Under the partnership, the AKDN undertook the construction of 16
schools and a hostel at the P1 Teacher Training Centre, and assisted with refurbishing the
Centre, supplying furniture, and establishing and resourcing a library and a computer
Centre (Shakil, 2003).
The Jordan Education Initiative (JEI), a public-private partnership involving the
Government of Jordan, the international private sector, the local private sector, NGOs
and donors under the auspices of the World Economic Forum‟s Global Education
initiative brought together 45 partners and spend approximately $22 million either
through financial contributions or in kind payments. The initiative focused around
improving education in 100 Discovery schools, developing the technology industry and
providing life-long learning for Jordanian citizens. Through the initiative:
a) The Jordanian Ministry of Education gained expertise on implementation of
technology based learning solutions.

16
b) There was acceleration in the deployment of internet connectivity and computers in
schools.
c) The e-curricula drew attention to the blending of traditional learning resources and
exposed teachers to new ways of teaching and raised awareness of the potential of using
ICT to enhance learning and improve the quality of learning experiences (Mckinsey,
2005).
This implies that public-private partnerships in Kenya can help improve access
anddelivery of education as well as enhance the quality of education through effective
use of technology. In order to tackle the problem of high dropout rate and bring in out-of-
school children, the Indian government took a series of measures to make schooling more
attractive to all children in the age range of 6-14 years by introducing policies like mid-
day meals, school adoption programs (by better off private schools) and inviting the
private sector (particularly in ICT) to participate in the endeavor. A Minimally Invasive
Education Experiment (MIE- theMadangirProject) was effective in providing access to
computers to children who could not access them at home or at school. Tooley, (2001)
observed that the delivery of education is an industry, not an office of the government
and this industry can deliver effectively by harnessing the power of the private sector to
reach the poorest through modern technology. Therefore, with appropriate inputs from
both the private and public sectors, enormous resources and opportunities can be put at
the disposal of the education system (Jha, S. & Chatterjee, S., 2005).
Kande (2007) noted that consistent increase in enrolment in private secondary schools
isevidence enough that demand for secondary education far outstrip supply and with the
introduction of Free Primary Education (FPE) in 2003 and Free Day Secondary
Education (FDSE) in 2008, this will even rise to magnitude levels. There is therefore
greater need for the government to collaborate with the private sector, civil society and
the business community to expand the existing places to improve access to secondary
education in Kenya.Owing to the ever-rising demand in secondary school education, the
long-term goal for the government has been massive expansion and improvement of
national, provincial and district schools to avoid situations where tens of thousands of

17
primary school pupils compete for only 4,000 places in 18 national schools (Daily
Nation, Jan. 12th
2011).
The Ministry of Education, due to intense pressure from the expanded pool of primary
school leavers occasioned by the FPE, upgraded about 100 provincial secondary schools
to national schools status so as to raise the number of national schools to 118 and each
County to have two national schools. However, despite grand financial plans to cater for
the newly established national schools, the government spends almost 95% of secondary
education budget on teacher‟s salaries and other benefits leaving only 1.4% of total
secondary education budget allocation for operational costs, laboratory equipment and
physical facilities (KIPPRA, 2007). Taking into account that here are no special
additional resources to be injected into the education system, the proposal for new
national secondary schools require radical reforms to address expansion, financing and
resource requirements to avoid the proposed national schools becoming decadent “jua
kali” national schools lacking academic excellence (Standard Newspaper, Feb.2011).
These require the government therefore to explore and strengthen alternative financing
options for secondary education such as public-private partnerships.
In a developing country like Kenya, the onus of development lies mainly with the
government, which faces the predicament of multiple demands and limited resources.
This leads to a situation where even fundamental objectives such as basic literacy for all
are not met. On the other hand, there exists a vibrant private sector and business
community, which has resources and desire to undertake social responsibility (Jha and
Chatterjee, 2005). Although the concept of CSR is gaining some prominence within
policy debates in Kenya, it is not applied widely and is usually associated with
philanthropy. However, there are many private sector-related initiatives that might be
described as expressions of CSR as well as public-private partnerships (Kivuitu et al,
2005).Through Corporate Social Responsibility, Kenya Airways (KQ) helped in
supporting the renovations of 14 classrooms and administration block of Farasi Lane
Primary School located in Lower Kabete, Nairobi. Kenya Airways also helped in
replacing windows and doors, painting and plastering of walls and in addition new floors
were constructed and the entire school was painted. The technical team donated used

18
furniture and talks are under way to construct a kitchen and dining hall. Kenya Airways
also commissioned a secondary school project in Kisii town as part of its Corporate
Social Responsibility.
The airline also fully renovated classrooms, administrative block and staffroom and
installed a gate to improve security at a cost of Kshs 2 million for Riobara PAG
Secondary School in a bid to improve learning facilities for about 250 students and staff
(Kenya Airways CSR, 2008).In 2007, Telkom Kenya in her pursuit of Social
Responsibility supported the Good Neighbors Foundation, a programme by State House
Girls‟ School parents and students to carter for the needy students in the school.In Kenya,
Kenol/Kobil (a multi-national oil corporation) engages in a number of long-term
corporate social responsibility projects. These include the long-term rehabilitation and
capacity-building programme for Mama Ngina Children‟s Home, and the Kenol
Scholarship Fund thatwas set aside to enable bright children from underprivileged
families to acquire quality education. The company has since been offering employment
opportunities for bright graduates of its CSR projects.
In 2010, the Equity Group Foundation (of Equity Bank) under its corporate responsibility
programme partnered with the MasterCard Foundation to launch a 9-year Shs.4 billion
comprehensive secondary school education fund to assist academically gifted students
from poor backgrounds to pursue secondary education. In 2011, the programme received
support from UKaid, the Wings to Flyprogramme, which extended scholarships to 1,200
students who performed well in the 2010 K.C.P.E but who come from poor backgrounds.
The Wings to Fly programme hopes to reach 5,600 deserving children
The relation between education and better health and life expectancy involves causation
in both directions, for greater health and lower mortality also induce larger investments in
education and other human capital since rates of return on these investments are
greater when the expected amount of working time is greater, (Ozturk 2001).Where
formal education systems are flanked by programs of early learning and literacy and
skills development, additional benefits accrue to the individual, the community, society,
and formal education itself (UNESCO, 2005).Education is widely seen as one of the
most promising paths for individuals to realize better, more productive lives and as

19
one of the primary drivers of national economic development. The citizens and the
government of Kenya have invested heavily in improving both the access and quality
of education, in an effort to realize the promise of education as well as to achieve the
education-related Millennium Development Goals and Vision 2030, (Glennersteret al.,
2011)and in this perspective sugar factories have contributed a lot in education of the
region through scholarships, funding of education facilities and training.According to
CBS (2006) Ignorance or lack of access to information isa major handicap to human
development in Bungoma. The primary school age population (6-13) is 245,000 of which
the school enrolment is 97%. However, the dropout for boys is 57.5% and 53% for girls
by Standard Eight. The enrolment at secondary school is 29% for boys and 26.5% for
girls with a further drop out rate at 26.5% and 30% respectively for girls. This works out
to about 40,000 who complete secondary school or a mere17%. The majority of the
population in Bungoma is literate with primary education. Even those who complete
secondary school education, only 3% proceed to tertiary institutions. The rest join the
unemployed and indulge in menial occupations such as boda- bodaor bicycle taxis, as
they have limited employable skills. Ignorance is not only limited to the youthful
population. Indeed the productive potential of the county could be enhanced greatly by
improving access to information and knowledge. All sectors including education, health,
agriculture, afforestation (environment) and commerce would stand to gain a great deal
by skills enhancement and new knowledge propagation systems.
2.5 Influence on food security and improvement of cane farmers’ livelihood.
The concept of food security is multi-dimensional, encompassing food availability,
affordability, adequacy, safety and quality, (Kirimi et al (2013). According to World
Hunger and Malnutrition (2013), the United Nations defines food security as "all people
at all times having both physical and economic access to the basic food they need." It
continues to say that food insecurity results from climate change, urban development,
population growth and oil price shifts that are interconnected and rarely confined by
borders. It provides the case of Nigeria, where, being Africa's most populous country, a
legacy of corrupted governance and an economy based primarily on oil exports has left
the agriculture sector significantly weakened and millions of Nigerians hungry. And

20
poorer neighboring countries export more food to Nigeria in exchange for petrodollars.
Household food security also means that all people in a household have access to enough
food at all times to maintain a healthy and active life, Nord, Andrews and Carlson,
(2006). It includes availability of nutritionally adequate and safe foods, and an assured
ability to acquire acceptable foods in acceptable ways without resorting to emergency
food supplies, scavenging, stealing, or other coping strategies (Price et al., 2000).
Availability and ability to acquire food are therefore the two basic elements towards
household food security, (McCalla 1999). The household‟s ability to acquire food is
influenced by all resources (tangible and intangible) available to a household, which can
be used to acquire food through production, exchange or transfer. The more the
resources, the better the access to food. The rate at which these resources can be
converted into food also influences a household‟s ability to acquire food. The more
favorable the conversion rate, the greater the amount of food acquired. Food insecurity
has become the heart of international movements to overcome hunger and poverty. The
first Millennium Development Goal (MDG) sets as its target the eradication of extreme
poverty and hunger, with a target of halving the incidence of poverty and hunger by 2015
(FAO, 2007). It is estimated that more than 800 million people globally suffer from food
insecurity (FAO, 2007). Out of the 800 million, some two-thirds live in rural areas of
developing countries(Kohlmeyer, 2003). By the year 2050, global demand for food will
double (Kohlmeyer, 2003).
Therefore, food security issues cannot be ignored Strasberg et al (1999), found that
household agricultural commercialization in Kenya increased fertilizer use and
productivity for food crops. This may be because commercialization provides a
source of cash for purchase of inputs; enables households to access inputs
distributed through cash crop marketing firms; and, acts as a source of income to
purchase draft oxen and traction equipment that may promote food crop
productivity.
A study by Lihanda (2003) revealed that Mumias region was underdeveloped, and the
farmers grew small areas of subsistence food crops with large areas under bush and rough
grazing land. However studies by Mwadhili (1995) concluded that introduction of

21
sugarcane contract farming negatively affected food production. MSC sugarcane contract
has a clause that recommends a third of the farmers land to remain for food production
while the rest be used for sugarcane farming.The contract has a clause that states that the
company has an obligation to provide food security programmes to the farmer. However,
it has been impossible for the contracted sugarcane farmer to set aside land for
subsistence food crop production, thus infringing on the farmers ability to obtain
adequate food supplies and diversify income source (Wawire, Nyongesa&Kipruto, 2002).
In Kenya the land sizes have relatively become small due to fragmentation and
redistribution. A study by Wawire et al., (2002); Odenya et al (2008) revealed that as
household increases, there was a general trend of land diminishing. The study in Nyando
region revealed that the average family size of 4 persons reside on 2 acres of land hence
in -adequate land for sugarcane and food production.
Langat et al (2011), found that among smallholder tea farms in Nandi South,
Kenya, an increase in the ratio of land allocated to tea to that allocated to maize was
associated with greater food diversity score. This was attributed to the income from tea
realized throughout the year, which ensured household access to quality food. Kennedy
andCogill (1987) showed that income from cash crops control by women was associated
with improved child nutritional status, suggesting that women were more likely to spend
more on food and health care. According to these authors, a 1% increase in sugarcane
income in South Nyanza District in Kenya resulted in an increase in energy intake of 24
kilocalories per household per day. On average, sugarcane production increased
household income by 15% which increased household energy intake by 360
kilocalories per day, or approximately 33 kilocalories per day per person in the
household.
Kirimi et al (2013) has it that innovations that enhance households‟ access to land,
education, savings and employment can be instrumental in raising their ability to
produce food and access it from the market, ensuring food security. In addition, female-
headed households were more likely to be food insecure, which suggests an increasing
need for interventions that economically empower women, particularly the widows.
Also market participation can play a significant role in reducing food poverty and by

22
extension poverty in general. This suggests that facilitating the expansion of market
participation by smallholder farmers can be critical in helping households transition
out of food poverty. This will entail enabling access to production inputs, which are both
affordable and suitable to small scale farmers, thus ensuring that farmers are not
trapped in low productivity–low return farming activities that lead to food insecurity. It
is also important to ensure increased availability of commercial fertilizer and seed in
local markets near the farmers. The use of productivity enhancing inputs will
improve the ability of smallholder farmers to produce sufficient marketable surplus.
Also, it will be important to strengthen efforts geared toward creating market linkages for
the various agricultural enterprises.
A Global Food Crisis and Fair trade report (2009) aptly has it that a focus on small
farmers must be at the centre of any serious strategy to tackle poverty and increase food
security and productivity because: Such a focus would reduce poverty because Small
farms are home to two billion poor people and they play major social roles, providing
safety nets or subsistence living for the rural poor. Small farmers tend to spend their
income on local goods and services, boosting local economies, and are more likely to
employ people than adopt capital-intensive technologies. Also a focus on smallholders
would also increase food production since small farms produce the bulk of many
developing countries‟ food: up to 80% of Zambia‟s food, for example, and 45% of
Chile‟s vegetables, corn and rice. A considerable body of evidence also suggests that
small integrated farming systems can also yield more per hectare in the long-term than
large-scale monoculture farms.
2.6 influence of sugar factories input and improvement of farmers’ livelihood
Agriculture is a potent driver for poverty reduction. The World Bank estimates that GDP
growth from agriculture generates at least twice as much poverty reduction than any other
sector. Currently 65 percent of people in developing countries are involved in agriculture,
1.3 billion of them are small farmers, with limited access to inputs, infrastructure and
markets thus showing an urge to invest in it to improve the farmers‟ livelihood, (World
Bank 2013). In countries where agriculture represents one of the primary livelihoods,
concerted efforts to improve productivity through sustainable practices could change the
23
lives of millions. Therefore farmers need to be able to access markets at the local,
regional and global level in order to sustain a livelihood from their activities which
entails improving access to transport, storage and market facilities. Improving the
footprint of agriculture while increasing production needs a concerted effort in two areas:
first closing the uptake gap of existing best practices and technologies by focusing on
knowledge sharing and creating supportive extension services networks; and second
investing in innovation and research to provide the solutions for tomorrow and ensure
agricultural policies are science-based, (IFC 2011).
The entrenched traditional system of land ownership is almost sacrosanct and
represents a sensitive issue particularly in the farming communities of west Kenya and
the rift valley. Extensions to the sugarcane land in these areas should follow the same
pattern of out grower-miller relationship which secures involvement of land owners
as part of the production system. The millers should improve performance of their
nucleus farms to inspire out growers to follow suit. Also the survival of small towns and
market places in these regions is dependent on the income from the sugar industry. In
Ethiopia for example in addressing the challenges of sugar industry is to expand
production. Therefore, it is implementing an ambitious plan, through the ESC, to more
than double production by expanding the cultivated land area and improving production
infrastructure (dams, plant renovation) Sugar production and especially the extension
in cane area and processing have improved the livelihood of some neighboring
households through employment and income generation. Two of Ethiopia‟s main goals
of its sugar policy instruments are the stabilization of the sugar supply and the
control of consumer price. The instruments employed to achieve these goals may affect
the livelihood of poor stakeholders and have an effect on the wages of sugar
workers and farmers. Maintaining a low refined sugar price to consumers involves
limiting prices and wages at the production level (FAO 2013). Profitability is of great
consideration in any business and is affected by several factors. Waswa, et al.,
(2012) have the view that input costs influence the net income of the sugarcane farmers.
This is because the more input costs are put in the farming activity correctly, the more the
income is attained by the farmers.

24
Under sugarcane contract farming, factories have the obligation to supply on credit
farm inputs and agriculture-services such as land preparation, seed cane and
fertilizer, harvesting and transport. Agricultural inputs and services take about 60%
of the cane price (KESREF, 2009). The inputs and services are charged interest of
12% per annum deducted from sugarcane proceeds. In commercial production,
costs of inputs have a great bearing on adoption of farming practices and
recommendations by Olwande, Sikei & Mathenge (2009) in their study revealed that
fertilizer use was higher in major cash crops such as sugarcane, tea and coffee due to
organized input credit schemes which allow farmers to acquire inputs on credit and repay
through deductions made on deliveries of the produce.
Declining profitability in cotton farming in Malawi led to decline in cotton
production (Kumwenda & Madola,2005). Effective profitability results are obtained
when management creates conditions workers perceive as beneficial to them and
productivity gains are shared with workers (Fein, 1974). The economic performance of
contracted cane farmers is affected by several transaction costs incurred during the
exchange process of farming to milling. Taylor (1917) in his scientific management
theory put forward the idea that high wages provided motivation for efforts in production.
Masuku (2011), in his study on sugar-cane profitability in Swaziland reported that
farmers profitability was significantly affected by the yield per hectare, farmers‟
experience and the distance between the mill and the farm (transport cost). The
study revealed that farmers closer to the mill made more profit compared to those further
away and those farmers with more land under sugarcane production had gross profit
increased.
Extension staffs employed in contract farming ventures are usually the key link and the
direct interface between the sponsor's management and farmers. They require a number
of key skills that include: A good comprehension of the crop(s) or animals under
contract, a sensitive and empathetic understanding of the social customs, language and
farming practices of the communities they work with, an ability to communicate
effectively with farmers, organize and administer cropping schedules and buy proceeds
honestly and impartially. They must also possess an understanding of agronomy, farm

25
management techniques and the potential capabilities of the farmers with whom they
work. Extension staff must first obtain the credibility and trust of the farmers they advise
in order to successfully implement the policies of the sponsor. In 1999, the Kenya Tea
Development Authority experienced serious unrest amongst its growers, reportedly due
to the Authority‟s inefficient extension services (FAO, 2010). Therefore the extension
officer must have expert power to be able to pass professional knowledge to the farmers.
Nuthall & Padilla (2009) in their study found out that extension education was an
effective way of improving technical efficiency in the production of sugar-cane in
Philippines. They recommended targeting of farmers with long farming experience and
young farmers who lacked farming experience. Training of farmers can take place
through routine farm inspection visits by extension staff, formal and regular meetings
with farmer groups that concentrate on the relevant activity at the time, e.g. seed sowing,
transplanting, fertilizing, pest and disease control or harvesting (Swanson & Claar, 1984).
In the other potential areas where the development of a sugar industry based on irrigation
of the crop proves feasible, it is advisable that the new investment own a sizable nucleus
farm to control production targets and balance dependence on Out growers as
suppliers of raw material. However, the land lease agreement with potential investors
should include terms specifying the percent of cane to be delivered by Out growers
and the technical support to be provided. Corporate social responsibilities to support
social infrastructure in local communities should be agreed to with the local community
and provided regularly. Farmers should be assisted in all matters related to production
and operation including assisting farmers to get required loans to carry out field
operations and purchase inputs and negotiate cane pricing as well as cane
harvesting and transportation contracts with millers. Effort to be considered to ensure
timely payment to farmers on delivered cane.
Also communities need to be encouraged to engage in reforestation, water conservation
and diversification. These initiatives can be driven by the companies, but must be
implemented by the communities to enhance ownership and sustainability. The industries
organizations have the technology and resources to support environmental initiatives
through capacity building and awareness raising campaigns. Some companies have

26
developed interactive and accessible environmental programs that explain the industry
and stakeholder roles in protecting the environment, whilst at the same time explaining
the operations of the sugar industry. Outreach programs using schools, colleges and youth
groups are potential ways of increasing the impact of initiatives and raising the profile of
the company as responsible citizens and improving community relations,(IFC 2011).
Many companies support education programs either through supplementary support to
government facilities in or around the company or establish and run estate schools, or
provide scholarships or school fee provision for employees families, or provide education
support to alternative institutions such as tertiary education establishments to raise
standards of education and to improve the skills of the future workforce. This is very
much dependent on the educational facilities and structures in place at national and local
levels. In Brazil, some sugar companies, particularly in the remote or newly developed
areas, will find it necessary to support the state education structures through additional
facilities and teaching aids to ensure that the quality and standards of education are
sufficient, (IFC 2011).
2.7 Theoretical Framework
The study was based on Maslow‟s theory of needs. The theory recognizes basic human
need that should be met first which forms the basis of livelihood. These needs
include food, housing and shelter. The study finds this theory appropriate as it would
enable the sugarcane farmers visualize the extent to which sugarcane farming has
influenced their living standards. The theory explains that human can only seek higher
needs after the basic needs have been met.
2.8 Conceptual Framework
In this study, the conceptual framework was guided by the research objectives. The
objectives used were: to establish how the income from cane supplied to sugar factories
influence improvement of livelihood of the cane farmers‟ second was to examine how the
Sugar factories influence on education improves the cane farmers‟ livelihood, third was
to assess how the Sugar factories influence the improvement of food security as a

27
livelihood enhancement of sugarcane farmersand to determine how input by sugar
factories influence improvement of livelihood of cane farmers.
Fig. 2.1 Conceptual Frameworks
Independent variables Intervening Variables
\
Income from cane supplied
Returns from cane
Duration of payment
Importance of cane income
Source of family income
Education & livelihood
School attendance
School enrolment
Infrastructure in schools
Fee payment
Assets acquisition
Distance from mills
Size of farm
Food security & livelihood
Farm size under cane
Overall farm size
Miller’s contribution to food
Source of food of family
Social
political
environment
Improvement of cane
farmers Livelihood
Poverty reduction
Access to education
Household expenditure
Health facility support

28
Fig. 2.1 above provides the conceptual framework with the influence of sugar factories in
improving the livelihood ofsugarcanefarmers. The independent variables includes
incomefrom cane supplied, education and livelihood improvement of sugarcane farmers,
food security and income improvement of farmers and input of sugar factories and
livelihood improvement of cane farmers. The dependent variable is the improvement of
cane farmers‟livelihood.Intervening variables are social political environment.
2.9 Summary of Literature Review.
The literature captured in this section includes concept of improvement of farmers‟
livelihood from various authors, income from cane delivered and improvement of
farmers‟livelihood,practices of sugar factories on education and improvement of cane
farmers‟ livelihood Sugar factories and improvement of food security as a livelihood
enhancement of sugarcane farmers and input of sugar factories livelihood improvement
of sugarcane farmers. This section also explains why the study was based on
Maslow‟s hierarchy of needs and diagrammatic representation of conceptual
framework that shows how independent variable interplays with the dependent
variable with the intervention of intervening variable.
Input of sugar
factoriesInfrastructure
improvement.
Extension services
Agricultural inputs
Environmental initiative

29
CHAPTER THREE
RESEARCH METHODOLOGY
3.1 Introduction
This chapter covered the methodology of study that included the research design, the area
of study, the target population, the sampling procedure, the sampling techniques, the
research instruments, validity and reliability of the research instruments, and the
procedure of data analysis.
3.2 Research Design
According to Kothari (2004), a research design is the arrangement of conditions for
collection and analysis of data in a manner that aims to combine relevance to the research
purpose with economy in procedure. Descriptive research studies are those studies which
are concerned with describing the characteristics of a particular individual, or of a group.
It is a method of collecting information by interviewing or administering
questionnaires to samples of individuals.
Descriptive survey design was used in this study. This design not only offered
descriptions and explanations, but it also identified and predicted relationships between
variables of the study (Mugenda and Mugenda, 1996). Descriptive survey designenabled
the researcher to adopt both qualitative and quantitative approaches to data collection.
By extension, through descriptive survey research design, the researcher was in a position
to analyze data using both qualitative and quantitative techniques.
3.3 Target Population

30
According to the Sub county office register Ministry of Agriculture, the Sub County has
seven locations recognized by the sugar factories which Include Mihuu, Ndivisi, Maraka,
Misikhu, Sitikho, Matulo and Bokoli. It had 9550 sugarcane farmers by the year 2013.
This, with 10 Agricultural Extension Officers, constituted the target
population.According to Brenda, (2009) the target population for a survey is the entire set
of units for which the survey data are to be used to make inferences. Thus, the target
population defines those units for which the findings of the survey are meant to
generalize.
3.4 Sample size and Sampling Procedure
According to Intell, (2012) a sample is a part of an entire population that possesses
attitudes, opinions, habits, or characteristics that you wish to study. The appropriate
sample size is influenced by your purpose in conducting the research.
3.4.1 Sample size
According to Wambiri and Muthee, (2010) a sample is a small group of persons or items
selected from the population that will be subjected to the study, and is usually a
representation of the entire population. For this study, the researcher having a population
of 9550 people used a sample of 370 respondents. The researcher used Krejcie, and
Morgan, (1970) table to determine the sample size. Since the population of 9550 is nearer
to 10,000 than 15,000 from the table, the sample sizewas370 respondents as shown in
appendix 1.
3.4.2 Sampling Procedure
Sampling, according to Orotho and Kombo, (2002), is the process of selecting the
required individuals for the study whereby a number of individuals are selected from a
population such that the selected group has elements representative of the characteristics
found in the entire population. Sampling is useful in research because one learns some
information about a group by studying a few of its members thus saving time and money.
The researcher used stratified sampling on the seven locations to select the farmers,
which included, Mihuu, Ndivisi, Maraka, Misikhu, Matulo and Bokoli. Proportionate

31
method was used where; the researcher selected samples from each location depending
on the number of farmers found within the location. In relation to this, samples were
selected based on the formula;
Sample size per location = Total No. of farmers per location × sample size
Total NO. Of farmers in sub county
The results of the sample size selected is as shown in Table 3.1
Table 3.1 Table for Selecting Sample Size
Location/Ward Target Population Sample Size
Mihuu 1469 56
Ndivisi 1540 60
Maraka 1370 54
Misikhu 1222 47
Sitikho 1364 53
Matulo1362 53
Bokoli1223 47
________________________________________________________________________
Total 9550 370
3.5 Data Collection Instruments
According to Design, (2005) data collection instruments are the tools that assist the
researcher in the process of gathering and measuring information on variables of interest,
in an established systematic fashion that enables one to answer stated research questions,
test hypotheses, and evaluate outcomes. For this study, the researcher used

32
questionnaires. A questionnaire is a collection of items to which the respondent is
expected to react, usually in writing (Kothari, 2004). The questionnaire being the main
research tool for this study was conducive based on the nature of the study time and
objectives of the study. The items on the questionnaire was developed on the basis of
the objectives of the study.
The questionnaires were both open-ended and closed-ended, and wasdivided into five
Sections whereby section A contained questions on general information of the
respondent, Section B contained questions on income of the farmers, Section C contained
questions on factories practices on education and improvement of livelihood, Section D
had questionson food security and improvement of livelihood; lastly, Section E had
questions on the assets acquisition and improvement of farmers, livelihood of farmers.
3.5.1 Pilot study
The research instruments were piloted in order to standardize them before the actual
study.Mugenda and Mugenda (1999) asserts that pilot testing is a very important step in
any study. Pilot testing is a trial run of procedures and instruments that one plans to use.
According to Mugenda and Mugenda (2003), a pre-test sample of a tenth of the
total sample with homogeneous characteristics is appropriate for a pilot study. For
the study, 37 respondents which is equivalent to 10% of the sample size were given
questionnaires to fill during pilot testing.
Respondents selected for pilot testing were not included in the sample during the
actual data collection phase. The researcher made formal arrangements with relevant
administrative division authorities on the most appropriate date and time of conducting
the pilot testing. The information gathered during pilot testing was used to improve
the instruments.
3.5.2 Validity of the instruments
According to Best and Kahn (2003), an instrument is valid when it measures what it
claims to measure. Kothari, (2004) has it that validity can also be thought of as utility. In
other words, validity is the extent to which differences found with a measuring
instrument reflect true differences among those being tested. For this study, the

33
researcher used content validity. The validity of the instruments was determined by the
researcher‟s supervisor. Also Peer review of instruments and use of expert judgment was
used to enhance content validity. .
3.5.3 Reliability of the instruments
Grinnell (1993) has it that reliability measures the degree of accuracy in the measurement
that an instrument provides. According to Donald, (2006), Mugenda and Mugenda,
(2003), research instruments are expected to yield the same results with repeated trials
under similar conditions. For them, the instrument returns the same measurements when
it is used at different times.
Therefore, in order to determine the consistency of the measuring instrument to return the
same measurement when used at different times, the researcher used Test-Retest method
to ascertain the reliability of the instrument. This happened during the pilot study, before
the actual research was done. Kombo and Tromp (2009) add that reliability is a measure
of how consistent the results from a given test are.
3.6 Data Collection Procedure
Madhu, (2005) has it that data collection procedure is the plan for the activities that are
involved in a given study. For this study, the researcher was to follow the necessary
procedure in obtaining the relevant documents for the study.
The researcher received the permit from the National Council of Science and Technology
(NCST) and an introductory letter from the University of Nairobi. On acquisition of the
permit, the researcher proceeded to the study area for appointments with farmers and
AEOs for data collection which was followed accordingly. There was a covering letter
attached to the questionnaire to request the respondents to participate in the study. The
AEOs were informed beforehand about the purpose of the study. A total of 370 farmers
and AEOs participated in the study and were given the questionnaires. The farmers filled
the questionnaires and the researcher collected the completed questionnaires after the
distribution and also on the same day for those who had filled it.
3.7 Data Analysis Techniques

34
This study employed descriptive statistical methods in order to analyze the data that was
collected. There was cross checking of the questionnaires to ensure that the questions
were answered well. Coding of the answered questions was done, and organization of the
whole information done before the analysis of the data. Qualitative data was first divided
into themes and sub-themes before being analyzed. In the analysis of the collected data,
Statistical Package for Social Sciences (SPSS) was used. Frequency and percentages was
used in the analysis and presented in a tabular form to enhance interpretation of the data.
3.8 Ethical Considerations
Information obtained from other sources or from authors to support the relevance of this
research was acknowledged in the form of references while plagiarism was minimized as
much as possible. The researcherassured the respondents of the confidentiality of the
information they provided, including their own personal information. The respondents
wereinformed of the purpose of the study, that is, for academic purposes. Thisenabled
them to provide the required information without any suspicions.
3.9 Operational definition of variables
This is presented in a table (Matrix) form that tries to link the specific objectives of the
study with their indicators, data collection instruments and means of analysis. The
columns shows the objectives under investigation, source of data to satisfy the given
objective, type of information that was sought, data collection instrument, the type of
measuring scale that was used and the data analysis techniques used.

35
Table 3.2 Operationalization of variables
Objectives Indicator Data
collection
instrument
s
Measuri
ng scale
Analysis
To establish how income
from cane supplied to sugar
factoriesimprove livelihood
of the cane farmers‟
livelihood.
Returns from cane
Use of cane as
collateral
Importance of cane
income
Source of family
income
Questionna
ire
Interview
schedules
Ordinal Frequen
cy
tables
Percenta
ges
To examine how Sugar
factories practices on
education improves cane
farmers‟ livelihood in
Bungoma East Sub County
School attendance
School enrolment
Infrastructure in
schools
Fee payment
Questionna
ire
Interview
schedules
Ordinal Frequen
cy
tables
Percenta
ges
To assess how Sugar
factories practices influence
improvement of food as a
livelihood enhancement of
sugarcane farmers
Farm size under cane
Overall farm size
Millers‟ contribution
to food.
Source of family food
Questionna
ire
Interview
schedules
Ordinal Frequen
cy
tables
Percenta
ges

36
To determine how input by
sugar factories influence
improvement of cane
farmers‟ livelihood
Infrastructure
improvement.
Health improvement
Water provision
Fertilizer costs
Questionna
ire
Interview
schedules
Ordinal Frequen
cy
tables
Percenta
ges
CHAPTER FOUR
DATA ANALYSIS, PRESENTATION, INTERPRETATION AND
DISCUSSION
4.1 Introduction
This chapter presents findings of the study which have been discussed under thematic sub
sections in line with the study objectives. The thematic areas include: Questionnaire
return rate; Demographic characteristics of the respondents‟, Income from cane delivered
and improvement of farmers livelihood, influence of Sugar factories on education
improvement of cane farmers‟ livelihood, Sugar factoriesinfluence on improvement of
food security and influence of sugar factoriesinput on improvement of livelihood of
sugarcane farmers.
4.2 Questionnaire Return Rate
This study targeted sugarcane farmers and area agricultural extension officers within
Bungoma East Sub-county. Questionnaires were distributed to 370 sugarcane farmers and
10 extension workers scheduled for interviews. Of these, 262 farmers responded well
while 7 extension officers were available to participate in the interviews. Table 4.1 shows
the distribution and return rates of respondents for this study.

37
Table 4.1 Return rate
Target Response Percentage
Sugarcane farmers 360 262 72.77
Extension officers 10 7 70.0
________________________________________________________________________
Total 370 269 72.7
Out of 370 questionnaires and interview schedules administered to the sugarcane farmers
and AEOs, 269 were responded to representing a return rate of 72.7% (269/370x100). A
response rate of 70% is sufficient for one to make generalizations, according to Kothari
and Nachmias (2007). Therefore this research attained a response rate of 72.7% which
was adequate for generalization of research finding.
4.3 Demographic Characteristics of the Respondents
This section presents the demographic characteristics of the respondent with the aim of
establishing the general background of the respondents that participated in the study. The
researcher sought to establish the distribution of respondents‟ by age, sex; and level of
education to enable the researcher demonstrate the diversity of the respondents involved
in the survey. Respondents‟ were therefore asked to provide the necessary demographic
data of which the results were presented and discussed in the following subsequent sub-
themes.
4.3.1 Distribution of Respondents by gender
An item was included in the questionnaire which sought information on the gender of the
farmers responding to the survey. The researcher was interested to establish how power
dynamics and cultural settings influence women participation in farms and their
accessibility to resources such as land.
Table 4.2; Gender
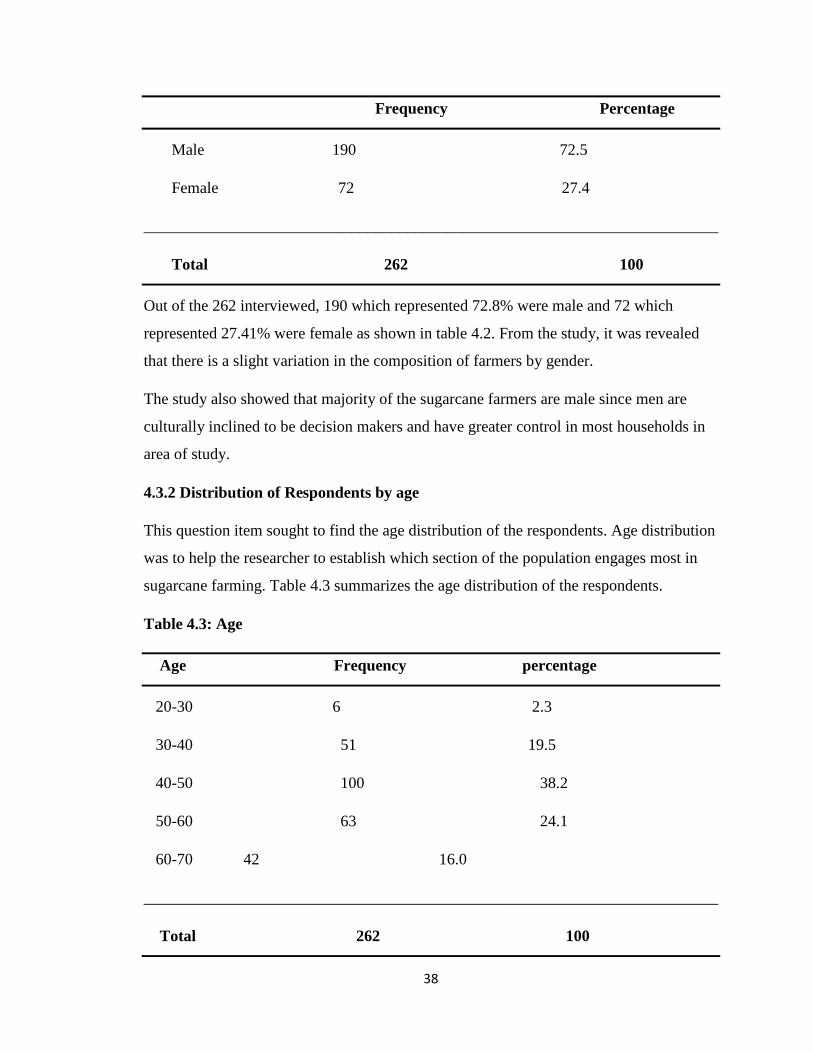
38
Frequency Percentage
Male 190 72.5
Female 72 27.4
________________________________________________________________________
Total 262 100
Out of the 262 interviewed, 190 which represented 72.8% were male and 72 which
represented 27.41% were female as shown in table 4.2. From the study, it was revealed
that there is a slight variation in the composition of farmers by gender.
The study also showed that majority of the sugarcane farmers are male since men are
culturally inclined to be decision makers and have greater control in most households in
area of study.
4.3.2 Distribution of Respondents by age
This question item sought to find the age distribution of the respondents. Age distribution
was to help the researcher to establish which section of the population engages most in
sugarcane farming. Table 4.3 summarizes the age distribution of the respondents.
Table 4.3: Age
Age Frequency percentage
20-30 6 2.3
30-40 51 19.5
40-50 100 38.2
50-60 63 24.1
60-70 42 16.0
________________________________________________________________________
Total 262 100

39
The table shows between ages 20-30, indicated 2.3%, ages 30-40 indicated 19.5%, ages
40-50 indicated 38.2%, ages 50-60 indicated 24.1% and ages 60-70 indicated 16.0%. The
age distribution across the categories is varied though it was shown that most of the
sugarcane farmers are advanced in age. The findings reveal that almost half of the
respondents are more than 40 years of age at 78.3%. This is because sugarcane growing
requires that one has to be officially registered and has the necessary particulars but the
younger farmers who do not have land title deeds or have not been assigned by their
parents‟ portions to do farming were not keen on engaging in sugarcane production.
4.3.3 Respondents by education level
This item was included to gauge the level of education the farmers have attained.
Table 4.4 Education level
Level Frequency percentage
Primary 145 56.0
Secondary 89 33.3
College 28 10.7
________________________________________________________________________
Total 262 100
The table shows 145 representing 56.0% of the farmers have attained primary school
education, 89 representing 33.3% secondary education and 28 representing 10.7% have
attained college level education. The study revealed that majority of the farmers has
attained elementary or basic education. This is sufficient for farming since they can read
and write, do simple farming techniques among other tasks.
4.4 Income from cane supplied to sugar factories and improvement of cane farmers’
livelihood

40
This section sought to present findings in an effort to establish the extent to which
income from cane supplied to sugar factories by farmers improves their livelihood in
Bungoma East sub County.The question items were geared towards eliciting responses
that would indicate how income from cane supplied to sugar factories improves of cane
farmers‟ livelihood.
4.4.1 Income earned by farmers’ from cane harvested
The study sought to find out the income farmers would get from cane farming in a
particular harvesting season. This was necessary in order to ascertain the influence of the
sugar factories in improving the livelihood of farmers.
In view of this, respondents were asked to indicate the income earned from the harvested
cane. Their responses were as tabulated in Table 4.5.
Table 4.5 Income earned by farmers’ from cane harvested
Amount Frequency Percentage
Less than 20,000 10 3.82
20,000-50,000 17 6.49
50,000-80,000 69 26.34
80,000-110,000 107 40.84
Above 110,000 59 22.52
________________________________________________________________________
Total 262 100
The findings show that 10 respondents representing 3.8% earn less than KSH.20, 000
after cane harvest. 17 respondents representing 6.5% would earn between KSHS. 20,000-
50,000 after harvest. 69 respondents representing 26.3% would earn between KSHS
50,000- 80,000 after harvest. 107 respondents representing 40.9% earned between
80,000- 110,000 and 59 respondents representing 22.5% earned above 110,000. From the
findings that farmers are able to get some income whenever their cane is harvested by the

41
sugar factories. Once cane is delivered one is assured of income in the range of between
Kshs. 20,000 and above Kshs 110,000 depending on the acreage of the land under cane.
This agrees withOdenya et al. (2009) in a study in Nyando sugar belt which revealed that
cane farming is a major source of income to the farmers. In the study, 81.3% of the
Nyando farmers derived income from cane farming, 16% from cane farming and business
and only2.7% from employment and other businesses. Ida Lindell&Gustaf
MagnussonKroon (2010), reveals that the farmers who mainly grew sugarcane generally
had higher income (mean: 93000 KShs/ha/year) than the farmers with Agro forestry
systems (mean: 63 000 KSh/ha/year). However, it was also observed that the income for
the sugarcane farmers was more unevenly distributed throughout the year compared with
the Agro forestry farmers.
4.4.3Duration of cane payment after delivery to millers
The Sugar Act (2001) stipulates that sugarcane farmers should be paid within 30days
(one month) after sugarcane delivery to the factory. To determine the period payment
took after cane was delivered an item was included in the questionnaire which read; how
long did the sugarcane proceeds take to be paid after harvesting and delivery to the
millers?
Table 4.7 Duration of cane proceeds payment after harvesting.
Period of cane proceeds payment Frequency percentage
Within 2 Weeks 102 38.93
Within 30 Days 106 40.46
Within 2 Months 24 9.16
After 2 Months 20 7.63
None 10 3.8
_______________________________________________________________________
Total 262 100

42
Researchfindings in Table 4.7 revealed that 102 of respondents representing 38.93%
stated that they were paid after 2 weeks, and 106 of the respondents representing 40.46%
were paid within 30days as stipulated by the Sugar Act, 24 respondents representing
9.2% paid within 2 months, 20 respondents representing 7.6% were paid after 2 months.
The findings shows that prompt payment within the stipulated time frame in the Act by
the respective millers encouraged more the cane farmers to grow cane since they were
paid on time hence improving their livelihood.
This agrees with the KACC Report (2010) that West and Butali sugar factories were the
most efficient in paying the farmers, they paid them a week after supplying cane. It also
agrees with the KSB (2010), that in Western Kenya and Nyanza sugar belt, farm
households and rural business depend on the injection of funds derived from the
sugar industry
4.4.5 Rating of the importance of sugarcane income.
The study sought to find out whether the income received by respondents from the sale of
cane would enable them accomplish many of the family obligations like payment of
school fees, construction of better shelter, meeting medical expenses and have some fun
with their families. The question item read; Indicate below how you spend income from
sugarcane farming, indicating the most important priority as no. 5 and the least as no.1.
Table 4.9 summarizes the responses from the respondents.
Table 4.9 importance of sugarcane income
Income expenditure Frequency Percentage
Paying fees 84 32.06
Invest in business 47 17.94
Buy family land 48 18.32
Build family home 65 24.81
Others 18 6.87
________________________________________________________________________

43
Total 262 100
The findings are: 84 respondents representing 32.0% would pay fees,47 respondents
representing 17.9% would invest in businesses, 48 respondents representing 18.3% would
buy family land, 65 respondents representing 24.8% would build homes and18
respondents representing others were 6.9%The responses provided indicate that income
received from engaging in sugarcane farming was important in accomplishing many tasks
in the family. 32.06% of the respondents stated that paying school fees using sugarcane
income was most important priority expenditure. Other would buy land, build homes and
invest in businesses. Therefore this income enabled the households to uplift their living
standards. This agrees with Sorre (2005) that sugarcane income enabled farmers raise
sugarcane on both their own farms, leased plots and also enabled them to invest in other
businesses. Oniango (1987), had it that introduction of sugarcane led to buying of land
from non-cane farming families by cane farming families in order to increase their
income
4.4.6 Main source of the income of the family
The study sought to establish the main source of income of the sugarcane farmers in their
respective families in order to establish how income from cane supplied to sugar factories
influences the improvement of farmers‟ livelihood. Respondents were asked to give the
main source of income of the family. The findings are presented in the table 4.10.
4.10 Main source of the income of the family.
Source of income Frequency Percentage
Sugarcane farming 96 36.6
Employment 70 26.7
Business 22 8.4
Food crops 61 23.3
Other 13 4.9

44
________________________________________________________________________
Total 262 100
From the findings in the table 4.10 sugarcane farming played a bigger role to the income
of most households. 96 respondents representing 36.64% saidSugarcane farmingwas
source of income of the family income, 70 respondents representing 26.72%
hademployment, 22 respondents representing 8.4% hadbusiness, 61 respondents
representing 23.3% had food crops and 13 respondents representing 4.96% had others.
This is in agreement with KSI (2010) that the sugar industry supports over 6 million
Kenyans and is a major source of income for over 200,000 small-scale farmers who
account for85% of cane supply to the six companies.
4.4.7 Pricing formula of the cane supplied to the sugar factories.
In order to further appreciate the influence of income from cane supplied to sugar
factories and how it improves the livelihood of cane farmers‟ livelihood it was prudent
for the researcher to ascertain the pricing formula of the cane supplied to sugar factories.
Knowing about it is important to the farmer to enable him/her keep track of the expected
income of the cane supplied.
To succeed in this whole course, the researcher inquired from respondents with the
question; do you know much about the pricing formula? Respondents made several
sentiments as depicted in table 4.11.
Table 4.11 pricing formula of the cane supplied to the sugar factories.
Frequency Percentage
Yes 170 64.89
No 80 30.53
Other 12 4.58
________________________________________________________________________
Total 262 100

45
From the findings majority of the 170 respondents representing 64.89% indicated they
knew of the pricing formula while 80 respondents representing 30.53% were not aware of
the pricing formula. 4.58% could not ascertain of it.Pricing can determine whether
farmers will grow cane and it is a motivating factor in the sugar business. This is in
agreement withAnwar &Naeem, (2008) that in economic analysis of the farm supply
response study, price was a critical economic factor that determined farmers‟ production
decision (Anwar &Naeem, 2008). In Kenya, the sugarcane pricing formula is used to
determine the sugarcane price per ton. The pricing formula is recognized in the Sugar Act
2001.Yanagida&Bhartti (1990), revealed that official procurement price for sugarcane at
mill gate and relative returns to alternative uses of sugarcane were principal factors
affecting sugarcane supply.
4.5 Influence of Sugar factories on education improvement of cane farmers’
livelihood.
This section sought to present findings in an effort to establish the extent to which the
Sugar factories‟ practices had influenced education of sugarcane farmers‟ children, in
Bungoma East sub County under the following sub themes; School attendance,
affordability of education, barriers to school enrolment, challenges facing school drop
outsand determinants of low, high school enrolments, fees payment and infrastructure
development in schools.
4.5.1 School Attendance
The study sought to find out whether respondents‟ children were at risk of dropping out
from school due to lack of school fees or not. This was necessary in order to establish the
influence of the sugar factories on the improvement of livelihood of farmers‟ children in
as far as education is concerned. In view of this, respondents were asked to indicate if
their children were at risk of dropping out of school due to lack of school or not. Their
responses are presented in Table 4.12.
Table 4.12: Children at risk of dropping out of school due to lack of school fees
Response Frequency percentage

46
Yes 10740.8
No 15559.2
________________________________________________________________________
Total 262 100
Of respondents who participated in the study, majority of respondents 59.2% (155)
alluded to the fact that their children were not at risk of dropping out of school due to
lack of school fees 40.8% (107) of respondents alluded that their children were not at risk
of dropping out of school. This implies that the millers in paying farmers on time could
facilitate them to pay fees and therefore retain their children in school and factories could
review positively their terms of engagement. Only 40.8% of the respondents‟ were not
confident of retaining their children in school.This agrees with Ozturk(2001), that
education raises people‟s productivity and creativity and promotes entrepreneurship and
technological advances.
In order to further establish the influence of Sugar factories on the education of farmers‟
children, a cross tabulation of child/ children at risk of dropping out of school due to lack
of fees and rating of the level of satisfaction on what is being offered by the sugar
factories was done. The results are as indicated in Table 4.13.
Table 4.13: Child/ Children at risk of dropping out of school due to lack of fees and
rating of the level of satisfaction on what is being offered by the sugar factories.
Response Level of satisfaction on what is offered by the sugar
Factories
Very satisfied Satisfied less satisfied Total
Yes Count8 4356107
Percentage3.016.421.440.8
No Count 188453155

47
Percentage6.932.120.159.2
________________________________________________________________________
Total 26 127 109 262
Of the respondents who participated in the study, majority 6.9% indicated that they were
very much satisfied with what was being offered by the sugar factories, 32.1% of the
respondents were satisfied, 20.1% of the respondents were less satisfied. The table 4.13
above shows that majority of the farmers 32.1% who are satisfied also had children not at
risk of dropping out of school. Findings of this study insinuate that most sugarcane
farmers 32.1% were satisfied with remuneration offered by the Sugar factories in terms of
remitting the cash and in reviewing the remuneration to be in tendon with the present
economic reality. As a result, majority of the sugarcane farmers were able to sustain their
children in school. This is agreement with Miemie(2014) that through farming activities
and wage employment it has enabled farmers to pay school fees on time for their children
which has seen an increase in school enrolment in the region hence reducing inequality
gap. In many developing and in some developed countries, a persistent problem of
unequal access to quality education exists. This disparity commonly appears in two
categories: based on gender and socioeconomic status.
4.5.2 Affordability of Education
This section presents the influence of Sugar factories practices on affordability of
education of sugarcane farmers‟ children. Itwas important to establish if the income
farmers get from cane farming was reasonable and could enable them send their children
to school. For this reason, respondents were asked to rate the cost of affordability of
education based on the average income earned from the cane farming. Findings were as
illustrated in Table 4.14.

48
Table 4.14: Rating on affordability of education
Rating Frequency Percentage
Very High 55 21
High 139 53.1
Average 34 13
Low 21 8
Very Low 13 4.9
________________________________________________________________________
Total 262 100
The findings show that 21% (55) of the respondents who participated in the study felt that
the cost of education was very high. 53.1% (139) held the opinion that the cost of
education was high. 13% (34) of the respondents asserted that the cost of education was
average while 8% (21) of the respondents indicated that the cost of education was low
whereas minority of the respondents 4.9 %( 13) had it that the cost of education was very
low. From the findings of the study, majority of the sugarcane farmers were burdened by
the cost of education since majority of them echoed that the cost of education was very
high but could be relieved when sugar companies made payments to the cane supplied.
These findings indicate that majority of the sugarcane farmers depended on income from
the cane supplied clear school fees of their children.
4.5.3Enrollment in schools in the region
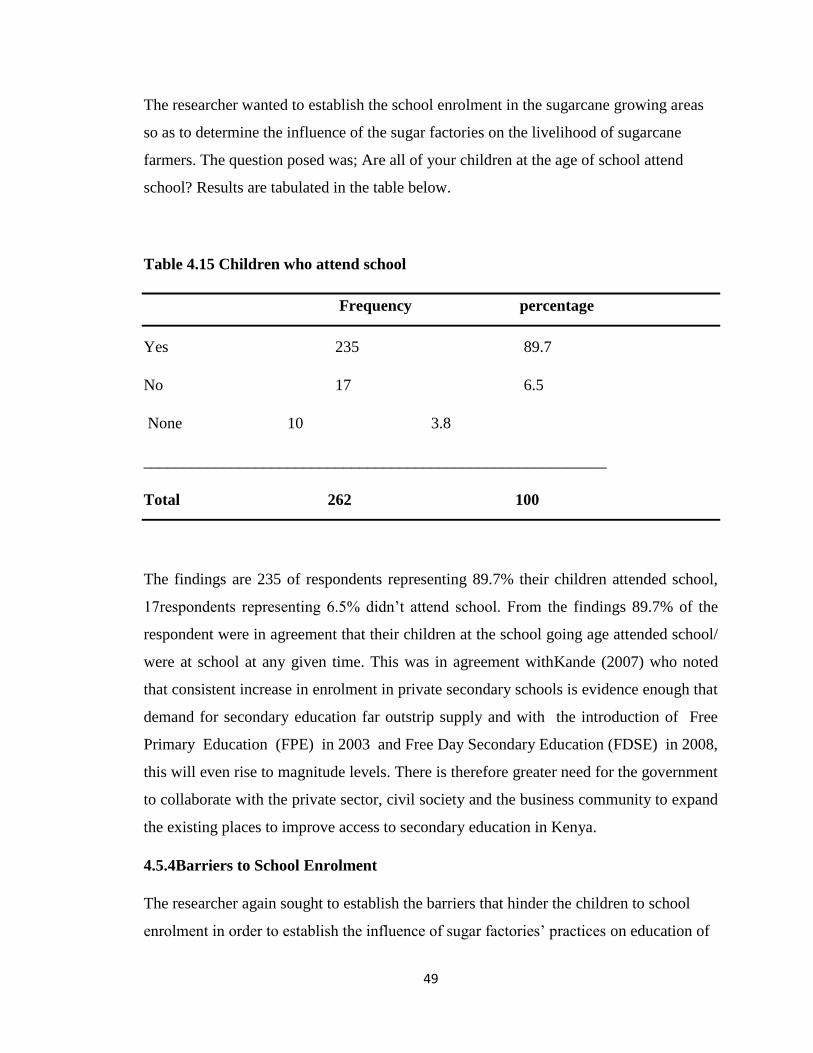
49
The researcher wanted to establish the school enrolment in the sugarcane growing areas
so as to determine the influence of the sugar factories on the livelihood of sugarcane
farmers. The question posed was; Are all of your children at the age of school attend
school? Results are tabulated in the table below.
Table 4.15 Children who attend school
Frequency percentage
Yes 235 89.7
No 17 6.5
None 10 3.8
__________________________________________________________
Total 262 100
The findings are 235 of respondents representing 89.7% their children attended school,
17respondents representing 6.5% didn‟t attend school. From the findings 89.7% of the
respondent were in agreement that their children at the school going age attended school/
were at school at any given time. This was in agreement withKande (2007) who noted
that consistent increase in enrolment in private secondary schools is evidence enough that
demand for secondary education far outstrip supply and with the introduction of Free
Primary Education (FPE) in 2003 and Free Day Secondary Education (FDSE) in 2008,
this will even rise to magnitude levels. There is therefore greater need for the government
to collaborate with the private sector, civil society and the business community to expand
the existing places to improve access to secondary education in Kenya.
4.5.4Barriers to School Enrolment
The researcher again sought to establish the barriers that hinder the children to school
enrolment in order to establish the influence of sugar factories‟ practices on education of

50
sugarcane farmers‟ children. Respondents were asked to state the barriers that hinder
children from accessing school. Findings were as presented in Table 4.16.
Table 4.16: Barriers to School Enrolment
Frequency Percentage
Accessibility 5 1.9
Lack of finance 42 16
Mentally handicapped 5 1.9
None 17 6.5
Poverty 172 65.6
Unemployment 7 2.7
Lack of role model 14 5.3
____________________________________________________________________
Total 262 100
Out of 262 respondents who took part in the study, examination of the Probe on the
barriers to school enrolment revealed that 65.6% of the respondents‟ were not able to
enroll their children to school due to poverty, 1.9% cited accessibility, 16% lack of
finance, 1.9% disability, 6.5% none, 2.7% unemployment and 5.3% lack of role model.
The highest number, 65.6% of the farmers‟ sighted poverty as a limiting factor to school
enrolment. Poverty constraints could be attributed to many factors which are varied like
ignorance (lack of access to information), cultural practices, rural to urban migration and
lack of infrastructure. From the report of CBS Poverty incidence is higher in the entire

51
County than the national average of 53% (CBS 2006).The issue of CRS come in where as
per the copy of Daily Nation 12th
(2011), in 2010, the Equity Group Foundation (of
Equity Bank) under its corporate responsibility programme partnered with the
MasterCard Foundation to launch a 9-year Shs.4 billion comprehensive secondary school
education fund to assist academically gifted students from poor backgrounds to pursue
secondary education. In 2011, the programme received support from UKaid, the Wings to
flyprogramme, which extended scholarships to 1,200 students who performed well in the
2010 K.C.P.E but who come from poor backgrounds. The Wings to Fly programme
hopes to reach 5,600 deserving children.
4.5.5 Role of sugar factories in improving infrastructure development in schools.
The study went further to investigate the involvement of Sugar factories in improving
infrastructure development in schools to establish their role in improving farmers‟
livelihood in Bungoma East Sub County. An item was included in the questionnaires
which sought information in ways through which the sugar factories improves
infrastructure development. The question posed was; do the sugar factories assist in any
way in improving infrastructure development in schools? The findings are presented in
the table below.
Table 4.17: Infrastructure improvement in schools
Response Frequency Percentage
Yes 186 71.0
No 45 17.2
Not aware 31 11.8
_______________________________________________________________________
Total 262 100
In the findings 186 respondents 71.0% agreed there was funding, 45 representing 17.2%
did not agree while 31 representing 11.8% purported to be not aware. The research
established that 71.0%who purported to the fact that schools had received support to set

52
up physical facilities in their respective schools from the sugar factories. The revelation
urges the need to engage public- private partnership in the development of education in
the region in line with Jha, S. and Chatterjee, S., (2005) who observed that appropriate
inputs from both the private and public sectors are enormous resources and opportunities
that can be put at the disposal of the education systems so as to expand access to and
quality of education. The companies had also corporate social responsibility policy that
focuses not only on education but also on health, infrastructure, environment, water
among others.
4.5.6 Facilities repaired/maintained by factories to Enhance Teaching/Learning in
the Schools
In a bid to establish the specific contribution of Sugar Companies‟ towards
development of education and support of schools for the last five years, an item was
included in the questionnaire which asked the respondent to list the facilities
provided/maintained by the companies‟. In response, Table 4.18 presents the results.
Table 4.18: Facilities repaired by the Companies
Facilities Frequency Percentage
Painting Classrooms 64 24.4
Repair of Classroom floors 31 11.8
Repair of Classroom roof 9 3.4
Painting of Administration block 63 24.0
Furniture repair 55 21.0
Kitchen 16 6.2
School Fence 24 9.2
________________________________________________________________________
Total 262 100
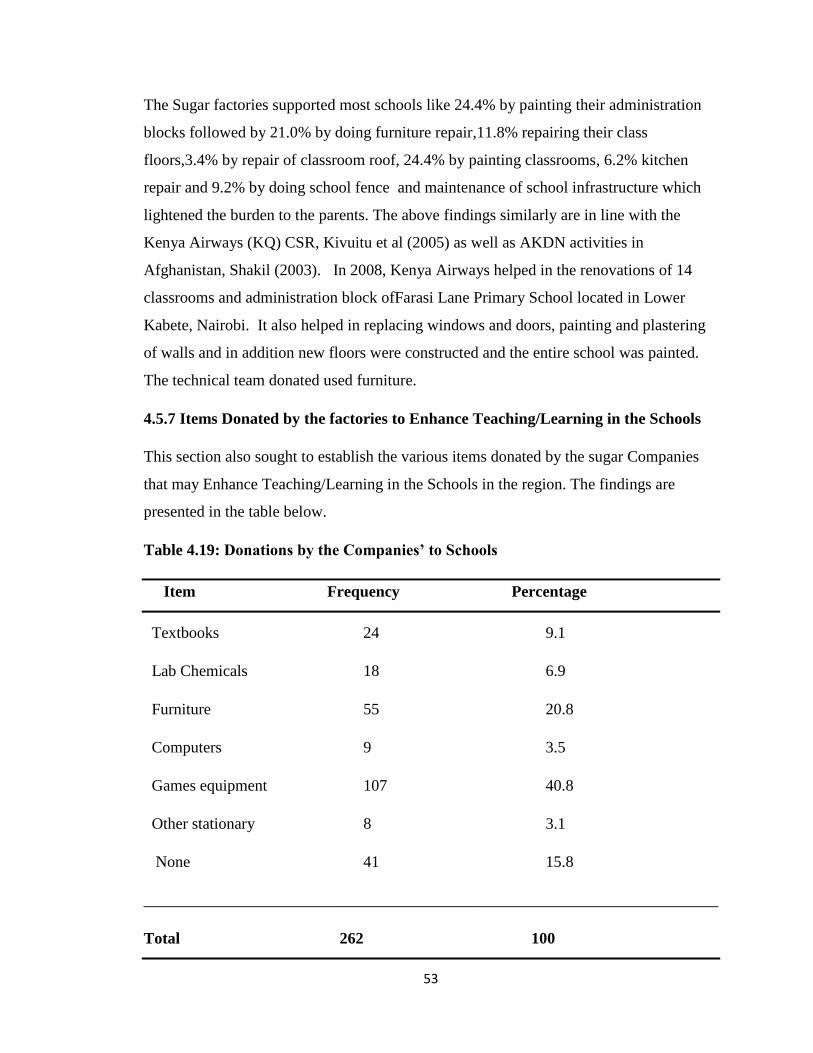
53
The Sugar factories supported most schools like 24.4% by painting their administration
blocks followed by 21.0% by doing furniture repair,11.8% repairing their class
floors,3.4% by repair of classroom roof, 24.4% by painting classrooms, 6.2% kitchen
repair and 9.2% by doing school fence and maintenance of school infrastructure which
lightened the burden to the parents. The above findings similarly are in line with the
Kenya Airways (KQ) CSR, Kivuitu et al (2005) as well as AKDN activities in
Afghanistan, Shakil (2003). In 2008, Kenya Airways helped in the renovations of 14
classrooms and administration block ofFarasi Lane Primary School located in Lower
Kabete, Nairobi. It also helped in replacing windows and doors, painting and plastering
of walls and in addition new floors were constructed and the entire school was painted.
The technical team donated used furniture.
4.5.7 Items Donated by the factories to Enhance Teaching/Learning in the Schools
This section also sought to establish the various items donated by the sugar Companies
that may Enhance Teaching/Learning in the Schools in the region. The findings are
presented in the table below.
Table 4.19: Donations by the Companies’ to Schools
Item Frequency Percentage
Textbooks 24 9.1
Lab Chemicals 18 6.9
Furniture 55 20.8
Computers 9 3.5
Games equipment 107 40.8
Other stationary 8 3.1
None 41 15.8
________________________________________________________________________
Total 262 100

54
In the Table 4.19 we get 24 respondents representing 9.1% having received textbooks
donations, 6.9% (18) received lab chemicals, 20.8% (55) received furniture, 3.5% (9)
received computers, 40.8% (107) received games equipment, 3.1% (8) received other
stationery and 15.8% (41) had none. This shows that majority of schools, 40.8% received
games equipment as donations from the companies, followed closely by 20.8% who
received furniture materials. This confirms the earlier finding that same schools had
received some contribution from the Companies. This is in line with Jha, S. & Chatterjee,
S., (2005) that with appropriate inputs from both the private and public sectors, enormous
resources and opportunities can be put at the disposal of the education system.
4.6 Sugar factories influence on improvement of food security as a livelihood
enhancement of sugarcane farmers.
The study sought to obtain general sugarcane farmers‟ views of the influence of the Sugar
factories influence on their food security since this could provide a basis for important
research conclusions and recommendations. The research findings were presented and
discussed under the following sub themes: Farm size under cane, overall farm size,
household food availability and crop diversification.
4.6.1 Respondents’ overall farm size
The study found it important to establish the overall farm size owned by the sugarcane
farmers with an aim to determine if the farm size could meet other activities that could
generate food together with cane farming. The findings are presented in the table below.
Table 4.20 overall farm size
Size Frequency Percentage
Less than 1 58 22.1
1-3 88 33.6
3-5 87 33.2
5 and above 29 11.1
_____________________________________________________________________

55
Total 262 100
The table 4.20 shows the farm sizes in acres owned by the sugarcane farmers, 22.1%
sugarcane farmers have less than 1 acre, 33.6% sugarcane farmers had between 1-3 acres
of land, 33.2% have 3-5 acres and 11.1% indicated to own more than five acres of
land.The study revealed that majority of people own small pieces of land. This may be
due to overpopulation among other factors that are overstretching land ownership. Most
farmers could lease land to plant cane size the farm size they owned couldn‟t meet the
farming activities of both cane and other food crop farming. This agrees withLangat et
al (2011), that among smallholder tea farms in Nandi South, Kenya, an increase in
the ratio of land allocated to tea to that allocated to maize was associated with greater
food diversity score. This was attributed to the income from tea realized throughout the
year, which ensured household access to quality food.
The study also sought to establish the size of land under sugarcane farming by the
respective respondents. Table 4.20 summarizes the responses from the respondents.
Table 4.21: Acres under sugarcane per individual farmer
Size Frequency Percentage
Less than 1 125 47.3
1-3 107 39.7
3-5 30 9.9
5 and above 12 3.1
________________________________________________________________________
Total 262 100
From the study 47.3% have less that 1 acre of land under sugarcane farming, 38.7% have
between 1-3 acres of land under sugarcane, 9.8% have between 3-5 acres and 3.1% of the
respondents have above 5 acres of their land put under sugarcane growing. It shows that
sugarcane production competes with food crops for available land. It agrees with Kirimi

56
et al (2013) has it that innovations that enhance households‟ access to land,
education, savings and employment can be instrumental in raising their ability to
produce food and access it from the market, ensuring food security.
The study also sought to establish the size of land under food crops per individual farmer
since under cane contract farming; one of the management‟s responsibilities is to address
farmers‟ food security. Table 4.22 summarizes the responses from the respondents.
Table 4.22 Acres under food crops per individual farmer.
Size of land Frequency Percentage
Less than 1 92 35.1
1-3 64 24.5
3-5 45 17.3
5 and above 41 15.6
Missing 20 7.5
________________________________________________________________________
Total 262 100
Table 4.22 shows that 24.5% of the respondents had acres of between 1 and 3 acres under
food crops, 35.1% hadless than 1, 17.3%, 3-5 and 15.6% have above 5. From the two
tables, more farmers have dedicated more of the available land to sugarcane production
compared to food. The research findings depict that more farmers have less than one acre
of their land under food crop production, and hence food from that area is not adequate to
feed their family. During the interview with the farmers, it came out clearly that some
had to source some food from the markets or relatives to satisfy the family requirements.
Also, Kennedy and Cogill (1987) showed that income from cash crops control by women
was associated with improved child nutritional status, suggesting that women were more
likely to spend more on food and health care. According to these authors, a 1% increase
in sugarcane income in South Nyanza District in Kenya resulted in an increase in energy
intake of 24 kilocalories per household per day. On average, sugarcane production

57
increased household income by 15% which increased household energy intake by
360 kilocalories per day, or approximately 33 kilocalories per day per person in the
household.
4.6.2 Sugar factory management advice to farmers’ to leave a third of total land
area for food crop production
This section sought to find out during land selection exercise for contract cane farming
whether staff from the sugar factories advised farmers‟ to leave out a third of their land
holding for food crop production. The question item therefore read; in what ways has the
sugar millers‟ management contributed towards achieving food security in your family?
Table 4.23 summarizes the responses from the respondents.
Table 4.23: Advice to leave a third of land for food crop production
Frequency Percentage
Yes 166 63.2
No 86 33.0
Missing 10 3.8
________________________________________________________________________
Total 262 100
The findings in table 4.23 indicate that 63.2% of the valid respondents agreed that they
were advised while 33.0% farmers declined that they were advised by the sugar factories‟
extension officers. From findings also revealed that the sugar factories management had
carried out her managerial role of communicating to the farmers the importance of food
security by advising the farmers to leave land for food production and education on food
security. According to the sugarcane farming, factories have also a responsibility of
educating farmers on food security during the extension meetings.However studies by
Mwadhili (1995) concluded that introduction of sugarcane contract farming negatively
affected food production. NSC sugarcane contract has a clause that recommends a third

58
of the farmers land to remain for food production while the rest be used for sugarcane
farming. This aptly agrees with A Global Food Crisis and Fair trade report (2009) that
has it that a focus on small farmers must be at the centre of any serious strategy to tackle
poverty and increase food security and productivity because: Such a focus would reduce
poverty because Small farms are home to two billion poor people and they play major
social roles, providing safety nets or subsistence living for the rural poor.
4.6.3 Effect of sugarcane management on food availability
The study also sought to understand effect of sugarcane management on food security.
The questions item that read; how has the management of sugarcane farming affected
food availability in your family over the years? Research findings are presented in table
4.24.
Table 4.24: Effect of sugarcane management on food availability
Effect of food security Frequency percentage
Positively (increased food) 84 32.1
Negatively (reduced food) 14354.7
No change at all 20 7.5
Not aware 155.7
________________________________________________________________________
Total 262 100
Research findings in table 4.24 reveal that contracted sugarcane production had negative
impact on food production in the family. From the table 143 respondents representing
54.7% indicated food availability had reduced while 54 respondents representing 32.1%
revealed that sugarcane production led to increased food availability, 20respondents
representing 7.5% said no change took place and 15 respondents representing 5.7% were
not aware. The negative impact findings agree with Mwadhili (1995) who reported that
introduction of sugarcane contract farming negatively affected food crop production.
Also it should be noted that more than 800 million people globally suffer from food

59
insecurity (FAO, 2007). Out of the 800 million, some two-thirds live in rural areas of
developing countries(Kohlmeyer, 2003).
4.6.4Ways through which sugar factories’ management has contributed towards
achieving food security to farmers.
This section looks at ways in which the sugar factories have contributed to achieving
food security of the farmers. The sections include; provision of diary animals, providing
maize/beans and educating farmers on food security.
4.6.4.1 Sugar factories addressing food security by education the farmers
The section looks at the role the sugar factories play in addressing food security by
educating the farmers on importance of diversification. According to the sugarcane
farming, millers have a responsibility of educating farmers on food security during the
extension meetings. Findings are tabulated in the table below.
Table 4.25: Addressing food security by education
Advice on food security Frequency Percentage
Less frequent 7629.1
Frequent 15358.2
Moderately 10 3.8
Most frequent 23 8.9
________________________________________________________________________
Total 262 100
Findings in table 4.25 above indicate that 58.2% of the respondents said that it‟s
frequently handled, 29.1% indicated it‟s less frequently handled, 3.8% indicated its
moderately addressed and 8.9% indicated its most frequently addressed. Education to
farmers should be frequently handled to ensure food availability to the cane farmers.A

60
study by Wawire et al., (2002); Odenya et al (2008) revealed that as household increases,
there was a general trend of land diminishing. The study in Nyando region revealed that
the average family size of 4 persons reside on 2 acres of land hence in -adequate land for
sugarcane and food production therefore an urge to sensitize farmers on need to diversify.
4.6.4.2 Addressing food insecurity on providing dairy animals
Another of the sugar factories obligations in handling food security is by providing dairy
animals and grains (beans &maize) by using sugarcane as collateral. Table 4.26 and 4.27
indicate respondents result on sugar factories‟ provision of those inputs.
Table 4.26: sugar factories addressing food insecurity on providing dairy animals
Provision of diary animals Frequency Percentage
Less frequent 104 39.6
Frequent 30 11.3
Most frequent 39 15.1
None 89 34.0
________________________________________________________________________
Total 262 100
Table 4.26 shows that 39.6% of the respondents were of the view that, factories‟
management less frequently provided dairy animals, 15.1% they most frequently
provided dairy animals, 11.3% indicated they frequently provided and 34.0% indicated
they were not aware of any provision of diary animals. This aptly agrees with Kirimi et al
(2013), who suggests that facilitating the expansion of market participation by
smallholder farmers can be critical in helping households transition out of food
poverty. This will entail enabling access to production inputs, which are both affordable
and suitable to small scale farmers, thus ensuring that farmers are not trapped in
low productivity–low return farming activities that lead to food insecurity.

61
4.27: Addressing food insecurity by providing maize/bean seeds
Providing seeds Frequency Percentage
Less frequently 128 49.1
Frequent 5 1.9
Most frequent 94 35.8
None 35 13.2
________________________________________________________________________
Total 262 100
Research findings in table 4.27 revealed that the factories less frequently 49.1% (128)
addressed food security by providing maize/beans to farmers, 35.8% (94) of the
respondents indicated that they most frequently addressed food security, 1.9% (5)
respondents indicated that they frequently addressed food insecurity and 13.2% (35) were
not aware of any provision. The findings reveals that sugar factories management had not
effectively implemented the policy on support to farmers by providing the grains (beans
& maize). The findings revealed that sugarcane farming negatively affected food
production and hence reduced food availability to the household. The low availability of
food had negative impact on sugarcane farming as revealed by the study.
4.6.5The source of food to the sugar cane farmers
This section looks at the source of the sugar cane farmers to ascertain the effect of
sugarcane farming on food security. An item that read, „Rank the source of food to your
family‟ was included in the questionnaire. Findings are presented in the table below.

62
Table 4.28: Source of food to the sugar cane farmers
Source of food Frequency Percentage
Fully production from farm 148 56.5
Buy from market 85 32.3
Borrow from relatives/neighbors 20 7.7
Sleep hungry 9 3.5
________________________________________________________________________
Total 262 100
The table 4.28 shows that majority of the respondents 56.5% (148) would get their food
from farm, 32.3% (32.3) indicated that they would buy from market, 7.7% (20) indicated
that they borrow from the relatives and neighbors while 3.5% (9) indicated they sleep
hungry. This implies that apart from growing cane, farmers can also chose to engage in
the farming of the main cereal crops such as maize, beans, sorghum and millet with
intention of not only for food but also earning cash from their sale, which agrees
withLangat et al (2011), who found out found that among smallholder tea farms in
Nandi South, Kenya, an increase in the ratio of land allocated to tea to that allocated to
maize was associated with greater food diversity score.
4.7influence of Sugar factories input in improvement of Livelihood of cane farmers
The last objective of the study was to determine how sugar factories input influence the
improvement of livelihood of cane farmers.Since input is important in improving the
livelihood of people the researcher felt that it was prudent to ascertain whether the sugar
factories input influences the improvement of farmers‟ lives. In order to achieve this, the
researcher looked at different aspects of input.
4.7.1 Infrastructure improvement

63
This section looks at the different infrastructural development as input of the sugar
factories, so as to determine the influence of input of factories in relation to cane farming
in the improvement of farmers‟ livelihood. The factories played the following roles as
their input is concerned;
4.7.1.1 Improving road network in the region.
The section looks at improvement of infrastructure and communication in the study area
to see any change of live livelihood pattern and how it affects households. Findings are
presented in the table below.
Table 4.29: Improvement of road network in the region
Improvement of road network Frequency Percentage
Yes 15559.1
No 7628.9
None 31 12
________________________________________________________________________
Total 262 100
Findings indicate that 59.1% of respondents were in agreement that roads had improved
28.9% had it that, they had not improved while 12.0% didn‟t indicate anything. This is a
positive change in the study area where the physical capital such as roads and means of
transportation are essential to diffuse knowledge and technology, which facilitate the
development of communities, also the construction and development of roads and
communication networks enhances the proper and fast marketing of farm produce and
also the movement of rural people for other activities, even off-farm activities.
4.7.1.2 Access to information in relation to the operations of the sugar factories
The researcher was then interested to find out how access to information has improved
with the presence of the sugar factories operations in the study area. An item that read
„Has the access to information improved in relation to the operations of the sugar

64
factories in your area?‟ was included in the questionnaire. Findings are presented in the
table below.
Table 4.30: Access to get information and news
Access to information Frequency Percentage
Fully access and satisfaction 175 66.7
Partial access 76 28.9
No access and satisfaction 11 4.4
_______________________________________________________________________
Total 262 100
From the findings 66.7% of head of households agreed that they have full access and
full satisfaction with reliability of information rather than before companies‟ operations.
28.9% had partial access to information while 4.4% had no access and were neither
satisfied. This agrees with Robert Chapman ad et al, (2005) that, Communication can
help in access to markets and market information, helps to improve choices for the sale of
goods on local markets according to enhanced information on prices and comparative
supply and demand for products. In the longer term new markets, techniques and
processes for production, processing and marketing of products; both farm and nonfarm
can be explored.
4.7.1.3 Source of water/provision
The section looks at the source of water of the sugar cane farmers in the area of study and
what the factories have done to improve the situation. Water is a natural asset that is
important in the improvement of the livelihood of farmers‟ lives. Scarcity of water
deteriorates the living conditions of people hindering their livelihood operations.
Findings are presented in the table below.

65
Table 4.31 source of water
Source Frequency Percentage
Rain 34 13.0
Spring 113 43.3
Borehole 105 40.3
Tap 11 5.4
________________________________________________________________________
Total 262 100
From the results 13% their main source was rain water, 43.3% was village spring, 40.3%
was borehole sunk while 5.4% was tap water. According to the accessibility and
consumption of water, most of farmers, reported that, they had full access to source of
water, water is available all day in their home or through tanker services. Access to water
plays a key role in development; it sustains human life, both through direct consumption
and use in agriculture (for food security) and industrial activities. While water availability
for drinking proposes is essential, it cannot be separated from wider water resource
management issues, also increased access to safe drinking water results in improved
health outcomes in the form of reduced cases of water-borne diseases.
4.7.1.4 Material that used of residence of the sugarcane farmers
In order to fully appreciate the conditions of residence occupied by sugarcane farmers,
the researcher examined the condition and materials that is used to make the residence. In
lieu of this, respondents were asked to give the materials that are used to make their
residence. Findings were as illustrated in Table 4.32

66
Table 4.32: Material that used of residence
Material Frequency Percentage
Mud +iron sheets 154 58.7
Cement 27 10.4
Mud + bricks 81 30.9
________________________________________________________________________
Total 262 100
The findings shows that58.7% (154) of households their houses built from mud
with iron sheets, 30.9 % (81) were built from mud and 10.4% (9 27) were built from
cement with public electricity and water facility. This meant that there were significant
changes that happened after farmers began engaging in cane farming, first at livelihood
patterns, households were change into permanent settlement, second, change in material
of building. This indicated that there was improvement in the economic status and
standard of living. This was supported by Ellis, (2000), where rural households have a
preference for cement brick houses and that housing styles are an indication of socio-
economic status.
4.7.2 Extension services as an input of sugar factories
Provision of Extension services by extension staff has a direct bearing on crop
productivity. This sub-section seeks to find out the influence of these services on
sugarcane production by farmers. Extension services are a communication tool under the
various managerial functions of an organization. Communication is an important
managerial function and is responsible 60% of the management problems as stated by
Drucker (2008).
4.7.2.1 Operations advised by factories extension staff

67
The section looks at the operations of cane management as advised by factories extension
staff as an input in the area of study and what the factories have done to improve the
situation so as to enhance productivity in order to improve on the livelihood of farmers.
Table below shows the findings;
Table 4.33: Operations advised by extension staff
Type of service Frequency percentage
Planting of cane 98 37.4
Fertilizer application 80 30.5
Weeding of cane 54 20.6
Trash lining 30 11.4
_______________________________________________________________________
Total 262 100
Research findings in table 4.33 revealed that the respondents received advice on the
following activities; 20.6 % on weeding of sugarcane, 37.4% on planting of sugarcane,
30.5% on fertilizer application and 11.4% on trash lining.
The implementation of these activities i.e. proper planting, fertilizer application, timely
weeding and trash lining determine yield in sugarcane, therefore they are key in
sugarcane production.Therefore the extension officer must have expert power to be able
to pass professional knowledge to the farmers. Nuthall & Padilla (2009) in their study
found out that extension education was an effective way of improving technical
efficiency in the production of sugar-cane in Philippines. They recommended targeting of
farmers with long farming experience and young farmers who lacked farming experience.
Training of farmers can take place through routine farm inspection visits by extension
staff, formal and regular meetings with farmer groups that concentrate on the relevant
activity at the time, e.g. seed sowing, transplanting, fertilizing, pest and disease control or
harvesting (Swanson & Claar, 1984).

68
4.7.2.2 Appropriate extension method for improving sugarcane productivity
The section looks at the different extension methods that farmers feel are appropriate for
improving sugarcane productivity.
Table 4.34 Appropriate Extension method
Frequency percentage
Farm visits by employees 114 43.5
Extension meetings 80 30.6
Visit contact farmers 28 10.5
Classroom training 25 9.7
None 15 5.7
________________________________________________________________________
Total 262 100
Respondents revealed that the different methods were effective in the order of: 43.5% on
farm visits by millers‟ employees, 30.5% on extension meetings, 10.5% on visit of
contact farmers and 9.7% on classroom training. From the research finding, the most
appropriate extension method is farm visits by employees followed by extension
meetings. The least appropriate is classroom training
This agrees with FAO (2010) that the introduction of technologies by field extension staff
can cause cultural adaptation problems for small-scale farmers. Therefore management
can organize training programmes for extension staff and farmers in the form of regular
lectures, field days and demonstration plots. These has been done in South Nyanza Sugar

69
Company (SONY) which promotes farmer training programmes and organized field days
to demonstrate sugar-cane production methods to farmers.
4.7.2.3 Level of technology adoption by farmers.
The section looks at the level of technology adoption that farmers feel are appropriate for
improving sugarcane productivity.The respondents were asked if they had adopted any
new technology released by millers in the past five years. The findings are presented in
the table below;
Table 4.35 Farmers adoption new technology.
Adoption of technology Frequency Percentage
Yes 43 16.6
No 204 77.6
None 15 5.8
_______________________________________________________________________
Total 262 100
Table 4.35 has the results, 43(16.6%) of the respondents have adopted new technology
while 204(77.6%) have not adopted new technology.The respondents had various reasons
why they had not adopted new technology. The most sited reason was that new
technology was expensive. Other reasons included lack of knowledge by both the staff
and farmers (not aware), lack of skills to execute (herbicide spraying), and the materials
are not available. FAO (2013) has it that in Ethiopia for example in addressing the
challenges of sugar industry to expand production, it is implementing an ambitious plan,
through the ESC, to more than double production by expanding the cultivated land area
and improving production infrastructure (dams, plant renovation).
4.7.3 Agricultural inputs
This section attempts to look at the extent to which the agricultural inputs by the sugar
factories influencesthe improvement of farmers‟livelihood. The question items were

70
geared towards eliciting responses that would indicate how the input by the factories
influences sugarcane farming. The tables presents the responses to various items, their
frequency and percentages.
4.7.3.1 Sugarcane transportation to the factory
Table 4.36 shows who caters for the transport of sugarcane to the factory after harvesting.
Table 4.36 Transportation to the factory
Frequency Percentage
Farmer 17 6.4
Sugar factory 232 88.7
None 13 4.9
________________________________________________________________________
Total 262 100
From table 4.36, the study revealed 232 which represent 88.7% of respondents agreed
that it is the company that caters for cane transportation to the factory. Only 17 or 6.4%
indicated to be making separate individual arrangements to have their canes delivered at
the factory while 13 or 4.9% did not respond to this item.Cane transport is the highest
production cost across all zones, ranging from 23-42% of totalproduction cost. High
transport costs are as a result of poor roads which lead to a high rate ofbreakage of the
transport units and hence a high frequency of replacement of spare parts. Tyres andtubes
also wear out faster and they have to be replaced. Spare parts, tyres, tubes and other
inputs arecostly, hence increasing the transport costs.
Farmers should be assisted in all matters related to production and operation including
assisting farmers to get required loans to carry out field operations and purchase inputs
and negotiate cane pricing as well as cane harvesting and transportation contracts
with millers. Effort to be considered to ensure timely payment to farmers on delivered
cane.

71
4.7.3.2 Supply of cane seeds for planting
This section sought to find out whether the sugar factories supplies the respondents with
cane seed for planting.
Table 4.37; Does the company supply canes for planting?
Response Frequency Percentage
Yes 231 88.1
No 21 8.0
No response 10 3.8
________________________________________________________________________
Total 262 100
On whether the company supplies the respondents with canes for planting, 231 or 88.1%
of the respondents reported that the company supplied them with canes for planting, with
21 or 8.0 reporting they did not receive. 5.3 did not respond to the item as shown in table
4.37. The plan for availing seed cane should be well done and B-nurseries be available. It
emerged that when the seed caneis poor, then there is a poor crop for the next 5 years.
(KESREF 2006).
4.7.3.3 Supplier of fertilizer
This study sought to determine who supplies the farmers with fertilizer.
Table 4.38; Who supplies fertilizer?
Response Frequency Percentage
Company 189 72.3
Myself 70 26.7
Don‟t know 1 0.3
No response 2 0.7

72
________________________________________________________________________
Total 262 100
To find out who supplies fertilizer to the farmers, again an overwhelming majority of
2.3% reported to receive fertilizer from the company and only 26.7% could buy on their
own.Sugarcane production costs in the Kenyan sugar industry with fertilizers and
herbicides inclusive, have been increasing over time, in addition to processing costs. The
result is high domestic sugar pricein comparison to other sugar producing countries,
thereby making Kenyan sugar non-competitive. This hasled to reduced farmers‟ profits, a
reason for some of them not paying much attention to cane management,and in turn
resulting into low quality cane. Kenya is currently under a reprieve where the deficit
sugarimported from COMESA countries has a zero-rated tax which is set to expire in
February 2008. Theproduction costs therefore, need to be reduced to make domestic
sugar cheaper and hence competitive, (KESREF 2006).Fertilizers should be made
affordable to increase ratoonability. This will increase yieldsthereby reducing costs. Bulk
purchasing of fertilizers by KSB through direct importing for thesugar industry would
reduce their cost.
4.7.3.4 The quality of prepared land
The study sought to determine the difference in quality of land prepared by either the
company of by the farmer him/herself.
Table 4.39; considering land prepared by the factories or by you, which one is best
done
Response Frequency Percentage
By company 232 88.2
By Self15 5.7
No response 16 6.1
________________________________________________________________________

73
Total 262 100
On land preparation, 88.2% preferred the preparations to be done by the company while
only 5.7% preferred themselves.
Those who preferred preparations by the company reported that the company uses
tractors hence faster preparation and payment will be done through deduction upon
harvesting of the canes hence increasing productivity.This agrees with Waswa, et al.,
(2012) who have the view that input costs influence the net income of the sugarcane
farmers. This is because the more input costs are put in the farming activity correctly, the
more the income is attained by the farmers.
4.7.4 Environmental initiative by the sugar factories.
This section attempted to look at the involvement of Sugar factories in the environmental
initiative so as to influence the improvement of farmers‟ livelihood.
4.7.4.1 Factories role in conserving the environment.
The section looks at role of the factories in enhancing and conserving the environment as
a basis of influencing the improvement of cane farmers‟ livelihood. A question on the
role of factories in improving environment was included. Findings are presented in the
table below.
Table 4.40 Environmental conservation
Frequency Percentage
Provision of seedlings 88 33.6
Outreach programs 76 29.0
Other 79 30.2
None 19 7.2
________________________________________________________________________

74
Total 262 100
The findings show that 33.6% indicated of provision of seedlings, 29.0% through
outreach programmes, 30.2% indicated other while 7.2% were not aware. Communities
need to be encouraged to engage in reforestation, water conservation and diversification.
These initiatives can be driven by the companies, but must be implemented by the
communities to enhance ownership and sustainability. The industries organizations have
the technology and resources to support environmental initiatives through capacity
building and awareness raising campaigns. Some companies have developed interactive
and accessible environmental programs that explain the industry and stakeholder roles in
protecting the environment, whilst at the same time explaining the operations of the sugar
industry.
4.7.4.2 Diversification with agroforestry as a measure to curb environmental
degradation.
Because of this, the high growth rate of the population and the economic dependence on
agriculture, large areas in Kenya have been deforested. One way to reconstruct the
ecosystem and compensate for the loss of resources is to design farming systems that can
help safeguard these demands, e.g. agroforestry systems. This section looks at the role
played by the sugar factories in addressing this issue through encouraging farmers to
engage in agroforestry.
Table 4.41 Agroforestry as a measure to environmental degradation
Response Frequency Percentage
Yes 95 36.2
No 125 47.7
Not aware 42 16.0
________________________________________________________________________
Total 262 100

75
On land agroforestry, 36.2% reported the input of the factories in encouraging
agroforestry, 47.7% reported of no input while 16.0% did not report anything.
Agroforestry need to be encouraged since according to Lwakuba et al. (2003) the systems
tend to give a large diversity of products on the farm. It also showed that a more diverse
system improved the productivity of the soil and gave opportunities to sell some
excessive products and obtain extra income.

76
CHAPTER FIVE
SUMMARY OF FINDINGS, DISCUSSIONS, CONCLUSION AND
RECOMMENDATION
5.1 Introduction
This chapter covers summary of the findings, discussion of results and conclusions drawn
from the study as well as recommendations based on the study findings and suggestions
for further
5.2 Summary of Findings
The study sought to find out the influence of sugar factories on the improvement of cane
farmers‟ livelihood in Bungoma East Sub County. The study revealed that Bungoma East
Sub County was comparatively densely populated with sugarcane farmers than other
regions within the County. Majority of sugarcane farmers were aged between 40-50 years
representing 38.2%. The study established that sugarcane farmers were male dominated
with 72.8% of the farmers being males. Majority of the cane farmers had attained the
secondary school level of education 55.9%. This level of education supported them on
utilization of modern technology while carrying out sugarcane farming.
From the study farmers are able to get some income whenever their cane is harvested and
delivered to the sugar factories and the income will vary depending on the acreage of the
land that was under cane. Also income received from engaging in sugarcane farming
accomplished many tasks in the family. 32.06% of the respondents stated that paying
school fees using sugarcane income was most important priority expenditure. The income
enabled the households to uplift their living standards. The findings shows that prompt
payment within the stipulated time frame in the Act by the respective millers encouraged
more the cane farmers to grow cane since they were paid on time hence improving their
livelihood. This is where 38.93% of the respondents stated that they were paid after 2
weeks, and 40.46% within 30days as stipulated by the Sugar Act.Prompt payment within

77
the stipulated time frame in the Act by the respective millers encouraged more the cane
farmers to grow cane since they were paid on time hence improving their livelihood
On education, majority of farmers 59.2% alluded to the fact that their children were not at
risk of dropping out of school due to lack of school fees. This implies that the millers in
paying farmers on time could facilitate the retention of children in school and were able
to get collateral of the cane supplied to pay fees in case payment delayed. From the study
it came out that the cost of education was very high where 53.1% of the farmers held the
opinion that the cost of education was high while 13% of the farmers asserted that the
cost of education was average. On school enrollment, 89.7% of the farmers were in
agreement that their children at the school going age, attended school/ were at school at
any given time. On barriers to school enrolment, the study revealed that 65.6% of the
respondents‟ were not able to enroll their children to school due to poverty. The highest
number of the farmers‟ sighted poverty as a limiting factor. The research established that
71.0% purported to the fact that schools had received support to set up physical facilities
in their respective schools from the sugar factories.
The study looked at ownership of land to ascertain the effect of cane farming on food
security. It came out that majority of people own small pieces of land, where 33.6%
sugarcane farmers had between 1-3 acres of land, and 33.2% had 3-5 acres. This was due
to overpopulation among other factors that was overstretching land ownership an
indication that sugarcane production competed with food crops for available land.
The study found out that, more farmers have less than one acre of their land under food
crop production, where 35.1% had less than 1 acre hence making food from the farm not
be adequate to feed their family. During the interview with the farmers, it came out
clearly that some had to source some food from the markets or relatives to satisfy the
family requirements. On the advice by the millers to leave a third of the land for food
crops 63.2% of the farmers agreed that they were advised while 33.0% farmers declined
that they were advised by the sugar factories‟ staff but didn‟t put into consideration.
According to the sugarcane farming, factories have also a responsibility of educating
farmers on food security during the extension meetings. The study revealed that
contracted sugarcane production had negative impact on food production in the family

78
since 54.7% of the respondents indicated food availability had reduced with 32.1%
revealing that sugarcane production led to increased food availability. Also it came out
that the sugar factories management less frequently provided dairy animals and
maize/beans in addressing food security so as to cushion farmers.
As for inputs from factories there was infrastructural development like of 59.1% of
respondents were in agreement that roads had improved. Roads and means of
transportation are essential to diffuse knowledge and technology, which facilitate the
development of communities. The construction and development of roads and
communication networks enhances the proper and fast marketing of farm produce. On
access to information 66.7% of head of households agreed that they have full access and
full satisfaction with reliability of information rather than before factories‟ operations.
According to the accessibility and consumption of water, most of farmers, reported that,
they had full access to source of water, water is available all day in their home or through
tanker services. Access to water plays a key role in development; it sustains human life,
both through direct consumption and use in agriculture (for food security) and industrial
activities. While water availability for drinking proposes is essential, it cannot be
separated from wider water resource management issues, also increased access to safe
drinking water results in improved health outcomes in the form of reduced cases of
water-borne diseases
Extension services like advice on proper planting, fertilizer application, timely weeding
and trash lining were provided which assisted to improve yields in sugarcane.
Respondents revealed that the different methods were effective with 43.5% reporting that
on farm visits by millers‟ employees was most preferable. It came out that farmers have
not adopted new technology. The respondents had various reasons why they had not
adopted new technology. The most sited reason was that new technology was expensive.
5.3 Conclusion
About 95% of sugarcane supplied to mills in the traditional sugar belt is harvested from
farmers‟ plots and the revenue generated sustains the livelihood of thousands of families

79
in rural areas. Farmers get some income whenever their cane is harvested and delivered
to the sugar factories and the income varies depending on the acreage of the land that is
under cane. The income received from engaging in sugarcane farming accomplished
many tasks in the family like paying school fees uplifting their living standards. Some
factories will pay farmers within the stipulated time frame in the Sugar Act and this could
encourage farmers to grow cane since they could be paid.
Moreover, it is found that education status in the study area has been strongly improved,
as whole generation of children has been enrolled in different schools and the rate of
educated people has become high. Farmers‟ children were not at risk of dropping out of
school due to lack of school fees. This implies that the millers in paying farmers on time
could facilitate the retention of children in school and were able to get collateral of the
cane supplied to pay fees in case payment delayed. The cost of education was considered
to be from secondary to tertiary being attributed on poverty. Schools also had received
support to set up physical facilities and some donations.
On food security it‟s found that cane farming affects farmers since many have less than
one acre of their land under food crop production. Farmers could source some food from
the markets or relatives to satisfy the family requirements. Millers would frequently
advise farmers to leave a third of the land for food crops but many didn‟t put the advice
into consideration. According to the sugarcane farming, factories have also a
responsibility of educating farmers on food security during the extension meetings.
Contracted sugarcane production had negative impact on food production to most of the
households. Also it came out that the sugar factories management didn‟t provide dairy
animals and maize/beans in addressing food security so as to cushion farmers.
It came out that; cane that factories had influenced through various input the
improvement of lives of cane farmers. Infrastructure had improved like good road
networks maintained by the factories. Agricultural inputs were given to farmers like
seeds fertilizer and transportation of cane to factories. Extension services and
environmental initiative had also been taken into consideration. Farmers had access to
clean water and accessibility to places was made possible with improved network.

80
5.4 Recommendations
1. Over reliance on money from sugarcane harvest is affecting the living standard of
farmers‟ who must be encouraged to give as much attention to other farming activities
such as animal production and the cultivation of food and cash crops in a way that
sugarcane becomes a part of the cropping system not its core. To enhance
competitiveness of the sugar sector, the GOK should focus on the following areas:
Privatizing the government-owned sugar mills; Facilitating access of credit to farmers for
enhanced cane development from the Sugar Development Fund; Supporting sugarcane
research and availability of early maturing, high sucrose varieties; and creating conducive
policy environment for production and use of biofuels.
2. Sugar factories should improve payment per tonnage offered to the sugarcane farmers
and of release the cash in time to enable the cane farmers to send and sustain their
children in school by paying school fees in time. The companies should set up a
scholarship/sponsorship scheme for bright but financially disadvantaged children and all
education stakeholders in the County to work closely with the companies to ensure that
only genuine and deserving students benefit from the scheme. The companies should
enhance the marketing of its sugar so as to generate more revenues and in turn increase
its allocation towards corporate social responsibilities especially on education.
3. Sugar factories management need to review the use of Sugarcane as collateral in
provision of food crop inputs. They should prepare a budget and engage staff that can
effectively plan, organize and implement the food security programme for sugarcane
farmers. Farmers on the other hand should implement the information received on food
security. Therefore both sugar factories management and sugarcane farmers need to
realize the importance of both sugarcane and food security in their business and work in a
win-win kind of business. Sugar factories management should also endeavor to search for
partners in addressing farmers‟ food security by partnering with the Non-Governmental
Organizations and Ministry of Agriculture and livestock.

81
4. County Governments need to facilitate the acquisition of equipment such as tractors for
the farmers‟ cooperative societies in a bid to reduce exploitation by processors; Farmers
ought to be facilitated to have shares in processing factories. County governments could
buy shares on behalf of societies that can be paid off later from proceeds. This is of
particular importance especially to sugarcane out-grower societies with the looming
privatization of all state owned sugar factories.
5.6 Suggestions for Further Research
This study did not explore certain areas that were equally important. Such areas were left
out because the scope of this study warranted. In view of this, the study suggests the
following areas for further research:
a) The influence of the rising cost of energy on sugarcane farming.
b) Alternative modern farming methods that would integrate cane farming and food
production to ensure food security.
c) Factors that led to the collapse of out growers cooperative societies that championed the
plights of farmers‟.

82
REFERENCES
Anwar, H &Naeem-ur-Rehman, K. (2011). Economic analysis of sugarcane crop in
District
Charsadda- Pakistan. Journal of Agriculture Resources, 49(1), 2011
Chavalier, A.; Harnion, C, O‟Sulvann, V& Walker, I. (2005) Impact of Parental Income
On Education and Schooling of their Children; Institute for Fiscal
Studies. Working Paper Vol. 05/05
Carney D (1998).What we contribute we can make. London U.K
Central Bureau of Statistics and Ministry of Planning Statistics (2004);
Economic Survey Report .Nairobi.
Daily Nation (1998). Private School needs support too. Daily Nation July 27th
Nairobi:
NationMedia Group Ltd.
DindiEverlyne (2013). The Managerial Factors Influencing Sugarcane Production by
Farmers of Mayoni Division, Mumias Sugar Company Kenya
EPZ (2005); Kenya Sugar Industry. Nairobi, Kenya
Erguden S. (2001); Low Cost housing: Policies and constraints in Developing
Countries. International conference on Spatial Development for
Sustainable Development, Nairobi
Glenn, D.I. (1992), Determining Sample Size, IFAS, Florida USA.
Harb, J. C., & Columba, C. H. (2010). Financial and Economic feasibility of sugarcane
Production in northern Lapaz. Latin American and Caribbean

83
Environmental Economics Program.
Hildebrand Clive (2002); Independent Assessment of Sugar Industry.
Institute of Economic Affairs (2005); Sugar Industry in Kenya. Nairobi,
Kenya
IdahLindell&Guttaf Magnusson (2010) Sugarcane and Agro forestry Farming in
Western Kenya. A Comparative study of different farming systems in
Nyando District. Uppsala 2010
Kimera R.H and Sserukuma R.S(2005); Impact of EU sugar trade on developing
Countries.Germany:Published by German watch publishers
KIPPRA (2007). Financing Secondary Education in Kenya: Cost Reduction and
Financing Options. Nairobi: KIPPRA.
Kegode, P. (2005); Economic Governance in Sugar Sector .Kenya
Kenyan Vision 2030 (2007); Globally Competitive Prosperous Kenya.
Kothari, C.R (1985).Research Methodology: Methods and Techniques. New Delhi:Willy
Eastern Limited
Kothari C.R. (2007). Research Methodology.Methods and Techniques.New Age
International (P) Limited, India
Khoghali H, Jackie F, Rebecca B., & Susan J. (2001); Food Security Assessment in
Emergencies London, U.K
KIHBS (2003); Kenya Integrated Household Budget survey. Nairobi, Kenya.
Krejcie, R.V. & Morgan, D.W. (1970). Determining sample size for research activities.
Jha, S. & Chatterjee, S. (2005). Public-Private Partnership in a Minimally Invasive
Education

84
Kande, L.W (2007). Private schools involvement in provision of secondary school
education inNyandarua, Kenya. Unpublished M.ed Thesis. Nairobi.
Kenyatta University.
Kenya Airways (2008). Corporate Social Responsibility in Education. Nairobi.
Kivuitu, M. (2005). Perspective of Corporate Social Responsibility for Environment and
Development. International Institute for Environment and Development
(IIED).
LondonApproach. International Education Journal Vol. No
Lihanda, A.M. (2003). Rural Industrialization and the food problem; The case of
Mumias Sugar Scheme. Kenya Society of Sugarcane Technologistics,
Proceedings of the 11th
Biennial Congress. Nairobi,Kenya
Michael N. Prince (2010). Investigating the Livelihoods of Families Operating Small
Sugarcane Farms in Jamaica: A Case Study Perspective. Lincoln
University
Mugenda, O.M. &Mugenda A.G., (1999). Research Methods. Quantitative and
QualitativeApproaches. Acts Press, Nairobi
Mugenda, O.M. &Mugenda, A. G. (2003), Research Methods: Quantitative & Qualitative
Approaches, Acts Press, Nairobi Kenya.
OECD (2003), Farm household income. Issues and policy responses.
Orodho, A.J. (2003). Essential of Education and Social Sciences Research Method.
Nairobi; Masola Publishers.
Oso, Y.W&Onen, D. (2009) A General Guide to Writing a Research Proposal and
Report, Jomo Kenyatta Foundation, Nairobi, Kenya

85
Peill, M. (1995). Social science research methods. Hand book for Africa. Nairobi: East
Africa Education Publishers
United Nations (2011) Resilient Livelihood-Disaster Risk Reduction for Food
Nutrition and Security framework Programme. Rome, Italy.
United Nations (2000). Policies for Small-Scale Sugarcane Growing in Swaziland
UNESCO, (2005).Give everyone a chance to learn, Education for all. Nairobi
Pamela A. &Davis(2005) The influence of parent education and income on child‟s
Achievement.
Oniang‟o, C . (1987). Socio-Economic profile of Outgrowers in Mumias Sugar scheme.
Richard A. &Easterlin, (2000).The Worldwide Standard of Living since 1800.Journal of
Economic Perspective Vol 14.USA: Published by American Economic
Association
Ramulu, M. (1994). Supply Response of Sugarcane in Andhra Pradesh, India. Finance
India Vol X No.1, pages 116-122.
Romano D., Erdgin Marco D., and Luca A. (2010); Livelihood strategies and household
Resilience to food insecurity .European Report on Development.
Nairobi, Kenya.
Robert Chapman, and et al, 2005, Livelihoods Approaches to Information and
Communication in Support of Rural Poverty.
Shakil, S. (2003). Public-Private Partnerships for the delivery of basic education services
to thePoor. London: DFID/AKDN
Sorre, B.M. (2005). Effects of Sugarcane production on food security and nutritional
Statusin Nambale division, Busia district, Kenya. (Unpublished

86
Master‟sThesis). Moi University, Kenya.
Tacoli C. Nazneen K. and GregorM (2012). „Understanding Market based Livelihoods in
Globalizing World‟ Available at
www.iied.org/sarl/research/project/t3/proj01.html
Tarimo J.P. and Takamura T.Y. (1998) Sugarcane production, processing and marketing
in Tanzania
Tromp L.A.D. and Kombo K.D. (2006). Proposal and thesis writing. An Introduction,
Nairobi, Kenya: Pauline‟s publications Africa.
Waswa, F. et al., (2009) Enhancing household food and income security through crop
Diversification in the Nzoia and Mumiassugar belts in Kenya
Waswa, F., et al., (2012) Contract sugarcane farming and farmers‟ incomes in the Lake
Victoria basin, Kenya
Wawire, N.W, Nyongesa, D.P, &Kipruto, K.B. (2002) The effect of continuous land
sub-division on cane production in Kenya . KESREF Technical
Bulletin.

87
APPENDIX I
LETTER OF TRANSMITTAL
JACKSON PEMBERE WANYONYI
+254710739045
Dear Respondent
RE: FILLING OF THE QUESTIONNAIRE
I am a student of Master of Arts in Project Planning and Management at the University of
Nairobi. I am currently doing research on influence of sugar factories on the
improvement of sugarcane farmers‟ livelihood in Bungoma East Sub County. You have
been identified as a potential respondent in this research. You have been nominated to
participate in this study and your participation is purely voluntary. If you choose to
participate, please provide accurate and honest answers as much as possible. As a
measure of confidentiality, your name will not be required.
Thanks in advance for your support. The information you give will be treated as
confidential. Kindly provide the information that is well known to you.Your support and
co-operation is very important and will be highly appreciated.
Thank you.
Jackson PembereWanyonyi
Student -UON
L/50/76613/2014

88
APPENDIX II
QUESTIONNAIRE FOR THE FARMERS
PART A: PERSONAL DETAILS
[Please tick (√) where appropriate]
1. Gender
i. Male ( ) ii. Female ( )
2. Age i.18 – 20 ( ) ii. 20 – 30 ( ) iii. 30 – 40 ( ) iv. 40 – 50 ( ) v. 50 – 60 ( )
vi. 60 – 70 ( )
3. Education level
i. Primary ( ) ii. Secondary ( ) iii. College ( ) iv. University ( ) v. Post
graduate ( )
4. Marital status
Single ( ) Married ( ) Separated ( ) Divorced ( ) Widowed ( )
Part B: INCOME
5. Please give the average income you earned from last cane harvested in Kshsperacre.
Less than 20,000 ( ) 20,000-50,000 ( ) 50,000-80,000 ( ) 80,000-110,000( )
Above 110,000 ( )
TICK WHERE APPPROPRIATE
6. Name some institutions sugar factories management are partnering with to address
your financial requirements such as loans, school fees, medical treatment, food security
etc. by using your sugarcane as collateral .
Institution Financial requirement

89
______________ ___________________
______________ ____________________
______________ ____________________
_______________ ____________________
7. How long did the sugarcane proceeds take to be paid after harvesting and delivery to
the millers?
8. Has the proceeds from cane farming assisted you to improve the quality of life? (Tick
where appropriate.
Yes……………..
No ………………
9. Please indicate below how you spend income from sugarcane farming, indicating the
most important priority as no. 5 and the least as no.1
Income expenditure Priority
Pay fees
Invest in business
Buy family land
Build family house
Others
Days between delivery to millers and
payment
Tick appropriately
Within 2 weeks
Within 30 days
Within 2 months
After 2 months

90
10. What is the main source of income for your family; please rank below indicating no.
4 for the most important and no.1 for the least.
11. Do you know about sugarcane pricing formula? a) yes--------------- b) No---------------
PART C: EDUCATION
12. How many of your children attend school? _________ INDICATE
13. How many of your children don‟t attend school? _________ INDICATE
14. Do you have any child/ Children at risk of dropping school?
Yes ( ) No ( ) TICK THE MOST APPROPRIATE ANSWER
15. How many children that you live with have dropped out of school? _________
INDICATE
16. How would you rate the cost of affordability to school based on your average
income?
VERY HIGH 1
HIGH 2
AVERAGE 3
LOW 4
Source of income
Sugarcane farming
Employment
Business
Food crops

91
VERY LOW 5
CIRCLE THE MOST APPROPRIATE ANSWER
17. What are the barriers that hinder your children to school enrollment?
_______________________________________________________
_________________________________________________________
18. What age are your children or children within the community likely to drop out of
school because of fees problem?
3-6 Years 1
7-9 years 2
10-13 years. 3
14-18 years 4
19-22 years 5
CIRCLE THE MOST APPROPRIATE ANSWER
19. What happens to children who drop out of school because of fees problem?
_______________________________________________________________
_______________________________________________________________
20. Where do they go to after dropping out of school?
______________________________________________________________
_______________________________________________________________
21. What portion of children who drop out of school re-enter back to school?
5% 1

92
10% 2
20% 3
30% 4
40% 5
Above 50% 1
22. Are all of your children in school/attended school? Tick the most appropriate.
Yes 1
No 2
23. What conditions hinder drop outs from re-enrolling?
___________________________________________________________
___________________________________________________________
24. What are the determinants of low and high rate of enrollment in schools?
_____________________________________________________
______________________________________________________
25. Do the sugar factories assisted in any way in improving infrastructure development in
schools? Tick the most appropriate
Yes 1
No 2
26. If YES, name some of the facilities provided/maintained with the companies‟ help:
________________________________________________________

93
________________________________________________________
_________________________________________________________
27. Observe the classrooms, toilets and environment among others in schools in schools
and rate. Tick the most appropriate answer.
Very good Good Average Poor Very poor
Roofing
Walling
Floor
Sanitation
External
environment
Desks
PART D: FOOD SECURITY
28. What is the estimated size of your land? ____________________acres
29. How many acres of your land are under the following?
a) Sugarcane farming _______________________________acres
b) Food crops _____________________________________acres
c) Fallow (pasture) _________________________________acres
d) Homestead _______________________________acres
30. Has the sugar factory management advised you to leave a third of your total land area
for food crop production? Please tick the appropriate.
a) Yes_______________1 b) No____________________2
31. Tick below how management of sugarcane farming has affected food availability in
your family over the years

94
a) Positively (increased food availability) _____________
b) Negatively (reduced food availability) _____________
c) No change at all _______________________________
32. In what ways has the sugar millers‟ management contributed towards achieving food
security in your family, please rank 1-4. Rank 4 for most frequent and 1 for less frequent.
Ways on addressing food insecurity Rank
Provide diary animals
Provide maize/beans
Education on food security
None
33. Rank below the source of food to your family. Rank 4 most frequent and 1 less
frequent.
Source of food Rank
Fully production from farm
Buy from market
Borrow from relatives/neighbors
Sleep hungry/no meal
PART E: INPUT BY THE SUGAR FACTORIES
34. Has cane farming contributed to improvement of road network? YES [ ] NO [ ]
35. Has the access to information improved in relation to the operations of the sugar
factories in your area?
Full access ______________________
Partial access ____________________
No access & satisfaction ____________

95
TICK APPROPRIATELY
36. Which material is used to make your residence?
Mud _______________
Cement _____________
Mud + bricks ________
Tick appropriately
37. Where do you get your water?
Rain ______________
Spring ______________
Borehole __________
Tap ______________
TICK APPROPRIATELY
38. Are there restrictions on the consumption of water? YES [ ] NO [ ]
39. Do you own land besides your home garden? YES [ ] NO [ ]
40..How many times has the extension staff visited your farm within the past one month,
please indicate below. -------------- Times
41. What activities did s/he advice you on, please tick below.
a) Planting of sugarcane
b) Fertilizer application
c) Weeding of sugarcane
c) Trash lining of sugarcane
d) Any other (specify) ---------------------------------------------------------------

96
------------------------------------------------------------------------------------------------
42. How many extension meetings (barazas) have the farmers in your block held with
extension staff within the past one month, please indicate ------------- times. And what
topics were discussed---------------------------------------------------------------------------
------------------------------------------------------------------------------------------------------------
43. Which method of extension services do you think is effective in helping improve
sugarcane productivity, please tick below as many responses as you think are good?
a) Farm visits by employees ( )
b) Extension meetings (barazas) ( )
c) Visit contact model (best) farmers ( )
d) Classroom training ( )
44. Have you adopted/used new technologies released by, such as use of herbicides on
weed control, varieties? A) yes------------------------ b) No---------------------------
If no, why are you not using, please indicate below.
------------------------------------------------------------------------------------------------------------
------------------------------------------------------------------------------------------------------------
45. What kind of relationship do you have with extension staff?
a) Friendly ( ) b) Casual ( )
c) Indifferent ( ) c) Hostile ( )
46. Has this relationship affected cane farming activities in your farm?
a) Yes ( )
b) No ( )

97
47. If yes, in which way has it affected your cane farming activities? -------------------------
------------------------------------------------------------------------------------------------------------
48.Who caters for transport of sugarcane to the factory after harvesting?
I. Farmer
II. The company
III. Other
49. If the company, how are the deductions by the company?
I. Very high
II. High
III. Medium
IV. Low
V. Very low
50. Does the company supply you with canes for planting?
I. Yes
II. No
If No, who supplies?
………………………………………………………………………………………………
……………………………………………………………………………………….
51. Who supplies you with fertilizer?
I. Company
II. Myself
III. I Do not know
52. If by the company, how is the timeliness of the supply?
a. Timely
b. Untimely
c. Do not know

98
53. Considering land prepared by the company and by yourself. Which one is best done?
a. By the company
b. By myself
54. Do the factories play any role in the conservation of the environment?
a. Yes
b. No
If yes which role do they play? -----------------------------------------------
------------------------------------------------------------------------------------
55. Do the sugar factories play any role in ensuring diversification through agroforestry?
a. Yes
b. No
RATING ON THE LEVEL OF SATISFACTION WITH THE SUGAR
FACTORIES
56. How often do you take your cane to the sugar company?
Very Frequently_______________________________1
Frequently____________________________________ 2
Less frequently_________________________________ 3
CIRCLE THEMOSTAPPROPRIATEANSWER
57. Are the terms of transaction offered by the sugar companies favorable?
Yes ___________________________________1
No ___________________________________ 2
Thank You Very Much For Participating In This Study

99
APPENDIX III
DETERMINING SAMPLE SIZE FOR RESEARCH ACTIVITIES
N S N S N S
10 10 220 140 1200 291
15 14 230 140 1300 297
20 19 240 148 1400 302
25 24 250 152 1500 306
30 28 260 155 1600 310
35 32 270 159 1700 313
40 36 280 162 1800 317
45 40 290 165 1900 320
50 44 300 169 2000 322
55 48 320 175 2200 327
60 52 340 181 2400 331
65 56 360 186 2600 335
70 59 380 191 2800 338
75 63 400 196 3000 341
80 66 420 201 3500 346
85 70 440 205 4000 351
90 73 460 210 4500 354
95 76 480 214 5000 357
100 80 500 217 6000 361
110 86 550 226 7000 364
120 92 600 234 8000 367
130 97 650 242 9000 368
140 103 700 248 10000 370
150 108 750 254 15000 375
160 113 800 260 20000 377
170 118 850 265 30000 379
180 123 900 269 40000 380
190 127 950 274 50000 381
200 132 1000 278 75000 381
210 136 1100 285 1000000 384

100
APPENDIX IV
WORK PLAN
Table below outlines the estimated time that the researcher took to complete the research
ACTIVITY
JULY
2015
AUGUST
2015
SEPTEMBER
2015
OCTOBER
2015
NOVEMBER
2015
DECEMBER
2015
JANUARY
2016
March
2016
Identification
of research
Area
Proposal
Writing
Proposal
Defense and
Corrections
Data
Collection
Data
Analysis and
Thesis
writing
Submission
of thesis
defense and
effecting
suggestions

101

102