Embed Size (px)
Citation preview

Influence of the chemokine CXCL12 on the progression and the signalling in colorectal
cancer
Dissertation
Zur Erlangung des Grades Doktor der Naturwissenschaften
Am Fachbereich Biologie
Der Johannes Gutenberg-Universität Mainz
vorgelegt von
M.Sc. Biotechnology
Risala Hussein Allami
aus
Baghdad, Iraq
Mainz 2013


بسم ٱهلل ٱلرحمـن ٱلرحيم
سورة طه
Translation in English
In the name of Allah, the Beneficent, the Merciful
"O my Lord! Increase me in knowledge."
Surah Ta-Ha


TABLE OF CONTENTS
i
TABLE OF CONTENTS
I. TABLE OF CONTENTS
II. ABBREVIATIONS
1. INTRODUCTION
1.1 Epidemiology ............................................................................................................................ .1
1.1.1 The mortality statistics in Germany ....................................................................................... .1
1.1.2 Incidence and Mortality Data ................................................................................................. .3
1.2 Definition of cancer ................................................................................................................... .4
1.2.1 Carcinogenesis – The development of cancer ........................................................................ .5
1.3 Colorectal cancer ....................................................................................................................... .7
1.3.1 Carcinogenesis of colorectal cancer ....................................................................................... .9
1.3.2 Classification and staging of colon cancers ............................................................................ 10
1.4 Chemokines and their structure ................................................................................................. 14
1.4.1 What are chemokines ............................................................................................................. 14
1.4.2 Chemokine structure and nomenclature ................................................................................. 14
1.4.3 Chemokine receptors .............................................................................................................. 17
1.4.4 Chemokine receptor signalling ............................................................................................... 19
1.5 CXCL12 and its receptors ......................................................................................................... 21
1.5.1 CXCR4 ................................................................................................................................... 21
1.5.2 CXCR7/RDC-1 ...................................................................................................................... 21

TABLE OF CONTENTS
ii
1.6 Biology of SDF-1 ...................................................................................................................... 22
1.6.1 SDF-1(CXCL12) and human tumor microenviroment .......................................................... 22
1.6.2 Molecular Structure of SDF-1 Splice variants ....................................................................... 23
1.7 OBJECTIVE OF THE STUDY 26
2. MATERIALS AND METHODS
2.1 Chemical materials .................................................................................................................... 27
2.1.2 Devices ................................................................................................................................... 29
2.1.3 Antibodies .............................................................................................................................. 30
2.1.3.1 Primary Antibody ................................................................................................................ 30
2.1.3.2 Secondary Antibody ............................................................................................................ 30
2.1.4 Cell lines ................................................................................................................................. 31
2.1.5 Plasmids & Vector .................................................................................................................. 31
2.1.6 Primers.................................................................................................................................... 32
2.2 Molecular Biological Methods .................................................................................................. 33
2.2.1 Tumour cell lines and culture Conditions .............................................................................. 33
2.3 Polymerase Chain Reaction (PCR) ........................................................................................... 33
2.3.1 Detection of CXCL12 gene polymorphism in CRC Patients by PCR-RELP ........................ 34
2.3.2 Separation of DNA on Agarose Gel Electrophoresis ............................................................. 36
2.3.3 Digestion of PCR product
by specific restriction enzyme for detection of CXCL12 gene polymorphism ....................... 37

TABLE OF CONTENTS
iii
2.3.4 Expression of CXCL12 Splice Variants
in Human Colorectal carcinoma and Human mucosa ............................................................. 38
2.4 RNA Isolation and Semiquantitative Reverse Transcription-PCR ............................................ 39
2.4.1 RNA extraction from Cell lines .............................................................................................. 39
2.4.2 Reverse transcription PCR (RT‐PCR) .................................................................................... 40
2.5 Transfection ............................................................................................................................... 42
2.5.1 Transfection of Colon carcinoma cell line (SW480)
and Melanoma cell line (D05) with plasmid SDFI isoforms using Lipofectamine 2000 ........ 42
2.5.2 Transfection protocol ............................................................................................................. 42
2.5.3 Stable Transfection ................................................................................................................. 43
2.5.3.1 Selection of Stably Transfected Cells .................................................................................. 43
2.6 FACS Vantage (Fluorescence Activated cell sorting ................................................................ 44
2.7 Western blot .............................................................................................................................. 44
2.7.1 Samples preparation ............................................................................................................... 45
2.7.2 Western blot analysis ............................................................................................................. 46
2.8 AMD3100 .................................................................................................................................. 47
2.8.1 Structure of AMD3100 ........................................................................................................... 47
2.8.2 Western blot analysis after treatment with different concentration of AMD3100 ................. 48
2.9 Cell Proliferation ....................................................................................................................... 48
2.9.1 Cell Proliferation assay .......................................................................................................... 49
2.9.2 Cell Proliferation assay after treatment with different concentration from AMD3100 .......... 49
2.10 Cell Adhesion ......................................................................................................................... 50
2.10.1 Cell adhesion assay .............................................................................................................. 50
2.11 Definition of migration and invasion ...................................................................................... 51

TABLE OF CONTENTS
iv
2.11.1 Cellular Migration assay ...................................................................................................... 51
2.11.2 Invasion assay protocol ........................................................................................................ 52
2.12 Animal experiments ................................................................................................................ 53
2.12.1 Subcutaneous xenograft tumor system ................................................................................. 53
2.13 Statistical Analysis .................................................................................................................. 54
3. RESULTS
3.1 CXCL12 Gene polymorphism ................................................................................................... 55
3.1.1 Patients characteristics ........................................................................................................... 55
3.1.2 Genotype frequencies ............................................................................................................. 56
3.2 CXCR4 and CXCL12 Expression in colorectal carcinoma cell Lines ...................................... 58
3.3 Expression and activity of CXCL12 splice variants in Human Colorectal carcinoma .............. 58
3.4 Statistical methods ..................................................................................................................... 61
3.4.1Correlation of SDF-1 isoforms with clinico pathological parameters……………………….61
3.5 Plasmid DNATransfection ........................................................................................................ 64
3.5.1 CXCL12 expression in colorectal cell line and melanoma cell line ....................................... 64
3.5.2 Transfection of CXCL12 isoforms in tumour cells ................................................................ 65
3.5.3 FACS Analysis ....................................................................................................................... 67
3.5.3.1 FACS Analysis of SW480, D05 in Vitro ............................................................................ 67
3.5.3.2 FACS Analysis of SW480 in Vitro ..................................................................................... 67
3.5.3.3 FACS Analysis of D05 in Vitro .......................................................................................... 70
3.6 Cell Proliferation Assay ............................................................................................................ 73

TABLE OF CONTENTS
v
3.6.1 Effect of CXCL12 isoforms on cell proliferation of colorectal cancer .................................. 73
3.7 Cell Migration Assay ................................................................................................................. 75
3.7.1 Effect of CXCL12 isoforms on cell migration of colorectal cancer ....................................... 75
3.8 Cell Invasion Assay ................................................................................................................... 77
3.8.1 Effect of CXCL12 isoforms on cell invasion of colorectal cancer ......................................... 77
3.9.Cell Adhesion Assay ................................................................................................................. 79
3.9.1 Effect of CXCL12 isoforms on cell adhesion of colorectal cancer ........................................ 79
3.10 The effect of CXCL12 variants on cell proliferation
of colorectal carcinoma and melanoma cell lines after treatment with AMD3100 ................. 81
3.10.1 Effect of CXCL12 splice variants
on cell proliferation activity after treated with 0µg\ml AMD3100 ......................................... 81
3.10.2 The effect of CXCL12 splice variants
on cell proliferation activity after treated with 5µg\ml AMD3100.......................................... 83
3.10.3 Effect of CXCL12 splice variants
on cell proliferation activity after treated with 10µg\ml AMD3100 ....................................... 85
3.11 The Akt and MAPK signalling pathways in colorectal cancer................................................ 87
3.11.1 The Effect of CXCL12 splice variants
on the phosphorylation of AKT MKE ½, SAPK/JNK and p38 in colorectal cancer............... 87
3.11.2 Effect of CXCL12 splice variants
on the AKT& MEK-1/2 in colorectal cancer after treatment with AMD3100 ........................ 90
3.11.3 The effect of CXCL12 splice variants
on the phosphorylation of AKT after treatment with AMD3100 ............................................ 90
3.11.4 The effect of CXCL12 splice variants
on the phosphorylation of MEK-1/2 after treatment with AMD3100 ..................................... 93
3.12 Animal experiment .................................................................................................................. 95
3.12.1 In vivo xenograft model ....................................................................................................... 95
3.12.2 Macroscopic examination of the mouse situs ……………………………………………...95

TABLE OF CONTENTS
vi
4. DISCUSSION
4.1 CXCL12 Gene polymorphism ................................................................................................... 100
4.2 Expression and activity of CXCL12 splice variants
in Human Colorectal carcinoma and colon normal mucosa .................................................... 102
4.3 Effect of CXCL12 splice variants on proliferation of colorectal cancer cells ........................... 104
4.3.1 CXCL12 splice variants induce tumor cell proliferation ...................................................... 104
4.3.2 Role of Akt in cell proliferation ............................................................................................. 106
4.3.3 Role of MAPK in cell proliferation ........................................................................................ 107
4.4 Effect of CXCL12 splice variants on migration and invasion of colorectal cancer cells .......... 109
4.4.1 CXCL12 splice variants stimulate tumor cell migration and invasion ................................... 109
4.5 Effect of CXCL12 splice variants on adhesion of colorectal cancer cells ................................ 111
4.5.1 CXCL12 splice variants promote tumor cell adhesion ........................................................... 111
4.6 AKT and MAPK signalling pathways involving in colorectal cancer ...................................... 112
4.6.1 Effect of CXCL12 variants on the phosphorylation of AKT in colorectal cancer ................. 112
4.6.2 Effect of CXCL12 variants on the phosphorylation of MAPK in colorectal cancer .............. 114
4.7 AMD3100 inhibits cell Proliferation of colon cancer ............................................................... 116
4.7.1 AMD3100 exclusively inhibits CXCL12/CXCR4- mediated colorectal cancer .................... 117
5. SUMMARY/ZUSAMMENFASSUNG
5.1 Summary ................................................................................................................................... 118
5.2 Zusammenfassung ..................................................................................................................... 120

TABLE OF CONTENTS
vii
6. REFERENCES 122
7. APPENDIX 137
8. CURRICULUM VITAE 166

ABBREVIATIONS
viii
Abbreviations
AIDS Acquired immune deficiency syndrome
APC Adenomatosis polyposis coli
AKT v-akt murine thymoma viral oncogene homolog 1 / PKB – protein kinase B
ATF activating transcription factor
B-ATF B-cell-activating transcription factor
BM Bone marrow
BSA Bovine serum albumin
Bp Base pare
CCL CC family chemokine ligand
CCR CC family chemokine receptor
cDNA Complementary DNA
CXCL CXC family chemokine ligand
CXCR CXC family chemokine receptor
CRC Colorectal cancer
DNA Deoxyribonucleic acid
DNase Deoxyribonuclease
dNTP Deoxynuclaotide triphosphate
EGFR Epidermal growth factor receptor
ABBREVIATIONS
ix
ERK extra-cellular signal-regulated kinase / MAPK1
FACS Fluorescence activated cell sorting
FAP Familial Adenomatous Polyposis
FBS Fetal bovine Serum
GFP Green fluorescence protein
G418 Geneticin
HNPCC Hereditary non-polyposis colorectal cancer
JNK jun terminal kinase
MAPK Mitogen Activated Protein Kinase
MEK MAPK kinase/ERK kinase
ml Millilitre
mg Milligram
MMP Matrix-Metalloproteinase
mRNA Messenger RNA
p38 Protein 38
PAGE polyacrylamide gel electrophoresis
PB Peripheral blood
PBS Phosphate Buffered Saline
PCR Polymerase chain reaction
ABBREVIATIONS
x
PI3K phosphoinositide 3-kinases
PKC protein kinase C
PPAR peroxisome proliferative receptor
RNA Ribonucleic acid
RT Reverse transcription
Rpm Rotation per minute
SDF-1 Stromal cell-derived factor 1
SNP Single nucleotide polymorphism
Temp Temperature
TCF-4 transcription factor 4
TNFα tumor necrosis factor α
TNM Tumour-Node-Metastasis
UICC Union international contra le cancer
UV Ultraviolet light
VEGF Vascular endothelial growth factor
WB Western blot
WT Wild type
µg Microgram
µl Microliter

INTRODUCTION
1
1. Introduction
1.1 Epidemiology
1.1.1 The mortality statistics in Germany
Diseases of the circulatory system have been for many years the most frequent cause of death
in both men and women. Whereas malignant neoplasms are the second leading cause of death
in men nearly with 28.9 % and in women with 22.4 % (Fig 1). At present, approximately eve-
ry third death is due to circulatory disease and every fourth death is due to cancer [1]. The
burden of cancer is increasing in economically developing and developed countries as a result
of aging population and an adoption of cancer-associated lifestyle choices including tobacco
smoking, obesity, physical inactivity and diet with high calories [2]. About 12.7 million can-
cer cases and 7.6 million cancer deaths are estimated to have occurred in 2008 worldwide and
with 1.24 million new cases diagnosed in 2008, colorectal cancer is the third most common
cancer worldwide. [2]. In addition, colorectal cancer sums up to the second most frequent
type of cancer concerning men and women in developed countries [1].
Fig 1- The Most Frequent Causes of Death in Germany in 2010 [1]

INTRODUCTION
2
In Germany, in 2008, there were nearly 65,000 cases of colorectal cancer and almost 26,000
deaths and in 2012, according to projections of the Robert-Koch-Institute, up to 73,000 new
cases [3].
The trend graphs for the five leading groups of causes of death in Germany (Fig 2) indicate
that cancer mortality continues to show a slight, gradual downtrend compared to the more
pronounced decline for cardiovascular diseases. Cancer will become the leading cause of
death in Germany in the next 15-20 years, whereas the age-adjusted mortality rates from dis-
eases of the circulatory system have declined significantly among females for decades and
among males since about 1970, and that these rates are continuing to fall.
A B
Fig 2- Trend graph for the five leading groups of causes of death in Germany for male (A) and female
(B) [4]
INTRODUCTION
3
1.1.2 Incidence and Mortality Data
According to the World Health Organization, cancer is the leading cause of death in economi-
cally developed countries and the second leading cause of death in developing countries [5].
Today, millions of people all over the world are living with cancer or have had cancer [6].
The five most common types of cancer are largely identical for each sex in both parts of Ger-
many.
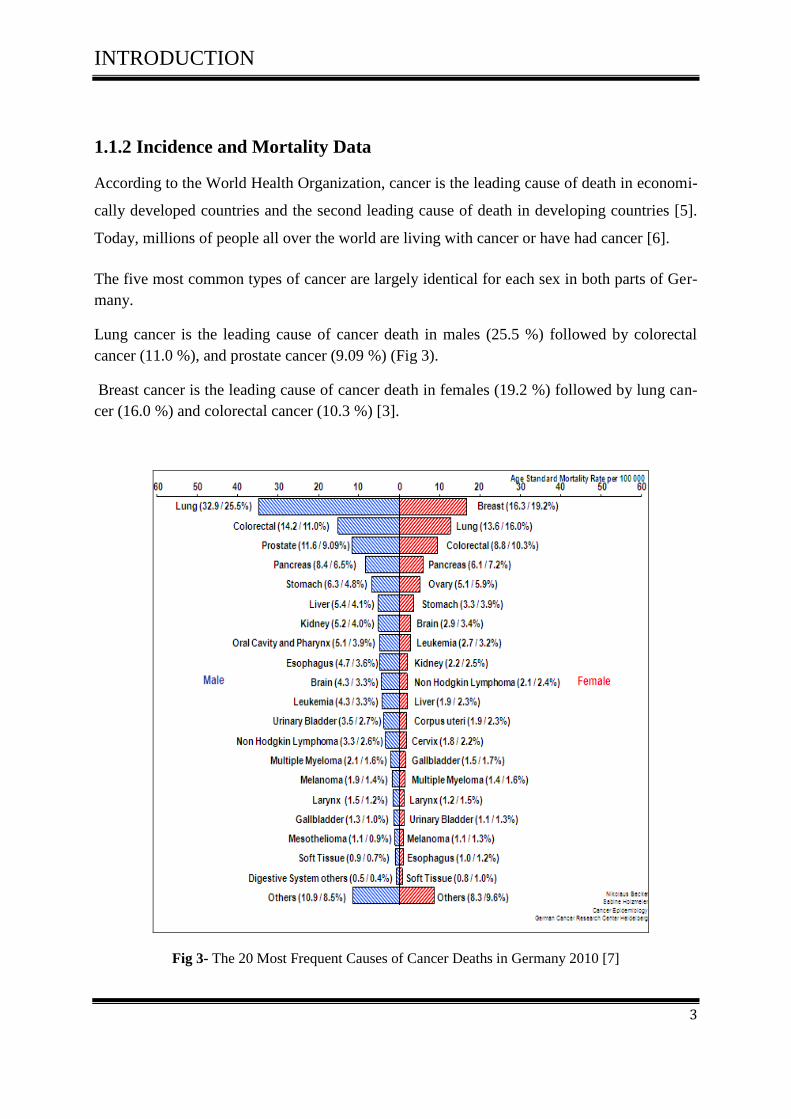
Lung cancer is the leading cause of cancer death in males (25.5 %) followed by colorectal
cancer (11.0 %), and prostate cancer (9.09 %) (Fig 3).
Breast cancer is the leading cause of cancer death in females (19.2 %) followed by lung can-
cer (16.0 %) and colorectal cancer (10.3 %) [3].
Fig 3- The 20 Most Frequent Causes of Cancer Deaths in Germany 2010 [7]
INTRODUCTION
4
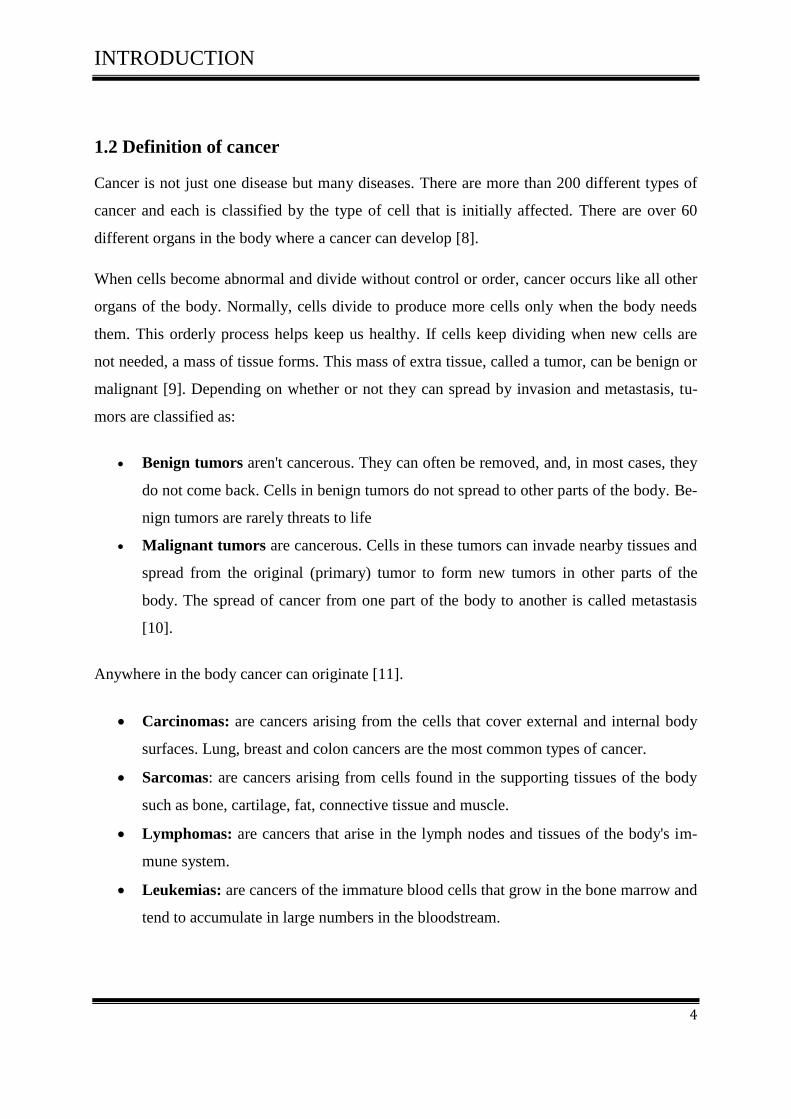
1.2 Definition of cancer
Cancer is not just one disease but many diseases. There are more than 200 different types of
cancer and each is classified by the type of cell that is initially affected. There are over 60
different organs in the body where a cancer can develop [8].
When cells become abnormal and divide without control or order, cancer occurs like all other
organs of the body. Normally, cells divide to produce more cells only when the body needs
them. This orderly process helps keep us healthy. If cells keep dividing when new cells are
not needed, a mass of tissue forms. This mass of extra tissue, called a tumor, can be benign or
malignant [9]. Depending on whether or not they can spread by invasion and metastasis, tu-
mors are classified as:
Benign tumors aren't cancerous. They can often be removed, and, in most cases, they
do not come back. Cells in benign tumors do not spread to other parts of the body. Be-
nign tumors are rarely threats to life
Malignant tumors are cancerous. Cells in these tumors can invade nearby tissues and
spread from the original (primary) tumor to form new tumors in other parts of the
body. The spread of cancer from one part of the body to another is called metastasis
[10].
Anywhere in the body cancer can originate [11].
Carcinomas: are cancers arising from the cells that cover external and internal body
surfaces. Lung, breast and colon cancers are the most common types of cancer.
Sarcomas: are cancers arising from cells found in the supporting tissues of the body
such as bone, cartilage, fat, connective tissue and muscle.
Lymphomas: are cancers that arise in the lymph nodes and tissues of the body's im-
mune system.
Leukemias: are cancers of the immature blood cells that grow in the bone marrow and
tend to accumulate in large numbers in the bloodstream.

INTRODUCTION
5
1.2.1 Carcinogenesis – The development of cancer
Every cancer and its carcinogenesis are unique; cancers usually develop over years and some-
times decades until they become clinically overt. During this time they gradually develop
from normal cells into neoplastic lesions. Nevertheless most cancers share common features
and progress by similar steps [12].
A genomic alteration is often preceded by hyperplasia of the tissue, caused by deregulation
and increased cell proliferation. However, there are no DNA mutations. Hyperplasia is mostly
induced by inflammation. It can develop into a neoplasia but it can also regress in order to
become normal tissue again. Once a cell acquires a persistent genomic alteration the carcino-
genesis can become irreversible (Fig 4) [12].
Fig 4 - Molecular basis of cancer [12]

INTRODUCTION
6
According to present knowledge the process of a normal cell turning into a cancer cell appears
arbitrary.
Cancer is caused by both internal factors (including inherited mutations, hormones, immune
conditions, and mutations that occur from metabolism) and external factors (including tobac-
co, infectious organisms, chemicals, and radiation). These causal factors may act together or
in sequence to initiate carcinogenesis [13].
Mutations occur rarely and randomly. An accumulation of mutations within oncogenes, tumor
suppressor genes, apoptosis related genes or DNA repair genes is very improbable. Most cells
will die off or remain at an early stage of carcinogenesis. Several factors can promote the car-
cinogenesis. Hereditary predisposition, such as mutations in DNA repair genes, exposition to
carcinogenic substances, ionizing radiation or certain retroviruses can lead to an increased
mutation frequency. Once a cell has acquired enough mutations to become a tumor cell, it will
be driven by selective pressure into increased malignancy [12].

INTRODUCTION
7
1.3 Colorectal cancer
Colorectal cancer (CRC) develops in the colon or the rectum. The colon is the part of the di-
gestive system where the waste material is stored and fluids as well as electrolytes are being
resoled. The rectum is the end of the colon adjacent to the anus. Together, they form a long,
muscular tube called the large intestine (also known as the large bowel) [14].
Fig 5- The anatomy of the gastrointestinal tract [14]
The colon is divided into five sections: caecum and ascending, transverse, descending, and
sigmoid. The rectum forms the most distal portion of the large intestine [14]
Colorectal cancer may occur at any age, more than 90% of the patients are over age 40, at
which point the risk doubles every ten years. In addition to age, other high risk factors include
a family history of colorectal cancer and polyps and a personal history of ulcerative colitis,
colon polyps or cancer of other organs, especially of the breast or uterus [15].The etiology of
CRC is complex involving an inter-play of environmental and genetic factors. Some other risk
factors enhancing the likelihood of CRC are obesity, sedentary lifestyle and smoking [16].

INTRODUCTION
8
There are three variants of CRC, two of which are hereditary [17].
FAP (familial adenomatous polyposis) is a hereditary colon cancer syndrome where
the affected family members will develop countless numbers (hundreds, sometimes
thousands) of colon polyps, starting during early adulthood. FAP is accounting for an
estimated 1% - 2% of incident cases of colorectal cancer.
HNPCC (hereditary nonpolyposis colon cancer) is a hereditary colon cancer syn-
drome. Affected family members can develop colon polyps and cancers. It accounts for
3% of incident cases of colorectal cancer.
Sporadic cancer is the third variant and counts for the majority of cases (about 80%).
Fig 6- Family risk settings in colon cancer

INTRODUCTION
9
1.3.1 Carcinogenesis of colorectal cancer
The carcinogenesis of colorectal cancer is intensely studied. In 1990, Fearon and Vogelstein
proposed a model for describing the genetic tumor progression in CRC [18]. Vogelstein et al
postulated that alterations of oncogenes (K-ras) and proto-oncogenes (APC, DCC, p53) are
required for the development of colorectal cancers [19, 20]. Mutation of the tumor suppressor
APC, a key protein in the Wnt signaling pathway, is suggested as the start of CRC. Likewise
this mutation was presumed to be the cause of the hereditary variant FAP (familial adenoma-
tous polyposis) of CRC.
Transition from adenoma to dysplastic tissue may be caused by several genetic changes as
well as changes in the adenoma microenvironment. KRAS activation due to mutation is found
in 40-50% of adenomas and carcinomas and leads to a constant signal to the nucleus for divi-
sion [21]. A mutation that occurs in the majority of CRC cases appears in the tumor suppres-
sor p53 gene which is responsible for regulation of cell cycle in Wild type [22]. Another well-
known mutation is in the DCC gene (deleted in colorectal carcinoma). The DCC protein has a
possible roll in cell-environment interactions [23]. The different phases of colon cancer pro-
gression are described by Markowitz SD and Bertagnolli MM (Fig.7) [24].
Fig 7- Biological and genetic events during colon cancer [24].

INTRODUCTION
10
1.3.2 Classification and staging of colon cancers
Classification according to Dukes was first proposed by Dr. C.E. Dukes in 1932 and describes
the stages of colorectal cancer as: A – tumor confined to intestinal wall, B – tumor invading
through the intestinal wall, C – with lymph node (s) involvement and D – with distant metas-
tasis [25]. The most common current staging system is the TNM (Tumors/Nodes/Metastases)
system [26]. Dukes staging was used in the present work and can be converted to approximate
TNM staging (Table 1).
Dukes TNM
A T1/T2; N0; M0
B T3/T4; N0; M0
C Tx; N1/N2; M0
D Tx; Nx; M1
Table 1- Relationships between Dukes staging and TNM classification.
The central aim of the TNM system for classification is the unambiguous description of tu-
mors and cancers in respect to their histopathology and anatomical extent [27].
The TNM system is based on three components:
The extent of the primary tumor (T)
The absence or presence and extent of regional lymph node metastasis (N)
The absence or presence of distant metastasis (M)
INTRODUCTION
11
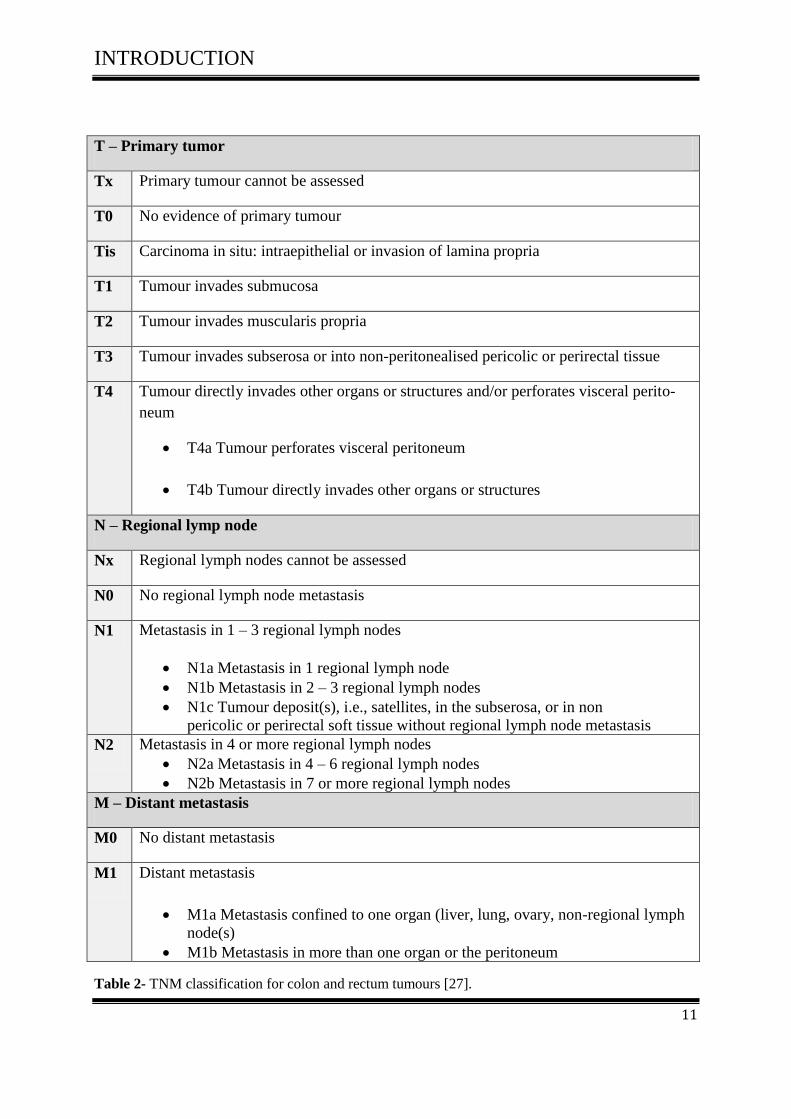
T – Primary tumor
Tx Primary tumour cannot be assessed
T0 No evidence of primary tumour
Tis Carcinoma in situ: intraepithelial or invasion of lamina propria
T1 Tumour invades submucosa
T2 Tumour invades muscularis propria
T3 Tumour invades subserosa or into non-peritonealised pericolic or perirectal tissue
T4 Tumour directly invades other organs or structures and/or perforates visceral perito-
neum
T4a Tumour perforates visceral peritoneum
T4b Tumour directly invades other organs or structures
N – Regional lymp node
Nx Regional lymph nodes cannot be assessed
N0 No regional lymph node metastasis
N1 Metastasis in 1 – 3 regional lymph nodes
N1a Metastasis in 1 regional lymph node
N1b Metastasis in 2 – 3 regional lymph nodes
N1c Tumour deposit(s), i.e., satellites, in the subserosa, or in non
pericolic or perirectal soft tissue without regional lymph node metastasis
N2 Metastasis in 4 or more regional lymph nodes
N2a Metastasis in 4 – 6 regional lymph nodes
N2b Metastasis in 7 or more regional lymph nodes
M – Distant metastasis
M0 No distant metastasis
M1 Distant metastasis
M1a Metastasis confined to one organ (liver, lung, ovary, non-regional lymph
node(s)
M1b Metastasis in more than one organ or the peritoneum
Table 2- TNM classification for colon and rectum tumours [27].

INTRODUCTION
12
According to UICC (International Union against Cancer) patients can be grouped into clinical
stages, which have similar clinical characteristics and shared prognosis (Table 3)
Table 3- Stage grouping for colon and rectum tumours according to UICC [27].
Stage grouping (according to UICC)
Stage 0 Tis N0 M0
Stage 1 T1, T2
N0 M0
Stage 2 T3, T4
N0 M0
Stage 2a T3
N0 M0
Stage 2b T4a
N0 M0
Stage 2c T4b
N0 M0
Stage 3 Any T
N1,N2 M0
Stage 3a T1, T2
T1,
N1
N2a
M0
Stage 3b T3, T4a
T2,T3
T1,T2
N1
N2a
N2b
M0
Stage 3c T4a
T3,T4a
T4b
N2a
N2b
N1,N2
M0
Stage 4a Any T Any N
M1a
Stage 4b Any T Any N
M1b

INTRODUCTION
13
The primary tumors are also regularly characterised by their histopathological grading (G)
which characterises cell differentiation of the cancer cells (Table 4).
G – Histopathological grading
G1 Well differentiated
G2 Moderately differentiated
G3 Poorly differentiated
G4 Undifferentiated
Table 4- Histopathological grading for colon and rectum tumors [27].

INTRODUCTION
14
1.4 Chemokines and their structure
1.4.1 What are chemokines?
More than 200 Cytokines are a category of signaling molecules which are important in inter-
cellular communication and regulate cell proliferation, differentiation, maturation and death
[28, 29, 30].
The general cytokine network includes several cytokine families (lymphokines, interleukins,
chemokines) that can be classified in terms of ligand and receptor structure, although most
cytokines have little homology in their DNA or amino acid sequence. One exception to this is
the family of chemoattractant cytokines or chemokines. With approximately 50 closely relat-
ed members and at least 19 receptors, chemokines are now the largest known cytokine family
[28, 29, 30].
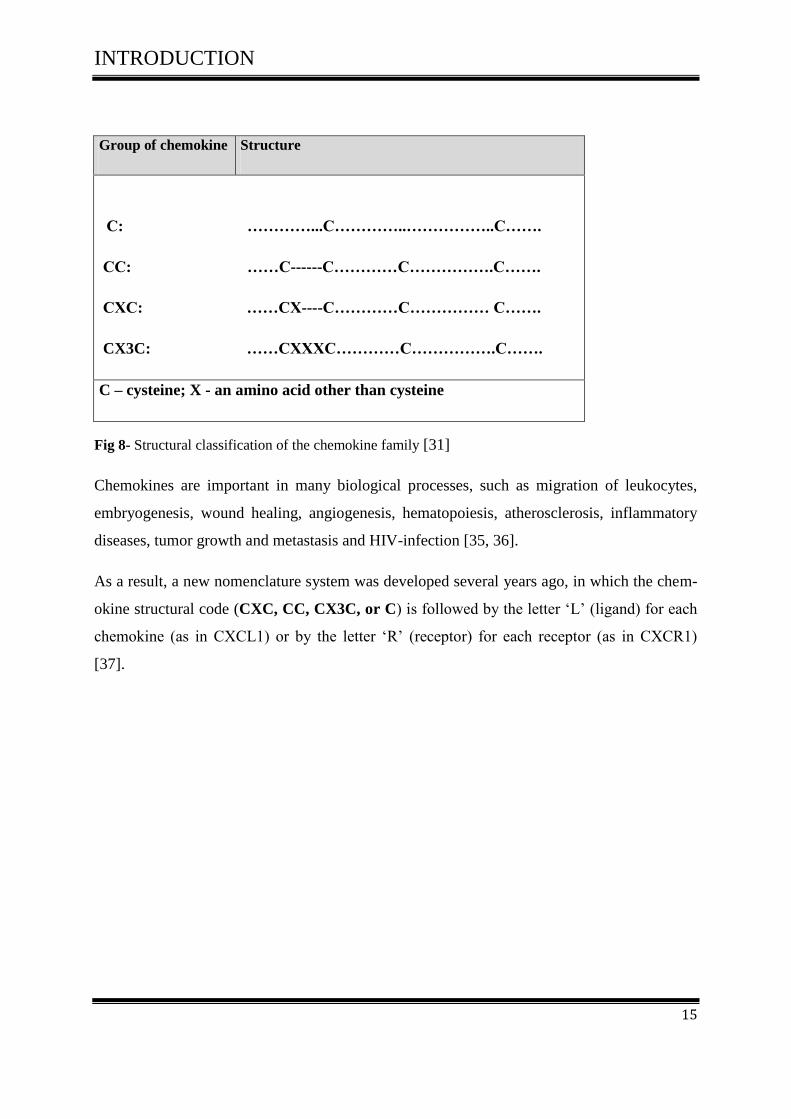
1.4.2 Chemokine structure and nomenclature
Chemokines are a superfamily of chemoattracting cytokine like protein (8-14 kDa), which
bind to their cognate G-protein coupled receptors (GPCRs). It consists of approximately 70-
130 amino acids and they are classified into four subfamilies CXC, CC, CX3C and C.
Chemokines are based on the positioning of the served two N-terminal cysteine residues of
the chemokines. (Fig 8) [31]
The CXC is known as α chemokine that has one amino acid present in between the
first two cysteine residues near the amino or N-terminus.
The CX3C is known as δ chemokine that has three amino acid residues between the
first and second cysteines near the N-terminus
The CC is known as β chemokines. The first two cysteines are adjacent to each other,
near the Nterminus, which are the largest families of chemokines.
The C is known as γ chemokines. The fourth chemokine subtype lacks two (the first
and third) of the four conserved cysteine residues [32, 33, 34].
INTRODUCTION
15
Group of chemokine Structure
C: …………...C…………..……………..C…….
CC: ……C------C…………C…………….C…….
CXC: ……CX----C…………C…………… C…….
CX3C: ……CXXXC…………C…………….C…….
C – cysteine; X - an amino acid other than cysteine
Fig 8- Structural classification of the chemokine family [31]
Chemokines are important in many biological processes, such as migration of leukocytes,
embryogenesis, wound healing, angiogenesis, hematopoiesis, atherosclerosis, inflammatory
diseases, tumor growth and metastasis and HIV-infection [35, 36].
As a result, a new nomenclature system was developed several years ago, in which the chem-
okine structural code (CXC, CC, CX3C, or C) is followed by the letter ‘L’ (ligand) for each
chemokine (as in CXCL1) or by the letter ‘R’ (receptor) for each receptor (as in CXCR1)
[37].

INTRODUCTION
16
Table (5) list of the chemokines identified to date together with their synonyms and official
names.
Systematic names
Common names
Chemokine receptor
CXCL1 GROα, MGSAα CXCR2
CXCL2 GROβ, MIP-2α CXCR2
CXCL3 GROγ, MIP-2β CXCR2
CXCL4 Platelet factor-4 Unknown
CXCL5 ENA-78 CXCR2
CXCL6 GCP-2 CXCR1
CXCL7 PBP, βTG CXCR2
CXCL8 IL-8 CXCR1
CXCL9 Mig CXCR3
CXCL10 γYP-10, CRG-2 CXCR3
CXCL11 I-TAC, IP9, H174 CXCR3
CXCL12 SDF-1α, -1β, -1γ, - 1δ ,-1ε , -1ϕ CXCR4, CXCR7
CXCL13 BCA-1, BLC CXCR5
CXCL14 BRAK, Bolekine Unknown
CXCL16 STRC33, BUNZO CXCR6
CCL1 I-309, TCA-3 CCR8
CCL2 MCP-1, MCAF CCR11
CCL3 MIP-1α CCR1, CCR5
CCL4 MIP-1β CCR5
CCL5 RANTES CCR1, CCR3, CCR5
CCL6 GCP-2 Unknown
CCL7 MCP-3 CCR1, CCR2, CCR3, CCR11
CCL8 MCP-2 CCR1, CCR2, CCR3, CCR5
CCL11 Eotaxin CCR3
CCL13 MCP-4 CCR1, CCR2, CCR3, CCR11
CCL14 CC-1, HCC-1, MCIF CCR1
CCL15 HCC-2, MIP-5 CCR1, CCR3
CCL16 HCC-4, LEC CCR1
CCL17 TARC CCR4
CCL18 MIP-4, PARC, AMAC-1 Unknown
CCL19 MIP-3β, ELC, exodus-3 CCR7
CCL20 MIP-3α, LARC, exodus1 CCR6
CCL21 SLC, exodus-2, TCA4 CCR7
CCL22 MDC, de/ β-ck CCR4
CCL23 MPIF-1, MIP CCR1
CCL24 MPIF-2, eotaxin-2 CCR3
CCL25 TECK CCR9
CCL26 eotaxin-3, MIP-4α CCR3
CCL27 CTACK, ALP, ILC CCR10
CCL28 MEC CCR3, CCR10
XCL1 Lymphotactin α, SCM-1α XCR1
XCL2 Lymphotactin β, SCM-1β XCR1
CX3CL1 Fractalkine CX3R1
Table 5- chemokines and chemokine receptors

INTRODUCTION
17
1.4.3 Chemokine receptors
The chemokine receptors are seven-transmemberane receptors coupled to G protein, which
include receptors for hormones, neurotransmitters, paracrine substances and inflammatory
mediators. There are four classes of chemokine receptors CXCR1, CCR1, XCR1 and
CX3CR1 [38, 39].
The human chemokine system currently contains more than 50 human chemokines and 20
chemokine receptors [33] (Table 6) (Fig 9).
Chemokine receptor
Chemokine ligand
CXCR1
CXCR2
CXCR3
CXCR4
CXCR5
CXCR6
CXCR7
CXCL6, CXCL8
CXCL1, CXCL2, CXCL3, CXCL5, CXCL6, CXCL7, CXCL8
CXCL4, CXCL9, CXCL10, CXCL11
CXCL12
CXCL13
CXCL16
CXCL11, CXCL12,
CCR1
CCL2,
CCR3
CCR4
CCR5
CCR6
CCR7
CCR8
CCR9
CCR10
CCL3, CCL4, CCL5, CCL7, CCL8, CCL9/CCL10, CCL14, CCL15, CCL16, CCR2
CCL6, CCL7, CCL8, CCL12, CCL13, CCL16
CCL7, CCL8, CCL11, CCL13, CCL15, CCL24, CCL26, CCL28
CCL3, CCL5, CCL17, CCL22
CCL3, CCL4, CCL5, CCL8, CCL13, CCL16
CCL20
CCL19, CCL21
CCL1, CCL16
CCL25
CCL27, CCL28
XCR1
XCL1, XCL2
CX3CR1
CX3CL1
The Duffyreceptor is not included in this table– this is a non-signalling receptor
Table 6- The four classes of chemokine receptors and their ligands* (some chemokines may bind oth-
er receptors) [39]

INTRODUCTION
18
Among the 7 receptors that selectively bind certain CXC chemokines are the chemokine re-
ceptors CXCR1 to CXCR7, whereas the CC receptor family consists of 10 receptors, CCR1 to
CCR10.
The receptor for CX3CL1 (fractalkine) is CX3CR1, and XCR1 is the receptor for XCL1 and 2
(lymphotactin). Another chemokine receptor, known as the Duffy antigen receptor for chem-
okines (DARC) which has been shown to bind to both CXC and CC chemokines. Yet, this is
a non-signalling receptor, as no function has been observed on chemokine ligand binding.
Each receptor is able to bind to more than one chemokine and each chemokine was shown to
be able to use more than one receptor [38, 39, 40].
Fig 9- Chemokine family and their cognate receptors (some chemokines may bind other receptors)
[40]

INTRODUCTION
19
1.4.4 Chemokine receptor signalling
Both chemokine and chemokine receptor signalling have been described as modulators of
metastasis and anoikis in several cancers, respectiely [41].
The specific effects of chemokines on their target cells are mediated by members of a family
of 7-transmembrane-domain, G-protein-coupled receptors that elicit intracellular signalling
primarily through Gαi heterotrimeric protein complexes.
Chemokine receptors are activated by heterotrimeric protein complex functioning through
exchange of guanosine diphosphate (GDP) for guanosine triphosphate (GTP) leading to the
dissociation of the Gα and Gβγ subunits to establish two unique signalling circuits. The Gα
subunit thus can inhibit adenylcyclase activity and formation of the second messenger cAMP.
The process on intracellular calicum adoption is steered by the Gβγ dimeric complex that
causes phospholipase C (PLC) activation and formation of both inositol triphospate (IP3) and
diacylglyceral (DAG), resulting in mobilization of intracellular calcium (Fig10). The G
protein subunit propel likewise other pathways such as mitogen activated protein kinase
(MAPK) and PI3K pathways [42,43].
Chemotaxis is partly coordinated through activation of focal adhesion proteins and Rho
family members such as Rho and Rac. CXC1L2 mediated activation of Rho take a leading
role for polarizing acting filaments which is essential for intestinal epithelial cell migration
[44].
Activation and desensitization of chemokine receptor signalling typically occurs through
intracellular phosphorylation of serine residues at the C-terminus by G-protein receptor
kinases (GRKs) after ligand binding [45]. This process is typically mediated through β
arrestin and clatherin dependent endocytosis [46].
A new family of chemokine receptors is called scavenger or a typical receptors. These
receptors include members D6 [47] and DARC [48]. They tend to be promiscuous and bind
several chemokine ligands.
Yet, chemokine binding to these receptors does not entice cellular chemotaxis or activate
calcium flux [49].

INTRODUCTION
20
(Fig10). Represents some of the key signalling pathways throught to be involved in CXCR4
signal transduction. The binding of chemokine CXCL12 to chemokine receptor CXCR4
initiates divergent signalling pathway downstream of ligand binding, which can result in a
variety of responses including chemotaxis, cell proliferation, and survival, increase
intracellular calcium and gene transcription [50].
Fig10- A schematic of the CXCL12/CXCR4 intracellular signal transduction pathways [50].
INTRODUCTION
21
1.5 CXCL12 and its receptors
Stromal cell-derived factor 1 (SDF-1) or CXCL12, also known as Pre-B-cell growth stimulat-
ing factor (PBSF), is a small cytokine belonging to the CXC subfamily [51]. The receptors for
chemokine CXCL12 are CXCR4 and CXCR7.
1.5.1 CXCR4
CXCR4 is seven-span transmembrane G-protein-coupled receptor (GPCRs) that binds the
ligand CXCL12. CXCR4 was initially discovered as an orphan receptor called fusin or
LESTR. It serves as a co-receptor for entry of T-tropic HIV viruses that target CD4+ T cells
[40].
CXCR4 is widely expressed on many cell types, including the immune and the central nerv-
ous systems, and can mediate migration of resting leukocytes and hematopoietic progenitors
in response to CXCL12 functioning in a number of physiological processes [40]. CXCR4 is
over-expressed in many human cancers, including breast cancer, ovarian cancer, melanoma,
and prostate cancer (PCa) [52].
It is known from several studies that the interaction between SDF-I and its receptor CXCR4
promotes angiogenesis and the migration of cancer cells into the metastatic sites in many can-
cers like breast [53], lung [54], ovarian [55], renal [56], prostate [57], neuroblasoma [58],
These CXCR4 expressing tumors preferentially spread to tissues that express CXCL12/SDF-1
highly, including lung, liver, lymph nodes and bone marrow [59].
1.5.2 CXCR7/RDC-1
CXCL12 binds to another seven transmembrane span receptor named CXCR7 (or RDC-1)
[60]. CXCR7 is expressed in a number of cells including endothelial cells, T lymophocytes,
dendritic cells, B cells, chondrocytes, and endometrial stromal cells [61]. CXCR7 is also ex-
pressed in tumor cells that can produce a proliferative effect. Thus, SDF-1 can modulate the
migrational capacity of tumor cells and CXCR7 can enhance tumor growth [62].

INTRODUCTION
22
1.6 Biology of SDF-1
1.6 .1 SDF-1 (CXCL12) and human tumor microenviroment
The chemokine CXCL12 (SDF-1) is a small protein (8-14 KDa) that regulates leukocyte traf-
ficking and is variably expressed in a number of normal and cancer tissues such as BM, heart,
liver, kidney, thymus, spleen, skeletal muscle and brain [51,63].
Many essential biological processes are regulated by the chemokine stromal cell derived fac-
tor-1(CXCL12/SDF-I), including cardiac and neuronal development, stem cell motility, neo-
vascularization and tumorgenesis [64-68].
It is known from several studies that multiple modes of action are implicated in CXCL12-
mediated tumor pathogenesis; CXCL12 promotes tumor growth and malignancy, enhances
tumor angiogenesis, participates in tumor metastasis, fosters an immunosuppressive network
within the tumor microenvironment and mediates tumor cell adhesion, migration and inva-
sion, myeloid dendritic cells (mDC) and plasmacytoid dendritic cells ( pDC) (Fig11).
Fig 11- CXCL12 plays multiple roles in tumor biology [69]

INTRODUCTION
23
1.6.2 Molecular Structure of SDF-1 Splice variants
SDF-1 proteins are found in living organisma as monomers, being expressed in six isoforms
(SDF-1 alpha, beta, gamma, delta, epsilon und theta) all sharing the same first three exons
except exon 4 in each case stems from different regions of the human SDF-1 gene [70]. The
CXCL12 gene is mapped on chromosome 10 whereas most of the other genes encoding CXC
chemokines are situated on chromosome 4. Fig12 shows the exon/intron structures of those
different SDF-1 isoforms [71, 72, 73].
The analysis of the genomic structure of SDF-1 in human and mouse revealed two isoforms,
SDF-1α and SDF-1β. These two isoforms arise from a single gene through alternative splicing
[72, 73, 74].
The functional diversity and differential proteolytic processing abilities of these two
isoforms are well investigated and characterized: SDF-1α is 270 base-pairs long and encodes
a 89 amino acid protein; likewise SDF-1β is 282 base-pairs long and encodes a 93 amino acid
protein, of which the first 89 amino acids are identical to that of SDF-1α except for the last
four amino acids of SDF-1β, which are absent in SDF-1α [70,71,72,73].
It was later revealed that a third splice variant SDF-1γ, 361 base-pairs long, encodes a 119
amino acid proteins. The first three exons of SDF-1γ are identical with SDF-1α and SDF-1β
but use a different fourth exon [73]. The fourth exon is located 3200 bp downstream from the
third exon on the SDF-1 gene locus and is situated between the third exon and the fourth exon
of SDF-1β. It has a polyadenylation signal sequence and a poly-A stretch. Thus, human SDF-
1γ may represent the human ortholog of rat SDF-1γ. Yet, human SDF-1γ mRNA has a much
shorter 3′ untranslated region (UTR). SDF-1γ is expressed in adult rat brain, heart and lung
with the strongest expression observed in heart [70, 75].
SDF-1δ is a fourth alternative splicing isoform, 423 base-pairs long and encodes an 140 ami-
no acid proteins. It is alternatively spliced in the last codon of the SDF-1α open reading frame
(ORF), leading to a 731 base-pair intron, with the terminal exon of SDF-1α being split into
two. Human SDF-1δ shares the same 3′ UTR and polyadenylation signal sequence as human
SDF-1α. The deduced AA sequence of human SDF-1δ predicts a peptide of 140 AA. The first
89 AA are identical with SDF-1α, the C-terminal additional 51 AA are unique [73].

INTRODUCTION
24
Human SDF-1ε cDNA is a fifth splice isoform, 273 base-pairs long, and human SDF-1ϕ
cDNA is a sixth splice isoform 303 base-pairs long, encoding a 90 amino acid protein and a
SDF-1ϕ 100 amino acid protein respectively [73].
The first three exons of SDF-1ε and SDF-1ϕ are identical with SDF-1β and SDF-1γ isoforms.
The SDF-1ε and SDF-1ϕ mRNAs have very similar genomic organization, with the fourth
exon located approximately 81 kilobase-pairs downstream form the third exon. SDF-1ε and
SDF-1ϕ differ by 7 bp in the ORF of the fourth exon via the use of an alternative splicesome
acceptor site. [73] .
Fig 12- Genomic structures of human SDF-1 splice variants [71]
Fig (13) Predicted amino acid sequences of CXCL12 splice variants. Capital letters indicate
amino acids conserved between the splice variants. Lowercase letters indicate divergent ami-
no acids at the carboxyl termini of the splice variants. The underlined sequences are BBXB
domains. The numbers to the right indicate the number of amino acids in each variant.

INTRODUCTION
25
All splice sites conform to the predicted consensus motif for splice in some recognition sites
(GU for donor sites and AG for acceptor sites). The predicted amino acid sequences of all
human SDF-1 isoforms are aligned and compared in Fig.13 [73, 76].
Fig 13- The predicted amino acid sequences of human SDF-1 splice variants [73].

OBJECTIVE OF THE STUDY
26
1.7 Objective of the study
The chemokine CXCL12 and its receptor CXCR4 have been implicated in cancer metastasis
of many different neoplasms. The major function of this chemokine is to regulate hematopoi-
etic cell trafficking and secondary lymphoid tissue architecture. The potential role of the nov-
el CXCL12 splice variants (SDF-1α, SDF-1β, SDF-1γ, SDF-1δ, SDF-1ε and SDF-1θ) axis in
cancer development and function is not well understood. Besides that, the pathophysiological
role of CXCL12 variants in colorectal cancer progression is needed to be elucidated. The pre-
sent study aimed to determine the role of the novel CXCL12 variants (SDF-1α, SDF-1β, SDF-
1γ, SDF-1δ, SDF-1ε and SDF-1θ) in the developmental processes of tumor formation, im-
mune invasion and pathophysiological mechanisms of carcinogenesis. This prompted us to
investigate expression, signal transduction and specific functions of the chemokine CXCL12
splice variants in CRC cells by using different experimental systems, animal’s models, human
in vitro systems and biopsy material derived from colorectal carcinoma patients.

MATERIALS AND METHODS
27
2 Materials and Methods
2.1 Chemical materials
Product Manufacturer
Albumin Fraction Carl Roth GmbH+Co.KG, Germany
AMD3100 Sigma , Germany
Anti-biotic-Anti mycotic Invitrogen , U.S.A.
CellTiter-Glo Promega, U.S.A.
Dimethylsulfoxid Carl Roth GmbH+Co.KG, Germany
D PBS Puffer Invitrogen, U.S.A.
Fetal Bovine Serum Invitrogen, U.S.A.
Fibronectin,Human Invitrogen, U.S.A.
FUJI Medical X-Ray Film, Super RX, 18x24 FUJI Film, Japan
Geneticin (G418) Invitrogen, U.S.A.
Lipofectamine2000 Invitrogen, U.S.A.
Loading Dye solution Fermentas, U.S.A.
NuPAGE® 10% Bis-Tris-Gel 1,0 mm,12well Invitrogen, U.S.A.
NuPAGE® MES SDS Running Buffer Invitrogen, U.S.A.
NuPAGE® Tris-Acetat SDS Running Buffer Invitrogen, U.S.A.
Propidium iodide solution Sigma-Aldrich,Germany
RNeasy Mini-Kit Qiagen, Germany
Roti-Block Lösung Carl Roth GmbH+Co.KG, Germany
Roti-Blot A Anodenbuffer 10x Carl Roth GmbH+Co.KG, Germany
Roti-Blot K Kathodenbuffer 10x Carl Roth GmbH+Co.KG, Germany
Roti-Lumin Carl Roth GmbH+Co.KG, Germany

MATERIALS AND METHODS
28
Product Manufacturer
Roti-PVDF Carl Roth GmbH+Co.KG, Germany
RPMI 1640 Invitrogen, U.S.A.
Taq PCR Core Kit Qiagen, Germany
Triton X-100 Carl Roth GmbH+Co.KG, Germany
Trypsin-EDTA PAA Laboratories GmbH, Austria
Trypan Blue Solution 0.4% Sigma , Germany
Haemotoxylin Merck , Germany
100bpDNA Ladder Invitrogen, U.S.A.
50bpDNA Ladder Invitrogen, U.S.A.
Table 7- List of Chemical materials which have used in completion of this study

MATERIALS AND METHODS
29
2.1.2 Devices
Device Manufacturer
AE21 microscope Motic, Germany
Bio photometer Eppendorf, Germany
Bio fuge fresco Heraeus, Germany
Biological Safety Cabinets Nuaire, Germany
Curix 60 AGFA, Belgium
Duomax 1030 Heidolph, Germany
Electrophoresis Power Supply (EV231) Consort, Germany
Fastblot B32 Biometra, Germany
FACS Vantage SE BD, Germany
FluroScan Thermo Fisher Scientifc, Germany
Gel Doc EZ Imager BioRAD, Germany
Rotanta/RP Hettich Zentrifugen, Germany
Thermo cycler PTC-200, Germany
Universal 320R Hettich Zentrifugen, Germany
Water bath Köttermann, Germany
X-Cell Surelock Gelkammer Invitrogen, U.S.A.
X-Omatic cassette Kodak, Germany
Table 8- List of Devices which have used in completion of this study
MATERIALS AND METHODS
30
2.1.3 Antibodies
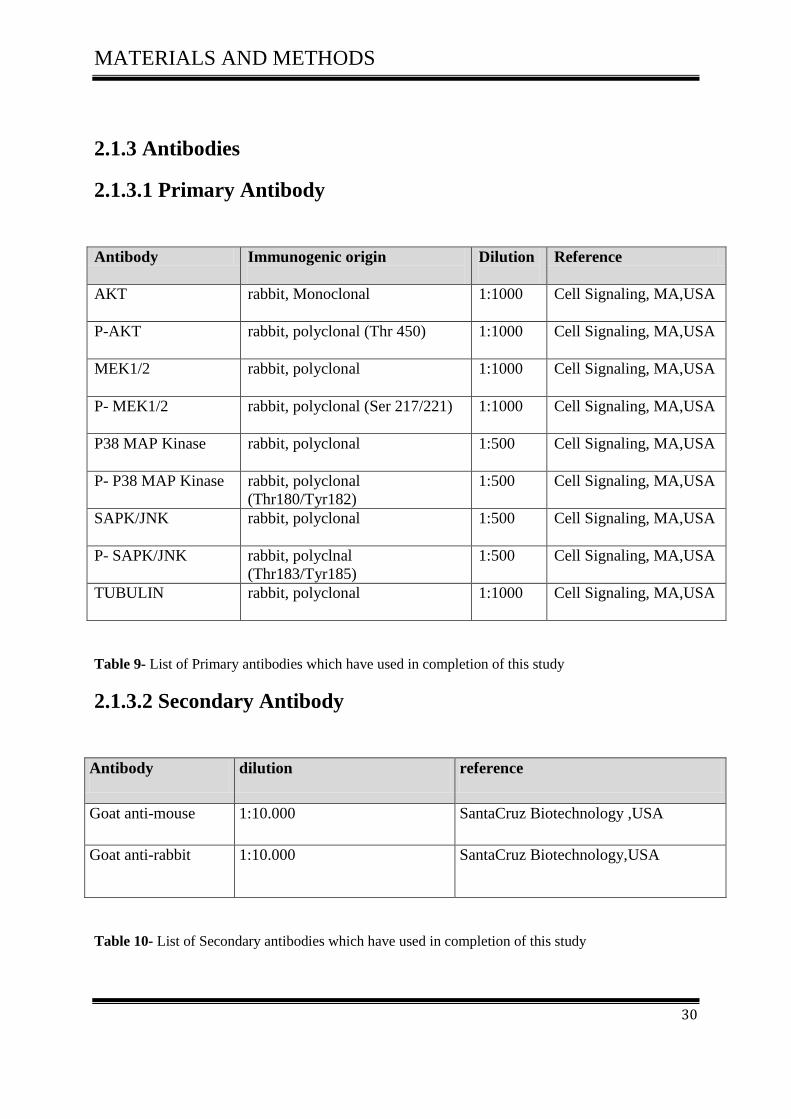
2.1.3.1 Primary Antibody
Antibody Immunogenic origin
Dilution
Reference
AKT rabbit, Monoclonal 1:1000 Cell Signaling, MA,USA
P-AKT rabbit, polyclonal (Thr 450) 1:1000
Cell Signaling, MA,USA
MEK1/2 rabbit, polyclonal 1:1000
Cell Signaling, MA,USA
P- MEK1/2 rabbit, polyclonal (Ser 217/221) 1:1000
Cell Signaling, MA,USA
P38 MAP Kinase rabbit, polyclonal 1:500 Cell Signaling, MA,USA
P- P38 MAP Kinase rabbit, polyclonal
(Thr180/Tyr182)
1:500
Cell Signaling, MA,USA
SAPK/JNK rabbit, polyclonal 1:500 Cell Signaling, MA,USA
P- SAPK/JNK rabbit, polyclnal
(Thr183/Tyr185)
1:500 Cell Signaling, MA,USA
TUBULIN rabbit, polyclonal
1:1000 Cell Signaling, MA,USA
Table 9- List of Primary antibodies which have used in completion of this study
2.1.3.2 Secondary Antibody
Antibody dilution reference
Goat anti-mouse 1:10.000 SantaCruz Biotechnology ,USA
Goat anti-rabbit 1:10.000 SantaCruz Biotechnology,USA
Table 10- List of Secondary antibodies which have used in completion of this study

MATERIALS AND METHODS
31
2.1.4 Cell lines
Cell line origin reference
SW-480
SW-620
Human colorectal adenocarcinoma
Human colorectal adenocarcinoma
ATCC, USA
ATCC, USA
D05
D14
Human melanoma cells
Human melanoma cells
ATCC, USA
ATCC, USA
Table11- List of Cell lines which have used in completion of this study
2.1.5 Plasmids & Vector
Plasmids & Vector Manufacturer
Plasmid SDFI alpha Intel chon, Germany
Plasmid SDFI beta Intel chon, Germany
Plasmid SDFI gamma Intel chon, Germany
Plasmid SDFI delta Intel chon, Germany
Plasmid SDFI epsilon Intel chon, Germany
Plasmid SDFI theta Intel chon, Germany
NT-GFP FusionTopo TA Expression
Kit.
Invitrogen, U.S.A.
Table12- List of Plasmids & Vector which have used in completion of this study
MATERIALS AND METHODS
32
2.1.6 Primers
The primers for DNA sequencing of all SDF1 plasmids were synthesized by the company
Eurofins MWG operon, Germany and delivered in a lyophilized state. The lyophilized oligo-
nucleotides were diluted in water to 50 μM or 50 pmol/μl concentrations and stored at -20 °C
for long term usage. The primers diluted to final working concentration of 5μM for PCR reac-
tions.
MATERIALS AND METHODS
33
2.2 Molecular Biological Methods
2.2.1 Tumor cell lines and culture conditions
The human colorectal adenocarcinoma cell line SW480 was initially isolated from the tissue
of a 50-year-old Caucasian. The SW620 cell line was established from a lymph node metasta-
sis taken from the same patient one year later.
The melanoma cell lines D05 and D14 were kindly provided by the laboratory of Prof. Wölfel
(Department of Tumor Immunological, III Medical Clinic and Polyclinic).
Tumor cell lines were grown in RPMI-1640 medium supplemented with 10% fetal calf serum,
100 Units/ml penicillin, 100 mg/ml streptomycin at 5% CO2 in a 37 °C humidified atmos-
phere. All cell culture work was performed aseptic in a sterile hood (Heraeus, Laminair). The
cells were passaged regularly and the media was changed every other day. In addition, the
cultures were checked routinely for infection with mycoplasma. The cells were frozen in a
media containing 90% FCS and 10% DMSO for long term storage in liquid nitrogen. A coul-
ter counter (Beckton Dickinson) was used for counting the cells. All cell lines were purchased
from the American Type Culture Collection (ATCC).
2.3 Polymerase Chain Reaction (PCR)
The polymerase chain reaction (PCR) technique was described in the mid 1980’s by Kary
Mullis and is used to amplify specific DNA sequences [77]. PCR is based on thermal cycling
where a cycle involves three steps: (1) denaturation of DNA/amp icons (PCR copies), (2) an-
nealing of template and primers, (3) extension of DNA. Two sequence specific oligonucleo-
tide primers are needed; one forward (P1) and one reverse (P2) to get the specific amplifica-
tion of the DNA sequence of interest. The primers bind to denatured DNA. Copies of the
DNA sequence are produced during extension in the presence of a heat-stable DNA polymer-
ase and deoxynucleoside triphosphates (dNTPs) [78] (Fig14).

MATERIALS AND METHODS
34
Fig 14- The polymerase chain reaction with denaturation of double stranded DNA followed by anneal-
ing with primers and extension [79]
2.3.1 Detection of CXCL12 gene polymorphism in CRC Patients by PCR-
RFLP
The present study was conducted 73 CRC patients of all stages. The aim of this work was to
study the CXCL12 polymorphisms at codon G801A by restriction fragment length polymor-
phism (PCR-RFLP) assay and to correlate them with the clinical presentation and tumor char-
acteristics.
The PCR reaction for amplification of CXCL12 G801A gene was performed according to the
method described by Dimberg et a l [80].
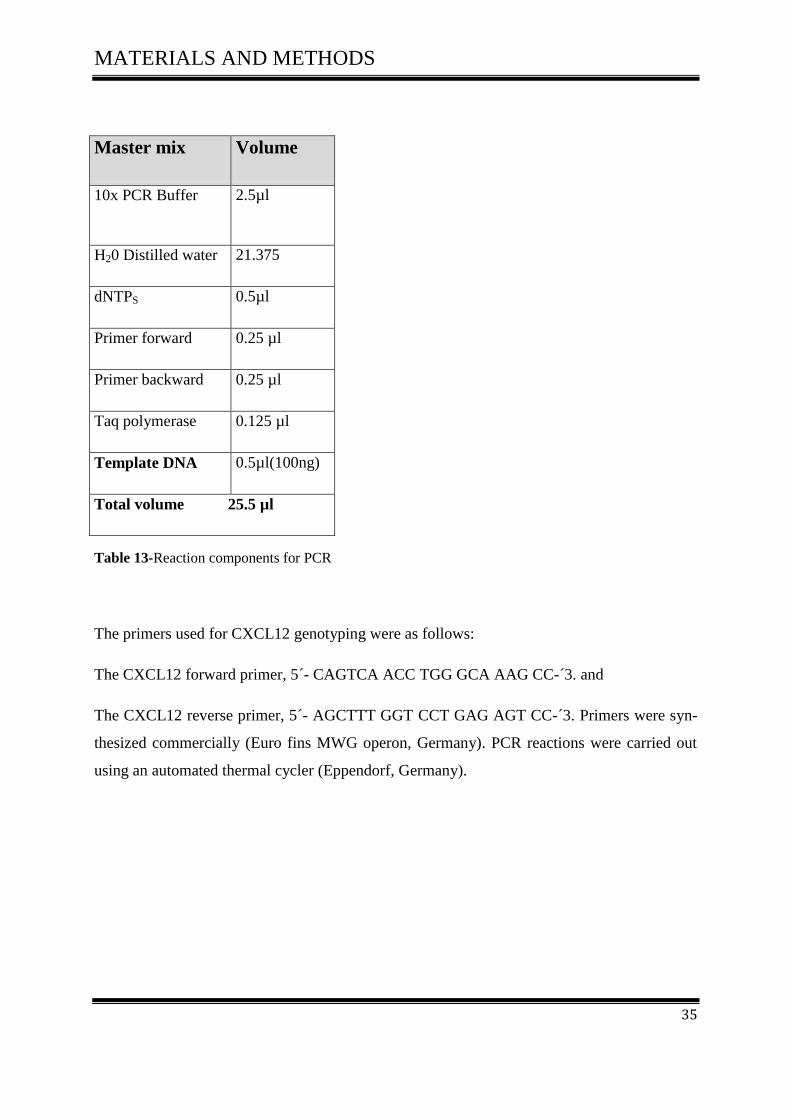
The master mix typically contained all of the components needed for PCR except the template
DNA, according to (Table 13).
MATERIALS AND METHODS
35
Master mix Volume
10x PCR Buffer 2.5µl
H20 Distilled water 21.375
dNTPS 0.5µl
Primer forward 0.25 µl
Primer backward 0.25 µl
Taq polymerase 0.125 µl
Template DNA 0.5µl(100ng)
Total volume 25.5 µl
Table 13-Reaction components for PCR
The primers used for CXCL12 genotyping were as follows:
The CXCL12 forward primer, 5´- CAGTCA ACC TGG GCA AAG CC-´3. and
The CXCL12 reverse primer, 5´- AGCTTT GGT CCT GAG AGT CC-´3. Primers were syn-
thesized commercially (Euro fins MWG operon, Germany). PCR reactions were carried out
using an automated thermal cycler (Eppendorf, Germany).
MATERIALS AND METHODS
36
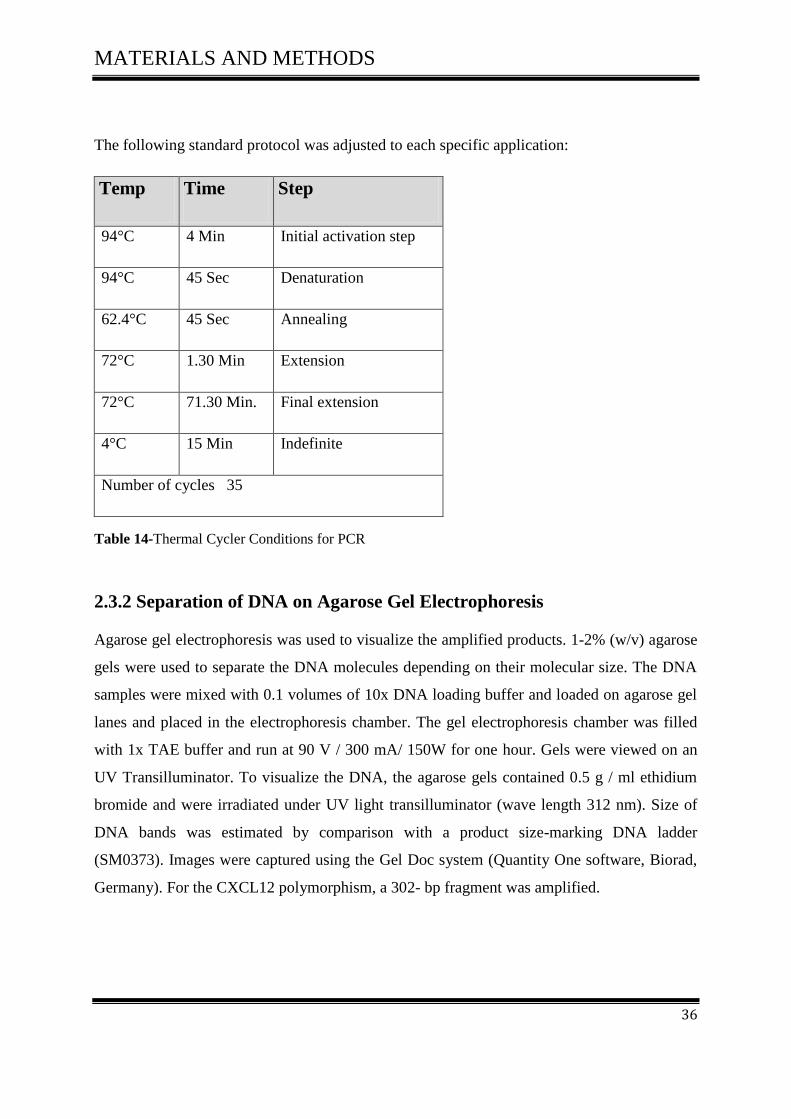
The following standard protocol was adjusted to each specific application:
Temp Time Step
94°C 4 Min Initial activation step
94°C 45 Sec Denaturation
62.4°C 45 Sec Annealing
72°C 1.30 Min Extension
72°C 71.30 Min. Final extension
4°C 15 Min Indefinite
Number of cycles 35
Table 14-Thermal Cycler Conditions for PCR
2.3.2 Separation of DNA on Agarose Gel Electrophoresis
Agarose gel electrophoresis was used to visualize the amplified products. 1-2% (w/v) agarose
gels were used to separate the DNA molecules depending on their molecular size. The DNA
samples were mixed with 0.1 volumes of 10x DNA loading buffer and loaded on agarose gel
lanes and placed in the electrophoresis chamber. The gel electrophoresis chamber was filled
with 1x TAE buffer and run at 90 V / 300 mA/ 150W for one hour. Gels were viewed on an
UV Transilluminator. To visualize the DNA, the agarose gels contained 0.5 g / ml ethidium
bromide and were irradiated under UV light transilluminator (wave length 312 nm). Size of
DNA bands was estimated by comparison with a product size-marking DNA ladder
(SM0373). Images were captured using the Gel Doc system (Quantity One software, Biorad,
Germany). For the CXCL12 polymorphism, a 302- bp fragment was amplified.

MATERIALS AND METHODS
37
2.3.3 Digestion of PCR product by specific restriction enzyme for detection
of CXCL12 gene polymorphism
The restriction enzyme digestion was performed by incubating double-stranded DNA mole-
cules with an appropriate amount of restriction enzyme in their respective buffer as recom-
mended by the supplier at optimal reaction temperature.
After amplification, the PCR products (302 bp) were digested at 37°C for one hour with 1 μl
MspI according toTable 15.
PCR Amplificate 15µl
PCR water 13µl
Tango buffer 2µl
MSPI Enzyme 1µl
Table 15- Reaction components for digestion
The digested products were visualized by electrophoresis on a 2% agarose gel (Oxoid Lim-
ited, Hampshire, UK) containing ethidium bromide (0.5 mg/ml).

MATERIALS AND METHODS
38
2.3.4 Expression of CXCL12 Splice Variants in human colorectal carcino-
ma and human normal mucosa
The expression of CXCL12 splicing variants (alpha, beta, gamma, delta, epsilon, and theta)
was analysed in 40 colorectal tumour and 20 human mucosa cDNA samples.
PCR reactions contained all of the components needed for PCR and the template cDNA from
colorectal carcinoma and normal mucosa, as described in Table 16.
Master mix Volume
10x PCR Buffer 2.5µl
H20 Distilled water 21.375
dNTPS 0.5µl
Primer forward 0.25 µl
Primer backward 0.25 µl
Taq polymerase 0.125 µl
Template DNA 0.5µl(100ng)
Total volume 25.5 µl
Table 16- Reaction components for PCR
In order to determine the expression patterns of the human SDF-1 isoforms in colorectal and
mucosa tissues, we designed PCR primers (Table 17) that could detect each SDF-1 isoform
specifically. We used beta-actin as control for our samples. PCR reactions were carried out
using an automated thermal cycler (Eppendorf, Germany).

MATERIALS AND METHODS
39
Gene Primer Sequence Temp. Cycles
SDF1alpha
for: 5'-ATGAACGCCAAGGTCGTGGTC-3'
rev: 5'-AAGTGCTTACTTGTTTAAAGCTTTCTC -3'
60.8°C 38
SDF1beta
for: 5'-ATGAACGCCAAGGTCGTGGTC-3'
rev: 5'-ACCCTCTCACATCTTGAACCTCTT -3'
61.3°C 38
SDF1gamma
for: 5'-ATGAACGCCAAGGTCGTGGTC-3'
rev: 5'-AGATAACTAGTTTTTCCTTTTCTGGGC -3'
61.2°C 38
SDF1delta
for: 5'-ATGAACGCCAAGGTCGTGGTC-3'
rev: 5'-ACACCATTACACATCCCCAGGAGA -3'
61.8°C 38
SDF1epsilon
for: 5'-CGCCATGAACGCCAAGGTCGTGGTCG -3'
rev: 5'-CTAATTACTTCAGTGGCAGATCATAC -3'
62°C 38
SDF1theta
for: 5'-CGCCATGAACGCCAAGGTCGTGGTCG -3'
rev: 5'-CACACTAATTACTTCAGTGGCAGATC -3'
62°C 38
B-actin
for: 5'-GAGAAGCTGTGCTACGTCGCCC -3'
rev: 5'-TGCTCGCTCCAACCGACTGCTG -3'
58°C
20
Table 17- Sequences of primers used in PCR assay
2.4 RNA Isolation and Semiquantitative Reverse Transcription-PCR
2.4.1 RNA extraction from Cell lines
RNA isolation was performed using the RNeasy Mini Kit according to the manufacturer’s
recommendations (Qiagen, Germany).
Cells were grown to 70-80% confluence in a cell culture flask and were harvested by tryp-
sinisation and subsequently lysed with a mixture of B-mercaptoethanol and RLT buffer
(guanidine isothiocynate GITC-containing lysis buffer). The latter is highly denaturing and
immediately inactivates RNeases to ensure isolation of intact RNA. The cell lysate was ho-
mogenized using a QIA shredder spin Column. Homogenization was necessary to reduce the
viscosity of the cell lysates produced by disruption. Incomplete homogenization results in
inefficient binding of RNA to the RNeasy membrane and therefore significantly reduced

MATERIALS AND METHODS
40
yields. An equal volume of 70% ethanol was then added to the homogenized lysate to ensure
selective binding of RNA onto the silica based RNeasy spin column and the sample was load-
ed onto the RNeasy column. A wash with RW1 buffer followed by two washes with RPE
buffer to removed sheared genomic DNA and protein contaminants. RNA was eluated from
the RNeasy spin column with 30 µl DEPC-treated water and recovered by centrifugation.
RNA was stored at -80°C.
RNA concentrations were measured by UV Biophotometer (Eppendorf). 1µl of eluted RNA
was diluted in 1:100 (W/L) sterile water. Added to a microcuvette it was blanked with
water.
2.4.2 Reverse transcription PCR (RT‐PCR)
RT is a techinique used to generate complementary DNA (cDNA) from an RNA template [81,
82]. We mainly used RT- PCR which is a method to quantify the expression of specific genes.
The principle is the same as for PCR. However, in a first separate step mRNA is transformed
to cDNA. The RNA strand is converted to cDNA by the use of the enzyme reverse transcrip-
tase and oligo-dT primers that are mRNA selective by binding to the poly A-tails. Primers are
designed to generate products spanning over exon-exon boundaries as a second step to ensure
that it is only cDNA and not genomic DNA in the PCR. The RT‐PCR conditions were opti-
mised and performed according to general rules.
The master mix typically contains all of the components needed for PCR except the template
RNA, according to Table 18.

MATERIALS AND METHODS
41
Master mix Volume
10x RT-Buffer 2µl
dNTP Mix 2µl
Oligo-dt primer 0.3µl
Reverse Transcriptase 1 µl
RNaisn(RNase inhibitor) 0.25 µl
dH20(RNase-free water) XµL
Template RNA 2µg in 20 µl
Total volume 20 µl
Table18- Reaction components for Reverse Transcription
The following Standard Protocol was adjusted to each specific application
Table 19-Thermal Cycler Conditions for RT-PCR
Temp Time
37°C 1h
94°C 3 min
4°C 1h

MATERIALS AND METHODS
42
2.5 Transfection 2.5.1 Transfection of Colon carcinoma cell line (SW480) and Melanoma cell
line (D05) with plasmid SDFI isoforms using Lipofectamine 2000
Transfection: is the process of introducing nucleic acids into cells by non-viral methods [83].
The goal of transfection is to isolate individual stable clones containing transfected DNA that
have integrated into the cellular genome [84].
2.5.2 Transfection protocol
5 x 10⁵ cells were seeded in 2 ml of RPMI1640 medium containing 10% FCS in six well
plates 24 h before transfection aiming to achieve 80-90% confluency. For each transfection
reaction, 1µg of Plasmid SDFI (pcDNA3.1/NT-GFP-SDF-I) or of Vector (pcDNA3.1/NT-
GFP) was diluted in a 50 μl of RPMI1640 medium (serum-free) and gently mixed. 10µl from
Lipofectamine 2000 were diluted in 50 μl of RPMI1640 medium serum-free. Boths were in-
cubated for 5 minutes at room temperature.
Plasmid&Vector DNA
amount
Lipofectamine2000
amount
pcDNA3.1/NT-GFP-SDF-1- alpha
1μg 10-15µl
pcDNA3.1/NT-GFP-SDF-1-beta
1µg 10-15µl
pcDNA3.1/NT-GFP-SDF-1-gamma 1μg 10-15µl
pcDNA3.1/NT-GFP-SDF-1-delta 1μg 10-15µl
pcDNA3.1/NT-GFP-SDF-1-epsilon 1μg 10-15µl
pcDNA3.1/NT-GFP-SDF-1-theta 1μg 10-15µl
pcDNA3.1/NT-GFP-TOPO 1μg 10-15µl
Table 20- The constructs used in transfection experiment

MATERIALS AND METHODS
43
After incubation, the diluted plasmid was mixed with the diluted Lipofectamine 2000 (total
volume 100 μl). It was mixed gently and incubated for 20-45 minutes at room temperature to
allow the DNA-Lipofectamine 2000 complexes to form.
100 μl of DNA-Lipofectamine 2000 complexes were added to each well containing cells and
medium. They were gently mixed by rocking the plate back and forth.
The cells were incubated at 37°C in a CO2 incubator for 24-48 hours until they were ready to
assay for transgene expression. However, growth medium was replaced after 4-6 hours with-
out loss of transfection activity. Stable plasmid integration was selected using G418.
Green Fluorescent Protein (GFP), an inherently fluorescent protein was used to determine
transfection efficiency (percentage of transfected cells in the population) either visually by
fluorescence microscopy or quantitatively by flowcytometry.
2.5.3 Stable Transfection
2.5.3.1 Selection of Stably Transfected Cells
After cells were transfected, selection of positive transfected cells occurred with the antibiotic
G418 (Geneticin), used as a selective drug to kill untransfected cell. The effective concentra-
tion of G418 varies with the cell type, growth concentration, cells metabolic, rate and position
in the cell cycle. We have used a concentration (700µg/ml) of antibiotic G418 with cell line
SW480 and (500µg/ml) with cell line D05.
Antibiotic Working
Concentration
Stock Solution
G-418 or
Geneticin
G-418 is used for initial
selection at 500µg/ml
with a range of 50–
1,000µg/ml
50 mg/ml in either wa-
ter or 100 mM HEPES
(pH 7.3); the latter
buffer helps maintain
culture medium pH
Table 21- Antibiotic G418 used to select and maintain stable transfectants
MATERIALS AND METHODS
44
Cells were harvested 24–72 hours post-transfection for studies designed to analyze transient
expression of transfected gene SDF-1/CXCL12 and its splice variants e.g., isolation of RNA,
Western blots assays and FACS analysis.
2.6 FACS Vantage (Fluorescence Activated cell sorting)
All samples contained about 106-7
cells per ml from SW480 and DO5 transfected with SDFI
isoforms and GFP. A negative control with no expression (native cells) was always used.
Sorting medium contained 5% dissociation PBS buffer and not more than 0.2% serum (FCS).
We filtered the cell suspension before sorting through a cell strainer cap in order to eliminate
cell aggregates, which might lead to clogging of the nozzle. A collection tube with 3-5 ml
medium containing up to 20% FCS serum was used to collect positive transfected cells.
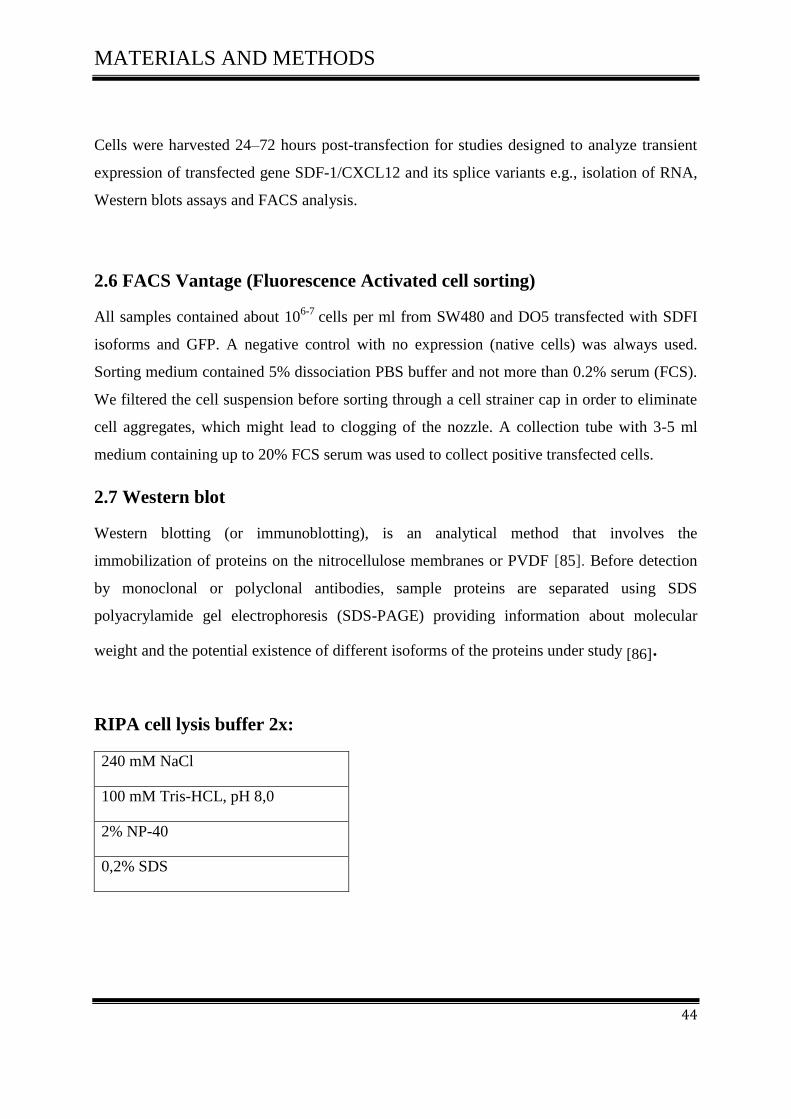
2.7 Western blot
Western blotting (or immunoblotting), is an analytical method that involves the
immobilization of proteins on the nitrocellulose membranes or PVDF [85]. Before detection
by monoclonal or polyclonal antibodies, sample proteins are separated using SDS
polyacrylamide gel electrophoresis (SDS-PAGE) providing information about molecular
weight and the potential existence of different isoforms of the proteins under study [86].
RIPA cell lysis buffer 2x:
240 mM NaCl
100 mM Tris-HCL, pH 8,0
2% NP-40
0,2% SDS
MATERIALS AND METHODS
45
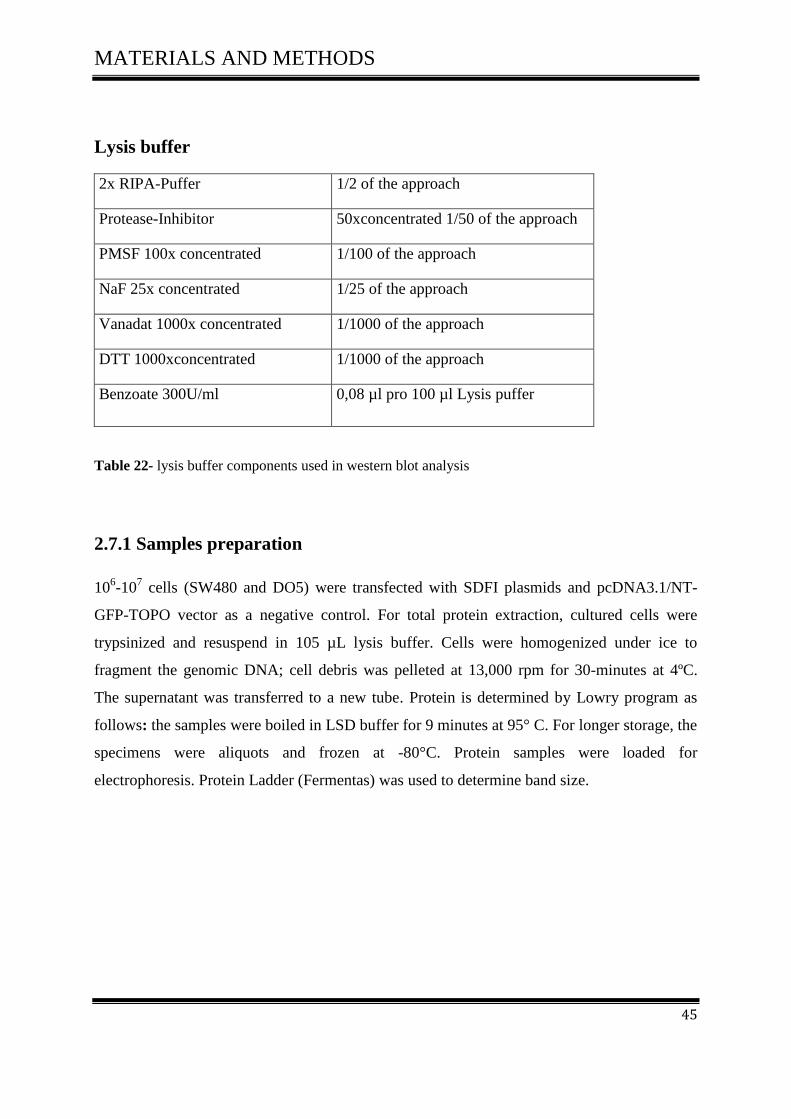
Lysis buffer
2x RIPA-Puffer 1/2 of the approach
Protease-Inhibitor 50xconcentrated 1/50 of the approach
PMSF 100x concentrated 1/100 of the approach
NaF 25x concentrated 1/25 of the approach
Vanadat 1000x concentrated 1/1000 of the approach
DTT 1000xconcentrated 1/1000 of the approach
Benzoate 300U/ml 0,08 µl pro 100 µl Lysis puffer
Table 22- lysis buffer components used in western blot analysis
2.7.1 Samples preparation
106-10
7 cells (SW480 and DO5) were transfected with SDFI plasmids and pcDNA3.1/NT-
GFP-TOPO vector as a negative control. For total protein extraction, cultured cells were
trypsinized and resuspend in 105 µL lysis buffer. Cells were homogenized under ice to
fragment the genomic DNA; cell debris was pelleted at 13,000 rpm for 30-minutes at 4ºC.
The supernatant was transferred to a new tube. Protein is determined by Lowry program as
follows: the samples were boiled in LSD buffer for 9 minutes at 95° C. For longer storage, the
specimens were aliquots and frozen at -80°C. Protein samples were loaded for
electrophoresis. Protein Ladder (Fermentas) was used to determine band size.

MATERIALS AND METHODS
46
2.7.2 Western blot analysis
100 μg of protein were loaded on a 10% SDS-PAGE gel. The samples were run on the gel,
until the blue marker reached the lower end of the gel.
After electrophoresis, the proteins were transferred to a sheet of special blotting paper called
PVDF membrane. The membrane was washed with TPBS Puffer and blocked for 1 h at room
temperature with Roti-block (blocking buffer).
Proteins (AKT/pAKT , MEK/pMEK , JNK/pJNK , P38/pP38 and Tubulin ) were detected
with specific primary antibodies, that were diluted in blocking buffer and incubated at 4 °C
overnight with gentle agitation on a platform shaker. Secondary antibodies were diluted in
TBS-T and incubated for 1 h at room temperature with gentle agitation. Table 23 summarizes
the antibodies used.
Antibodies Gel Puffer
phospho AKT 10% Bis-TRIS-Gel MES-Puffer
AKT 10% Bis-TRIS-Gel MES-Puffer
phospho MEK 10% Bis-TRIS-Gel MES-Puffer
MEK 10% Bis-TRIS-Gel MES-Puffer
Phospho P38 10% Bis-TRIS-Gel MES-Puffer
P38 10% Bis-TRIS-Gel MES-Puffer
Phospho SAPK / JNK 10% Bis-TRIS-Gel MES-Puffer
SAPK / JNK 10% Bis-TRIS-Gel MES-Puffer
TUBULIN 10% Bis-TRIS-Gel MES-Puffer
Table 23- List of Antibodies which have used in completion of this study

MATERIALS AND METHODS
47
For visualisation, proteins bands were visualized by incubation of the membrane for one mi-
nute in chemi-luminescent with Roti-Lumin systems 1 and 2, a substrate that will luminesce,
when exposed to the reporter on the secondary antibody. The light is then detected by a pho-
tographic film. The image is analyzed by densitometry, which evaluates the relative amount
of protein staining and quantifies the results in terms of optical density. The membrane was
exposed to the film for different time periods (for 1 sec to 30 min). When the membrane
should be re-probed with another antibody, the bound antibodies were removed by stripping
for one hour at 50°C. Each condition was performed in duplicates.
2.8 AMD3100
2.8.1 Structure of AMD3100
Plerixafor (AMD3100) is an immunostimulant used to mobilize hematopoietic stem cells
(HSCs) in cancer patients and acts as an antagonist of the chemokine receptor CXCR4 and as
allosteric agonist of the chemokine receptor CXCR7.The bicyclam AMD3100 was originally
described as selective inhibitor of HIV-1and HIV-2 replication and it is known as a small syn-
thetic inhibitor of the CXCR4 receptor for the chemokine SDF-1. Plerixafor is highly specific
in its interaction with CXCR4 [87, 88].
Fig15- Structure of AMD3100 originally termed [1,1′-[1,4-phenylene- bis(methylene)]-bis -1,4,8,11-
tetra-azacyclotetradecane [88].

MATERIALS AND METHODS
48
2.8.2 Western blot analysis after treatment with different concentration of
AMD3100.
To study the effect of AMD3100 on SDFI isoforms in SW480 and D05, 5x10⁵ cells were
seeded in a six-well culture plate. Cells were treated with different concentration of
AMD3100 (0 µg/mL) (5 µg/mL) and (10µg/mL) and afterwards incubated overnight at 37°C.
Cells were collected and analyses were performed as described.
2.9 Cell Proliferation
Cell proliferation, also known as cell growth, cell division, or cell replication is the basic pro-
cess through which cells create new cells [89].
Degenerative diseases, such as arthritis, diabetes mellitus and cancer, occur from errors in cell
replication and as a result of errors in DNA transcription during the cell cycle. Cancer in par-
ticular, is often the final result of a progressive accumulation of DNA transcription errors oc-
curring in transformed cells, ultimately leading to uncontrolled cell proliferation and malig-
nancy [89].
Fig 16- The cell cycle can be divided into two functional phases, S and M phases, and two preparatory
phases, G1 and G2 [89].
MATERIALS AND METHODS
49
2.9.1 Cell Proliferation assay
To study the effect of SDFI isoforms on tumor cell proliferation, 5000 cells (SW480, D05)
were seeded in 100 µl RPMI medium supplemented with 10% FBS per well in a 96-well
plate. On the first day, the first row was measured for all isoforms and control. Measurements
were repeated every 24 h for 5 days. All measurements were performed in quadruplicate. Cell
proliferation was determined by luminescence assay.
The CellTiter-Glo® Luminescent Cell Viability Assay is a homogeneous method to determine
the number of viable cells in culture, based on quantitation of ATP, which signals the pres-
ence of metabolically active cells. 30µL CellTiter-GLO was added to each well containing
105 µL medium in a 96-well plate. Contents were carefully mixed and incubated for 2
minutes. They were measured after 12 minutes according to the recommendation of the manu-
facturer.
2.9.2 Cell Proliferation assay after treatment with different concentration
from AMD3100
Cells (SW480, D05) were seeded in 96-well culture plates at a density of 5000 cells per well
followed by the addition of AMD3100 in various concentration (0µg/ml) (5µg/ml) (10µg/ml).
Then cells were incubated for 24 h. Cellular proliferation assay was performed as previ-
ously described.
MATERIALS AND METHODS
50
2.10 Cell adhesion
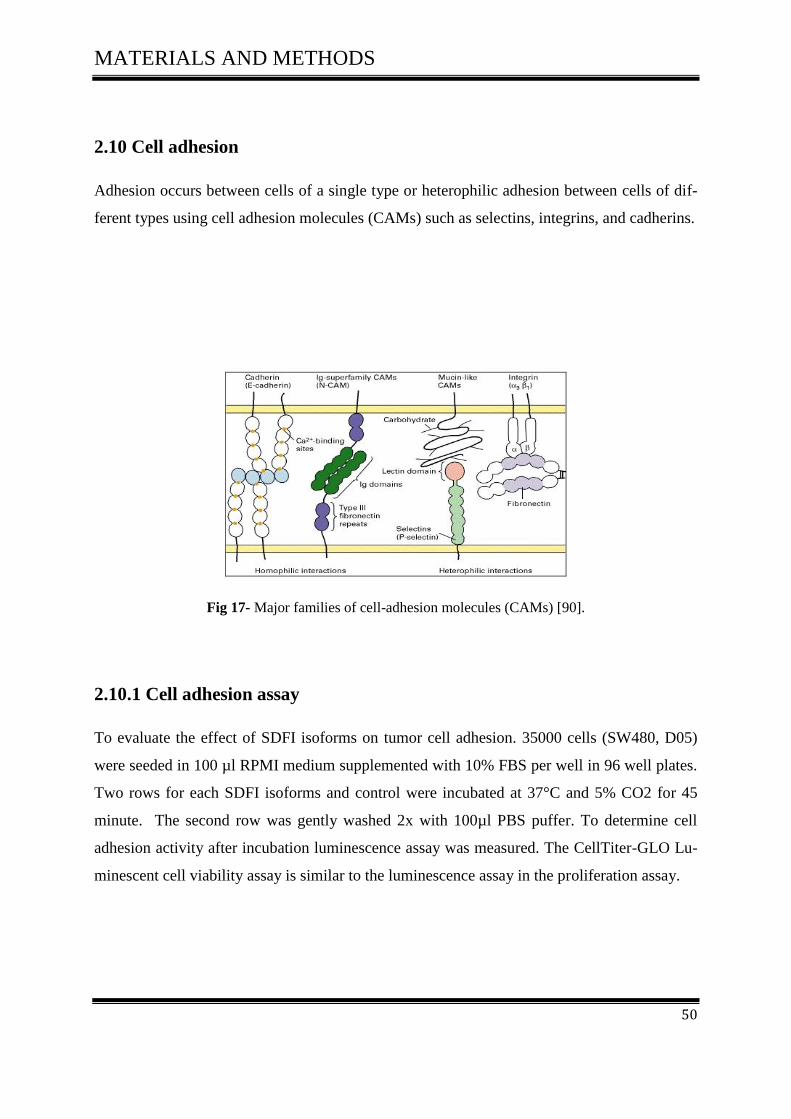
Adhesion occurs between cells of a single type or heterophilic adhesion between cells of dif-
ferent types using cell adhesion molecules (CAMs) such as selectins, integrins, and cadherins.
Fig 17- Major families of cell-adhesion molecules (CAMs) [90].
2.10.1 Cell adhesion assay
To evaluate the effect of SDFI isoforms on tumor cell adhesion. 35000 cells (SW480, D05)
were seeded in 100 µl RPMI medium supplemented with 10% FBS per well in 96 well plates.
Two rows for each SDFI isoforms and control were incubated at 37°C and 5% CO2 for 45
minute. The second row was gently washed 2x with 100µl PBS puffer. To determine cell
adhesion activity after incubation luminescence assay was measured. The CellTiter-GLO Lu-
minescent cell viability assay is similar to the luminescence assay in the proliferation assay.

MATERIALS AND METHODS
51
2.11 Definition of migration and invasion
2.11.1 Cellular Migration assay
The most common method used to study cell motility in vitro was first described by Boyden S
in 1962 [91]. Trans well® migration assays are one of the modifications of the Boyden
Chamber system. Boyden Chamber assays consist of a cylindrical cell culture insert nested in
the well of cell culture plate. The insert contains a polycarbonate membrane at the bottom
with an 8µm pore size.
To study the effect of SDFI isoforms on the migration of tumor cells, SW480 and D05 were
serum-starved for 4 hour. 4x10⁴ cells were seeded in 150µl RPMI medium supplemented with
2 % FCS on to the insert in the upper chamber of trans well culture plates and they migrated
in vertical direction through the pores of the membrane into the lower chamber which con-
tains 500µl RPMI medium supplemented with 20% FCS (high serum). Chambers were incu-
bated for 24 hour at 37 °C and 5% CO2. After incubation, the amount of migrated cells in the
lower chamber was determined by luminescence. 125 µL CellTiter-GLO was added to each
Trans well®, contents were mixed and incubated for 2 minutes. 100 µl per wall were trans-
ferred to a 96-well plate, and measured after 12 minutes.
Fig18- Transwell migration assay (Boyden chamber assay). Migration of a cell through a pore in
the membrane is depicted [92].
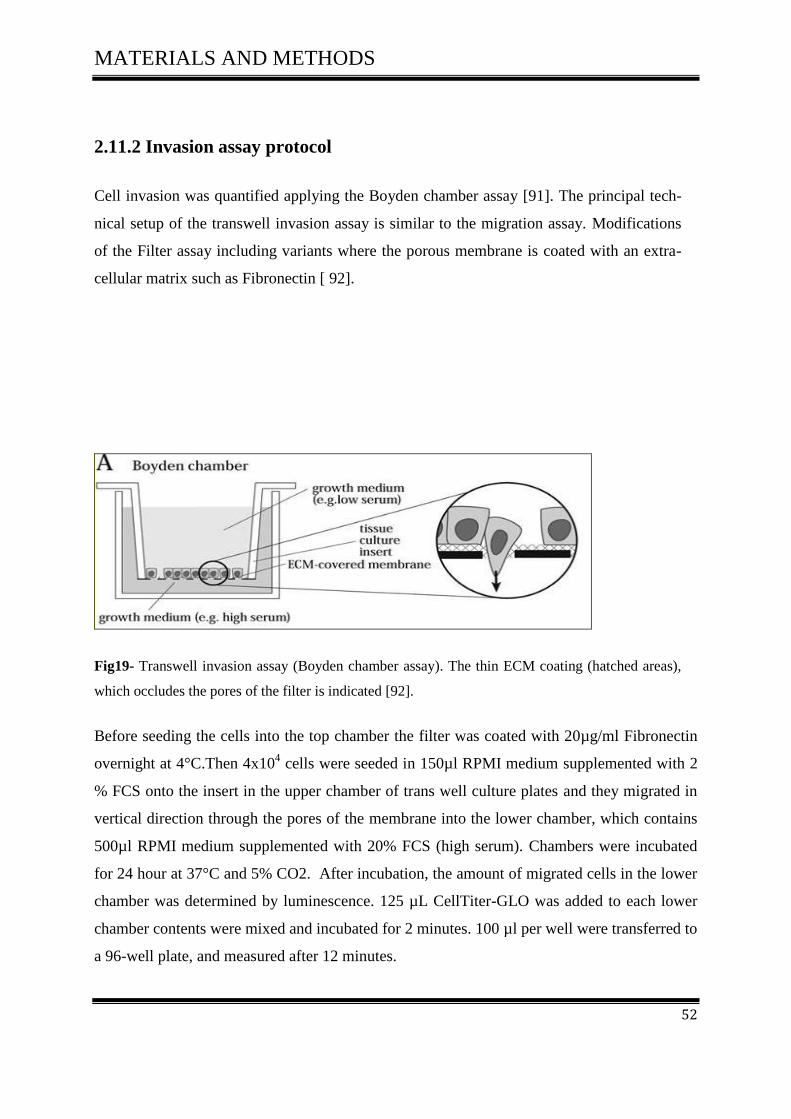
MATERIALS AND METHODS
52
2.11.2 Invasion assay protocol
Cell invasion was quantified applying the Boyden chamber assay [91]. The principal tech-
nical setup of the transwell invasion assay is similar to the migration assay. Modifications
of the Filter assay including variants where the porous membrane is coated with an extra-
cellular matrix such as Fibronectin [ 92].
Fig19- Transwell invasion assay (Boyden chamber assay). The thin ECM coating (hatched areas),
which occludes the pores of the filter is indicated [92].
Before seeding the cells into the top chamber the filter was coated with 20µg/ml Fibronectin
overnight at 4°C.Then 4x10⁴ cells were seeded in 150µl RPMI medium supplemented with 2
% FCS onto the insert in the upper chamber of trans well culture plates and they migrated in
vertical direction through the pores of the membrane into the lower chamber, which contains
500µl RPMI medium supplemented with 20% FCS (high serum). Chambers were incubated
for 24 hour at 37°C and 5% CO2. After incubation, the amount of migrated cells in the lower
chamber was determined by luminescence. 125 µL CellTiter-GLO was added to each lower
chamber contents were mixed and incubated for 2 minutes. 100 µl per well were transferred to
a 96-well plate, and measured after 12 minutes.

MATERIALS AND METHODS
53
2.12 Animal experiments
2.12.1 Subcutaneous xenograft tumor system
42 animals were divided in 7 groups, SW480 tumor cells (1×10⁶ and 3×10
6) were suspended
in 0.2 ml pure RPMI 1640 medium and 1× PBS (1:1) and applied by subcutaneous injection
into the right and left flank of 7–8-week-old female nod-SCID mice.
Inoculation of animals
SW480-GFP control 6 animals
SW480-SDF1 alpha 6 animals
SW480-SDF1 beta 6 animals
SW480-SDF1 gamma 6 animals
SW480-SDF1 delta 6 animals
SW480-SDF1 epsilon 6 animals
SW480-SDF1 theta 6 animals
Total 42 animals
The size of tumors was measured manually twice weekly. Tumors grew for 5 weeks. Thereaf-
ter, tumor nodules were excised and measured manually with a vernier micrometer.
MATERIALS AND METHODS
54
2.13 Statistical Analysis
In order to assess the dependence of the SDF1 isoforms on sex, TNM and R we computed
mean, standard deviation, minimum, maximum, median, and quartiles in subgroups. Results
are displayed in box plots. Further we performed Wilcoxon tests if the explanatory variable
had two levels, and Kruskal-Wallis tests, if there were more than two levels of the explanatory
variable.
Associations among age, actin and the isoforms were described by Pearson correlation coeffi-
cient and displayed in scatterplot matrices.
All tests were performed with exploratory intention, associations with p-values 0.05 might
warrant further consideration. Statistical analysis was performed using SAS 9.2 (c) 2002-2008
by SAS Institute Inc., (Cary, NC, USA).

RESULTS
55
3 RESULTS
3.1 CXCL12 Gene polymorphism
3.1.1 Patients characteristics
The CXCL12 gene is located at band q11 on chromosome 10 [93] and encodes for the six
isoforms of human CXCL12/(SDF-1) known as SDF-1alpha, SDF-1beta, SDF-1gamma,
SDF-1delta, SDF-1epsilon and SDF-1theta, which are the result of alternative splicing events
of the same gene.
The present study included 73 CRC patients, comprised of 30 (41%) females and 43 (59%)
males with an average age at diagnosis of 66.5 years. All tumors were classified according to
the TNM classification.
The aim of this work was to study the CXCL12 coding gene polymorphisms at codon G801A
by Restriction fragment length polymorphism (RFLP) assay in CRC patients and to correlate
them with the clinical presentation and tumor characteristics Table (24).
We investigated the distribution of CXCL12-3`G801A genotypes in CRC patients.
In order to examine the association of the CXCL12 gene variants with CRC, PCR products
were cleaved and analysed. A typical agarose gel after the separation of PCR products is
shown in Fig 20-A. CXCL12 polymorphism reveal a 302- bp fragment and a genotypic distri-
bution of CXCL12 alleles after RFLP analysis are represented in Fig 20-B.
The GG homozygous genotypes of CXCL12 reveal two fragments of 202-bp and 100-bp size.
The AA homozygous genotypes of CXCL12 produce only one band of 302 bp, whereas the
GA heterozygous genotypes of CXCL12 produce 3 bands of 302, 202 and 100 bp size.

RESULTS
56
Fig 20- Agrose Gel showing
A-PCR Products for CXCL12 from different CRC patients
Lane M: Molekular Marker 100bp
B-RFLP analysis of CXCL12 gene polymorphism in CRC patients
Lane M: Molekular Marker 100bp
Lanes1, 2: mutated heterozygote GA genotype (100, 202 and 302 bps size)
Lanes 3, 4, 5, 6: wild type homozygote GG genotype (100 and 202 bps size)
Lanes7, 8: mutated homozygte AA genotype (302 bps size)
3.1.2 Genotype frequencies
CXCL12 amplicons were successfully detected in all patients. We compared the CXCL12
(G/G) allele with CXCL12 alleles (G/A, A/A) regarding gender, age, and clinical presenta-
tion. Table (24)

RESULTS
57
G/G (%) G/A A/A (%) P value
Total number (%)
50 (68.5%)
23 (31.5%)
Median age( y) 66 67 P= 0.035
Gender
Male 27 (54.0%) 16 (69.5%) P= 0.579
Female 23 (46.0%) 7 (30.5%) NS
T status
1 + 2 11 (22.0%) 7 (30.5%) P= 0.067
3 + 4 39 (78.0%) 16(69.5%)
N status
0 12 (24.0%) 6 (26.0%) P= 0.364
1 + 2 + 3 37 (76.0%) 17(74.0%) NS
M status
0 33 (66.0%) 13 (56.5%) P= 0.509
+ 17 (34.0%) 10 (43.5%) NS
R status
0 32 (64.0%) 11 (47.8%) P= 0.395
+ 18 (36.0%) 12 (52.2%) NS
T status
1 + 2 + 3 39 (78.0%) 13 (56.5%) P= 0.214
4 11( 22.0%) 10 ( 43.5%) NS
N-status could not be obtain from one patient
Table 24-Tumor characteristics in relation to CXCL12 genotypes
G/G homozygosity was observed in fifty CRC patients (68.5%) as compared to twenty three
patients with G/A and A/A genotype (31.5 %).
Exept for local progression of the primary tumor, we found no correlation of CXCL12 Gene
polymorphism rs1801157 with clinicopathological parameters.
CXCL12 Gene polymorphism rs1801157 revealed a trend towards local progression of the
primary tumor as indicated by the T status. The frequency of GG genotype was somewhat
higher in patients with stage 3 and 4 tumors (78.0%, P=0.067) as compared to GA/AA geno-
types (69.5%).

RESULTS
58
3.2 CXCR4 and CXCL12 expression in colorectal carcinoma cell lines
In order to understand the role of CXCR4 and CXCL12 in the biology of colon cancer, we
analysed five human colon cancer cell lines for the expression of CXCR4 and CXCL12.
CXCR4 expression and transcription of human colorectal cancer cell lines varied from strong
( Caco-2 , SW480, HT29) and intermediate (SW620) to weak (LS174T).
The RT-PCR analysis of CRC cell lines (Fig.21) suggests that CXCL12 is rather weakly ex-
pressed in CRC cell lines. This PT-PCR analysis demonstrated CXCL12 expression is present
in only one of five CRC cell lines (Caco-2). H
T-2
9
SW
620
Caco-2
CXCR4
CXCL12
B-actin
SW
480
LS
174T
Fig 21- Expression and transcription profile of CXCR4 and CXCL12 in diverse human colorectal
cancer cell lines
3.3 Expression and activity of CXCL12 splice variants in human colorectal
carcinoma and normal colon mucosa
We first evaluated the expression of novel CXCL12 splice variants (alpha, beta, gamma,
delta, epsilon, and theta) in 40 established colorectal tumor and 20 colon mucosa specimen.
In order to determine the expression patterns of the human SDF-1 isoforms in colorectal tis-
sues and human mucosa tissues, we designed PCR primers that could detect each SDF-1 iso-
form specifically. The forward primer was located in the 5′-UTR and was the same for all
isoforms.
T-status
T-status

RESULTS
59
The reverse primer for SDF-1α was located on the third exon of SDF-1α. The reverse primer
for SDF-1δ was in the region corresponding to the third intron of SDF-1δ. The reverse primer
for SDF-1β and SDF-1γ were located on their respective 3′-UTRs which are unique. The re-
verse primers for SDF-1ε and SDF-1ϕ bridged the third and fourth exons of each isoforms
and were unique to each of them.
RT -PCR analysis showed that the mRNA of these SDF-1 splice variants was expressed in
CRC tissues and normal mucosa tissues (Table 25)(Fig 22).
SDF-1α was expressed in 32 of 40 samples (80%). SDF-1 β was expressed in 28 of 40 sam-
ples (70%). SDF-1γ was expressed in 20 0f 40 samples (50%). SDF-1δ was expressed in 15 of
40 samples (37.5%). SDF-1ε was expressed in 12 of 40 samples (30%). SDF-1ϕ was ex-
pressed in 153 of 40 samples (32.5%).
In contrast, in normal mucosa SDF-1α was expressed in 13 of 20 samples (65%). SDF-1 β
was expressed in 10 of 20 samples (50%). SDF-1 γ was expressed in 5 of 20 samples (25%).
SDF-1δ was expressed in 8 of 20 samples (40%). SDF-1ε was expressed in 9 of 20 samples
(45%). SDF-1ϕ was expressed in 7 of 20 samples (35%)
Table 25- Expression of SDF-1 isoforms in colorectal carcinoma and normal mucosa tissues
SDF-1
Isoforms
Expreesion of SDF-1
isoforms in Colon
samples 40 (%)
Expreesion of SDF-1
isoforms in Mucosa
samples 20(%)
SDF1alpha 32 (80%) 13 (65%)
SDF1beta 28 (70%) 10 (50%)
SDF1gamma 20 (50%) 5 (25%)
SDF1delta 15 (37.5%) 8 (40%)
SDF1epsilon 12 (30%) 9 (45%)
SDF1theta 13 (32.5%) 7 (35%)

RESULTS
60
SDFI-alpha
SDFI-beta
SDFI-gamma
SDFI-delta
SDFI-epsilon
SDFI-theta
B-Actin
c
m
1 2 3 4 5 6 7 8 9 10
Patient No
Fig 22- Expression of SDF-1 isoforms in colorectal carcinoma and human normal mucosa tissues.
PCR analysis of SDF-1 isoforms in cDNA samples prepared from colon cancer tissues and mucosa
normal tissues. (The experiments were repeated twice and identical results were obtained).
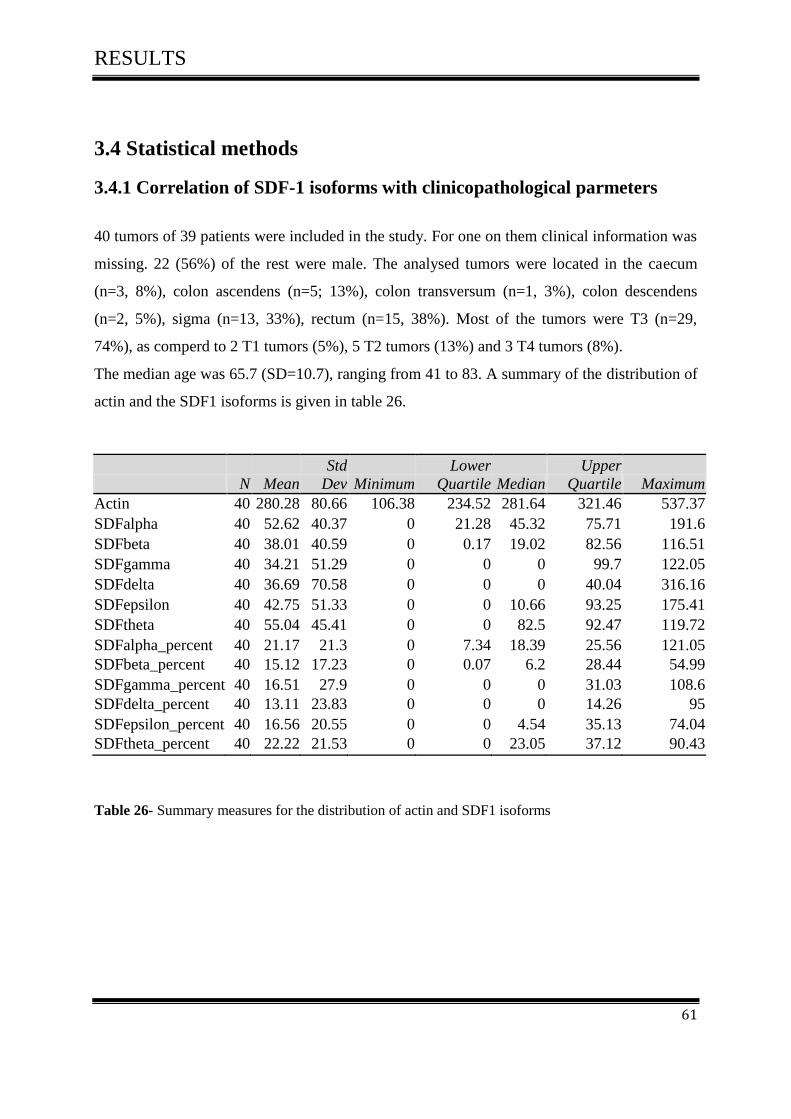
RESULTS
61
3.4 Statistical methods
3.4.1 Correlation of SDF-1 isoforms with clinicopathological parmeters
40 tumors of 39 patients were included in the study. For one on them clinical information was
missing. 22 (56%) of the rest were male. The analysed tumors were located in the caecum
(n=3, 8%), colon ascendens (n=5; 13%), colon transversum (n=1, 3%), colon descendens
(n=2, 5%), sigma (n=13, 33%), rectum (n=15, 38%). Most of the tumors were T3 (n=29,
74%), as comperd to 2 T1 tumors (5%), 5 T2 tumors (13%) and 3 T4 tumors (8%).
The median age was 65.7 (SD=10.7), ranging from 41 to 83. A summary of the distribution of
actin and the SDF1 isoforms is given in table 26.
N Mean
Std
Dev Minimum
Lower
Quartile Median
Upper
Quartile Maximum
Actin 40 280.28 80.66 106.38 234.52 281.64 321.46 537.37
SDFalpha 40 52.62 40.37 0 21.28 45.32 75.71 191.6
SDFbeta 40 38.01 40.59 0 0.17 19.02 82.56 116.51
SDFgamma 40 34.21 51.29 0 0 0 99.7 122.05
SDFdelta 40 36.69 70.58 0 0 0 40.04 316.16
SDFepsilon 40 42.75 51.33 0 0 10.66 93.25 175.41
SDFtheta 40 55.04 45.41 0 0 82.5 92.47 119.72
SDFalpha_percent 40 21.17 21.3 0 7.34 18.39 25.56 121.05
SDFbeta_percent 40 15.12 17.23 0 0.07 6.2 28.44 54.99
SDFgamma_percent 40 16.51 27.9 0 0 0 31.03 108.6
SDFdelta_percent 40 13.11 23.83 0 0 0 14.26 95
SDFepsilon_percent 40 16.56 20.55 0 0 4.54 35.13 74.04
SDFtheta_percent 40 22.22 21.53 0 0 23.05 37.12 90.43
Table 26- Summary measures for the distribution of actin and SDF1 isoforms
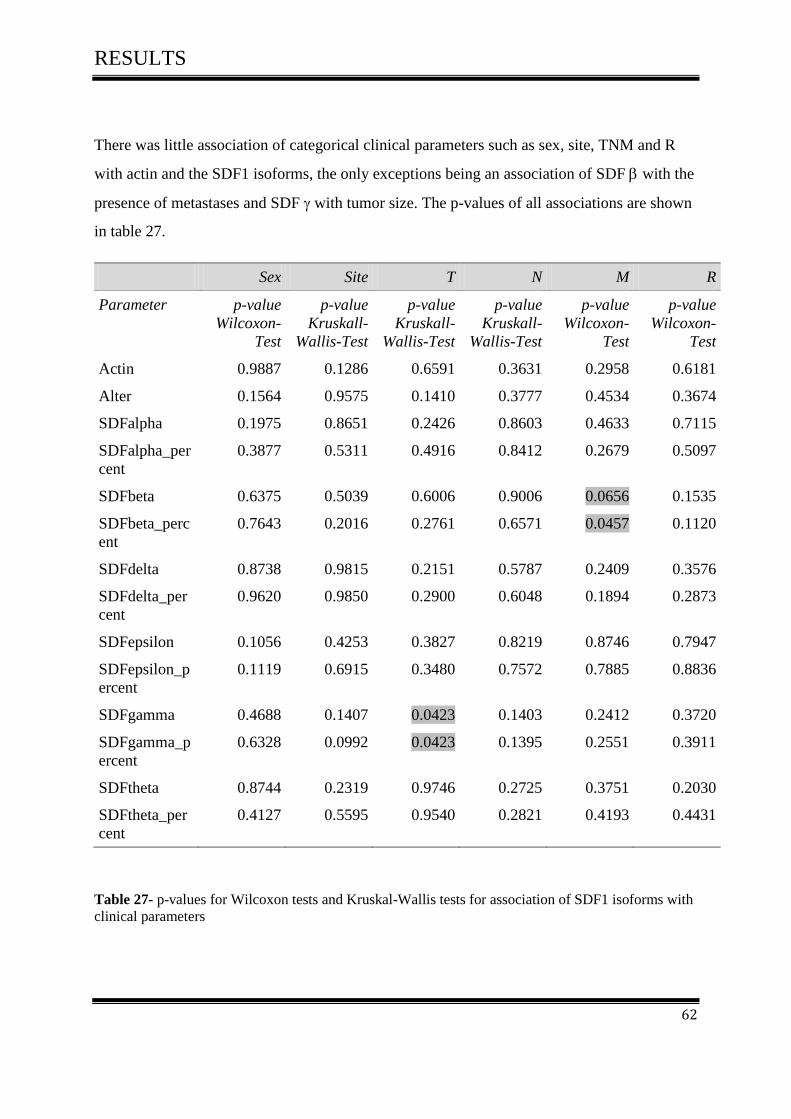
RESULTS
62
There was little association of categorical clinical parameters such as sex, site, TNM and R
with actin and the SDF1 isoforms, the only exceptions being an association of SDF with the
presence of metastases and SDF with tumor size. The p-values of all associations are shown
in table 27.
Sex Site T N M R
Parameter p-value
Wilcoxon-
Test
p-value
Kruskall-
Wallis-Test
p-value
Kruskall-
Wallis-Test
p-value
Kruskall-
Wallis-Test
p-value
Wilcoxon-
Test
p-value
Wilcoxon-
Test
Actin 0.9887 0.1286 0.6591 0.3631 0.2958 0.6181
Alter 0.1564 0.9575 0.1410 0.3777 0.4534 0.3674
SDFalpha 0.1975 0.8651 0.2426 0.8603 0.4633 0.7115
SDFalpha_per
cent
0.3877 0.5311 0.4916 0.8412 0.2679 0.5097
SDFbeta 0.6375 0.5039 0.6006 0.9006 0.0656 0.1535
SDFbeta_perc
ent
0.7643 0.2016 0.2761 0.6571 0.0457 0.1120
SDFdelta 0.8738 0.9815 0.2151 0.5787 0.2409 0.3576
SDFdelta_per
cent
0.9620 0.9850 0.2900 0.6048 0.1894 0.2873
SDFepsilon 0.1056 0.4253 0.3827 0.8219 0.8746 0.7947
SDFepsilon_p
ercent
0.1119 0.6915 0.3480 0.7572 0.7885 0.8836
SDFgamma 0.4688 0.1407 0.0423 0.1403 0.2412 0.3720
SDFgamma_p
ercent
0.6328 0.0992 0.0423 0.1395 0.2551 0.3911
SDFtheta 0.8744 0.2319 0.9746 0.2725 0.3751 0.2030
SDFtheta_per
cent
0.4127 0.5595 0.9540 0.2821 0.4193 0.4431
Table 27- p-values for Wilcoxon tests and Kruskal-Wallis tests for association of SDF1 isoforms with
clinical parameters

RESULTS
63
Actin and the SDF1 isoforms did exhibit correlation with age. Further, there was significant
association among the SDF1 isoforms. Also SDF tends to decrease when actin increases.
After standardisation, some correlations are substantially different from zero, in particular
SDF1 and SDF1.
SDFIalpha isoform was correlated with isoforms of SDFIbeta (P= 0.0048), SDFIgamma (P=
0.0023), and SDFItheta (P=0.0084). SDFIbeta isoform was correlated with isoforms of SDFI
gamma (P= 0.0016), SDFIdelta (P= 0.0001), SDFIepsilon (P= 0.0478) and SDFItheta P=
0.0232), as well as SDFIgamma isoform was correlated SDFItheta (P= 0.0003), and SDFI
epsilon was correlated with SDFIbeta (P= 0.0738).
Pearson Correlation Coefficients
p-value for testing H0: r=0
Number of Observations
Age Actin SDFalpha SDFbeta SDFgamma SDFdelta SDFepsilon SDFtheta
Age
- -0.13972
0.3962
39
-0.04777
0.7728
39
-0.02730
0.8690
39
0.19317
0.2387
39
0.07543
0.6481
39
-0.21384
0.1912
39
0.10631
0.5195
39
Actin
-0.13972
0.3962
39
- -0.01916
0.9066
40
-0.08372
0.6075
40
-0.35767
0.0235
40
0.10351
0.5250
40
-0.05144
0.7526
40
-0.09977
0.5402
40
SDFalpha
-0.02286
0.8902
39
-0.40136
0.0103
40
- 0.23404
0.1461
40
0.16911
0.2969
40
0.21220
0.1887
40
-0.04299
0.7922
40
0.11430
0.4825
40
SDFbeta
0.02145
0.8969
39
-0.32314
0.0420
40
0.43695
0.0048
40
- 0.16463
0.3100
40
0.60533
<.0001
40
0.28580
0.0738
40
0.03862
0.8130
40
SDFgamma
0.13937
0.3974
39
-0.54909
0.0002
40
0.46757
0.0023
40
0.48248
0.0016
40
- -0.15802
0.3301
40
-0.12948
0.4258
40
0.25850
0.1073
40
SDFdelta
0.07224
0.6621
39
-0.00248
0.9879
40
0.25954
0.1058
40
0.56648
0.0001
40
-0.00486
0.9763
40
- 0.05196
0.7502
40
-0.25492
0.1124
40
SDFepsilon
-0.13369
0.4172
39
-0.22619
0.1605
40
0.05407
0.7404
40
0.31493
0.0478
40
0.14699
0.3654
40
-0.01127
0.9450
40
- -0.16050
0.3225
40
SDFtheta
0.12114
0.4626
39
-0.42788
0.0059
40
0.41089
0.0084
40
0.35834
0.0232
40
0.53831
0.0003
40
-0.11986
0.4613
40
0.08839
0.5876
40
-
Table 28- Correlation among SDFI isoforms

RESULTS
64
3.5 Plasmid DNATransfection
3.5.1 CXCL12 splice variants expression in colorectal cell line and melano-
ma cell line
We tested the expression of CXCL12 variants in multiple colorectal cell lines including
SW480, SW620, HT29 and melanoma cell lines D05, D14 in order to to choose the most ap-
propriate cell line to perform our transfection experiment. We selected colon cell line SW480
and melanoma cell line D05, of which both of them were negative for all CXCL12 variants
(Fig 23, 24).
Alpha Control Beta Control Gamma Control
Delta Control Epsilon Control Theta Control
CXCL12 variants and Pos. Control -PCR
B-Actin-PCR
A-SW480
CXCL12 variants and Pos. Control-PCR
B-Actin-PCR
Fig 23- Expression of CXCL12 variants in SW480
Colorectal carcinoma cell line SW480 was negative for all CXCL12 variants. Colon car-
cinoma samples were used as a positive control
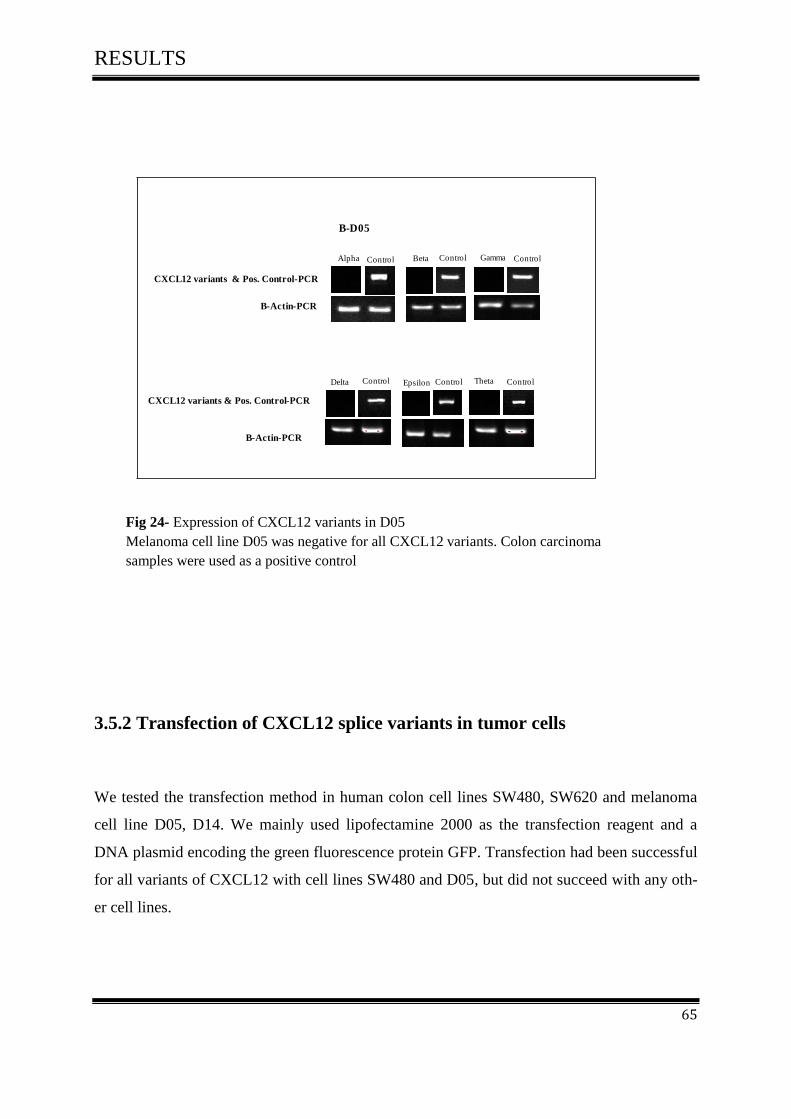
RESULTS
65
Alpha Gamma
Delta Epsilon
CXCL12 variants & Pos. Control-PCR
CXCL12 variants & Pos. Control-PCR
B-Actin-PCR
B-Actin-PCR
B-D05
Theta
BetaControl Control Control
Control Control Control
3.5.2 Transfection of CXCL12 splice variants in tumor cells
We tested the transfection method in human colon cell lines SW480, SW620 and melanoma
cell line D05, D14. We mainly used lipofectamine 2000 as the transfection reagent and a
DNA plasmid encoding the green fluorescence protein GFP. Transfection had been successful
for all variants of CXCL12 with cell lines SW480 and D05, but did not succeed with any oth-
er cell lines.
Fig 24- Expression of CXCL12 variants in D05
Melanoma cell line D05 was negative for all CXCL12 variants. Colon carcinoma
samples were used as a positive control
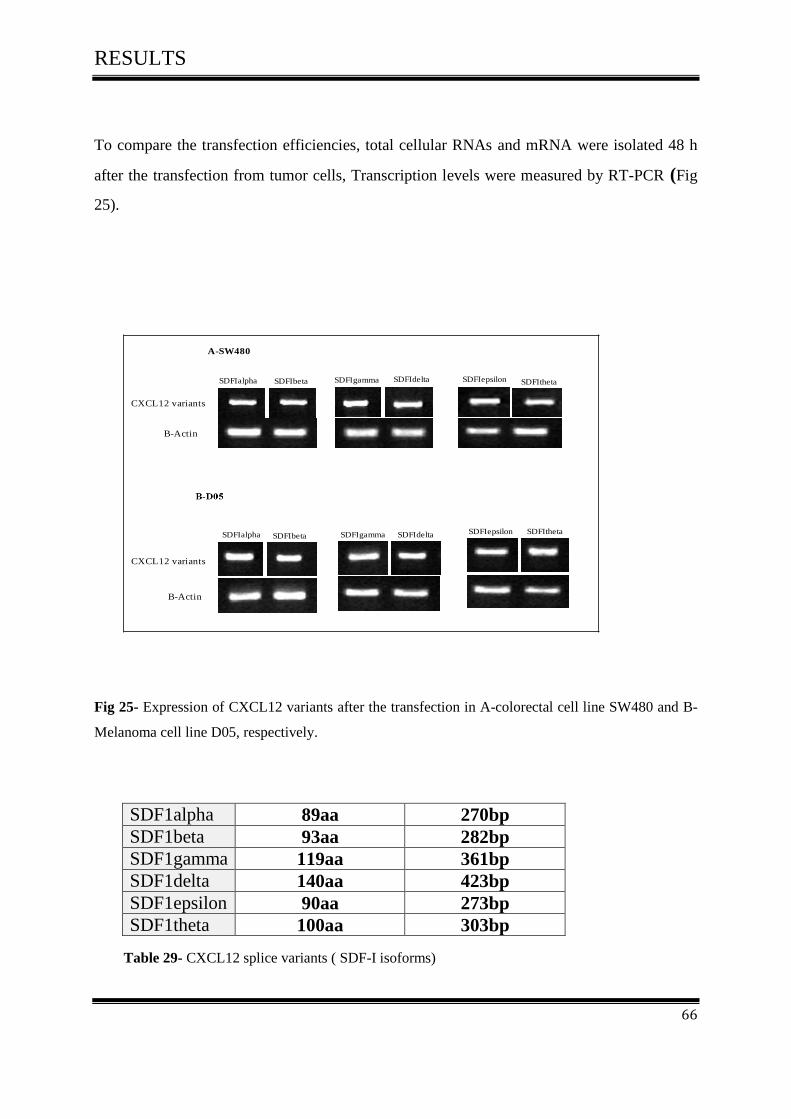
RESULTS
66
To compare the transfection efficiencies, total cellular RNAs and mRNA were isolated 48 h
after the transfection from tumor cells, Transcription levels were measured by RT-PCR (Fig
25).
SDFIalpha SDFIbeta SDFIgamma SDFIdelta SDFIepsilon SDFItheta
B-Actin
CXCL12 variants
CXCL12 variants
B-Actin
SDFIalpha SDFIbeta SDFIgamma SDFIdelta SDFIepsilon SDFItheta
A-SW480
Fig 25- Expression of CXCL12 variants after the transfection in A-colorectal cell line SW480 and B-
Melanoma cell line D05, respectively.
SDF1alpha 89aa 270bp SDF1beta 93aa 282bp
SDF1gamma 119aa 361bp
SDF1delta 140aa 423bp
SDF1epsilon 90aa 273bp
SDF1theta 100aa 303bp
Table 29- CXCL12 splice variants ( SDF-I isoforms)

RESULTS
67
3.5.3 FACS Analysis
3.5.3.1 FACS Analysis of SW480 and D05 in Vitro
To confirm the results, twenty-four hours after the transfection, cells were processed for fluo-
rescence activated cell sorting (FACS) and fluorescence microscopic analysis.
Both cell lines, SW480 and D05 were positive for all six SDFI isoforms after transfection
using lipofectamine 2000 with the enhanced GFP expression vector pcDNA3.1/ NT-GFP-
TOPO. Fig (26-A, B), (27 A, B) respectively.
3.5.3.2 FACS Analysis of SW480 in Vitro
The results of FACS analysis showed that all SDFI isoforms were expressed in the colorectal
cell line SW480. We named the stable clones as follows; SW480-1α, SW480-1β, SW480-1γ,
SW480-1δ, SW480-1ε, SW480 -1θ and SW480- GFP as a negative control.
Table 30- Expression of SDFI isoforms in colorectal cell line SW480
The FACS experience was repeated once a month to ensure the survival of the SDFI gene
within the tumor cells
Stable clones Expression %
SW480-1α 97.94%
SW480-1β 98.76%
SW480-1γ 97.98%
SW480-1δ 97.88%
SW480-1ε 98.55%
SW480 -1θ 95.22%.
SW480- GFP 93.31%
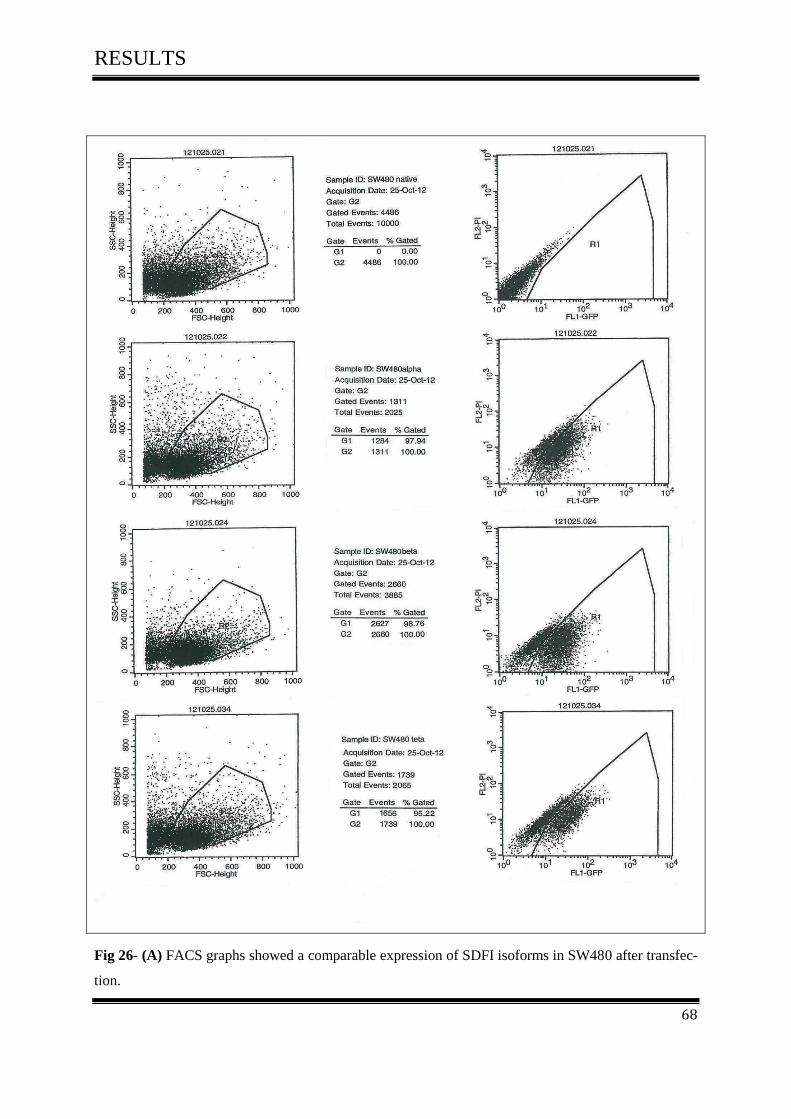
RESULTS
68
Fig 26- (A) FACS graphs showed a comparable expression of SDFI isoforms in SW480 after transfec-
tion.

RESULTS
69
Fig 26- (B) FACS graphs showed a comparable expression of SDFI isoforms in SW480 after transfec-
tion.

RESULTS
70
3.5.3.3 FACS Analysis of D05 in Vitro
The results of FACS Analysis showed that all SDFI isoforms were expressed in melanoma
cell line D05. We named the stable clones as follows; DO5 -1α, DO5-1β, DO5 -1γ, DO5-1δ,
DO5-1ε, DO5-1θ, DO5- GFP as a negative control.
Table 31- Expression of SDFI isoforms in melanoma cell line D05
We repeated the FACS experience once a month to ensure the survival of the SDFI gene with-
in the tumours cell.
Stable clones Expression %
DO5-1α 96.53%
DO5-1β 98.36%
DO5-1γ 98.11%
DO5-1δ 97.53%
DO5-1ε 98.82%
DO5-1θ 99.14%.
DO5- GFP 97.94%

RESULTS
71
Fig 27- (A) FACS graphs showed a comparable expression of SDFI isoforms in D05 after transfec-
tion.
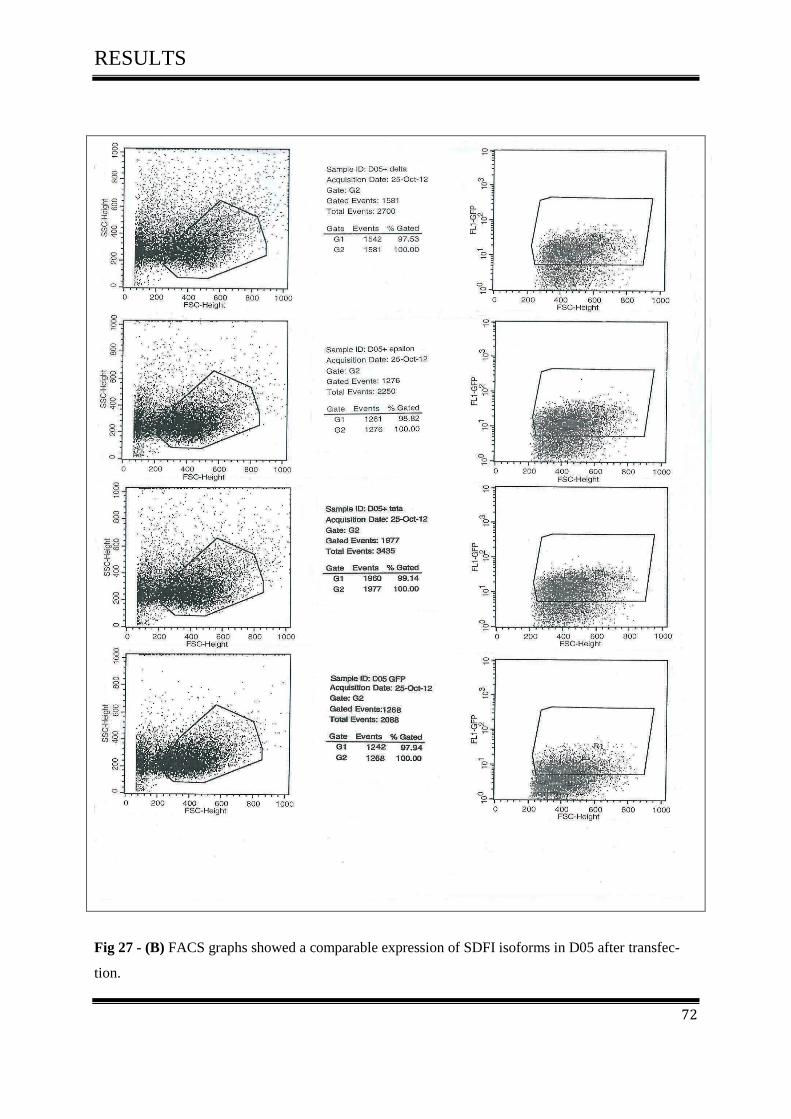
RESULTS
72
Fig 27 - (B) FACS graphs showed a comparable expression of SDFI isoforms in D05 after transfec-
tion.

RESULTS
73
3.6 Cell Proliferation Assay
3.6.1 Effect of CXCL12 splice variants on cell proliferation of colorectal
cancer
Since the activation of CXCR4 by CXCL12 was known to play an important role in cell pro-
liferation in many kinds of cancer cells, we investigated the role of CXCL12 variants on cell
proliferation of tumor cells.
Cell proliferation assay was performed in two cell lines, colorectal cell line SW480 and mela-
noma cell line D05.
Our data show that all CXCL12 variants had effect on cell proliferation through comparing
the results with SW480-GFP as a negative control Fig (28-A, 28-B).
The luminescence analysis on day 4 showed that SW480-1β had the highest rate of growth
(828 %, +/- 26.8%, P=0.000) and D05-1β showed the same results (647 %, +/- 25.2%,
P=0.000). SW480-1α (733 %, +/- 34.6%, P=0.000) and D05-1α (697 %, +/- 29.3 P=0.000)
were the second most proliferation inducers.
SW480-1γ (630 %, +/- 24.4%, P=0.000) and D05-1γ (494 %, +/- 31.8%, P=0.000) were third
and similar with SW480-1δ (645 %, +/- 33.3%, P=0.000) and D05-1δ (437 %, +/- 23.5%, P=
0.000) followed by SW480-1ε (608 %, +/- 46.1%, P=0.000) and D05-1ε (402 %, +/- 26.4%,
P=0.000).
Finally, SW480-1θ had the lowest rate of growth (558 %, +/- 46.1%, P=0.005), so was D05-1
θ (550 %, +/- 31.2%, P=0.000).
SW480-GFP as a negative control (483 %, +/- 36.3%) and D05-GFP (373 %, +/- 24.2%)
revealed the weakest proliferation.
The experiments were repeated twice and similar results were obtained.
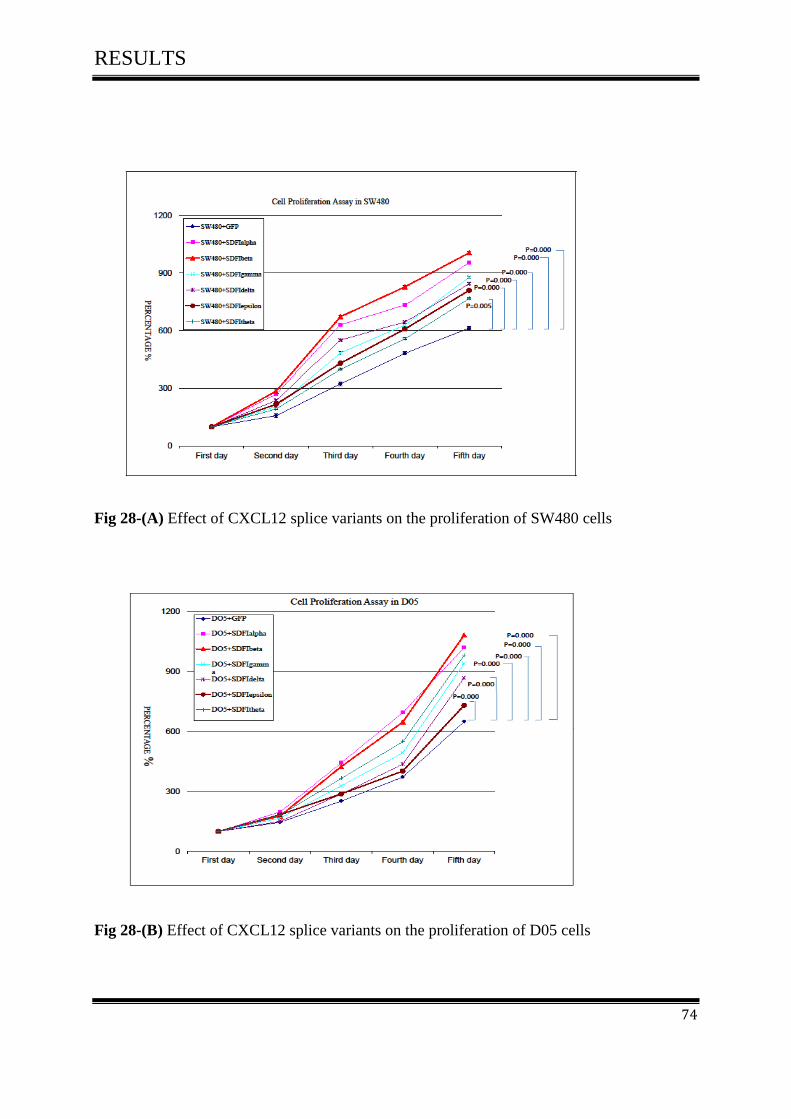
RESULTS
74
Fig 28-(A) Effect of CXCL12 splice variants on the proliferation of SW480 cells
Fig 28-(B) Effect of CXCL12 splice variants on the proliferation of D05 cells

RESULTS
75
3.7 Cell Migration Assay
3.7.1 Effect of CXCL12 splice variants on cell migration of colorectal can-
cer
Our result demonstrated that all CXCL12 variants induced the cell migration of SW480 and
D05.
The maximum effect was identified in SW480-1θ (23.8, +/- 2.07, P=0.010) and in D05-1θ
(24.4, +/- 1.40, P=0.001) followed by SW480-1ε (23.4, +/- 3.32, P= 0.070) and in D05-1ε
(22.8, +/- 1.20, P=0.009) Fig (29-A, 29-B).
Other CXCL12 variants also enhanced cell migration. Following results were obtained
SW480-1δ (20.0, +/- 1.43, P=0.041) and D05-1δ (21.9, +/- .47, P=0.052) followed by
SW480-1γ (18.7, +/- 1.6, P=0.032) and D05-γ (19.9, +/- 1.34, P=0.066), SW480-1β (16.1,
+/- 1.6, P=0.020) and D05-1β (19.3, +/- 2.20, P=0.066) and finally SW480-1α (15.3, +/- 0.89,
P=0.011) and D05-1α (18.4, +/- 0.36, P=0.045 ). SW480-GFP as a negative control revealed
weakest migration (10.8, +/- 0.18) as proven in D05-GFP (12.4, +/- 0.36).
The experiments were repeated twice and similar results were obtained.
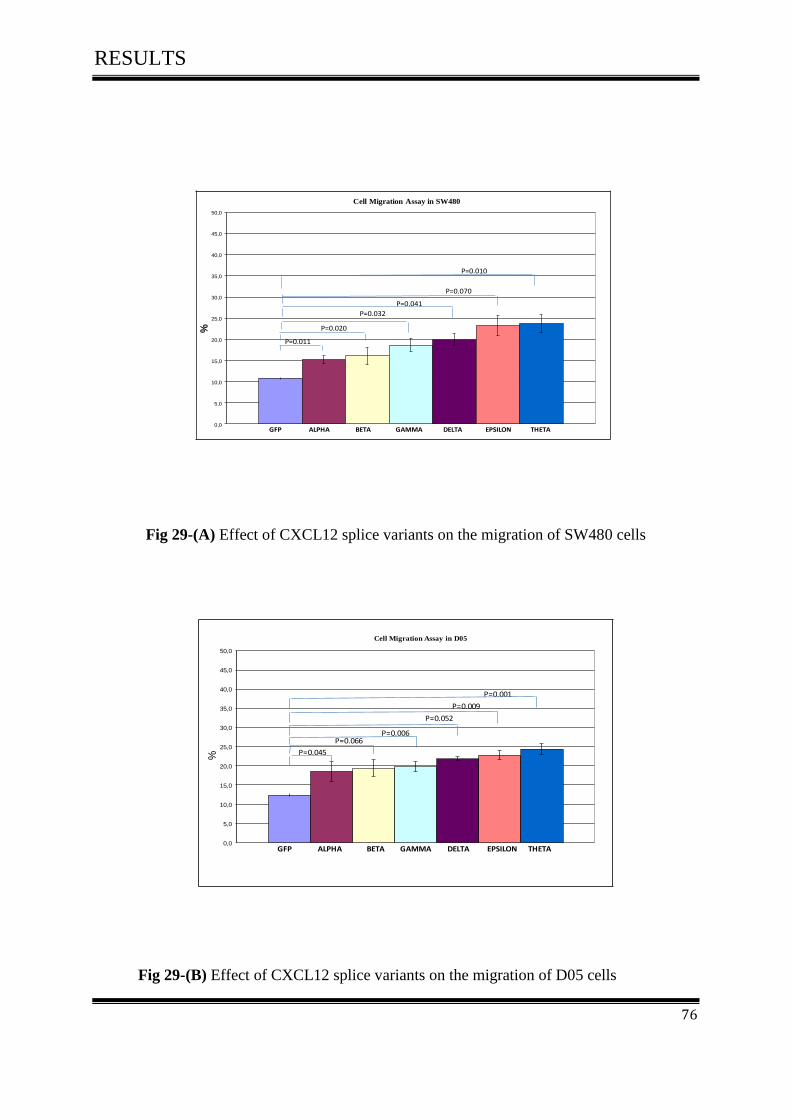
RESULTS
76
0,0
5,0
10,0
15,0
20,0
25,0
30,0
35,0
40,0
45,0
50,0
%Cell Migration Assay in SW480
GFP ALPHA BETA GAMMA DELTA EPSILON THETA
P=0.011
P=0.020
P=0.032
P=0.041
P=0.070
P=0.010
Fig 29-(A) Effect of CXCL12 splice variants on the migration of SW480 cells
0,0
5,0
10,0
15,0
20,0
25,0
30,0
35,0
40,0
45,0
50,0
%
GFP ALPHA BETA GAMMA DELTA EPSILON THETA
P=0.045
P=0.066P=0.006
P=0.052
P=0.009
P=0.001
Cell Migration Assay in D05
Fig 29-(B) Effect of CXCL12 splice variants on the migration of D05 cells
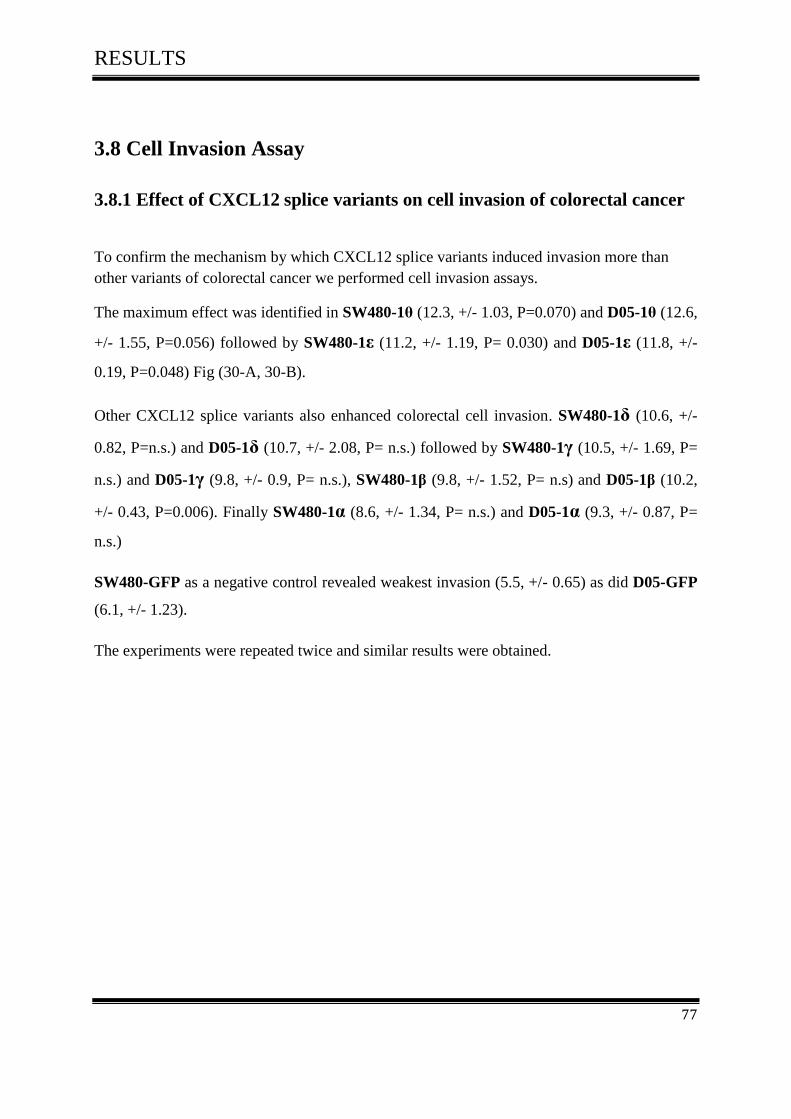
RESULTS
77
3.8 Cell Invasion Assay
3.8.1 Effect of CXCL12 splice variants on cell invasion of colorectal cancer
To confirm the mechanism by which CXCL12 splice variants induced invasion more than
other variants of colorectal cancer we performed cell invasion assays.
The maximum effect was identified in SW480-1θ (12.3, +/- 1.03, P=0.070) and D05-1θ (12.6,
+/- 1.55, P=0.056) followed by SW480-1ε (11.2, +/- 1.19, P= 0.030) and D05-1ε (11.8, +/-
0.19, P=0.048) Fig (30-A, 30-B).
Other CXCL12 splice variants also enhanced colorectal cell invasion. SW480-1δ (10.6, +/-
0.82, P=n.s.) and D05-1δ (10.7, +/- 2.08, P= n.s.) followed by SW480-1γ (10.5, +/- 1.69, P=
n.s.) and D05-1γ (9.8, +/- 0.9, P= n.s.), SW480-1β (9.8, +/- 1.52, P= n.s) and D05-1β (10.2,
+/- 0.43, P=0.006). Finally SW480-1α (8.6, +/- 1.34, P= n.s.) and D05-1α (9.3, +/- 0.87, P=
n.s.)
SW480-GFP as a negative control revealed weakest invasion (5.5, +/- 0.65) as did D05-GFP
(6.1, +/- 1.23).
The experiments were repeated twice and similar results were obtained.
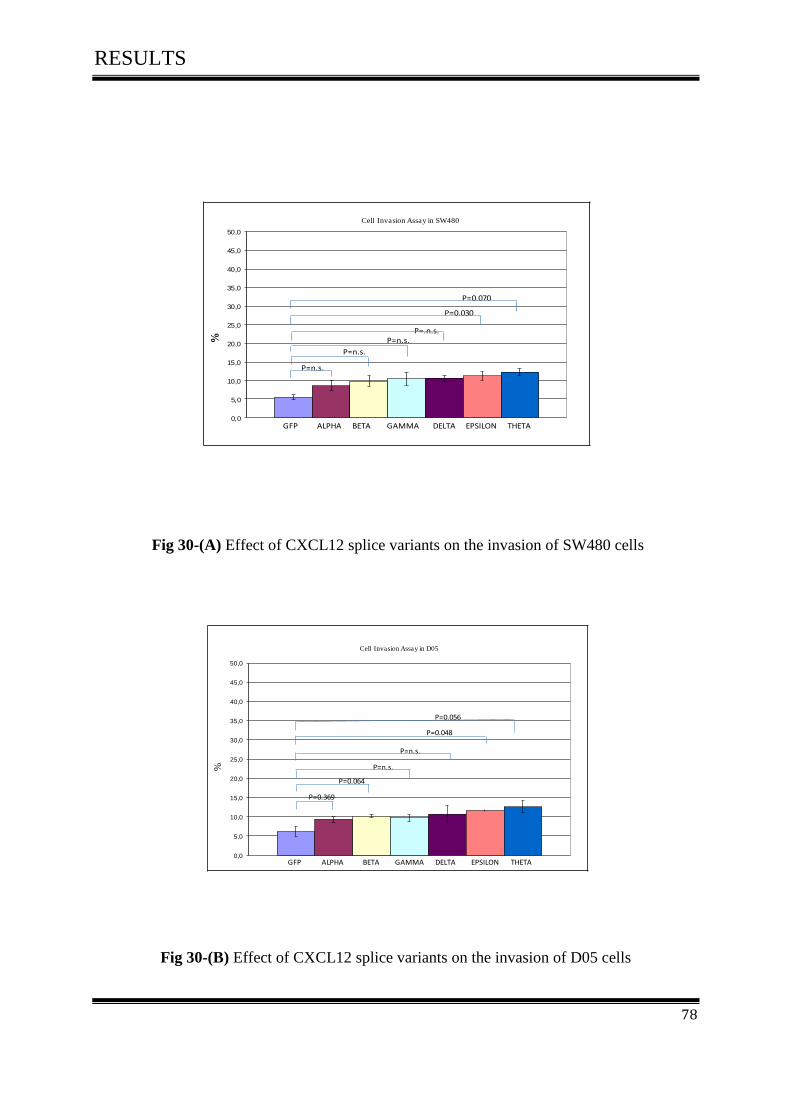
RESULTS
78
0,0
5,0
10,0
15,0
20,0
25,0
30,0
35,0
40,0
45,0
50,0
%Cell Invasion Assay in SW480
GFP ALPHA BETA GAMMA DELTA EPSILON THETA
P=n.s.
P=n.s.
P=n.s.
P=0.030
P=0.070
P=.n.s.
Fig 30-(A) Effect of CXCL12 splice variants on the invasion of SW480 cells
0,0
5,0
10,0
15,0
20,0
25,0
30,0
35,0
40,0
45,0
50,0
Cell Invasion Assay in D05
GFP ALPHA BETA GAMMA DELTA EPSILON THETA
%
P=0.369
P=0.064
P=n.s.
P=n.s.
P=0.048
P=0.056
Fig 30-(B) Effect of CXCL12 splice variants on the invasion of D05 cells

RESULTS
79
3.9-Cell Adhesion Assay
3.9.1 Effect of CXCL12 splice variants on cell adhesion of colorectal cancer
By comparing the results with SW480-GFP as a negative control we found that, CXCL12
splice variants significantly enhanced adhesion of SW480 and D05 cells. In contrast
CXCL12-1β promotes tumor cell adhesion more than other splice variants Fig (31-A, 31-B).
The results were in SW480-1β (71.8, +/- 2.8, P=0.003) and D05-1β (69.1, +/- 2.5, P=0.000)
followed by SW480-1α (70.2, +/- 4.5, P=0.009) and D05-1α (66.6, +/- 3.2, P=0.000) fol-
lowed by SW480-1γ (67.9, +/- 3.5, P=0.009) and D05-1γ (63.8, +/- 3.2, P=0.000), SW480-
1δ (66.3, +/- 2.5, P=0.033) and D05-1δ (63.3, +/- 3.2, P=0.000) and SW480-1ε (64.3, +/-
4.0, P=0.033) and as well as D05-1ε (61.4, +/- 3.5, P=0.000). Finally SW480-1θ (61.4, +/-
4.5, P=n.s.) and D05-1 θ (57.6, +/- 2.0, P=0.000).
SW480-GFP as a negative control showed the weakest results (58.4 %, +/- 5.0) and D05-
GFP (50.0 %, +/- 3.3).
The experiments were repeated twice and similar results were obtained.
RESULTS
80
Fig 31-A Effect of CXCL12 splice variants on the adhesion of SW480 cells
Fig 31-B Effect of CXCL12 splice variants on the adhesion of D05 cells
0,0
10,0
20,0
30,0
40,0
50,0
60,0
70,0
80,0
90,0
100,0
Cell Adhesion Assay in D05
%
GFP ALPHA BETA GAMMA DELTA EPSILON THETA
P=0.000
P=0.000P=0.000
P=0.000P=0.000
P=0.000
0
10
20
30
40
50
60
70
80
90
100
Cell Adhesion Assay in SW480
GFP ALPHA BETA GAMMA DELTA EPSILON THETA
P=0.009P=0.003
P=0.009P=0.033
P=0.033
P=0.469
%

RESULTS
81
3.10 The effect of CXCL12 splice variants on cell proliferation of colorectal
carcinoma and melanoma cell lines after treatment with different concen-
tration of AMD3100
3.10-1 Effect of CXCL12 splice variants on cell proliferation activity after
treatment with 0µg\ml AMD3100
Tumor growth induced by CXCL12 variants was inhibited through different concentration of
AMD3100. Our result showed that there is no significant inhibition of tumor growth with the
concentration of 0µg\ml AMD3100.
The luminescence analyses on day 4 showed that SW480-1β had the highest rate of growth
when compared with others variants (777 %, +/- 26.7%, P= 0.000). In Melanoma cell lines
D05-1β showed the same results (662 %, +/- 17.6%, P= 0.000). SW480-1α (749 %, +/-
35.2%, P= 0.000) and D05-1α (636%, +/- 27.3, P= 0.000) revealed the second strongest in-
duction of proliferation.
Followed by SW480-1γ (710 %, +/- 34.5%, P= 0.078) and D05-1γ (655 %, +/- 51.8%, P=
0.000) then SW480-1δ (694 %, +/- 39.5%, P= 0.000) and D05-1δ (615%,+/- 17.8%, P=
0.000), then SW480-1θ (694 %, +/- 11.9%, P= 0.023) and D05-1θ (572 %, +/- 21.4%, P=
0.000).
Finally SW480-1ε had the lowest rate of growth (625 %, +/- 44.6%, P= 0.000) and as proven
in D05-1ε (546 %, +/- 30.2%, P= 0.000).
SW480-GFP as a negative control showed the weakest results (571 %, +/- 15.3%) and D05-
GFP (454 %, +/- 15.5 %).
The experiments were repeated twice and similar results were obtained
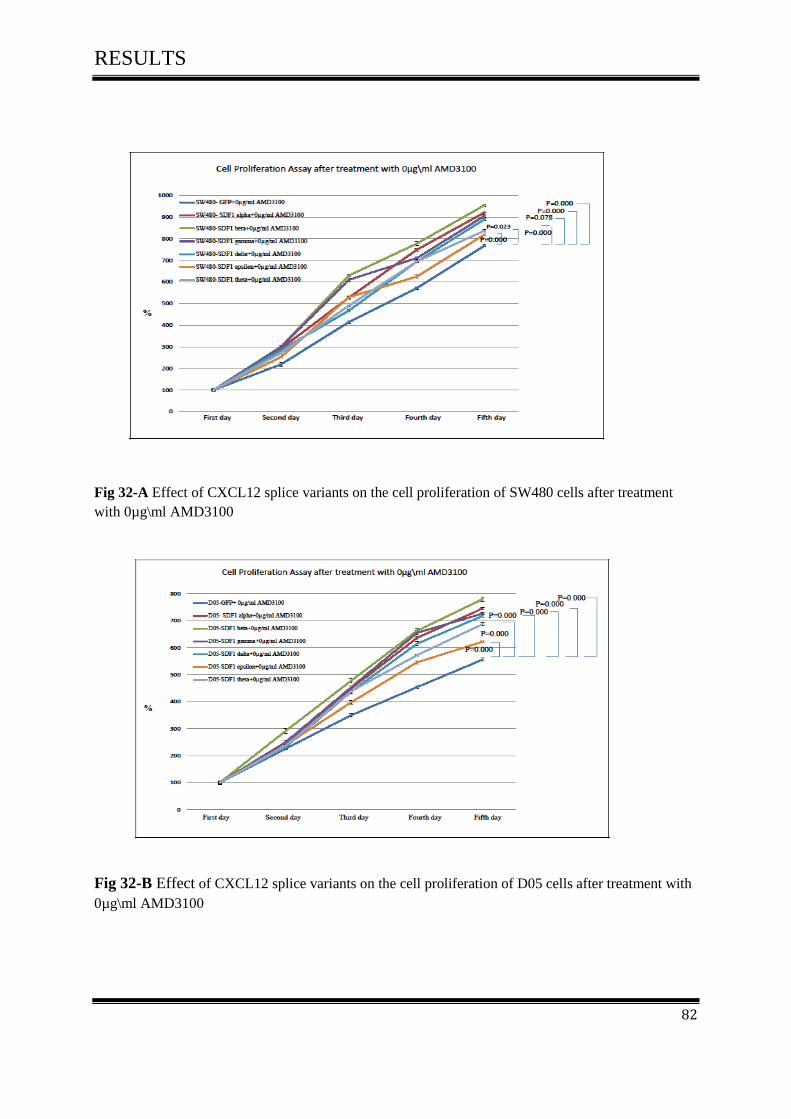
RESULTS
82
Fig 32-A Effect of CXCL12 splice variants on the cell proliferation of SW480 cells after treatment
with 0µg\ml AMD3100
Fig 32-B Effect of CXCL12 splice variants on the cell proliferation of D05 cells after treatment with
0µg\ml AMD3100

RESULTS
83
3.10.2 The effect of CXCL12 splice variants on cell proliferation activity
after treatment with 5µg\ml AMD3100
To study the effect of AMD3100 on CXCL12 splice variants induced cell proliferation in tu-
mor cells, cells were treated over night with 5µg\ ml AMD3100.
Our results showed that the enhancing effect of CXCL12 on cell proliferation was inhibited
by treatment with 5µg\ ml AMD3100.
The luminescence analyses on day 4 showed that SW480-1β had the highest rate of growth
(626 %, +/- 41.3%, P= 0.098) and D05-1β showed identical results (604 %, +/- 33.6%, P=
0.098). SW480-1α (615 %, +/- 40.6%, P= n.s.) and D05-1α (575%, +/- 18.3, P= 0.015) re-
vealed the second strongest induction of proliferation.
Followed by SW480-1γ (518 %, +/- 14.5%, P= 0.000) and D05-1γ (518 %, +/- 19.8%, P=
0.000). SW480-1δ (490 %, +/- 30.8%, P= 0.006) and D05-1δ (588 %, +/- 18.5,P= 0.000),
followed by SW480-1θ (518 %, +/- 16.4%, P= 0.000) and D05-1θ (471 %, +/- 27.6.%, P=
0.132) which revealed weaker proliferation induction.
Finally, SW480-1ε had the lowest rate of growth (401 %, +/- 15.6%, P= 0.019) as also shown
in D05-1ε (420 %, +/- 15.2%, P= 0.031).
SW480-GFP as a negative control showed following results (596 %, +/- 22.3%, P= 0.000) as
did D05-GFP (502 %, +/- 15.8%, P= 0.000).
The experiments were repeated twice and similar results were obtained
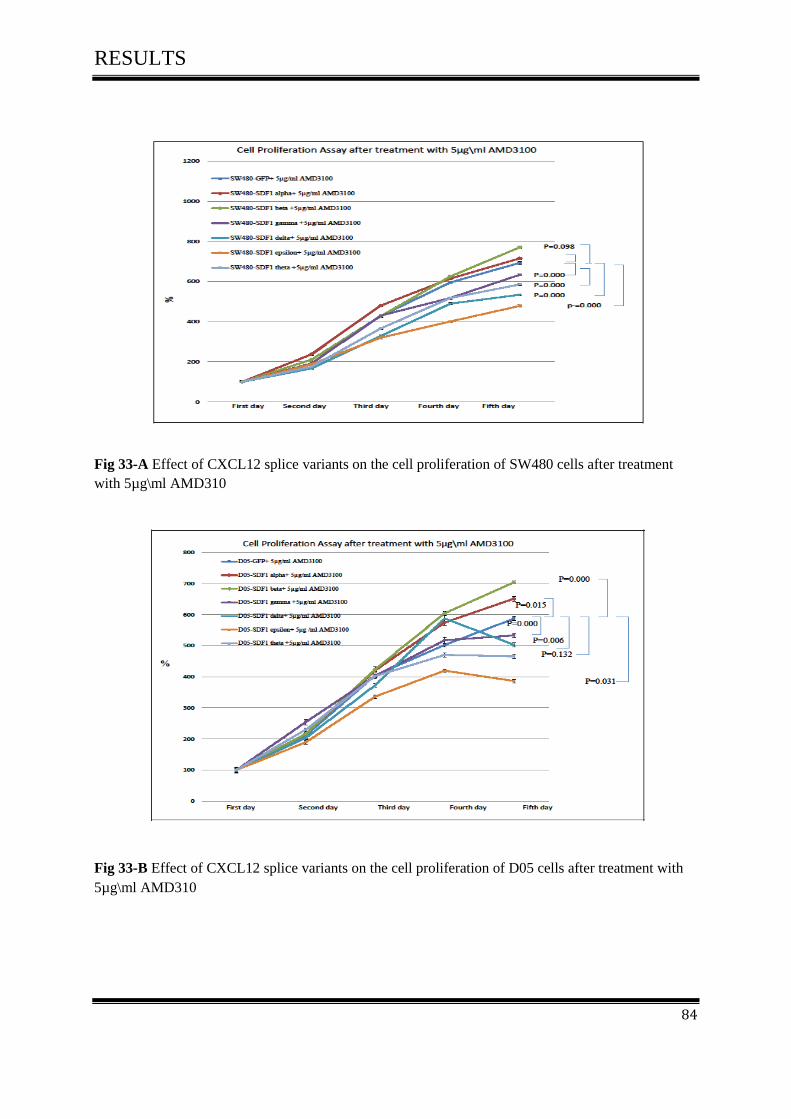
RESULTS
84
Fig 33-A Effect of CXCL12 splice variants on the cell proliferation of SW480 cells after treatment
with 5µg\ml AMD310
Fig 33-B Effect of CXCL12 splice variants on the cell proliferation of D05 cells after treatment with
5µg\ml AMD310

RESULTS
85
3.10.3 Effect of CXCL12 splice variants on cell proliferation activity after
treatment with 10µg\ml AMD3100
The effect of CXCL12 on tumor cell proliferation has been described under optimal culture
conditions. Treatment with AMD3100 has greatly inhibited spontaneous proliferation.
Our results showed that the enhancing effect of CXCL12 on cell proliferation was strongly
inhibited by treatment with 10µg\ ml AMD3100.
The luminescence analyses on day 4 showed that SW480-1β had the highest rate of growth
(489%, +/- 29.7%, P= 0.000) and D05-1β showed identical results (497%, +/- 41.5%, P=
0.047). SW480-1α (498%, +/- 31.2%, P= 0.000) and D05-1α (457%,+/- 14.6, P= 0.047) re-
vealed the second strongest induction of proliferation.
Followed by SW480-1γ (333%, +/- 15.5%, P= 0.098) and D05-1γ (454 %, +/- 42.8%, P=
0.142). SW480-1δ (473%, +/- 23.7%, P= 0.000) and D05-1δ (433%, +/- 22.3%, P= 0.004)
then SW480-1θ (419 %, +/- 35.5%, P= 0.000) and D05-1θ (422 %, +/- 39.1%, P= n.s.) which
revealed wearker proliferation induction.
Finally SW480-1ε had the lowest rate of growth (374 %, +/- 25.7%, P= 0.000) as also shown
in D05-1ε (382%, +/- 32.2%, P= 0.031).
SW480-GFP as a negative control showed following results (406%, +/- 18.1%) as did D05-
GFP (422 %, +/- 39.4%).
The experiments were repeated twice and similar results were obtained
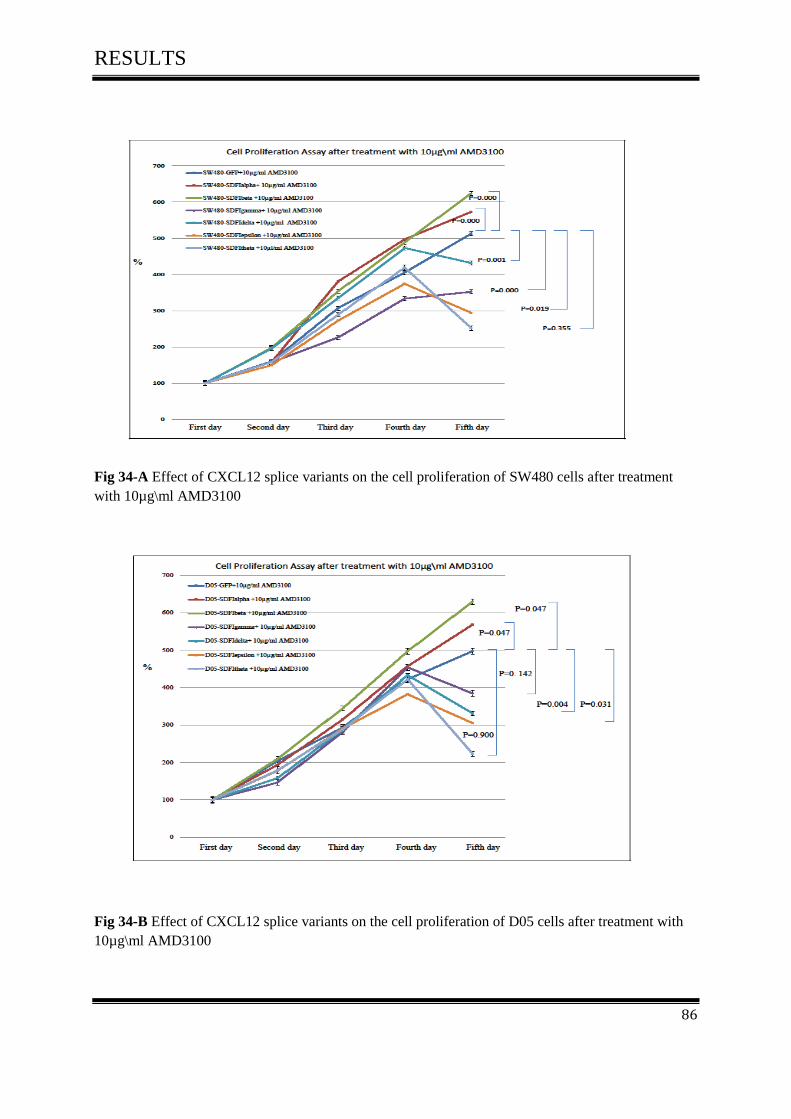
RESULTS
86
Fig 34-A Effect of CXCL12 splice variants on the cell proliferation of SW480 cells after treatment
with 10µg\ml AMD3100
Fig 34-B Effect of CXCL12 splice variants on the cell proliferation of D05 cells after treatment with
10µg\ml AMD3100

RESULTS
87
3.11 The Akt and MAPK signalling pathways in colorectal cancer
3.11.1 The effect of CXCL12 splice variants on the phosphorylation of AKT
MKE ½, SAPK/JNK and p38 in colorectal cancer
To test if CXCL12 splice variants expression in CRC cells is functional, and any of these
splice variants play a fundamental role in colon tumorigenesis we analysed major signalling
pathways after transfection with CXCL12 splice variants in colorectal carcinoma cell line
(SW480) and melanoma cell line (D05).
Our results showed that all CXCL12 splice variants activate AKT kinase and MAP kinase as
compared to the control in both cell lines. Activation and expression of phospho-AKT, phos-
pho-MKE ½, phospho-SAPK/JNK and phosoho-p38 were assessed by Western Blot (Fig 35-
A, 35-B).
All six CXCL12 splice variants activated and expressed phospho- AKT. CXCL12-beta has
the strongest expression followed by CXCL12-alpha as compared to other variants and the
control.
Concerning activation and expression of MAP kinases, our results showed in all six CXCL12
splice variants an induced a transient activation of phospho-MEK-1/2 which varied from
strong (Delta, Epsilon and Theta) and intermediate (Gamma) to weak (Alpha and Beta) in
both cell lines.
Similarly, SAPK/JNK kinases were phosphorylated after stimulation by CXCL12 variants.
while no p38 MAP kinase activation was observed (Fig 35-A, 35-B).

RESULTS
88
Fig 35- (A) Western Blot analysis of AKT and MAPKinase in SW480 cell line. CXCL12 variants
activated AKT, MEK, and SAPK/JNK phosphorylation. No activation of P38 MAPKinase was ob-
served
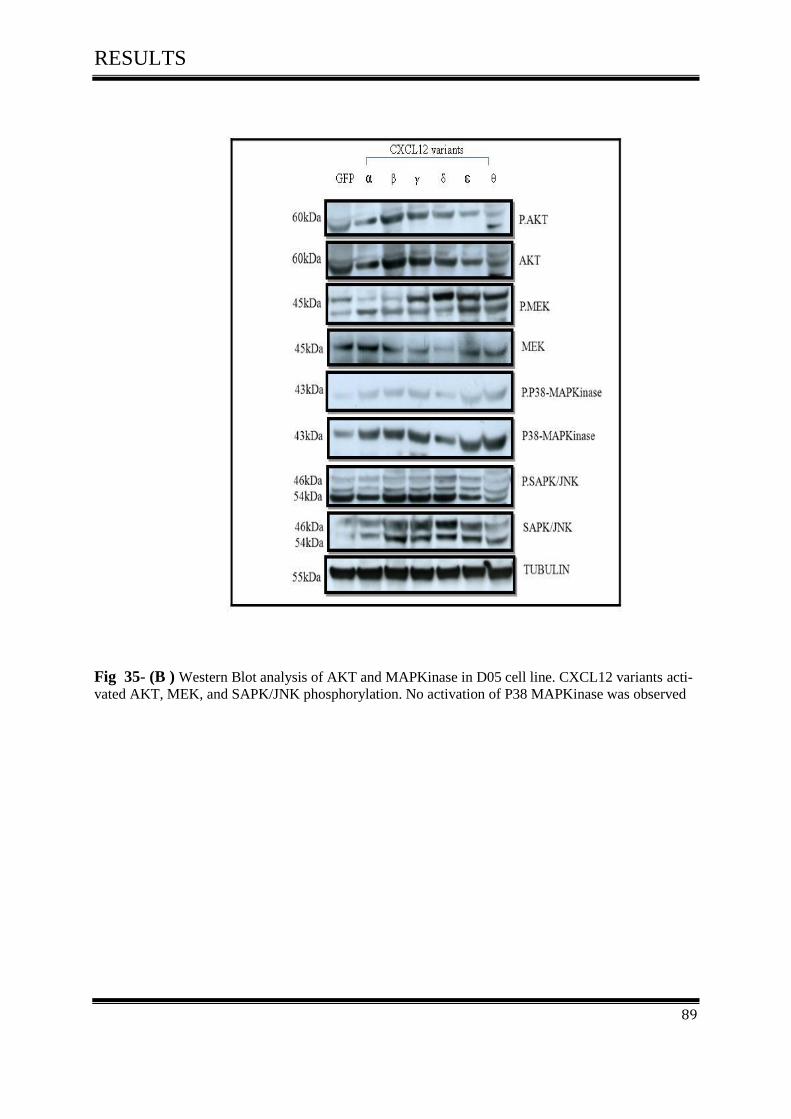
RESULTS
89
Fig 35- (B ) Western Blot analysis of AKT and MAPKinase in D05 cell line. CXCL12 variants acti-
vated AKT, MEK, and SAPK/JNK phosphorylation. No activation of P38 MAPKinase was observed

RESULTS
90
3.11.2 Effect of CXCL12 splice variants on the AKT& MEK-1/2 in colorec-
tal cancer after treatment with AMD3100
The ability of AMD3100 to decrease the effect of CXCL12 variants on inducing phosphoryla-
tion of AKT&MEK-1/2 was assessed. SW480 and D05 cells were treated with different con-
centration of AMD3100 (0µg\ml, 5µg\ml and 10µg\ml) and collected after 18-24 hours. Then
AKT and MEK-1/2 phosphorylation was determined by Western Blot as described.
3.11.3 The effect of CXCL12 splice variants on the phosphorylation of AKT
after treatment with AMD3100
Our findings indicated that CXCL12 splice variants activate AKT. Here the induction of
CXCL12 was inhibited by AMD3100 in both cell lines Fig (36-A) (36-B).
AMD3100 inhibit phosphorylation of AKT strongest in SW480-1δ, SW480-1ε, SW480-1θ
and weakest in SW480-1γ.
Thus, there was no significant inhibition of AKT phosphorylation in SW480-1α, SW480-1β.

RESULTS
91
Fig 36-(A) Effect of AMD3100 on CXCL12 splice variants induced phosphorylation of AKT in
SW480 Cells that were treated with different concentrations of AMD3100, 0µg\ml, 5µg\ml and
10µg\ml

RESULTS
92
We tested the ability of AMD3100 to decrease the effect of CXCL12 to induced phosphoryla-
tion of AKT in melanoma cell line D05 and obtained identical results.
Fig 36-(B) Effect of AMD3100 on CXCL12 splice variants induced phosphorylation of AKT in D05
Cells that were treated with different concentrations from AMD3100 with 0µg\ml, 5µg\ml and
10µg\ml.
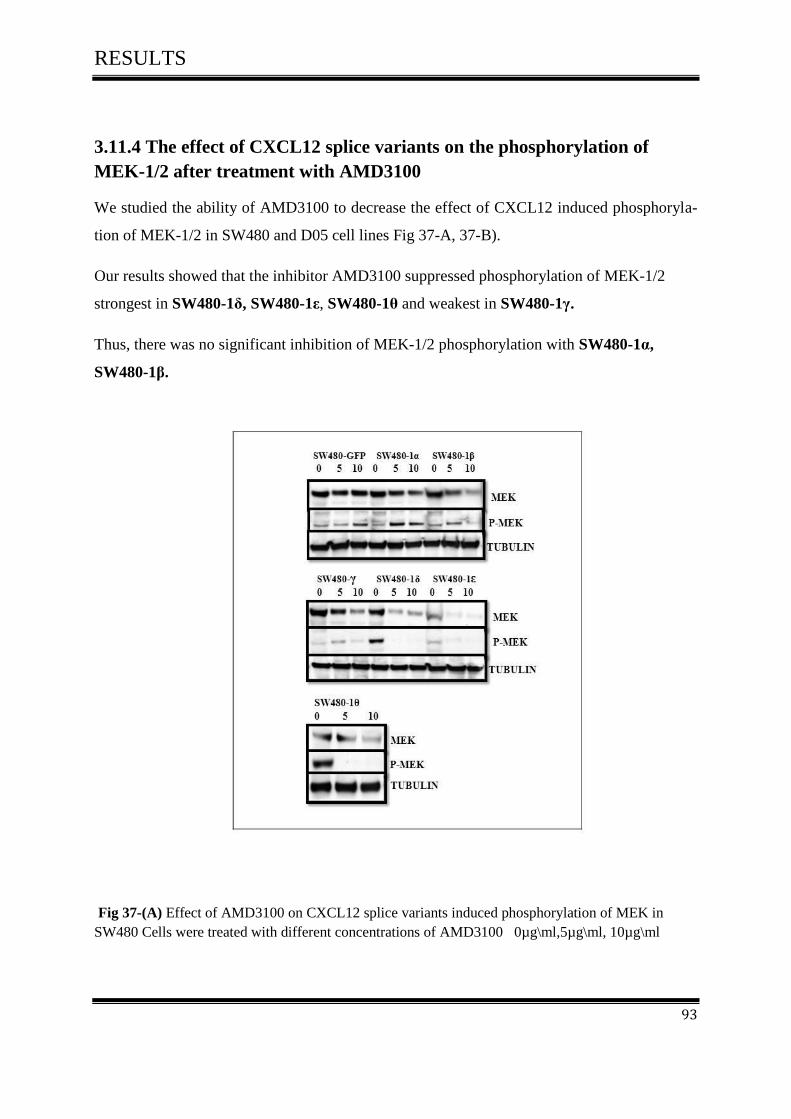
RESULTS
93
3.11.4 The effect of CXCL12 splice variants on the phosphorylation of
MEK-1/2 after treatment with AMD3100
We studied the ability of AMD3100 to decrease the effect of CXCL12 induced phosphoryla-
tion of MEK-1/2 in SW480 and D05 cell lines Fig 37-A, 37-B).
Our results showed that the inhibitor AMD3100 suppressed phosphorylation of MEK-1/2
strongest in SW480-1δ, SW480-1ε, SW480-1θ and weakest in SW480-1γ.
Thus, there was no significant inhibition of MEK-1/2 phosphorylation with SW480-1α,
SW480-1β.
Fig 37-(A) Effect of AMD3100 on CXCL12 splice variants induced phosphorylation of MEK in
SW480 Cells were treated with different concentrations of AMD3100 0µg\ml,5µg\ml, 10µg\ml

RESULTS
94
Identical results were obtained in D05.
Fig 37-(B) Effect of AMD3100 on CXCL12 splice variants induced phosphorylation of MEK in D05
Cells were treated with different concentrations of AMD3100 0µg\ml,5µg\ml, 10µg\ml

RESULTS
95
3-12 Animal experiments
3-12-1 In vivo xenograft model
3-12-2 Macroscopic examination of the mouse situs
After sacrificing the mice, the situs was opened and examined macroscopically for tumor in-
filtra-tion and metastasis. Some organs, such as the intestinum, liver and stomach were re-
moved and inspected. Subsequently, the size of the tumor was determined by a vernier mi-
crometer Fig (38, 39).
Left Right Left Right
SW480-1β SW480- GFP
Fig 38- Comparison between tumor infiltration in the positive clone (SW480-1β) and control
(SW480- GFP) .The tumor infiltrated the peritoneum.

RESULTS
96
Ex vivo analyses of tumor size indicated that compared to SW480-GFP as a negative control
all transfected cells (SW480-1α, SW480-1β, SW480-1γ, SW480-1δ, SW480-1ε and SW480-
1θ) revealed increased tumor growth. Particular SW480-1β has been associated with high
rates of tumor size Fig (39).
Left Right
SW480-1α
Left Right Left Right
SW480-1β SW480-1γ
Left RightLeft RightLeft Right
SW480-1δ SW480-1ε SW480- 1θ
SW480-GFP
Left Right
Fig 39- Comparison between tumor size and SDF1 isoforms of animals on the right &left side

RESULTS
97
We examined the relationship between tumor weight and tumor area with SDF-1 isoforms
(Table 32)
gene
N
Obs Variable Label N Mean
Std Dev
Mini-mum
Lower Quar-
tile Medi-
an
Upper Quar-
tile Maxi-mum
alpha 6 Weight AreaLeft TumorWeight-Right AreaRight
Weight TumorWeight-Right
6 6 6 6
25.73 115.5
0 0.40
82.50
2.13 51.45
0.20 50.27
22.30 24.00
0.19 35.00
24.40 91.00
0.20 48.00
26.30 132.5
0 0.39
65.00
26.60 144.00
0.50 112.00
28.50 169.00
0.73 170.00
beta 6 Weight AreaLeft TumorWeight-Right AreaRight
Weight TumorWeight-Right
6 6 6 6
22.78 146.6
7 0.67
68.50
0.84 42.02
0.18 37.04
21.86 96.00
0.51 45.00
22.00 120.00
0.53 48.00
22.70 140.0
0 0.61
50.00
23.43 168.00
0.87 78.00
24.00 216.00
0.90 140.00
control 6 Weight AreaLeft TumorWeight-Right AreaRight
Weight TumorWeight-Right
6 3 1 1
24.42 2.00 0.01 1.00
1.11 1.73
.
.
23.40 1.00 0.01 1.00
23.60 1.00 0.01 1.00
24.22 1.00 0.01 1.00
24.60 4.00 0.01 1.00
26.50 4.00 0.01 1.00
delta 6 Weight AreaLeft TumorWeight-Right AreaRight
Weight TumorWeight-Right
6 6 6 6
24.15 74.50
0.39 42.83
0.96 73.60
0.20 18.61
22.40 20.00
0.16 25.00
23.77 25.00
0.30 25.00
24.45 48.00
0.33 42.00
24.85 90.00
0.46 60.00
25.00 216.00
0.75 63.00
epsilon 6 Weight AreaLeft TumorWeight-Right AreaRight
Weight TumorWeight-Right
6 6 6 6
23.73 59.83
0.47 44.83
1.20 32.68
0.14 30.45
22.15 20.00
0.33 28.00
22.90 25.00
0.38 28.00
23.60 62.00
0.44 30.00
24.80 90.00
0.50 48.00
25.30 100.00
0.74 105.00
gamma 6 Weight AreaLeft TumorWeight-Right AreaRight
Weight TumorWeight-Right
6 6 6 6
23.07 97.50
0.36 41.00
1.23 51.68
0.08 24.84
22.10 28.00
0.28 24.00
22.60 70.00
0.30 25.00
22.70 88.50
0.35 30.50
22.80 140.00
0.43 48.00
25.53 170.00
0.45 88.00
theta 6 Weight AreaLeft TumorWeight-Right AreaRight
Weight TumorWeight-Right
6 6 6 6
24.85 80.83
0.43 84.50
1.11 48.31
0.14 53.61
23.90 25.00
0.20 40.00
23.90 30.00
0.38 48.00
24.60 86.00
0.44 61.50
25.50 108.00
0.55 120.00
26.60 150.00
0.60 176.00
Table 32- Summary measures for the distribution of tumor weight and tumor area with SDF 1
isoforms

RESULTS
98
Our results demonstrate that there is a significant difference between the SDF-1 isoforms for
tumor weight and tumor area of animals on the left & right side. However SDF1 beta fol-
lowed by SDF1 alpha showed the highest rate of tumor weight and tumor area of animals as
compared with other SDF-1 isoforms Fig (40, 41).
Fig 40-(A) Comparison of the average tumor weight with SDF-1 isoforms of animals on the
left side
Fig 40-(B) Comparison of the average tumor weight with SDF-1 isoforms of animals on the
right side

RESULTS
99
Fig 41-(A) Comparison of the average tumor area with SDF-1 isoforms of animals on the
left side
Fig 41-(B) Comparison of the average tumor area with SDF-1 isoforms of animals on the
right side
DISCUSSION
100
4 DISCUSSIONS
4.1 CXCL12 Gene polymorphism
The novel human CXCL12 (SDF-1) isoforms, known as SDF-1alpha, SDF-1beta, SDF-
1gamma, SDF-1delta, SDF-1epsilon and SDF-1theta derived from alternatively splicing
events of the same gene [73].
A single-nucleotide polymorphism (SNP), designated CXCL12-G801A (rs1801157), was
identified in the 3` untranslated region (3`UTR) of the CXCL12b gene transcript and involved
a G-to-A transition at nucleotide position p801 relative to the start codon. The functions of
SDF-1 are thought to be important for the pathogenesis of certain diseases [93, 94].
Several studies have been carried out to examine an association between disease susceptibility
and CXCL12-3`G801A polymorphism. These studies suggested that CXCL12-3`G801A pol-
ymorphism was associated with an increased risk of HIV infection [95], lung cancer [96]
breast cancer [97], acute leukemia [98], prostate cancer [99], non- Hodgkins lymphoma [100]
and oral squamous cell carcinoma [101,102]. However, only a few studies concern the
CXCL12-3`G801A polymorphism in CRC patients to clarify whether the CXCL12-3`G801A
polymorphism is associated with disease susceptibility and clinical characteristics in colorec-
tal cancer.
A total of 73 patients were included in our study group, the frequency of G/G homozygote
was observed in fifty (68.5%) CRC patients as compared to twenty three (31.5%) patients
with G/A and A/A genotypes. it is of interest to compare the results that we obtained by
CXCL12 gene polymorphism in human colorectal cancer with those obtained previously. The
results of the present study were nearly similar to the results of Dimberg et al., 2007, who
studied the CXCL12 Gene polymorphism in 151 CRC patients and 141 controls and reported
that the frequency of (GG) (GA) (AA) genotypes were 55.6 (84%), 41.1 (62%) and 3.3 (5%)
for their CRC patients respectively, there was no significant difference in genotype distribu-
tion between CRC patients and controls [80].
Also our results were nearly similar to the results of Van Rii. et al., 1998, who analyzed the
effect of SDFI-gene in 344 participants of the Amsterdam cohort on ADIS-free survival and
survival after ADIS diagnosis and reported that 12 (3.5%) subjects were homozygous (AA)

DISCUSSION
101
and 95 (27.6%) subjects were heterozygous (GA). The remaining 237 (68.9%) subjects were
wild homozygous (GG) [103].
In present study we attempted to determine whether an association existed between the
CXCL12 gene polymorphism and CRC, the data in this report showed that the genotype dis-
tribution was significantly associated with CRC.
Previous publications further reported that the influence of the CXCL12 gene polymorphism
may contribute differentially between colon and rectal cancer in mediating tumor progression,
angiogenesis, metastasis and leukocyte migration [80].
Dimberg. et al., 2007 [80] and Hidalgo-Pascual. et al., 2007 [104] could not elicit a significant
correlation between CXCL12-A and different prognostic markers such as metastasis devel-
opment or disease-free survival time in CRC in their studies. Our data were in line with their
publication, we only found a trend towards larger primary tumor.
Our results were in disagreement with the study of Chang SC. et al., 2009, who compared the
frequency of 6 SDF1alpha single-nucleotide polymorphisms (SNPs) in 424 patients with pri-
mary T3 stage CRC. He reported that SDF1alpha-G801A polymorphism was associated with
LN metastasis. The frequency of GA/AA genotypes was significantly higher (54.8%) in a
group of patients with lymph node metastasis than in patients without LN metastasis (40.7%).
In the latter group, disease-free survival was shorter in patients with the GA/AA genotype
(74%) than in patients with the GG genotype (87.6%). His conclusion of the experiment was
that the SDF1alpha-G801A polymorphism could increase expression of SDF-1alpha mRNA
and be a predictive marker of lymph node metastasis in colorectal cancer [105].
To assess the association between the CXCL12 G801A polymorphism and cancer risk, Gong
H. et al., 2012, reported that a meta-analysis of 17 studies with 3048 cancer patients and 4522
controls was conducted to evaluate the strength of the association using odds ratio (OR) with
95% confidence interval (CI). The results showed that the variant genotypes were associated
with a significantly increased risk of all cancer types (OR=1.38, 95% CI=1.18-1.61 for GA
versus GG, and OR=1.36, 95% CI=1.17-1.59 for GA/AA versus GG). This meta-analysis
indicated that the CXCL12 G801A polymorphism is a low-penetrance risk factor for cancer
development [106].
R-status R-status

DISCUSSION
102
CXCL12 played an important role in two non related diseases, HIV and cancer, as its receptor
(CXCR4) is the co-receptor used by HIV T-tropic strains [94]. The CXCL12 G801A poly-
morphism was first described in HIV-infected patients [95, 107].
About the role of CXCL12 G801A (rs1801157) polymorphism in other tumors such as breast
cancer, Shen W. et al., 2012, reported that the CXCL12 G801A polymorphism had been im-
plicated in breast cancer risk and it may be a low-penetrate risk factor for developing breast
cancer [108].
To investigate the effect of the CXCL12 G801A polymorphism in prostate cancer, Hirata H.
et al., reported that the frequency of CXCL12 AA genotype was significantly higher in a
group of patients with lymph node metastasis (23%) compared with those without metastasis
(7%). The frequency of CXCL12 expression in AA + GA genotype carriers was significantly
higher than that in GG genotype carriers. This study suggests that CXCL12 G801A polymor-
phism can be an important marker for detecting micro invasion and PC metastasis [99].
Other studies demonstrated that there was no relationship between the CXCL12 G801A
(rs1801157) polymorphism and cervical carcinoma [109] and bladder carcinoma [110].
4.2 Expression and activity of CXCL12 splice variants in Human Colorectal
carcinoma and normal colon mucosa
This is the first study analyzing the expression profiles of the chemokine CXCL12 (SDF-1)
splice variants in a larger series of human colorectal cancer tissues and normal human muco-
sa.
It would be interesting to investigate the expression of novel CXCL12 splice variants and to
understand the potential pathophysiological relevance under different conditions. Different
splice variants in some cases may display similar functions but are active in different tissues
or physiological conditions. A better understanding of the functional diversity of SDFI splic-
ing variants may lead to novel therapies that target these variants, which may delay or inhibit
the metastatic process in cancer cells.
Previous studies demonstrated that CXCL12 is widely expressed in various organs including
heart, liver, brain, kidney, skeletal muscle and lymphoid organs, vascular endothelial cells,

DISCUSSION
103
stromal fibroblasts, and osteoblasts are the major cellular source for CXCL12 in these organs
[111, 112, 113, 114, 115].
Subsequent studies have confirmed that chemokine CXCL12 is also expressed constitutively
in ovarian cancer [116, 117], breast cancer [118, 119], prostate cancer [120, 121], pancreatic
cancer [122,123], thyroid cancer [124], Glioblastoma [125] and colorectal cancer [126, 127].
CXCL12 is also expressed in many other human tumors such as renal cell carcinoma, gastric
cancer, cervical cancer, kidney cancer, lung cancer and hepatocellular carcinoma [69].
In recent study we have found the expression of the novel splice variants of CXCL12 in colon
cancer and mucosa tissues, so we were not surprised to identify the frequent expression of
CXCL12 variants in CRC. SDF1alpha was the most predominant splicing variant in both co-
lon and mucosa tissues followed by SDFIbeta, whereas the other splice variants gamma, delta,
epsilon and theta were expressed less abundantly. Our findings were consistent with previous
data in the literature of Yu, L. et al., 2006, Altenburg, J. et al., 2007, Janowski, M., 2009, that
demonstrated that SDFIalpha was a ubiquitously expressed splicing variant in all organs and it
played different roles (motogen, mitogen, neuromodulator) in various tissues. SDFIbeta iso-
form was more limited, his activity in the blood seemed to be designed for inter-organ com-
munication via blood-mediated gradients as well as for supporting angiogenesis [73, 71, 70].
Davis, DA et al., 2005, reported in his study that SDF-1alphawas the most widespread splic-
ing variant. It played important roles in many physiological processes: It was an essential reg-
ulator of haematopoiesis, lymphocyte homing, pre-B-cell growth, angiogenesis [128], the
management of the HSC population in bone marrow [129], the guidance of primordial germ
cells during development [130]. It played a part in the CNS as neuro-modulator [131].
In contrast SDF-1β was less prevalent than SDF-1α and seemed to be related to the vascular
system [128]. SDF-1β was more resistant to blood-dependent degradation stimulated angio-
genesis and was present in highly vascularized organs such as the liver, spleen, bone marrow
and kidneys, with absence in the brain [40, 73, 132].
SDF-1γ -mRNA was expressed at higher levels in adulthood [133]. It was found mainly in the
heart, brain and bone marrow [134].
SDF-1δ, SDF-1ε and SDF-1 splicing variants were all abundant in the pancreas. SDF-1δ was
detected in the spleen, fetal liver and lungs whereas SDF-1 and SDF-1ε were found in the
heart and liver, fetal and adult kidneys [70, 73].

DISCUSSION
104
4.3 Effect of CXCL12 splice variants on proliferation of colorectal
cancer cells
4.3.1 CXCL12 splice variants induced tumor cell proliferation
The effect of CXCL12 splice variants in two cell lines SW480 and D05 was tested in vitro by
using cell proliferation assays. Our findings provided interesting data on CXCL12 (SDF-1)
splice variants promoting proliferation of colon cancer cells.
In the present study, we were able to detect functional differences of novel CXCL12 splice
variants in their ability to induce tumor cell proliferation. All SDF-1 splice variants had ef-
fects on cell proliferation of tumor cells, However SDFI beta and SDFI alpha showed the
highest rate of growth as compared with other SDF-1 splice variants.
Numerous studies demonstrated that ligand receptor binding of CXCL12 to CXCR4 axis was
involved in several aspects of tumor progression including angiogenesis, cell proliferation,
adhesion, and directional migration [52,135,136, 137,138].
Sehgal et al. provided the first evidence that CXCL12 could modulates tumor cell prolifera-
tion and survival [139] for mitotic CXCL12 activity in human tumors, where as transfection
of an antisense RNA that blocks CXCR4 translation inhibited glioma cell proliferation. After
that, Barbero et al. confirmed that glioma cell proliferation can be induced by exogenous
CXCL12 [140].
Subsequent studies reported that CXCL12 can induce proliferation of several tumor cell lines,
in addition to glioma cells, including ovarian carcinoma [55], small cell lung cancer [54],
prostate cancer [141], neck squamous cell carcinoma [142] and pancreatic cancer [143].
CXCL12-dependent proliferation correlated with the activation of ERK1/2 and AKT path-
ways. Both pathways were known to be involved with the transduction of proliferative signals
in normal and tumor glial cells [144].

DISCUSSION
105
AKT was known to play a pivotal role in tumor cell survival and possible proliferation [140].
Also P38 and ERK1/2 have been implicated in tumor cell survival; therefore AKT may not be
the only player in cell survival signaling [145].
CXCL12 could promote cell survival through the PI3-kinase- and MAP-kinase cascades
without cell cycle progression. BAD is a pro-apoptotic protein of the Bcl-2 family that could
be inactivated by the CXCL12-mediated activation of MAPK extracellular signal regulated
kinases (MEK), extracellular signal-regulated kinase-ribosomal S6 kinases, and PI3K-
pathways. Genes associated with cell survival could be up-regulated upon CXCL12 exposure.
Thus, CXCL12 promoted cell survival by two mechanisms 1- post-translational inactivation
of the cell death machinery 2- an increased transcription of cell survival-related genes [146].
The ERK MAPK pathway was one of the most important mechanisms for cell proliferation in
tumor cells [147], CXCL12-dependent cell proliferation was linked to ERK activation [54, 55,
141, 148, 149].
In this experimental study, comparing the results of cell proliferation assay with the results of
signal transduction experiments, we showed that SDF-1 beta activated AKT strongly, and
AKT could enable proliferation and survival of cells that have sustained a potentially muta-
genic impact. Therefore, it could contribute to acquisition of mutations in other genes (As
noted above).

DISCUSSION
106
4.3.2 Role of AKT in cell proliferation
AKT is a 57 kD Ser/Thr kinase also known as PKB (Protein kinase B), that plays a key role
in multiple cellular processes including glucose metabolism, apoptosis, transcription, cell mi-
gration and cell proliferation.
The function of numerous substrates related to the regulation of cell proliferation, such as
glycogen synthase kinase-3 (GSK-3) membrane translocation of the glucose transporter
GLUT4, Cyclin-dependent kinase inhibitors, P21/Waf1/Cip1 and P27/Kip2, mammalian
target of rapamycin (mTOR), and tuberous sclerosis complex 2 (TSC2) modulates by acti-
vated Akt protein (Fig 42) [150].
Several factors are directly phosphorylated by AKT. Cross et al., provided the first evidence
of kinases regulating GSK3 in insulin, and the inhibition of GSK3 activity by Akt leading to
direct phosphorylation of an N-terminal regulatory serine residue downstream of insulin-
activated PI3K. They also reported that the inhibition of GSK3 by Akt prevented the phos-
phorylation of the cytoplasmic signaling molecule β-catenin, which impeded its degradation;
hence it was translocated to the nucleus. Once in the nucleus, β-catenin combined with differ-
ent transcription factors like TCF/LEF-1, to induce the expression of several genes, such as
Cyclin D1, which induced cell cycle progression via regulation of RB hyper phosphorylation
and inactivation. [151].
AKT phosphorylated both of P21/Waf1/Cip1 and P27/Kip2, and inhibited their anti-
proliferative effects by retaining them in the cytoplasm [150].
mTOR is also phosphorylated by Akt, which promotes translation of Cyclin D mRNA. P70
ribosomal protein S6 kinase (P70S6K1) is also activated and eukaryotic initiation factor 4E-
binding protein 1 (4EBP1) is inhibited by mTOR [152,153].
Finally Phosphorylation of TSC2 by Akt to inhibited its growth suppressor functions. Phos-
phorylated TSC2 failed to form a complex with TSC1, which inhibited P70S6K1 (an activator
of translation) and activated 4E-BP1 (an inhibitor of translation) [152,154].

DISCUSSION
107
Fig 42- Regulation of cell proliferation and survival by PI3KAkt signalling [150].
4.3.3 Role of MAPK in cell proliferation
The carcinogenesis of colorectal cancer is a complex multistep process involving progressive
disruption of intestinal epithelial-cell proliferation, apoptosis, differentiation, and survival
mechanisms [155]. The cell cycle is regulated by external signals. Several growth factors trig-
ger signal transduction cascades through binding to membrane receptors and internal cell sig-
nalling including Ras mutations and SRC1 activation [156]. Dysregulation of the cell cycle is
common and contributes to tumorigenesis in colorectal cancer and other malignant disorders
[156]. Several studies demonstrated that the ERK MAPK pathway, but not the JNK pathway
or the p38 MAPK pathway, was a major regulator of cell proliferation in colorectal cancer
[156].

DISCUSSION
108
Fig 43- MAPK signalling in pathogenesis [156].
There are three major subfamilies of MAPK: the extracellular-signal-regulated kinases (ERK
MAPK, Ras/Raf1/MEK/ERK); the c-Jun N-terminal or stress-activated protein kinases (JNK
or SAPK) and MAPK14 also known as P38. That these signalling cascades cause altered
gene expression is well established in human beings [157]. The ERK MAPK pathway is one
of the most important for cell proliferation [158].
There is an increasing amount of evidence suggesting that the activation of the ERK MAPK
pathway is involved in the pathogenesis, progression, and oncogenic behaviour of human col-
orectal cancer [159].

DISCUSSION
109
4.4 Effect of CXCL12 splice variants on migration and invasion of
colorectal cancer cells
4.4.1 CXCL12 splice variants stimulate tumor cell migration and invasion
The effect of CXCL12 splice variants in two cell lines SW480 and D05 was tested in vitro by
using cell migration and cell invasion assays.
The major findings of the present study were that all SDF-1/CXCL12 splice variants promot-
ed cell migration and invasion of colorectal cancer cells. SDF-1 theta and SDF-1 epsilon in-
duced migration and invasion more than other splice variants of colorectal cancer.
The functional role of the CXCL12/CXCR4 axis in tumor progression and metastasis has
been emphasized. Several lines of evidence suggested that the CXCL12/CXCR4 system was
involved in the progression and metastasis of CRC ligand receptor binding of CXCL12 to
CXCR4 [160, 161, 162].
The CXCL12/CXCR4 pathway could mediate cancer cells homing to specific secondary sites,
thereby promoting organ-specific metastasis. The first evidence provided by Muller et al.
2001 showed that the CXCL12/CXCR4 pathway mediated human breast cancer metastasis.
The blocking of CXCR4 in vivo with the use of a specific antibody or selective synthetic pol-
ypeptide or siRNA resulted in significant inhibition of breast cancer metastasis to regional
lymph nodes as well as in the lung [163].
The blocking of CXCR4 expression on the cell surface greatly reduced the ability of colon
cancer cells to metastasize to liver and lungs [164].
Many studies demonstrated that high levels of CXCL12 are found in different organs such as
lymph nodes, lung, liver, and bone marrow, where tumors frequently metastasize
[163,165,166]. In addition to what we have mentioned above, Hypoxia induced expression of
CXCR4 on tumor cells [167]. This would sensitize tumor cells to CXCL12 signals and pro-
mote tumor metastasis. Yet, hypoxia stimulates both CXCR4 and CXCL12 expression [62].
Human cancer cells express CXCL12 such as neuroblastoma [168], glioblastoma [140], Ovar-
ian [55,62], Breast [118, 119, 163], Colon [167], Prostate [121] and Pancreas [122].

DISCUSSION
110
The pathway Ras/Raf/MEK/ERK included several proto-oncogenes and was deregulated in
about 30% of all cancers. This cascade was involved in the control of growth signals, cell
survival, and invasion in cancer. During the process of oncogenic transformation, colorectal
cancer cells escaped from normal growth and differentiation control and acquired the ability
to invade surrounding tissues and organs [156].
In this present experimental study, we compared the results of cell migration and invasion
assay with the results of signal transduction experiments and could show that the stimulation
of CXCL12/CXCR4 played an important role in colon cell migration and invasion by the in-
duction of MEK1/2 and AKT signal transductions. SDF-1 theta and SDF-1 epsilon activated
MEK1/2 strongly and MEK1/2 could enable cell migration and invasion in tumor cells (As
noted above).
Our findings tested also that CXCL12 and its splice variants played an important role in the
invasion as well as the metastasis in colon cancer. These results were consistent with the pre-
vious studies that demonstrated the activation of ERK and AKT signalling after stimulation of
cancer cells with CXCL12 [169-171]. A high level of actin polymerization was a key for the
formation of pseudopodia in cancer cells, which in turn were implicated in the enhancement
of cancer cell migration and invasion [172, 173]. Brand, S., 2005, reported that CXCL12
could activate ERK-1/2, SAPK/JNK kinases, AKT and matrix metalloproteinase-9 (MMP-9).
These CXCL12-induced signals mediated reorganization of the actin cytoskeleton, resulting
in increased colon cell migration and invasion. [171].
Bonacchi, A. et al., 2001, observed that the activation of MAP kinases such as ERK-1/2 and
the activation of AKT have been linked to cell migration [174].
Sotsios, Y.et al., 1999, indicated that CXCL12 predominantly activated MEK-ERK MAP
kinase and Akt signalling. Interestingly, the activation of ERK-MAP kinases and Akt has
been implicated in cell migration [175]. Finally several studies have demonstrated the persis-
tent localization of matrix metalloproteinase (MMP) expression to the interface between in-
vading CRC cells and surrounding stroma, supporting a role for MMP secretion in CRC inva-
sion and metastasis [176].

DISCUSSION
111
4.5 Effect of CXCL12 splice variants on adhesion of colorectal
cancer cells
4.5.1 CXCL12 splice variants promote tumor cell adhesion
The effect of CXCL12 splice variants in two cell lines SW480 and D05 was tested in vitro by
using cell adhesion assay.
Our experiments demonstrated that all SDF-1/CXCL12 splice variants induced cell adhesion
of colorectal cancer cells in vitro. SDFIbeta and SDFIalpha promoted colorectal cell adhesion
more than other splice variants.
Metalloproteases (MMPs) are a family of enzymes involved in the degradation of extracellu-
lar matrix in the surrounding normal tissue and mediated cancer invasion and metastases
[177]. Activation of Metalloproteases broke down the physical barriers of metastasis, thus
promoting invasion by cancer cells [178]. CXCL12 may modulate the expression and func-
tion of cell surface integrin molecules and promoted tumor cell adhesion. Integrins are a large
family of heterodimeric transmembrane glycoproteins that attached cells to extracellular ma-
trix proteins of the basement membrane or to ligands on other cells. CXCL12 induced adhe-
sion of SCLCs to VCAM-1, fibronectin, and collagen [179,180].
In support of this observation numerous studies have documented that the chemokine
CXCL12 induced MMP synthesis in different cell types and facilitated tumor cell adhesion
and colonization [181-185].
The CXCL12/CXCR4 pathway was implicated in the mechanic process of tumor metastasis
including tumor cell adhesion and migration [69].

DISCUSSION
112
4.6 AKT and MAPK signalling pathways involving in colorectal
cancer
4.6.1 Effect of CXCL12 splice variants on the phosphorylation of AKT in
colorectal cancer
Signal transduction experiments indicated that CXCR4/CXCL12 pathway was functional in
human CRC cells mediating specific functions such as CRC proliferation, migration and inva-
sion [171]. Therefore, the importance of AKT and its signalling pathway in colorectal carcin-
ogenesis was the topic of this work.
Here the major research goal was to understand the function of AKT and oncogenic activity
in colon cancer. A recent study found that all six CXCL12 splice variants activated and ex-
pressed phospho-AKT. CXCL12-beta has the strongest expression followed by CXCL12-
alpha. and CXCL12-theta has the weakest expression as compared to other variants.
Understanding AKT kinase and its downstream signaling pathway was important to exploit
Akt as a target for therapeutic intervention for cancer.
Akt was involved in the pathway PI3K/AKT/mTOR and PI3K/AKT which activated human
cancer [186].
AKT was a major downstream effector of PI3K and played pivotal roles in protein synthesis,
cellular metabolism, survival, and proliferation. [187]. Baba et al., 2011, examined the role of
activated AKT expression in 717 patients with colorectal cancer. They reported that p-AKT
expression was related with early stage disease and good prognosis. P-AKT expression might
serve as positive prognostic marker in colorectal cancer patients [187].
Previous studies indicated that Akt / protein kinase B was related with various cellular re-
sponses, including tumor cell survival, proliferation, and invasiveness. The activation of Akt
was also one of the most frequent alterations observed in human cancer. Tumor cells that had
constantly active Akt could depend on Akt for survival [188,189].
Huang X.F., Chen J.Z,. 2009, demonstrated that the PI3K/Akt signal pathway activated nu-
merous signals for cell survival, cell growth and cell cycle leading to carcinogenesis [190].

DISCUSSION
113
Two main intracellular pathways, the mitogen-activated protein kinase (MAPK) pathway and
the phosphatidylinositol 3-kinase- (PI3K-) protein kinase B (AKT), were activated by the epi-
dermal growth factor receptor (EGFR). These pathways led to the activation of numerous
transcription factors, which then impact cellular responses including proliferation, migration,
differentiation, and apoptosis [191].
Fig 44- EGFR regulates AKT and MAPK signalling pathway [188]. Signalling through the
EGFR pathway is a complex process that may contribute to tumor progression through in-
creased, cell survival, invasion, cell proliferation metastasis and angiogenesis.

DISCUSSION
114
4.6.2 Effect of CXCL12 splice variants on the phosphorylation of MAPK in
colorectal cancer
Our findings reinforced the concept of a critical role for the CXCL12 splice variants axis in
colorectal cancer pathogenesis. One of the most important results of the current study was that
all six CXCL12 splice variants activated and expressed phospho-MEK 1/2 in colorectal can-
cer cells which varied from strong (Delta, Epsilon and Theta) and intermediate (Gamma) to
weak (Alpha and Beta).
Similarly, all six CXCL12 splice variants activated and expressed phospho-SAPK/JNK in
colorectal cancer cells, while no p38 MAP kinase activation was observed.
It was of interest to compare the results that we obtained of MAPK pathway in human colo-
rectal cancer cells with those obtained previously. Brand, S., 2005, reported in his study that
CXCL12 induced a transient activation of ERK-1/2 and SAPK/JNK, whereas no p38 MAP
kinase activation was observed in cell line HT-29. He reported that similar observation was
obtained in colorectal cell line SW480 cells [171]. Wang Y. K. et al., 2010, indicated that the
kinase activities of Akt and extracellular signal-regulated kinase (Erk) 1/2 were significantly
upregulated in primary colon cancer cells CD133 (+) [192].
Mitogen-activated protein kinases (MAPkinases) are serine/threonine-specific protein ki-
nases which belong to the CMGC (CDK/MAPK/GSK3/CLK) kinase group.
There are three major subfamilies of MAPK: [192,193]
The extracellular signal–regulated kinases (ERKs) are widely expressed and are involved
in the control of cell division, and inhibitors of these enzymes are being explored as anti-
cancer agents.
The c-Jun amino-terminal kinases ( JNKs) are regulated several important cellular func-
tions including cell growth, differentiation, survival and apoptosis and are responsive to
stress stimuli, such as cytokines, ultraviolet irradiation, heat shock, and osmotic shock. [193].

DISCUSSION
115
P38 mitogen-activated protein kinases are activated by a variety of cellular stresses stimuli
including hormones, ligands for G protein–coupled receptors and stresses such as osmotic
shock, ultraviolet light, irradiation, and heat shock. The p38 MAPKs are key regulators of
inflammatory cytokine expression, they appear to contribute to human diseases like asthma
and autoimmunity [193].
The MAPK is one of the most important signalling pathways regulate diverse cellular pro-
cesses such as proliferation, gene expression, differentiation, mitosis, movement, metabolism,
cell survival and apoptosis. MAPKs signalling are involved in directing cellular responses to a
numerous array of stimuli, including mitogens, osmotic stress, heat shock and pro-
inflammatory cytokines [193, 194]. It is de-regulated in various diseases, ranging from cancer
to immunological, inflammatory and degenerative syndromes [195].
Focusing on the ERK MAPK pathway (Fig 45), the Raf-MEK-ERK pathway was a key
downstream effector of the Ras small GTPase, the most frequently mutated oncogene in dif-
ferent human cancers. Ras was a key downstream effector of the epidermal growth factor re-
ceptor (EGFR), which was mutationally activated and/or overexpressed in a wide variety of
human cancers. ERK was a downstream signalling module that was activated by the Raf ser-
ine/threonine kinases. Raf activated the MAPK/ERK kinase (MEK)1/2 dual-specificity pro-
tein kinases, which then activated ERK1/2. The mutational activation of Raf in human cancers
supports the important role of this pathway in human oncogenesis [196].
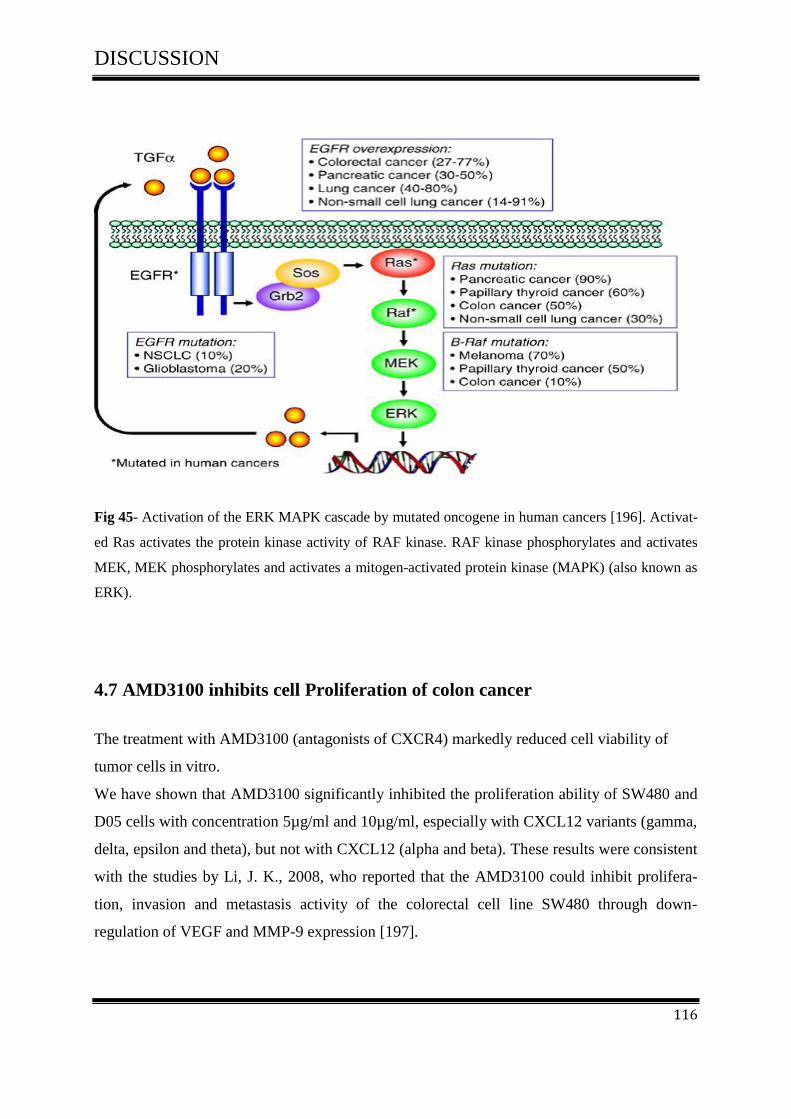
DISCUSSION
116
Fig 45- Activation of the ERK MAPK cascade by mutated oncogene in human cancers [196]. Activat-
ed Ras activates the protein kinase activity of RAF kinase. RAF kinase phosphorylates and activates
MEK, MEK phosphorylates and activates a mitogen-activated protein kinase (MAPK) (also known as
ERK).
4.7 AMD3100 inhibits cell Proliferation of colon cancer
The treatment with AMD3100 (antagonists of CXCR4) markedly reduced cell viability of
tumor cells in vitro.
We have shown that AMD3100 significantly inhibited the proliferation ability of SW480 and
D05 cells with concentration 5µg/ml and 10µg/ml, especially with CXCL12 variants (gamma,
delta, epsilon and theta), but not with CXCL12 (alpha and beta). These results were consistent
with the studies by Li, J. K., 2008, who reported that the AMD3100 could inhibit prolifera-
tion, invasion and metastasis activity of the colorectal cell line SW480 through down-
regulation of VEGF and MMP-9 expression [197].
DISCUSSION
117
4.7.1 AMD3100 exclusively inhibits CXCL12/CXCR4-mediated colorectal
cancer
The inhibition of CXCL12/CXCR4 and its pathway by AMD3100 may represent one of the
potential approaches in colon cancer therapy.
To evaluate whether AMD3100 (antagonists of CXCR4) activation on CRC cells led to new
therapeutic avenues for CRC patients, we have demonstrated the potent antagonistic activity
of AMD3100 against CXCL12 splice variants in colorectal cell line and melanoma cell line
after treatment with AMD3100 at different concentrations (0µg/ml-5µg/ml -10µg/ml).
AKT and MAPK pathways were representing an important drug target for many diseases;
here in the present study we gave an overview of the role of AMD3100 as a therapeutic poten-
tial for treatment of colon cancer by targeting AKT and MEK pathways. Our findings showed
that the inhibition of CXCL12 splice variants by AMD3100 suppressed the phosphorylation
of MEK1/2 and AKT from strong with CXCL12 (delta, epsilon and theta) to weak with
CXCL12 gamma, whereas it had no significant effect on CXCL12( alpha and beta). As we
have mentioned above, AMD3100 inhibited the Proliferative properties of CXCL12 splice
variants (gamma, delta, epsilon and theta), but not with CXCL12 (alpha and beta) in colon
cancer cells. These results were consistent with the previous studies that demonstrated the
inhibition of CXCR4 by AMD3100 and supressed the phosphorylation of MEK1/2 and AKT
[173].
Ganju et al. reported that in both, in vitro and in vivo mouse models, several
CXCR4/CXCL12 antagonists have been shown to have potential therapeutic effects to inhibit
tumor growth and metastasis of various cancers [198].
The bicyclam derivative plerixafor hydrochloride (AMD-3100) has been described as a highly
therapeutic potential for the treatment of HIV infection, inflammatory diseases, cancer and
stem cell mobilization [87,88,199].

SUMMARY
118
5. SUMMARY
5.1 Summary
The chemokine CXCL12, also known as stromal cell-derived factor-1 (SDF-1) is a small pro-
tein (8-14 KDa), which is expressed in six isoforms (SDF-1α, SDF-1β, SDF-1γ, SDF-1δ,
SDF-1ε and SDF-1θ) from a single gene. This gene regulates leukocyte trafficking and is var-
iably expressed in a number of normal and cancer tissues.
In addition to that, literature evidence suggests that CXCL12 plays multiple roles in tumor
pathogenesis: it promotes tumor growth and malignancy, enhances tumor angiogenesis, par-
ticipates in tumor metastasis, and contributes to immunosuppressive networks within the tu-
mor microenvironment.
To shed light on the role of the chemokine CXCL12 splice variants in the development of
cancer and to understand the potential physiological relevance and their possible functional
differences in colorectal cancer, we transfected and expressed all CXCL12 splice variants
(alpha, beta, gamma, delta, epsilon and theta) in colorectal cell line SW480 and melanoma
cell line D05.
The study outlined in this thesis was designed to address the following aims:
To investigate the roles of CXCL12 splice variants in mediating tumor progression,
adhesion, migration, invasion and metastasis of colorectal cancer.
To investigate whether the CXCL12 variants pathways represent an important target
for developing cancer therapies.
To develop an in vivo mouse model to investigate the role of the CXCL12 variants in
the increased of tumor growth in colorectal cancer.
Our findings demonstrate that:
The CXCL12 G801A polymorphism is a low-penetrance risk factor for the develop-
ment of colorectal cancer. CXCL12 gene polymorphism rs1801157 is correlated with
local progression of the primary tumor as indicated by the T status (tumor-node-
metastasis). Whereas there is no relation between CXCL12 Gene polymorphism
rs1801157 and distant or nodal metastisis.
SUMMARY
119
All six CXCL12 splice variants are expressed in colon cancer and healty colon muco-
sa. A high rate of expression was significantly associated with SDF-1alpha then SDF-
1 beta.
All six CXCL12 variants enhanced tumor cell proliferation in vitro. SDF-1beta then
SDF-1alpha showed the greatest activity in proliferation assay.
All six CXCL12 variants induced tumor cell adhesion in vitro, SDF-1beta then SDF-
1alpha showed the greatest activity in the adhesion assay.
All six CXCL12 variants enhanced cell migration and invasion in tumor cells in vitro.
SDF-1epsilon and SDF-1theta showed the greatest activity and the weakest activity
was observed with SDF-1alpha and SDF-1beta.
All six CXCL12 variants activated Akt and (MAPK) mitogen activated protein kinase
pathways, thus regulating many essential processes in tumor cells, cell survival, pro-
liferation, migration, invasion and adhesion.
It is interesting to note that, AMD3100 was shown to inhibit CXCL12 splice variants
which induced AKT & MEK-1/2 phosphorylation.
The inhibitor AMD3100 suppressed strongly CXCL12 variants, -delta, -epsilon and -
theta and suppressed weakly CXCL12-gamma, whereas it had no significant effect on
CXCL12- alpha and beta. It may affect several major signaling pathways related to
proliferation, migration and invasion.
It is important to note that the Inhibition of CXCL12 variants and its pathway by
AMD3100 may represent one of the potential approaches in cancer therapy.
We propose that in further studies we need to clearly understand the biological activi-
ties of these novels CXCL12 variants in different types of cancers.

SUMMARY
120
5.2 ZUSAMMENFASSUNG
Das Chemokin CXCL12 (auch bekannt als SDF-1) ist ein kleines Protein (8-14) KDa, das in
sechs Isoformen exprimiert wird (SDF-1α, SDF-1β, SDF-1γ, SDF- 1δ, SDF-1ε und SDF-1θ)
von einem einzigen Gen, dass die Leukozyten-Wanderung regelt und variabel in einer Reihe
von normalen und Krebsgeweben exprimiert wird.
CXCL12 spielt verschiedene Rollen in der Tumorpathogenese. Es wurde nachgewiesen, dass
CXCL12 das Tumorwachstum und die Malignität fördert, die Tumorangiogenese stärkt, sich
an der Metastasierung beteiligt und zu immunsuppressiven Netzwerken innerhalb des
Tumormikromilieus beiträgt. Daher liegt es nahe, dass der CXCL12/CXCR4-Signalweg ein
wichtiges Ziel ist für die Entwicklung von neuartigen Krebstherapien.
Um Licht auf die Rolle der Chemokin CXCL12 Splicevarianten in der Entwicklung von
Krebs zu werfen und die mögliche physiologische Relevanz und ihre möglichen funktionellen
Unterschiede bei Darmkrebs zu verstehen, haben wir alle CXCL12 Splicevarianten (alpha,
beta, gamma, delta, epsilon und theta) in die kolorektalen Zelllinie SW480 und die
Melanomzellinie D05 transfiziert und exprimiert.
Diese Arbeit wurde erstellt, um die folgenden Ziele zu erreichen.
Untersuchung der Rolle von CXCL12 Splicevarianten bei der Vermittlung von
Tumorprogression, Adhäsion, Migration, Invasion und Metastasierung von
Darmkrebs.
Untersuchung, ob die CXCL12 Variantenwege ein wichtiges Ziel für die Entwicklung
von Krebstherapien darstellen.
Um eine in vivo Mausmodell zu entwickeln, um die Rolle der CXCL12 Varianten im
Rahmen des Tumorwachstums zu verstehen.
Unsere Ergebnisse zeigen, dass:
Der CXCL12 G801A Polymorphismus ist ein Low-Penetranz Risikofaktor für die
Entwicklung von Darmkrebs. Der CXCL12-Gen-Polymorphismus rs1801157 ist mit
dem T-Status (Tumor-node-Metastasen) assoziiert. Es gab keine Beziehung zwischen
CXCL12-Gen-Polymorphismus rs1801157 und Fernmetastisen oder LN metastasen.

SUMMARY
121
• Alle sechs CXCL12 Splicevarianten werden im Darmkrebs und in gesunder Kolon mucosa
exprimiert. Die höchste Expression wird bei SDF-1alpha, dann SDF-1 beta gefunden.
• Alle sechs CXCL12 Varianten zeigen erhöhte Tumorzellproliferation in vitro. SDF-1beta,
gefolgt von SDF-1alpha zeigte die größte Aktivität im Proliferationsassay.
• Alle sechs CXCL12 Varianten induzieren die Tumorzelladhäsion.SDF-1beta dann SDF-
1alpha zeigte die größte Aktivität im Rahmen des Adhäsionsassay.
• Alle sechs CXCL12 Varianten erhöhten die Zellmigration und Invasion von Tumorzellen in
vitro. SDF-1theta und SDF-1epsilon 1theta zeigten die größte Aktivität, während die
schwächste Aktivität mit SDF-1alpha und SDF-1beta beobachtet wurde.
• Alle sechs CXCL12 Varianten aktivieren Akt und (MAPK) Mitogen- acktivatedierte Protein
kinase Wege und damit die Regulierung viele essentieller Prozesse in Tumorzellen, wie
Proliferation, Migration, Invasion und Adhäsion.
• Es ist interessant festzustellen, dass AMD3100 die CXCL12 Splicevarianten inhibriert, die
AKT-MEK-1/2-Phosphorylierung induzieren.
Der Inhibitor AMD3100 unterdrückt stark die CXCL12 Varianten -delta, -epsilon und theta-
und unterdrückt schwach CXCL12-gamma. während es keine signifikante Wirkung auf
CXCL12-alpha und beta hatte. Es hat möglicherweise Auswirkungen auf mehrere große
Signalwage in Bezug auf Proliferation, Migration und Invasions.
• Es ist wichtig anzumerken, dass die Hemmung von CXCL12-Varianten durch AMD3100
einen der möglichen Ansaätze in der Krebstherapie darstellen kann.
• Wir schlagen vor, dass weitere Studien erwogen werden, die wir brauchen, um die
biologische Aktivität dieser neuen CXCL12 Varianten bei verschiedenen Arten von Krebs
klar zu verstehen.

REFERENCES
122
6 REFERENCES
[1] Germ Cancer Research Center Heidelberg. The Most Frequent Causes of Death in Ger-
many in 2010: In: https://www.dkfz.de/en/krebsatlas/total/mort_2_e.html. Last updated
26.10.12 (date of access 5.11.12).
[2] Jemal A., et al., Global cancer statistics. CA Cancer J Clin 2011: 61:69-90.
[3] Robert Koch Institute and the Society of Epidemiologcal Cancer Registries in Germany:
cancer in Germany. 2007/2008.8 Issue. Berlin 2012.
[4] Germ Cancer Research Center Heidelberg. Trend graph for the five leading groups of
cause’s death in Germany.In: https://www.dkfz.de/en/krebsatlas/total/mort_6_e.html . Last
updated 26.10.12 (date of access 5.11.12).
[5] World Health Organization. The global burden of disease: 2004 update. Geneva: World
Health Organisation; 2008.
[6] American Cancer Society. What is cancer? In:
http://www.cancer.org/Cancer/CancerBasics/what-is-cancer.
[7] Germ Cancer Research Center Heidelberg. The 20 most frequent causes of cancer death
in Germany. In: https://www.dkfz.de/en/krebsatlas/total/organ_e.html. Last updated
25.09.12 (date of access 5.11.12).
[8] Cancer Research .UK. How many different types of cancer are there? In:
http://www.cancerresearchuk.org/cancer-help/about-cancer/cancer-questions/how-many-
different-types-of-cancer-are-there.
[9] National Cancer institute. Understanding Cancer Series Posted: 01/28/2005 Reviewed:
09/30/2009. In: http://www.cancer.gov/cancertopics/understandingcancer/cancer/page4
[10] National Cancer institute. Understanding Cancer Series Posted: 01/28/2005 Reviewed:
09/30/2009. In: http://www.cancer.gov/cancertopics/understandingcancer/cancer/page9
[11] National Cancer institute. Understanding Cancer Series Posted: 01/28/2005 Reviewed:
09/30/2009. In: http://www.cancer.gov/cancertopics/understandingcancer/cancer/page2
[12] Kuma V., Robbins SL., Robbins basic pathology. 8th ed. Philadelphia, PA: Saun-
ders/Elsevier; 2007.
[13]American Cancer Society. Cancerfacts and figures 2011. In:
http://www.cancer.org/.../cancerfactsfigures/cancerfact.

REFERENCES
123
[14] Birgisson H., Cancer of the Colon and Rectum, PHD thesis submitted to faculty of medi-
cine, Uppsala University, Swedisch, 2006.
[15] American Society of Colon & Rectal Surgeons, 2012 In:
http://www.fascrs.org/patients/conditions/colorectal_cancer/.
[16] Chan A.T., Giovannucci E.L., Primary prevention of colorectal cancer.Gastroenterology
2010, 138(6):2029-2043.
[17] Yeatman T., Colon cancer .secondary article .University of South Florida, Tampa, Flori-
da, USA, 2001.
[18] Fearon E.R., Vogelstein B. A., genetic model for colorectal tumorigenesis .Cell.1990,61
(5):759-67.
[19] Vogelstein B., et al., Genetic alterations during colorectal-tumor development.N Engl J
Med. 1988, 319 (9):525-32.
[20] Vogelstein B., Kinzler K.W., Cancer genes and the pathways they control. Nat Med.
2004 ,10(8):789-99.
[21] Andreyev H.J., et al., Kirsten ras mutations in patients with colorectal cancer: the multi-
center "RASCAL" study. J Natl Cancer Inst. 1998, 90(9):675-684.
[22] Kahlenberg M.S., et al., p53 tumor suppressor gene status and the degree of genomic
instability in sporadic colorectal cancers. J Natl Cancer Inst .1996, 88(22):1665-1670.
[23] Cho K.R., Fearon E.R., DCC: linking tumour suppressor genes and altered cell surface
interactions in cancer? Eur J Cancer .1995, 31A (7-8):1055-1060.
[24] Markowitz S.D., Bertagnolli M.M., Molecular origins of cancer: Molecular basis of colo-
rectal cancer. N. Engl. J. Med.2009, 361(25): 2449-2460.
[25] Haubrich W.S., Dukes of the Dukes classification. Gastroenterology .2000,118 (5):828.
[26] Sobin L.H., TNM: evolution and relation to other prognostic factors. Semin Surg Oncol
2003, 21(1):3-7.
[27] Sobin L.H., Gospodarowicz M.K., Wittekind Ch., TNM classification of malignant tu-
mours. ebrary, Inc. In. 7th ed. Chichester, West Sussex, UK ; Hoboken, NJ: Wiley-Blackwell;
2009.
[28] Baird PN., D’Andrea RJ., Goodall GJ., Cytokine receptor genes: structure chromosomal
location, and involvement in human disease. Leuk Lymph .1995,18(5-6): 373-83.
REFERENCES
124
[29] Cohen M.C., Cohen S., Cytokine function. A study in biologic diversity. Am J Clin
Pathol. 1996, 105(5): 589-98.
[30] Germano G., Allavena P., Mantovani A., Cytokines as a key component of cancer-related
inflammation. Cytokine. 2008, 43(3): 374-9.
[31] Bajetto A., et al., Chemokines and their receptors in the central nervous system. Front
Neuroendocrinol. 2001, 22(3): 147-84.
[32] Charo I.F., Ransohoff R.M., The many roles of chemokines and chemokine receptors in
inflammation. N Engl J Med. 2006, 354(6): 610-21.
[33] Viola A., Luster A.D., Chemokines and their receptors: drug targets in immunity and
inflammation. Annu Rev Pharmacol Toxicol. 2008, 48: 171-97.
[34] Fernandez E.J., Lolis E., Structure, function, and inhibition of chemokines. Annu Rev
Pharmacol Toxicol.2002, 42: 469-99.
[35] Vandercappellen J., Van Damme J., Struyf S., The role of CXC chemokines and their
receptors in cancer. 2008, 267(2):226-44.
[36] Raman D., et al., Role of chemokines in tumor growth.Cancer Lett.2007, 256(2):137-65.
[37] Zlotnik A., Yoshie O., Chemokines: a new classification system and their role in immun-
ity. Immunity .2000 , 12(2):121-7.
[38] Murphy PM., et al., International union of pharmacology. XXII. Nomenclature for
chemokine receptors. Pharmacol Rev. 2000, 52(1): 145-176.
[39] Arya M., The role of the CXCL12 – CXCR4 chemokine ligand – receptor interaction in
the metastasis of prostate cancer 2010.PHD thesis. Division of Surgery and Interventional
Science, University College London.
[40] Sun X., et al., CXCL12/CXCR4/CXCR7 Chemokine Axis and Cancer Progression. Can-
cer Metastasis Rev. 2010, 29(4): 709–722.
[41] Drury L.J., Wendt M.K., Dwinell M.B., CXCL12 chemokine expression and secretion
regulates colorectal carcinoma cell anoikis through Bim-mediated intrinsic apoptosis. PLoS
One. 2010, 22: 5(9):e12895.
[42] Ganju R.K., et al., The alpha-chemokine, stromal cell-derived factor-1alpha, binds to the
transmembrane G-protein-coupled CXCR-4 receptor and activates multiple signal transduc-
tion pathways. J. Biol. Chem. 1998, 273(36): 23169-23175.
[43] Zlotnik A., Chemokines and cancer.Int. J. Cancer .2006, 119(9): 2026-2029.

REFERENCES
125
[44] Moyer R.A., et al., Rho activation regulates CXCL12 chemokine stimulated actin rear-
rangement and restitution in model intestinal epithelia. Lab. Invest.2007, 87(8):807-817.
[45] Haribabu B., et al., Regulation of human chemokine receptors CXCR4. Role of phos-
phorylation in desensitization and internalization. J. Biol.Chem.1997, 272(45): 28726-28731.
[46] Neel N.F., et al., Chemokine receptor internalization and intracellular trafficking. Cyto-
kine Growth Factor. Rev. 2005,16(6):637-658.
[47] Nibbs R.J., et al., Cloning and characterization of a novel promiscuous human beta-
chemokine receptor D6. J. Biol.Chem.1997, 272(51): 32078-32083.
[48] Horuk R., et al., Identification and characterization of a promiscuous chemokine-binding
protein in a human erythroleukemic cell line. J. Biol. Chem.1994, 269(26): 17730-17733.
[49] Borroni E.M., Bonecchi R., Shaping the gradient by nonchemotactic chemokine recep-
tors. Cell. Adh Migr.2009, 3(2):146-147.
[50] Teicher B.A., Fricker S.P., CXCL12 (SDF-1)/CXCR4 Pathway in Cancer. Clin Cancer
Res. 2010 ,16(11):2927-31.
[51] Nagasawa T., et al., Molecular cloning and characterization of a murine pre-B-cell
growth-stimulating factor/stromal cell-derived factor 1 receptor, a murine homolog of the
human immunodeficiency virus 1 entry coreceptor fusin. Proc Natl Acad Sci U S.1996, A93
(25): 14726-14729.
[52] Balkwill F., Cancer and the chemokine network. Nat Rev Cancer. 2004,4(7): 540–50.
[53] Smith M.C., et al., CXCR4 regulates growth of both primary and metastatic breast can-
cer, Cancer Res.2004, 64(23):8604–8612.
[54] Phillips R.J., et al., The stromal derived factor-1/CXCL12-CXC chemokine receptor 4
biological axis in non-small cell lung cancer metastases, Am. J. Respir. Crit.Care Med.
2003,167(12):1676–1686.
[55] Scotton C.J., et al., Multiple actions of the chemokine CXCL12 on epithelial tumor cells
in human ovarian cancer, Cancer Res. 2002,62(20):5930–5938.
[56] Pan J., et al., Stromal derived factor-1 (SDF-1/CXCL12) and CXCR4 in renal cell carci-
noma metastasis, Mol. Cancer. 2006,5: 56.
[57] Taichman R.S.,et al., Use of the stromal cell-derived factor-1/CXCR4 pathway in pros-
tate cancer metastasis to bone, Cancer Res.2002, 62(6):1832–1837.

REFERENCES
126
[58] Geminder H., et al., A possible role for CXCR4 and its ligand, the CXC chemokine
stromal cellderived factor-1, in the development of bone marrow metastases in neuroblasto-
ma, J. Immunol. 2001,167(8):4747–4757.
[59] Vandercappellen J., Van Damme J., Struyf S.,The role of CXC chemokine and their re-
ceptors in cancer.2008.Cancer letters 2008, 267(2):226-244.
[60] Szlosarek P.W., et al., Aberrant regulation of argininosuccinate synthetase by TNF-alpha
in human epithelial ovarian cancer, Int. J. Cancer 2007,121(1): 6-11.
[61] Kulbe H., et al., The inflammatory cytokine tumor necrosis factor-alpha regulates chem-
okine receptor expression on ovarian cancer cells, Cancer Res. 2005,65(22):10355–10362.
[62] Kryczek I., et al., CXCL12 and vascular endothelial growth factor synergistically induce
neoangiogenesis in human ovarian cancers, Cancer Res.2005, 65(2):465–472.
[63] Ratajczak M. Z., et al., The pleiotropic effects of the SDF-1-CXCR4 axis in organogene-
sis, regeneration and tumorigenesis.Leukemia 2006, 20(11): 1915-1924.
[64] Barbieri F., et al., CXC receptor and chemokine expression in human meningioma:
SDF1/CXCR4 signaling activates ERK1/2 and stimulates meningioma cell proliferation, Ann.
N.Y. Acad. Sci. 2006, 1090 :332–343.
[65] Hattori K., et al., Plasma elevation of stromal cell derived factor-1 induces mobilization
of mature andimmature hematopoietic progenitor and stem cells, Blood 2001, 97(11):3354–
3360.
[66] Lane W.J., et al., Stromal-derived factor 1-induced megakaryocyte migration and plate-
let production is dependent on matrix metalloproteinases, Blood 2000, 96 (13):4152–4159.
[67] Petit I., Jin D., Rafii S., The SDF-1-CXCR4 signaling pathway: a molecular hub modu-
lating neo-angiogenesis,Trends Immunol. 2007, 28 (7):299–307.
[68] Ma Q ., et al., Impaired B-lymphopoiesis, myelopoiesis, and derailed cerebellar neuron
migration in CXCR4- and SDF-1-deficient mice, Proc. Natl. Acad. Sci. USA .1998, 95(16) :
9448–9453.
[69] Kryczek I., et al., Stroma-derived factor (SDF-1/CXCL12) and human tumor pathogene-
sis. Am J Physiol Cell Physiol 2007, 292(3): C987–C995.
[70] Janowski M., Functional diversity of SDF-1 splicing variants. Cell Adh Migr. 2009, 3(3):
243–249.
REFERENCES
127
[71] Altenburg JD., et al., A naturally occurring splice variant of CXCL12/stromal cell-
derived factor 1 is a potent human immunodeficiency virus type 1 inhibitor with weak chemo-
taxis and cell survival activities. J Virol. 2007, 81(15): 8140–8148.
[72] Altenburg JD., Structure function analysis of the CXCL12 chemokine. PHDThesis, Feb-
ruary, 2008. Submitted to the faculty of the University Graduate School.
[73] Yu L., et al., Identification and expression of novel isoforms of human stromal cell-
derived factor 1. Gene. 2006, 374:174–179.
[74] Shirozu M., et al., Structure and chromosomal localization of the human stromal cell-
derived factor 1 (SDF1) gene.Genomics. 1995, 28(3): 495-500.
[75] Gleichmann M., et al., Cloning and characterization of SDF-1gamma, a novel SDF-1
chemokine transcript with developmentally regulated expression in the nervous system. Eur J
Neurosci. 2000, 12(6):1857-66.
[76] Santhosh K.G., Cardiomyocyte specific deletion of stromal cell derived factor-1 (SDF-
1/CXCL12) protects the heart from hypertrophic and ischemic damage. PHD thesis. Decem-
ber 2010 .university of berlin.
[77] Bartlett J. M., Stirling D. A., Short History of the Polymerase Chain Reaction. Methods
Mol Biol. 2003, 226:3-6.
[78] Rychlik W., Spencer W., Rhoads R.E., Optimization of the annealing temperature for
DNA amplification in vitro". Nucl Acids Res .1990,18(21):6409-12.
[79] PCR Diagrams and Images .2011.http://missionpcr.blogspot.de/p/pcr-diagrams-and-
images.html
[80] Dimberg J., et al., Polymorphism and circulating levels of the chemokine CXCL12 in
colorectal cancer patients. Int J Mol Med. 2007,19(1): 11-5.
[81] Schmittgen T.D., et al., Quantitative reverse transcription-polymerase chain reaction to
study mRNA decay: comparison of endpoint and real-time methods. Anal. Biochem.2000,
285(2): 194–204.
[82] Joyce C., Quantitative RT-PCR. A review of current methodologies. Methods Mol. Biol.
2002,193: 83–92 .
[83] Groskreutz D., Schenborn E.T., Reporter systems. In: Methods in Molecular Biology . R.
Tuan, Humana Press, NJ. 1997,63: 11ed.
[84] Sarver N.P., et al., Bovine papilloma virus deoxyribonucleic acid: A novel eucaryotic
cloning vector. Mol. Cell. Biol. 1981,1(6): 486–96.

REFERENCES
128
[85] Towbin H., Staehelin T., Gordon J., Electrophoretic transfer of proteins from poly-
acrylamide gels to nitrocellulose sheets: procedure and some applications. Proceedings of the
National Academy of Sciences USA .1979,76 (9): 4350–54.
[86] Western blot antibody. exactantigen.com. http://www.exactantigen.com/review/western-
blot-antibody.html. Retrieved 2009-01-29.
[87] Davies S. L., et al., Plerixafor Hydrochloride. Drugs of the Future .2007, 32 (2): 123.
[88] Fricker Simon P., et al., Characterization of the molecular pharmacology of AMD3100:
A specific antagonist of the G-protein coupled chemokine receptor, CXCR4. Biochemical
Pharmacology. 2006, 72(5): 588–596.
[89] Bast RC Jr., et al., Cancer Medicine .5th edition.2000.
[90] Lodish H., et al., Molecular Cell Biology. 4th edition.2000.New York. From: Section
22.1, Cell-Cell Adhesion and Communication.
[91] Boyden S., The chemotactic effect of mixtures of antibody and antigen on polymorpho-
nuclear leucocytes. J Exp Med 1962, 1 (115):453-66.
[92] Kramer N., et al., In vitro cell migration and invasion assays. Mutat Res. Jan-Mar 2013,
752(1):10-24.
[93] Manetti M., et al., Association between a stromal cell derived factor1 (SDF-1/cxcl12)
gene polymorphism and microvascular disease in systemic sclerosis.Ann Rheum Dis 2009,
68(3): 408-411.
[94] Liu W., et al., CXCL12 G801A polymorphism is associated with an increased risk of
benign salivary gland tumors in the Chinese population .Med Oncol. 2012, 29(2): 677-681.
[95] Winkler C., et al., Genetic restriction of AIDS pathogenesis by an SDF-1 chemokine
gene variant. Science.1998, 279(5349): 389–393.
[96] Razmkhah M., et al., Stromal cell-derived factor-1 (SDF-1) gene and susceptibility of
Iranian patients with lung cancer. Lung Cancer.2005, 49(3): 311–5.
[97] Razmkhah M., et al., Stromal cell-derived factor-1 (SDF-1) alleles and susceptibility to
breast carcinoma. Cancer Lett. 2005, 225(2): 261–6.
[98] Dommange F., et al., CXCL12 polymorphism and malignant cell dissemination/tissue
infiltration in acute myeloid leukemia. Faseb J. 2006, 20(11): 1913–5.
[99] Hirata H., et al., CXCL12 G801A polymorphism is a risk factor for sporadic prostate
cancer susceptibility. Clin Cancer Res. 2007, 13(17): 5056–62.

REFERENCES
129
[100] de Oliveira KB., et al., CXCL12 rs1801157 polymorphism in patients with breast can-
cer, Hodgkin’s lymphoma, and non-Hodgkin’s lymphoma. J Clin Lab Anal. 2009, 23(6):
387–93.
[101] Teng Y.H., et al., Contribution of genetic polymorphisms of stromal cell-derived factor-
1 and its receptor, CXCR4, to the susceptibility and clinicopathologic development of oral
cancer. Head Neck. 2009, 31(31): 1282–8.
[102] Vairaktaris E., et al., A DNA polymorphism of stromal-derived factor-1 is associated
with advanced stages of oral cancer. Anticancer Res. 2008, 28(1A):271–5.
[103] van Rij RP., et al., The role of a stromal cell derived factor-1 chemokine gene variant in
the clinical course of HIV-1 infection. 1998, 12(9): F85-F90.
[104] Hidalgo-Pascual M., et al., Analysis of CXCL12 3'UTR G>A polymorphism in colorec-
tal cancer. Oncol Rep. 2007: 18 (6):1583-7.
[105] Chang S.C., et al., SDF-1alpha G801A polymorphism predicts lymph node metastasis
in stage T3 colorectal cancer .Ann Surg Oncol. 2009 Aug, 16(8):2323-30.
[106] Gong H., et al., The CXCL12 G801A polymorphism and cancer risk: evidence from 17
case-control studies. Gene. 2012 Nov 10, 509(2):228-31.
[107] Su B., et al., An HIV-resistant allele is exceptionally frequent in New Guinean high-
landers. Jama.1998, 280:1830.
[108] Shen W., et al., CXCL12 G801A polymorphism and breast cancer risk: a meta-analysis
Molecular Biology Reports. 2012 Feb, 39(2): 2039.
[109] Maley S.N., et al., Genetic varation in CXCL12 and risk of cervical carcinoma: a popu-
lation-based case –control study.In J Immunogenet.2009, 36(6): 367-375.
[110] Vazquez-Lavista., et al., Genetic association of monocyte chemoattractant protein 1
(MCP-1)-2518 polymorphism in Mexican patients with transitional cell carcinoma of the
bladder.Urology.2009,74:414-418.
[111] Grunewald M., et al., VEGF-induced adult neovascularization: recruitment, retention,
and role of accessory cells. Cell.2006, 124(1): 175–189.
[112] Katayama Y., et al., Signals from the sympathetic nervous system regulate hematopoi-
etic stem cell egress from bone marrow. Cell.2006, 124(2): 407–421.
[113] Petit I., et al., G-CSF induces stem cell mobilization by decreasing bone marrow SDF-1
and up-regulating CXCR4. Nat Immunol.2002, 3(7): 687–694.

REFERENCES
130
[114] Ponomaryov T., et al., Induction of the chemokine stromal-derived factor-1 following
DNA damage improves human stem cell function. J Clin Invest.2000, 106(11): 1331–1339.
[115] Zou YR., et al., Function of the chemokine receptor CXCR4 in haematopoiesis and in
cerebellar development. Nature.1998, 393(6685): 595–599.
[116] Machelon V., et al., CXCL12 expression by healthy and malignant ovarian epithelial
cells. BMC Cancer .2011, 11: 97.
[117] Kryczek I., et al., Accumulation of CD45RO(+) cells in peritoneal carcinomatous fluid
favours survival of ovarian carcinoma patients. Cancer Immunol Immunother .2002, 51(9):
513–519.
[118] Mirisola V., et al., CXCL12/SDF1 expression by breast cancers is an independent prog-
nostic marker of disease-free and overall survival. Eur J Cancer. 2009 Sep; 45(14):2579-87.
[119] Kang H., et al., Stromal cell derived factor-1: its influence on invasiveness and migra-
tion of breast cancer cells in vitro, and its association with prognosis and survival in human
breast cancer. Breast Cancer Res .2005, 7(4): R402–R410.
[120] Taichman R.S., et al., Use of the stromal cell-derived factor-1/CXCR4 pathway in pros-
tate cancer metastasis to bone. Cancer Res.2002, 62(6) :1832–1837.
[121] Sun Y., et al., Expression of CXCR4 and CXCL12 (SDF-1) in Human Prostate Cancers
(PCa) In Vivo. Journal of Cellular Biochemistry.2003, 89(3): 462–473.
[122] Koshiba T., et al., Expression of stromal cell-derived factor 1 and CXCR4 ligand recep-
tor system in pancreatic cancer: a possible role for tumor progression. Clin Cancer Res.2000,
6(9): 3530–3535.
[123] Marchesi F., et al., Increased survival, proliferation, and migration in metastatic human
pancreatic tumor cells expressing functional CXCR4. Cancer Res.2004, 64(22): 8420–8427.
[124] Hwang J.H., et al., CXC chemokine receptor 4 expression and function in human ana-
plastic thyroid cancer cells. J Clin Endocrinol Metab.2003, 88(1): 408–416.
[125] Rempel S.A., et al., Identification and localization of the cytokine SDF1 and its recep-
tor, CXC chemokine receptor 4, to regions of necrosis and angiogenesis in human glioblasto-
ma. Clin Cancer Res .2000, 6(1): 102–111.
[126] Schimanski C.C., et al., Effect of chemokine receptors CXCR4 and CCR7 on the meta-
static behavior of human colorectal cancer. Clin Cancer Res.2005, 11(5): 1743–1750.
[127] Akishima-Fukasawa Y., et al., Prognostic Significance of CXCL12 Expression in Pa-
tients with Colorectal Carcinoma. American Journal of Clinical Pathology. 2009 132(2): 202-
210.

REFERENCES
131
[128] Davis D.A., et al., Identification of carboxypeptidase N as an enzyme responsible for C-
terminal cleavage of stromal cell-derived factor-1alpha in the circulation. Blood .2005,
105(12): 4561-8.
[129] Weidt C., et al., Stem cell migration: a quintessential stepping stone to successful thera-
py. Curr Stem Cell Res Ther .2007, 2(1): 89-103.
[130] Boldajipour B., et al., Control of chemokine-guided cell migration by ligand sequestra-
tion. Cell .2008, 132(30: 463-73.
[131] Limatola C., et al., SDF-1alpha-mediated modulation of synaptic transmission in rat
cerebellum. Eur J Neurosci.2000, 12(7): 2497-504.
[132] Colobran R., et al., The chemokine network II. On how polymorphisms and alternative
splicing increase the number of molecular species and configure intricate patterns of disease
susceptibility. Clin Exp Immunol .2007, 150(1): 1-12.
[133] Gleichmann M., Gillen C., Czardybon M., Cloning and characterization of SDF-
1gamma, a novel SDF-1 chemokine transcript with developmentally regulated expression in
the nervous system. Eur J Neurosci. 2000 Jun, 12(6): 1857-66.
[134] Rueda P., et al., The CXCL12gamma chemokine displays unprecedented structural and
functional properties that make it a paradigm of chemoattractant proteins. PLoS ONE. 2008,
3(7): 2543.
[135] Fricker S.P., A novel CXCR4 antagonist for hematopoietic stem cell mobilization. Ex-
pert Opin Investig Drugs. 2008, 17(11): 1749–60.
[136] Murdoch C., Finn A., Chemokine receptors and their role in inflammation and infec-
tious diseases. Blood. 2000, 95(10): 3032–3043.
[137] Luster AD., Chemokines: chemotactic cytokines that mediate inflammation. N Engl J
Med. 1998, 338(7): 436–445.
[138] Ganju R.K., et al., The α-chemokine, stromal cell-derived factor-1α, binds to the trans-
membrane G-protein-coupled CXCR-4 receptor and activates multiple signal transduction
pathways. J Biol Chem. 1998, 273(36):23169–23175.
[139] Sehgal A., et al., CXCR-4,a chemokine receptor, is overexpressed in and required for
proliferationof glioblastoma tumor cells. J Surg Oncol.1998, 69(2): 99–104.
[140] Barbero S., et al., Stromal cell-derivedfactor 1α stimulates human glioblastoma cell
growth through the activationof both extracellular signal-regulated kinases 1/2 and Akt. Can-
cerRes.2003, 63(8): 1969–1974.
[141] Darash-Yahana M., et al., Role of high expression levels of CXCR4 in tumor growth,
vascularization, and metastasis. FASEB J 2004, 18(11): 1240–1242.

REFERENCES
132
[142] Katayama A., et al., Expression of CXCR4 and its down-regulation by IFN-gamma in
head and neck squamous cell carcinoma. Clin Cancer Res 2005, 11(8): 2937–2946.
[143] Marchesi F., et al., Increased survival, proliferation, and migration in metastatic human
pancreatic tumor cells expressing functional CXCR4. Cancer Res 2004, 64(22): 8420–8427.
[144] Sonoda Y., et al., Akt pathway activation converts anaplastic astrocytoma to glioblas-
toma multiforme in a human astrocyte model of glioma. Cancer Res 2001, 61(18):6674–6678.
[145] Vlahakis S.R., et al., G protein-coupled chemokine receptors induce both survival and
apoptotic signaling pathways. J Immunol 2002, 169(10): 5546–54.
[146] Suzuki Y., Rahman M., Mitsuya H., Diverse transcriptional response of CD4+ T cells to
stromal cell-derived factor (SDF)-1: cell survival promotion and priming effects of SDF-1 on
CD4+ t cells. J Immunol 2001, 167(60: 3064–73.
[147] Troppmair J., et al., Mitogen-activated protein kinase extracellular signal-regulated pro-
tein kinase activation by oncogenes, serum, and 12-O-tetradecanoylphorbol-13-acetate re-
quires Raf and is necessary for transformation. J Biol Chem1994, 269(9): 7030–35.
[148] Marchesi F., et al., Increased survival, proliferation, and migration in metastatic human
pancreatic tumor cells expressing functional CXCR4. Cancer Res 2004, 64(22): 8420–8427.
[149] Kijima T., et al., Regulation of cellular proliferation, cytoskeletal function, and signal
transduction through CXCR4 and c-Kit in small cell lung cancer cells. Cancer Res
2002,62(21): 6304–6311.
[150] Osaki M., Oshimura M., Ito H., PI3K-Akt pathway: Its functions and alterations in hu-
man cancer. Apoptosis 2004, 9(6): 667–676.
[151] Cross D., et al., Inhibition of glycogen synthase kinase-3 by insulin mediated by protein
kinase B. Nature 1995, 378(6559): 785-9.
[152] Inoki K., et al., TSC2 is phosphorylated and inhibited by Akt and suppresses mTOR
signalling. Nat Cell Biol 2002,4(9): 648–657.
[153] Tee AR., et al., Tuberous sclerosis complex-1 and -2 gene products function together to
inhibit mammalian target of rapamycin (mTOR)-mediated downstream signaling. ProcNatl
Acad Sci USA 2002, 99(21): 13571–13576.
[154] Potter CJ., Pedraza LG., Xu T., Akt regulates growth by directly phosphorylating Tsc2.
Nat Cell Biol 2002,4(9): 658–665.
[155] Calvert P.M., Frucht H., The genetics of colorectal cancer. Ann InternMed 2002,
137(7): 603–12.

REFERENCES
133
[156] Fang J., Richardson B., The MAPK signalling pathways and colorectal cancer. Lan-
cetOncol 2005, 695): 322-27.
[157] Hommes D.W., Peppelenbosch M.P., van Deventer SJ.H., Mitogen activated protein
(MAP) kinase signal transduction pathways and novel anti-inflammatory targets. Gut 2003,
52(1): 144–51.
[158] Troppmair J., et al., Mitogen-activated protein kinase extracellular signal-regulated pro-
tein kinase activation by oncogenes, serum, and 12-O-tetradecanoylphorbol-13-acetate re-
quires Raf and is necessary for transformation. J Biol Chem1994, 269(9): 7030–35.
[159] Wang X., et al., Regulation of phorbol estermediated TRAF1 induction in human colon
cancer cells through a PKC/RAF/ERK/ NF-kappaB-dependent pathway. Oncogene 2004;
23(10): 1885–95.
[160] Kim J., et al., Chemokine receptor CXCR4 expression in colorectal cancer patients in-
creases the risk for recurrence and for poor survival. J Clin Oncol 2005, 23(12): 2744-2753.
[161] Ingold B., et al., The role of vascular CXCR4 expression in colorectal carcinoma. His-
topathology 2009, 55(5): 576-586.
[162] Saigusa S., et al., Stromal CXCR4 and CXCL12 expression is associated with distant
recurrence and poor prognosis in rectal cancer after chemoradiotherapy. Ann Surg Oncol
2010, 17(8): 2051-2058.
[163] Muller A., et al., Involvement of chemokine receptors in breast cancer metastasis. Na-
ture 2001, 410(6824): 50–56.
[164] Zeelenberg I.S., et al., The chemokine receptor CXCR4 is required for outgrowth of
colon carcinoma micrometastases. Cancer Res 2003,63(13): 3833–3839.
[165] Phillips R.J.,et al., Epidermal growth factor and hypoxia-induced expression of CXC
chemokine receptor 4 on non-small cell lung cancer cells is regulated by the phosphatidylino-
sitol 3-kinase/PTEN/AKT/mammalian target of rapamycin signaling pathway and activation
of hypoxia inducible factor-1α. J Biol Chem 2005,280(23): 22473–22481.
[166] Sun Y.X., et al., Skeletal localization and neutralization of the SDF-1(CXCL12)
/CXCR4 axis blocks prostate cancer metastasis and growth in osseous sites in vivo. J Bone
Miner Res 2005, 20(20: 318–329.
[167] Jordan N.J., et al., Expression of functional CXCR4 chemokine receptors on human
colonic epithelial cells. J Clin Invest 1999, 104(8): 1061–1069.
[168] Geminder H., et al., A possible role for CXCR4 and its ligand, the CXC chemokine
stromal cell-derived factor-1, in the development of bone marrow metastases in neuroblasto-
ma. J Immunol 2001.167(80): 4747–4757.
REFERENCES
134
[169] Mori T., et al., CXCR4 antagonist inhibits stromal cell-derived factor 1-induced migra-
tion and invasion of human pancreatic cancer. Mol Cancer Ther 2004,3(1): 29-37.
[170] Chinni S.R., et al., CXCL12/CXCR4 signaling activates Akt-1 and MMP-9 expression
in prostate cancer cells: the role of bone microenvironment-associated CXCL12. Prostate
2006, 66(1): 32-48.
[171] Brand S., et al., CXCR4 and CXCL12 are inversely expressed in colorectal cancer cells
and modulate cancer cell migration, invasion and MMP-9 activation. Exp Cell Res 2005,
310(1): 117-130.
[172] Lambrechts A., Van Troys M., Ampe C., The actin cytoskeleton in normal and patho-
logical cell motility. Int J Biochem Cell Biol 2004; 36(100: 1890-1909.
[173] Leelawat K., et al., Roles of the MEK1/2 and AKT pathways in CXCL12/CXCR4 in-
duced cholangiocarcinoma cell invasion. World J Gastroenterol 2007, 13(10): 1561-1568.
[174] Bonacchi A., et al., Signal transduction by the chemokine receptor CXCR3: activation
of Ras/ERK, Src, and phosphatidylinositol 3-kinase/Akt controls cell migration and prolifera-
tion proliferation in human vascular pericytes, J. Biol. Chem. 2001, 276(13): 9945– 9954.
[175] Sotsios Y., et al., The CXC chemokine stromal cell-derived factor activates a Gi-
coupled phosphoinositide 3-kinase in T lymphocytes, J. Immunol. 1999, 163(11): 5954–
5963.
[176] McDonnell S., et al., Metastatic and non-metastatic colorectal cancer (CRC) cells in-
duce host metalloproteinase production in vivo, Clin. Exp. Metastasis 1999,17(4): 341– 349.
[177] Egeblad M., Werb Z., New functions for the metalloproteinases in cancer progression.
Nat Rev Cancer 2002, 2(3): 161–174.
[178] Hojilla C.V., Mohammed F.F., Khokha R., Matrix metalloproteinases and their tissue
inhibitors direct cell fate during cancer development. Br J Cancer 2003, 89(10): 1817–1821.
[179] Hartmann TN., et al., CXCR4 chemokine receptor and integrin signaling co-operate in
mediating adhesion and chemoresistance in small cell lung cancer (SCLC) cells. Oncogene
2005, 24(27): 4462–4471.
[180] Burger M., et al., Functional expression of CXCR4 (CD184) on small-cell lung cancer
cells mediates migration, integrin activation, and adhesion to stromal cells. Oncogene 2003,
22(50): 8093–8101.
[181] Klier CM., et al., Chemokine-induced secretion of gelatinase B in primary human mon-
ocytes. Biol Chem 2001, 382(9): 1405–1410.

REFERENCES
135
[182] Marchesi F., et al., Increased survival, proliferation, and migration in metastatic human
pancreatic tumor cells expressing functional CXCR4. Cancer Res 2004, 64(22): 8420–8427.
[183] Libura J., et al., CXCR4-SDF-1 signaling is active in rhabdomyosarcoma cells and reg-
ulates locomotion, chemotaxis, and adhesion. Blood 2002, 100(7): 2597–2606.
[184] Singh S., et al., CXCL12-CXCR4 interactions modulate prostate cancer cell migration,
metalloproteinase expression and invasion. Lab Invest 2004, 84(12): 1666–1676.
[185] Yu X., Collin-Osdoby P., Osdoby P., SDF-1 increases recruitment of osteoclast precur-
sors by upregulation of matrix metalloproteinase-9 activity. Connect Tissue Res 2003, 44
Suppl 1:79-84.
[186] Freeman-Cook KD., et al., Design of Selective, ATP-Competitive Inhibitors of Akt. J
Med Chem. 2010 , 53(12): 4615-22.
[187] Baba Y., et al., Phosphorylated AKT expression is associated with PIK3CA mutation,
low stage, and favorable outcome in 717 colorectal cancers. Cancer. 2011 , 117(7): 1399-408.
[188] Krasinskas AM., EGFR Signaling in Colorectal Carcinoma. Patholog Res Int. 2011 14;
2011: 932932.
[189] Joseph R. Testa., Tumor Genetics; AKT Function and Oncogenic Activity . Scientific
report. Fox Chase Cancer Center. 2005. http://www.fccc.edu/docs/sci_report2005/Testa.pdf.
[190] Huang X.F., Chen J.Z., Obesity, the PI3K/Akt signal pathway and colon cancer. Obes
Rev. 2009 , 10 (6): 610-6.
[191] Citri A., Yarden Y., EGF-ERBB signalling: towards the systems level. Nat Rev Mol
Cell Biol. 2006 , 7(7): 505-516.
[192] Wang YK., et al., Activation of Akt and MAPK pathways enhances the tumorigenicity
of CD133+ primary colon cancer cells.2010. Oxford Journals Life Sciences & Medicine Car-
cinogenesis. 2010, 31(8): 1376-1380.
[193] Johnson G.L., Lapadat R., Mitogen-Activated Protein Kinase Pathways Mediated by
ERK, JNK, and p38 Protein Kinases Science 2002, 298 (5600) : 1911-1912.
[194] Pearson G., et al., Mitogen-activated protein (MAP) kinase pathways: regulation and
physiological functions. Endocr Rev 2001 Apr, 22(2): 153-83.
[195] Orton R.J., et al., Computational modelling of the receptor-tyrosine-kinase-activated
MAPK pathway. Biochem J 2005 December 1, 392(2): 249–261.
[196] Roberts P.J., Der C.J., Targeting the Raf-MEK-ERK mitogen-activated protein kinase
cascade for the treatment of cancer. Oncogene 2007, 26(22): 3291–3310.

REFERENCES
136
[197] Li J.K., et al., Inhibition of CXCR4 activity with AMD3100 decreases invasion of hu-
man colorectal cancer cells in vitro. World J Gastroenterol. 2008 ,14(15): 2308-13.
[198] Ganju R.K., et al., Role of CXCL12 and CXCR4 in tumor biology and metasta-
sis.signaling pathways and molecular mediators in metastasis.2012: 221-243.
[199] De Clercq E., The bicyclam AMD3100 story. Nat Rev Drug Discov. 2003 Jul; 2(7):
581-7.
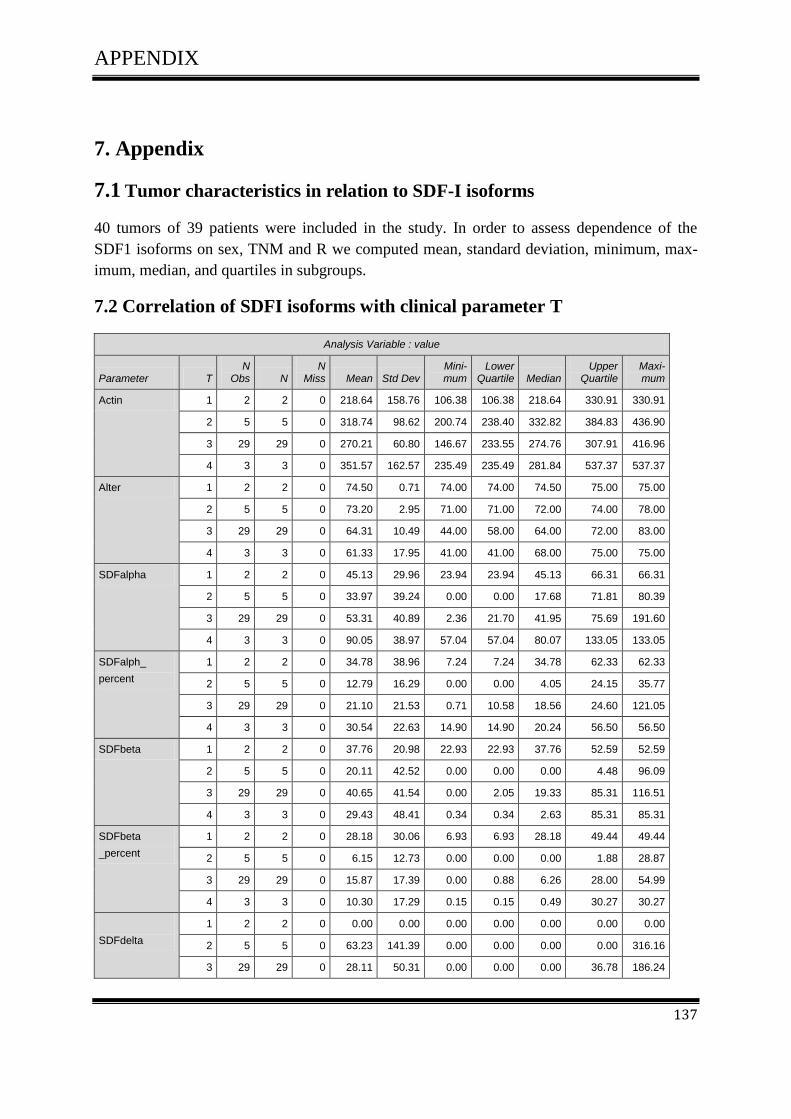
APPENDIX
137
7. Appendix
7.1 Tumor characteristics in relation to SDF-I isoforms
40 tumors of 39 patients were included in the study. In order to assess dependence of the
SDF1 isoforms on sex, TNM and R we computed mean, standard deviation, minimum, max-
imum, median, and quartiles in subgroups.
7.2 Correlation of SDFI isoforms with clinical parameter T
Analysis Variable : value
Parameter T N
Obs N N
Miss Mean Std Dev Mini-mum
Lower Quartile Median
Upper Quartile
Maxi-mum
Actin 1 2 2 0 218.64 158.76 106.38 106.38 218.64 330.91 330.91
2 5 5 0 318.74 98.62 200.74 238.40 332.82 384.83 436.90
3 29 29 0 270.21 60.80 146.67 233.55 274.76 307.91 416.96
4 3 3 0 351.57 162.57 235.49 235.49 281.84 537.37 537.37
Alter 1 2 2 0 74.50 0.71 74.00 74.00 74.50 75.00 75.00
2 5 5 0 73.20 2.95 71.00 71.00 72.00 74.00 78.00
3 29 29 0 64.31 10.49 44.00 58.00 64.00 72.00 83.00
4 3 3 0 61.33 17.95 41.00 41.00 68.00 75.00 75.00
SDFalpha 1 2 2 0 45.13 29.96 23.94 23.94 45.13 66.31 66.31
2 5 5 0 33.97 39.24 0.00 0.00 17.68 71.81 80.39
3 29 29 0 53.31 40.89 2.36 21.70 41.95 75.69 191.60
4 3 3 0 90.05 38.97 57.04 57.04 80.07 133.05 133.05
SDFalph_
percent
1 2 2 0 34.78 38.96 7.24 7.24 34.78 62.33 62.33
2 5 5 0 12.79 16.29 0.00 0.00 4.05 24.15 35.77
3 29 29 0 21.10 21.53 0.71 10.58 18.56 24.60 121.05
4 3 3 0 30.54 22.63 14.90 14.90 20.24 56.50 56.50
SDFbeta 1 2 2 0 37.76 20.98 22.93 22.93 37.76 52.59 52.59
2 5 5 0 20.11 42.52 0.00 0.00 0.00 4.48 96.09
3 29 29 0 40.65 41.54 0.00 2.05 19.33 85.31 116.51
4 3 3 0 29.43 48.41 0.34 0.34 2.63 85.31 85.31
SDFbeta
_percent
1 2 2 0 28.18 30.06 6.93 6.93 28.18 49.44 49.44
2 5 5 0 6.15 12.73 0.00 0.00 0.00 1.88 28.87
3 29 29 0 15.87 17.39 0.00 0.88 6.26 28.00 54.99
4 3 3 0 10.30 17.29 0.15 0.15 0.49 30.27 30.27
SDFdelta
1 2 2 0 0.00 0.00 0.00 0.00 0.00 0.00 0.00
2 5 5 0 63.23 141.39 0.00 0.00 0.00 0.00 316.16
3 29 29 0 28.11 50.31 0.00 0.00 0.00 36.78 186.24

APPENDIX
138
Analysis Variable : value
Parameter T N
Obs N N
Miss Mean Std Dev Mini-mum
Lower Quartile Median
Upper Quartile
Maxi-mum
4 3 3 0 40.55 40.89 0.50 0.50 38.92 82.23 82.23
SDFdel-ta_percent
1 2 2 0 0.00 0.00 0.00 0.00 0.00 0.00 0.00
2 5 5 0 19.00 42.48 0.00 0.00 0.00 0.00 95.00
3 29 29 0 10.98 18.97 0.00 0.00 0.00 13.90 60.10
4 3 3 0 12.21 15.11 0.21 0.21 7.24 29.17 29.17
SDFepsilon 1 2 2 0 39.39 55.70 0.00 0.00 39.39 78.77 78.77
2 5 5 0 10.84 18.93 0.00 0.00 0.00 10.51 43.72
3 29 29 0 50.11 54.59 0.00 3.05 27.77 106.68 175.41
4 3 3 0 38.90 58.27 0.00 0.00 10.81 105.89 105.89
SDFepsi-lon_percent
1 2 2 0 37.02 52.36 0.00 0.00 37.02 74.04 74.04
2 5 5 0 3.17 5.69 0.00 0.00 0.00 2.73 13.14
3 29 29 0 18.20 19.58 0.00 0.99 11.19 37.13 61.75
4 3 3 0 14.05 20.50 0.00 0.00 4.59 37.57 37.57
SDFgamma 1 2 2 0 115.76 0.32 115.54 115.54 115.76 115.99 115.99
2 5 5 0 1.41 3.16 0.00 0.00 0.00 0.00 7.07
3 29 29 0 38.96 52.97 0.00 0.00 0.17 104.42 122.05
4 3 3 0 0.00 0.00 0.00 0.00 0.00 0.00 0.00
SDFgam-ma_percent
1 2 2 0 71.83 52.01 35.05 35.05 71.83 108.60 108.60
2 5 5 0 0.43 0.95 0.00 0.00 0.00 0.00 2.13
3 29 29 0 17.74 26.12 0.00 0.00 0.05 34.57 73.88
4 3 3 0 0.00 0.00 0.00 0.00 0.00 0.00 0.00
SDFtheta 1 2 2 0 48.10 68.02 0.00 0.00 48.10 96.20 96.20
2 5 5 0 59.71 43.91 0.00 25.37 87.36 92.72 93.08
3 29 29 0 55.41 45.22 0.00 0.00 80.61 91.36 119.72
4 3 3 0 66.74 59.89 0.00 0.00 84.40 115.82 115.82
SDFthe-ta_percent
1 2 2 0 45.21 63.94 0.00 0.00 45.21 90.43 90.43
2 5 5 0 19.31 16.76 0.00 7.62 21.22 24.19 43.52
3 29 29 0 21.55 19.11 0.00 0.00 24.19 36.28 60.78
4 3 3 0 25.64 22.36 0.00 0.00 35.84 41.09 41.09

APPENDIX
139
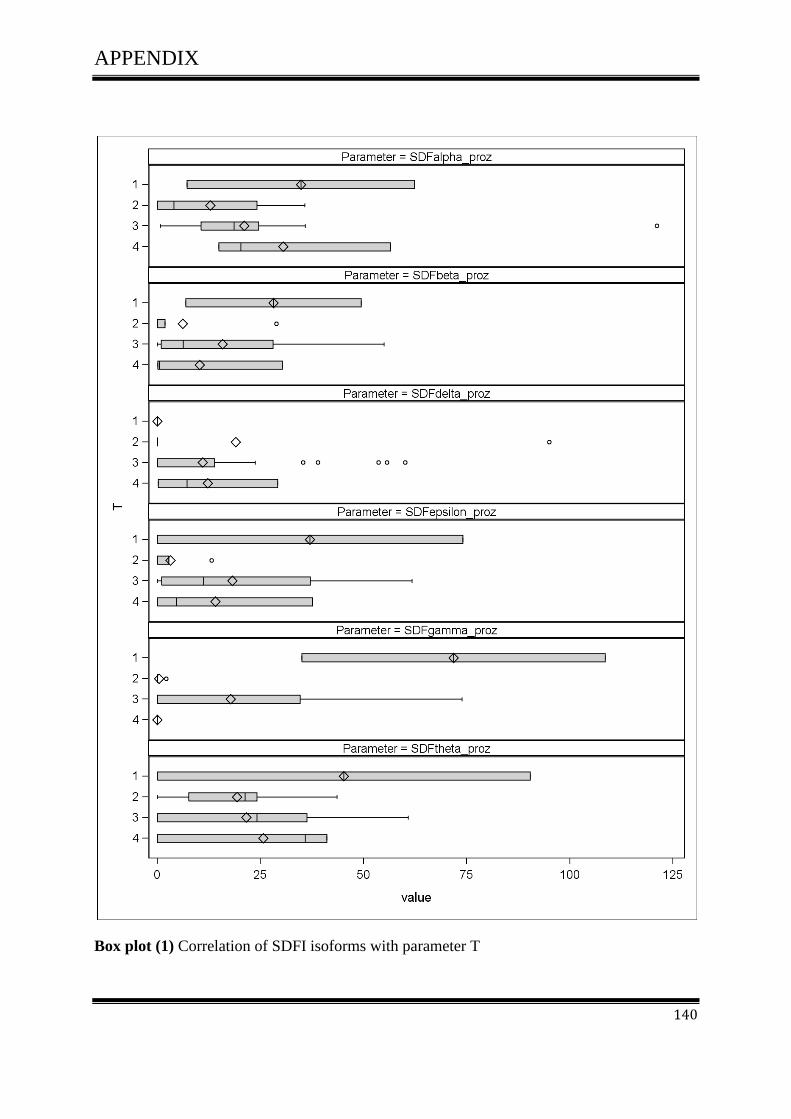
APPENDIX
140
Box plot (1) Correlation of SDFI isoforms with parameter T
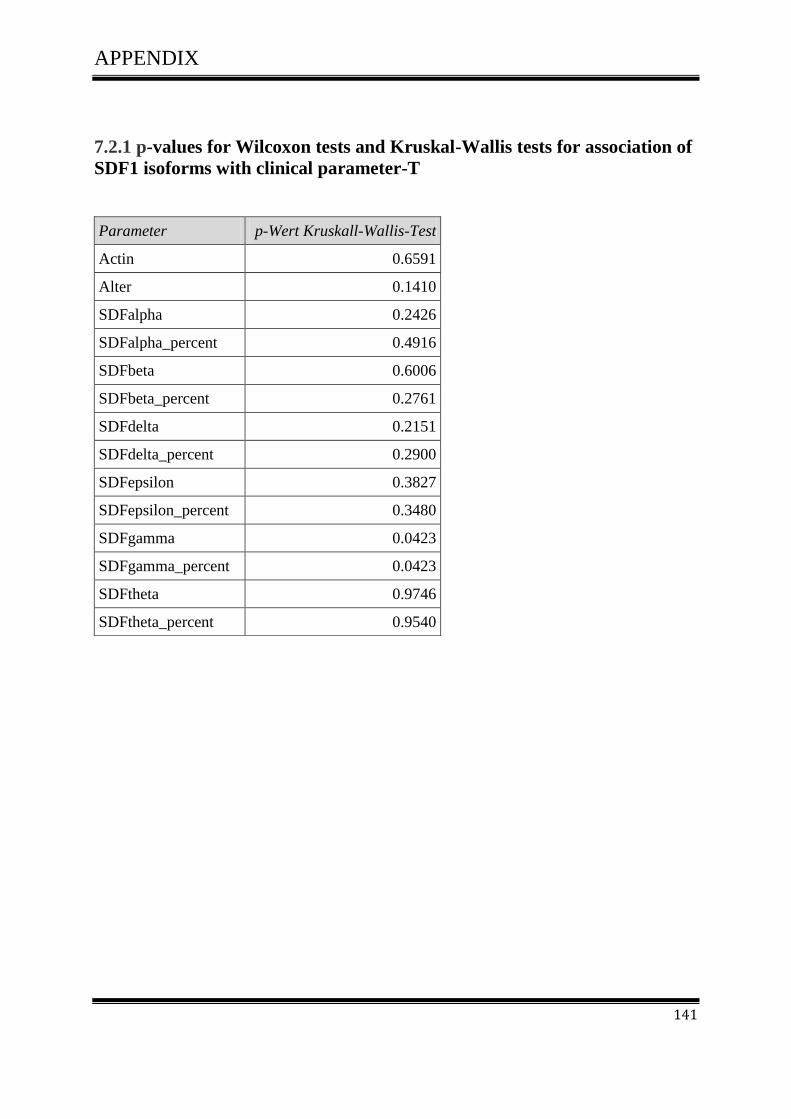
APPENDIX
141
7.2.1 p-values for Wilcoxon tests and Kruskal-Wallis tests for association of
SDF1 isoforms with clinical parameter-T
Parameter p-Wert Kruskall-Wallis-Test
Actin 0.6591
Alter 0.1410
SDFalpha 0.2426
SDFalpha_percent 0.4916
SDFbeta 0.6006
SDFbeta_percent 0.2761
SDFdelta 0.2151
SDFdelta_percent 0.2900
SDFepsilon 0.3827
SDFepsilon_percent 0.3480
SDFgamma 0.0423
SDFgamma_percent 0.0423
SDFtheta 0.9746
SDFtheta_percent 0.9540
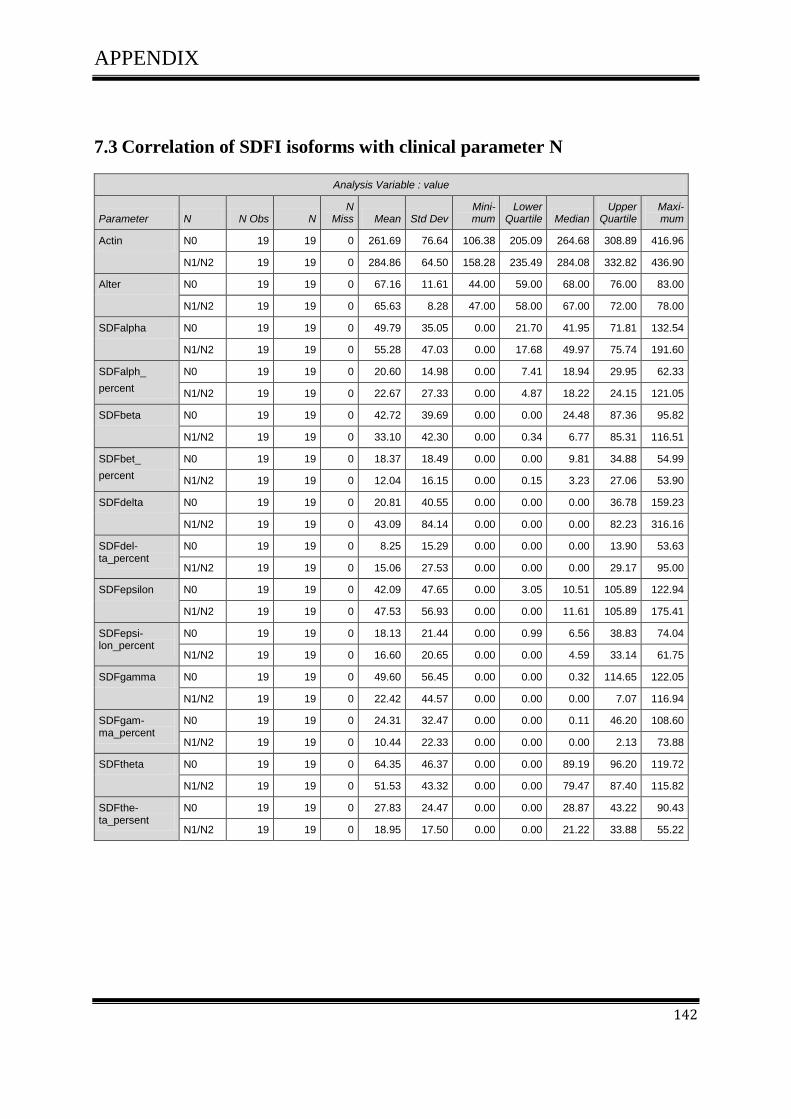
APPENDIX
142
7.3 Correlation of SDFI isoforms with clinical parameter N
Analysis Variable : value
Parameter N N Obs N N
Miss Mean Std Dev Mini-mum
Lower Quartile Median
Upper Quartile
Maxi-mum
Actin N0 19 19 0 261.69 76.64 106.38 205.09 264.68 308.89 416.96
N1/N2 19 19 0 284.86 64.50 158.28 235.49 284.08 332.82 436.90
Alter N0 19 19 0 67.16 11.61 44.00 59.00 68.00 76.00 83.00
N1/N2 19 19 0 65.63 8.28 47.00 58.00 67.00 72.00 78.00
SDFalpha N0 19 19 0 49.79 35.05 0.00 21.70 41.95 71.81 132.54
N1/N2 19 19 0 55.28 47.03 0.00 17.68 49.97 75.74 191.60
SDFalph_
percent
N0 19 19 0 20.60 14.98 0.00 7.41 18.94 29.95 62.33
N1/N2 19 19 0 22.67 27.33 0.00 4.87 18.22 24.15 121.05
SDFbeta N0 19 19 0 42.72 39.69 0.00 0.00 24.48 87.36 95.82
N1/N2 19 19 0 33.10 42.30 0.00 0.34 6.77 85.31 116.51
SDFbet_
percent
N0 19 19 0 18.37 18.49 0.00 0.00 9.81 34.88 54.99
N1/N2 19 19 0 12.04 16.15 0.00 0.15 3.23 27.06 53.90
SDFdelta N0 19 19 0 20.81 40.55 0.00 0.00 0.00 36.78 159.23
N1/N2 19 19 0 43.09 84.14 0.00 0.00 0.00 82.23 316.16
SDFdel-ta_percent
N0 19 19 0 8.25 15.29 0.00 0.00 0.00 13.90 53.63
N1/N2 19 19 0 15.06 27.53 0.00 0.00 0.00 29.17 95.00
SDFepsilon N0 19 19 0 42.09 47.65 0.00 3.05 10.51 105.89 122.94
N1/N2 19 19 0 47.53 56.93 0.00 0.00 11.61 105.89 175.41
SDFepsi-lon_percent
N0 19 19 0 18.13 21.44 0.00 0.99 6.56 38.83 74.04
N1/N2 19 19 0 16.60 20.65 0.00 0.00 4.59 33.14 61.75
SDFgamma N0 19 19 0 49.60 56.45 0.00 0.00 0.32 114.65 122.05
N1/N2 19 19 0 22.42 44.57 0.00 0.00 0.00 7.07 116.94
SDFgam-ma_percent
N0 19 19 0 24.31 32.47 0.00 0.00 0.11 46.20 108.60
N1/N2 19 19 0 10.44 22.33 0.00 0.00 0.00 2.13 73.88
SDFtheta N0 19 19 0 64.35 46.37 0.00 0.00 89.19 96.20 119.72
N1/N2 19 19 0 51.53 43.32 0.00 0.00 79.47 87.40 115.82
SDFthe-ta_persent
N0 19 19 0 27.83 24.47 0.00 0.00 28.87 43.22 90.43
N1/N2 19 19 0 18.95 17.50 0.00 0.00 21.22 33.88 55.22

APPENDIX
143
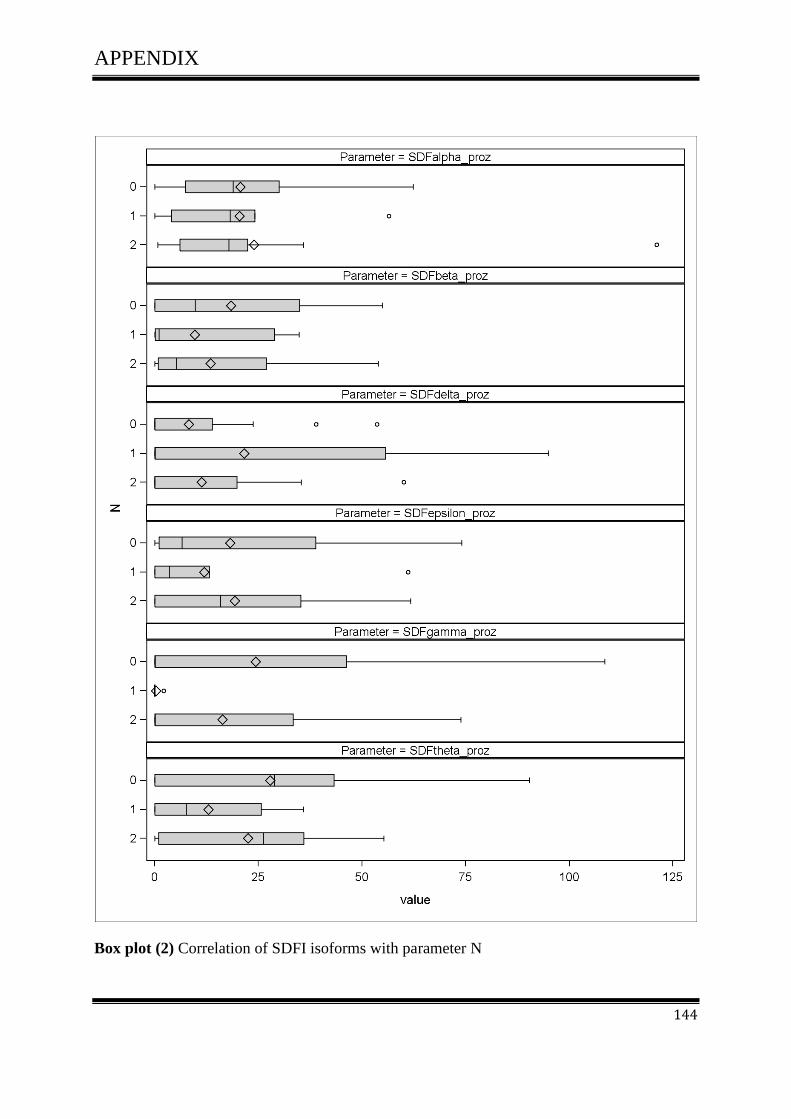
APPENDIX
144
Box plot (2) Correlation of SDFI isoforms with parameter N

APPENDIX
145
7.3.1 p-values for Wilcoxon tests and Kruskal-Wallis tests for association of
SDF1 isoforms with clinical parameter -N
Parameter p-Wert Wilcoxon-Test
Actin 0.2933
Alter 0.4301
SDFalpha 0.9186
SDFalpha_percent 0.5691
SDFbeta 0.6585
SDFbeta_ percent 0.4094
SDFdelta 0.6196
SDFdelta_ percent 0.6432
SDFepsilon 1.0000
SDFepsilon_ percent 0.6800
SDFgamma 0.2900
SDFgamma_ percent 0.2759
SDFtheta 0.1172
SDFtheta_ percent 0.2491

APPENDIX
146
7.4 Correlation of SDFI isoforms with clinical parameter M
Analysis Variable : value
Parameter M N
Obs N N
Miss Mean Std Dev Mini-mum
Lower Quartile Median
Upper Quartile Maximum
Actin 0 28 28 0 267.46 72.11 106.38 223.80 269.72 310.45 416.96
1 11 11 0 312.10 98.75 209.34 235.49 284.08 333.28 537.37
Alter 0 28 28 0 66.43 10.94 44.00 58.50 68.00 74.50 83.00
1 11 11 0 64.00 10.17 41.00 56.00 67.00 72.00 75.00
SDFalpha 0 28 28 0 55.97 41.67 0.00 30.22 48.90 76.15 191.60
1 11 11 0 46.30 39.16 2.36 14.15 39.55 75.69 133.05
SDFalpha
_percent
0 28 28 0 23.30 23.15 0.00 11.81 19.37 26.69 121.05
1 11 11 0 16.79 16.62 0.71 4.64 14.90 20.24 56.50
SDFbeta 0 28 28 0 44.10 41.18 0.00 2.83 24.32 86.34 116.51
1 11 11 0 18.94 34.48 0.00 0.00 2.63 18.71 90.19
SDFbeta_ percent
0 28 28 0 18.19 18.31 0.00 0.94 8.83 33.98 54.99
1 11 11 0 6.27 11.26 0.00 0.00 0.49 6.14 30.27
SDFdelta 0 28 28 0 40.40 74.05 0.00 0.00 0.00 41.16 316.16
1 11 11 0 11.06 26.33 0.00 0.00 0.00 0.50 82.23
SDFdelta_ percent
0 28 28 0 14.77 24.72 0.00 0.00 0.00 19.18 95.00
1 11 11 0 3.33 8.84 0.00 0.00 0.00 0.21 29.17
SDFepsilon 0 28 28 0 42.61 49.11 0.00 1.49 11.06 93.25 142.78
1 11 11 0 46.33 60.19 0.00 0.00 10.81 105.89 175.41
SDFepsilon_ percent
0 28 28 0 17.38 21.14 0.00 0.41 5.01 37.24 74.04
1 11 11 0 15.75 20.44 0.00 0.00 4.59 33.14 61.75
SDFgamma 0 28 28 0 42.22 54.87 0.00 0.00 0.09 114.25 122.05
1 11 11 0 16.93 38.81 0.00 0.00 0.00 0.67 115.40
SDFgamma_ percent
0 28 28 0 20.85 30.79 0.00 0.00 0.03 40.43 108.60
1 11 11 0 6.95 17.17 0.00 0.00 0.00 0.23 55.13
SDFtheta 0 28 28 0 59.09 44.76 0.00 0.00 86.44 92.80 119.72
1 11 11 0 49.75 47.46 0.00 0.00 79.47 88.15 115.82
SDFtheta_ percent
0 28 28 0 24.92 22.90 0.00 0.00 24.94 38.44 90.43
1 11 11 0 17.37 17.23 0.00 0.00 21.22 35.84 41.09
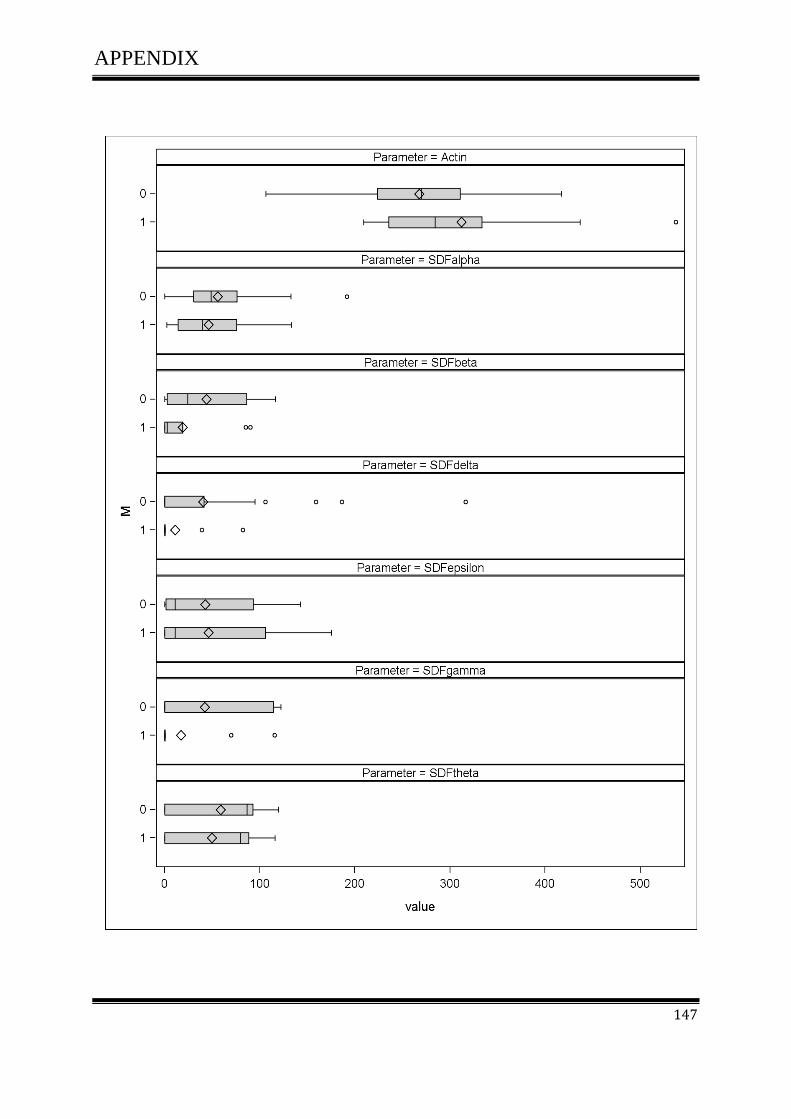
APPENDIX
147

APPENDIX
148
Box plot (3) Correlation of SDFI isoforms with parameter M

APPENDIX
149
7.4.1 p-values for Wilcoxon tests and Kruskal-Wallis tests for association of
SDF1 isoforms with clinical parameter -M
Parameter p-Wert Wilcoxon-Test
Actin 0.2958
Alter 0.4534
SDFalpha 0.4633
SDFalpha_ percent 0.2679
SDFbeta 0.0656
SDFbeta_ percent 0.0457
SDFdelta 0.2409
SDFdelta_ percent 0.1894
SDFepsilon 0.8746
SDFepsilon_ percent 0.7885
SDFgamma 0.2412
SDFgamma_ percent 0.2551
SDFtheta 0.3751
SDFtheta_ percent 0.4193

APPENDIX
150
7.5 Correlation of SDFI isoforms with clinical parameter R
Analysis Variable : value
Parameter R N
Obs N N
Miss Mean Std Dev Mini-mum
Lower Quartile Median
Upper Quartile
Maxi-mum
Actin 0 29 29 0 273.30 77.49 106.38 233.55 274.76 312.02 436.90
2 10 10 0 299.62 94.51 209.34 235.49 282.96 331.44 537.37
Alter 0 29 29 0 66.59 10.77 44.00 59.00 68.00 74.00 83.00
2 10 10 0 63.30 10.44 41.00 56.00 65.50 72.00 75.00
SDFalpha 0 29 29 0 54.65 41.53 0.00 23.94 48.68 75.74 191.60
2 10 10 0 49.16 40.05 2.36 14.15 47.81 75.69 133.05
SDFalpha_ percent
0 29 29 0 22.64 23.01 0.00 10.58 18.94 26.53 121.05
2 10 10 0 18.07 16.94 0.71 4.87 15.86 20.24 56.50
SDFbeta 0 29 29 0 42.58 41.26 0.00 2.05 24.16 85.31 116.51
2 10 10 0 20.83 35.74 0.00 0.00 3.50 18.71 90.19
SDFbeta_ percent
0 29 29 0 17.56 18.29 0.00 0.88 7.85 33.13 54.99
2 10 10 0 6.90 11.66 0.00 0.00 1.06 6.14 30.27
SDFdelta 0 29 29 0 39.01 73.10 0.00 0.00 0.00 41.16 316.16
2 10 10 0 12.16 27.48 0.00 0.00 0.00 0.50 82.23
SDFdelta_ percent
0 29 29 0 14.26 24.43 0.00 0.00 0.00 14.63 95.00
2 10 10 0 3.66 9.25 0.00 0.00 0.00 0.21 29.17
SDFepsilon 0 29 29 0 41.14 48.87 0.00 0.00 10.51 80.61 142.78
2 10 10 0 50.97 61.35 0.00 0.00 20.55 105.89 175.41
SDFepsilon_ percent
0 29 29 0 16.78 21.01 0.00 0.00 3.47 37.13 74.04
2 10 10 0 17.32 20.83 0.00 0.00 7.96 33.14 61.75
SDFgamma 0 29 29 0 40.77 54.45 0.00 0.00 0.00 113.86 122.05
2 10 10 0 18.62 40.48 0.00 0.00 0.00 0.67 115.40
SDFgamma_ percent
0 29 29 0 20.13 30.49 0.00 0.00 0.00 35.05 108.60
2 10 10 0 7.64 17.94 0.00 0.00 0.00 0.23 55.13
SDFtheta 0 29 29 0 60.25 44.40 0.00 0.00 87.36 92.72 119.72
2 10 10 0 45.46 47.72 0.00 0.00 42.80 84.40 115.82
SDFtheta_ percent
0 29 29 0 24.80 22.50 0.00 0.00 24.19 38.00 90.43
2 10 10 0 16.98 18.12 0.00 0.00 13.02 35.84 41.09

APPENDIX
151
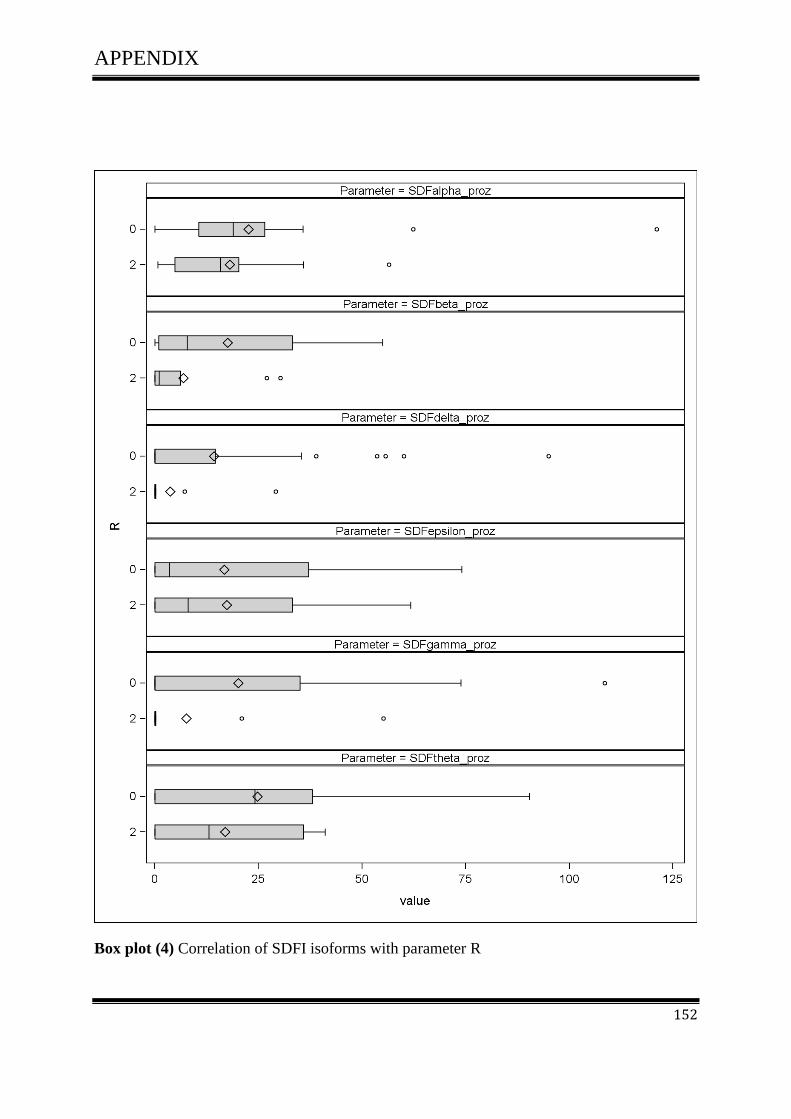
APPENDIX
152
Box plot (4) Correlation of SDFI isoforms with parameter R

APPENDIX
153
7.5.1 p-values for Wilcoxon tests and Kruskal-Wallis tests for association of
SDF1 isoforms with clinical parameter -R
Parameter p-Wert Wilcoxon-Test
Actin 0.6181
Alter 0.3674
SDFalpha 0.7115
SDFalpha_ percent 0.5097
SDFbeta 0.1535
SDFbeta_ percent 0.1120
SDFdelta 0.3576
SDFdelta_ percent 0.2873
SDFepsilon 0.7947
SDFepsilon_ percent 0.8836
SDFgamma 0.3720
SDFgamma_ percent 0.3911
SDFtheta 0.2030
SDFtheta_ percent 0.4431
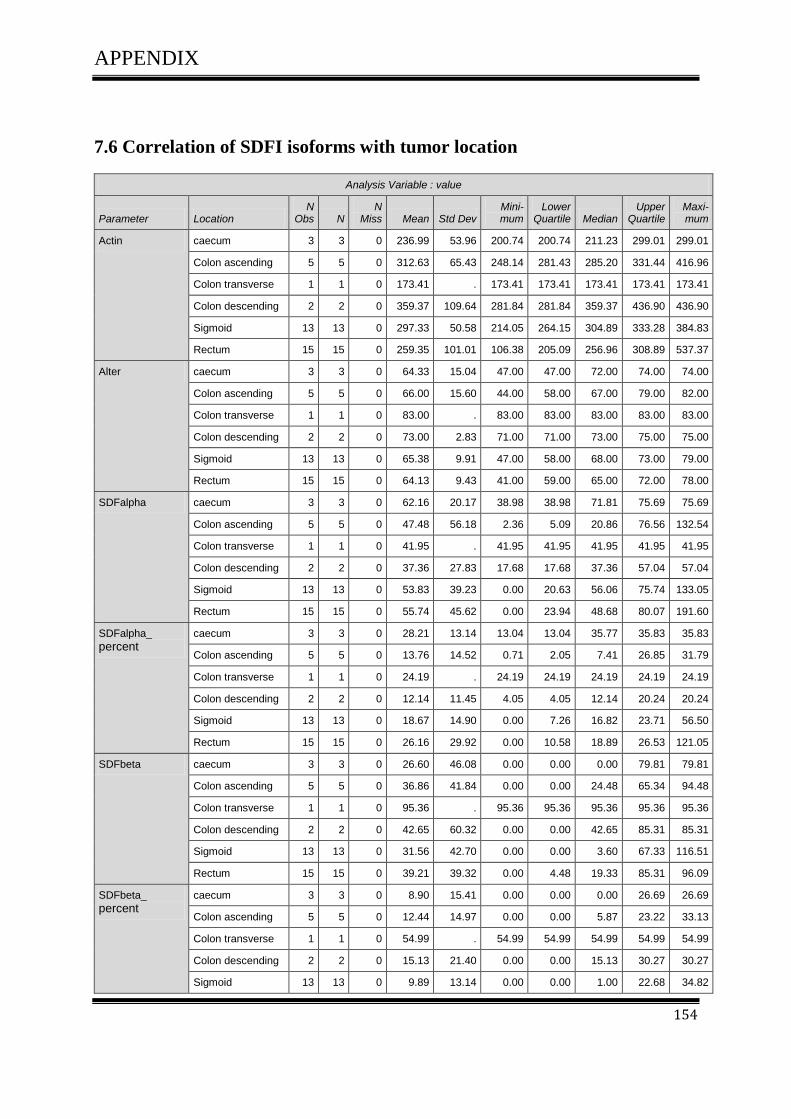
APPENDIX
154
7.6 Correlation of SDFI isoforms with tumor location
Analysis Variable : value
Parameter Location N
Obs N N
Miss Mean Std Dev Mini-mum
Lower Quartile Median
Upper Quartile
Maxi-mum
Actin caecum 3 3 0 236.99 53.96 200.74 200.74 211.23 299.01 299.01
Colon ascending 5 5 0 312.63 65.43 248.14 281.43 285.20 331.44 416.96
Colon transverse 1 1 0 173.41 . 173.41 173.41 173.41 173.41 173.41
Colon descending 2 2 0 359.37 109.64 281.84 281.84 359.37 436.90 436.90
Sigmoid 13 13 0 297.33 50.58 214.05 264.15 304.89 333.28 384.83
Rectum 15 15 0 259.35 101.01 106.38 205.09 256.96 308.89 537.37
Alter caecum 3 3 0 64.33 15.04 47.00 47.00 72.00 74.00 74.00
Colon ascending 5 5 0 66.00 15.60 44.00 58.00 67.00 79.00 82.00
Colon transverse 1 1 0 83.00 . 83.00 83.00 83.00 83.00 83.00
Colon descending 2 2 0 73.00 2.83 71.00 71.00 73.00 75.00 75.00
Sigmoid 13 13 0 65.38 9.91 47.00 58.00 68.00 73.00 79.00
Rectum 15 15 0 64.13 9.43 41.00 59.00 65.00 72.00 78.00
SDFalpha caecum 3 3 0 62.16 20.17 38.98 38.98 71.81 75.69 75.69
Colon ascending 5 5 0 47.48 56.18 2.36 5.09 20.86 76.56 132.54
Colon transverse 1 1 0 41.95 . 41.95 41.95 41.95 41.95 41.95
Colon descending 2 2 0 37.36 27.83 17.68 17.68 37.36 57.04 57.04
Sigmoid 13 13 0 53.83 39.23 0.00 20.63 56.06 75.74 133.05
Rectum 15 15 0 55.74 45.62 0.00 23.94 48.68 80.07 191.60
SDFalpha_ percent
caecum 3 3 0 28.21 13.14 13.04 13.04 35.77 35.83 35.83
Colon ascending 5 5 0 13.76 14.52 0.71 2.05 7.41 26.85 31.79
Colon transverse 1 1 0 24.19 . 24.19 24.19 24.19 24.19 24.19
Colon descending 2 2 0 12.14 11.45 4.05 4.05 12.14 20.24 20.24
Sigmoid 13 13 0 18.67 14.90 0.00 7.26 16.82 23.71 56.50
Rectum 15 15 0 26.16 29.92 0.00 10.58 18.89 26.53 121.05
SDFbeta caecum 3 3 0 26.60 46.08 0.00 0.00 0.00 79.81 79.81
Colon ascending 5 5 0 36.86 41.84 0.00 0.00 24.48 65.34 94.48
Colon transverse 1 1 0 95.36 . 95.36 95.36 95.36 95.36 95.36
Colon descending 2 2 0 42.65 60.32 0.00 0.00 42.65 85.31 85.31
Sigmoid 13 13 0 31.56 42.70 0.00 0.00 3.60 67.33 116.51
Rectum 15 15 0 39.21 39.32 0.00 4.48 19.33 85.31 96.09
SDFbeta_ percent
caecum 3 3 0 8.90 15.41 0.00 0.00 0.00 26.69 26.69
Colon ascending 5 5 0 12.44 14.97 0.00 0.00 5.87 23.22 33.13
Colon transverse 1 1 0 54.99 . 54.99 54.99 54.99 54.99 54.99
Colon descending 2 2 0 15.13 21.40 0.00 0.00 15.13 30.27 30.27
Sigmoid 13 13 0 9.89 13.14 0.00 0.00 1.00 22.68 34.82

APPENDIX
155
Analysis Variable : value
Parameter Location N
Obs N N
Miss Mean Std Dev Mini-mum
Lower Quartile Median
Upper Quartile
Maxi-mum
Rectum 15 15 0 18.37 19.43 0.00 1.88 6.93 35.15 53.90
SDFdelta caecum 3 3 0 35.26 61.08 0.00 0.00 0.00 105.79 105.79
Colon ascending 5 5 0 8.32 18.36 0.00 0.00 0.00 0.42 41.16
Colon transverse 1 1 0 41.16 . 41.16 41.16 41.16 41.16 41.16
Colon descending 2 2 0 41.11 58.14 0.00 0.00 41.11 82.23 82.23
Sigmoid 13 13 0 31.95 64.01 0.00 0.00 0.00 32.28 186.24
Rectum 15 15 0 37.79 83.17 0.00 0.00 0.00 38.92 316.16
SDFdelta_ percent
caecum 3 3 0 11.79 20.43 0.00 0.00 0.00 35.38 35.38
Colon ascending 5 5 0 2.95 6.53 0.00 0.00 0.00 0.10 14.63
Colon transverse 1 1 0 23.74 . 23.74 23.74 23.74 23.74 23.74
Colon descending 2 2 0 14.59 20.63 0.00 0.00 14.59 29.17 29.17
Sigmoid 13 13 0 10.14 20.18 0.00 0.00 0.00 10.48 55.67
Rectum 15 15 0 14.35 28.42 0.00 0.00 0.00 13.90 95.00
SDFepsilon caecum 3 3 0 37.24 64.50 0.00 0.00 0.00 111.71 111.71
Colon ascending 5 5 0 43.97 41.93 9.21 9.61 27.77 67.39 105.89
Colon transverse 1 1 0 28.72 . 28.72 28.72 28.72 28.72 28.72
Colon descending 2 2 0 52.94 74.87 0.00 0.00 52.94 105.89 105.89
Sigmoid 13 13 0 60.30 65.50 0.00 2.97 11.61 115.82 175.41
Rectum 15 15 0 30.18 39.79 0.00 0.00 9.41 59.40 108.07
SDFepsilon_ percent
caecum 3 3 0 12.45 21.57 0.00 0.00 0.00 37.36 37.36
Colon ascending 5 5 0 14.86 14.41 2.21 3.42 11.19 20.33 37.13
Colon transverse 1 1 0 16.56 . 16.56 16.56 16.56 16.56 16.56
Colon descending 2 2 0 18.79 26.57 0.00 0.00 18.79 37.57 37.57
Sigmoid 13 13 0 20.94 23.71 0.00 0.83 4.59 39.01 61.75
Rectum 15 15 0 14.79 21.85 0.00 0.00 4.50 28.96 74.04
SDFgamma caecum 3 3 0 0.00 0.00 0.00 0.00 0.00 0.00 0.00
Colon ascending 5 5 0 30.68 49.82 0.00 0.00 0.17 38.60 114.65
Colon transverse 1 1 0 113.86 . 113.86 113.86 113.86 113.86 113.86
Colon descending 2 2 0 0.00 0.00 0.00 0.00 0.00 0.00 0.00
Sigmoid 13 13 0 14.86 37.55 0.00 0.00 0.00 0.32 122.05
Rectum 15 15 0 60.53 57.98 0.00 0.00 94.97 115.65 122.05
SDFgamma_ percent
caecum 3 3 0 0.00 0.00 0.00 0.00 0.00 0.00 0.00
Colon ascending 5 5 0 8.22 12.26 0.00 0.00 0.05 13.53 27.50
Colon transverse 1 1 0 65.66 . 65.66 65.66 65.66 65.66 65.66
Colon descending 2 2 0 0.00 0.00 0.00 0.00 0.00 0.00 0.00
Sigmoid 13 13 0 5.20 13.61 0.00 0.00 0.00 0.11 46.20

APPENDIX
156
Analysis Variable : value
Parameter Location N
Obs N N
Miss Mean Std Dev Mini-mum
Lower Quartile Median
Upper Quartile
Maxi-mum
Rectum 15 15 0 32.39 35.55 0.00 0.00 34.57 59.51 108.60
SDFtheta caecum 3 3 0 57.25 49.61 0.00 0.00 84.40 87.36 87.36
Colon ascending 5 5 0 82.80 44.84 6.14 87.36 91.36 109.40 119.72
Colon transverse 1 1 0 105.40 . 105.40 105.40 105.40 105.40 105.40
Colon descending 2 2 0 104.27 16.34 92.72 92.72 104.27 115.82 115.82
Sigmoid 13 13 0 52.59 44.34 0.00 0.00 80.61 92.42 95.82
Rectum 15 15 0 41.22 43.40 0.00 0.00 25.37 87.40 104.42
SDFtheta_ percent
caecum 3 3 0 23.92 22.08 0.00 0.00 28.22 43.52 43.52
Colon ascending 5 5 0 28.30 17.72 1.85 21.91 30.63 38.87 48.25
Colon transverse 1 1 0 60.78 . 60.78 60.78 60.78 60.78 60.78
Colon descending 2 2 0 31.16 14.05 21.22 21.22 31.16 41.09 41.09
Sigmoid 13 13 0 18.21 16.23 0.00 0.00 24.19 28.91 43.22
Rectum 15 15 0 21.06 26.63 0.00 0.00 7.62 37.96 90.43

APPENDIX
157
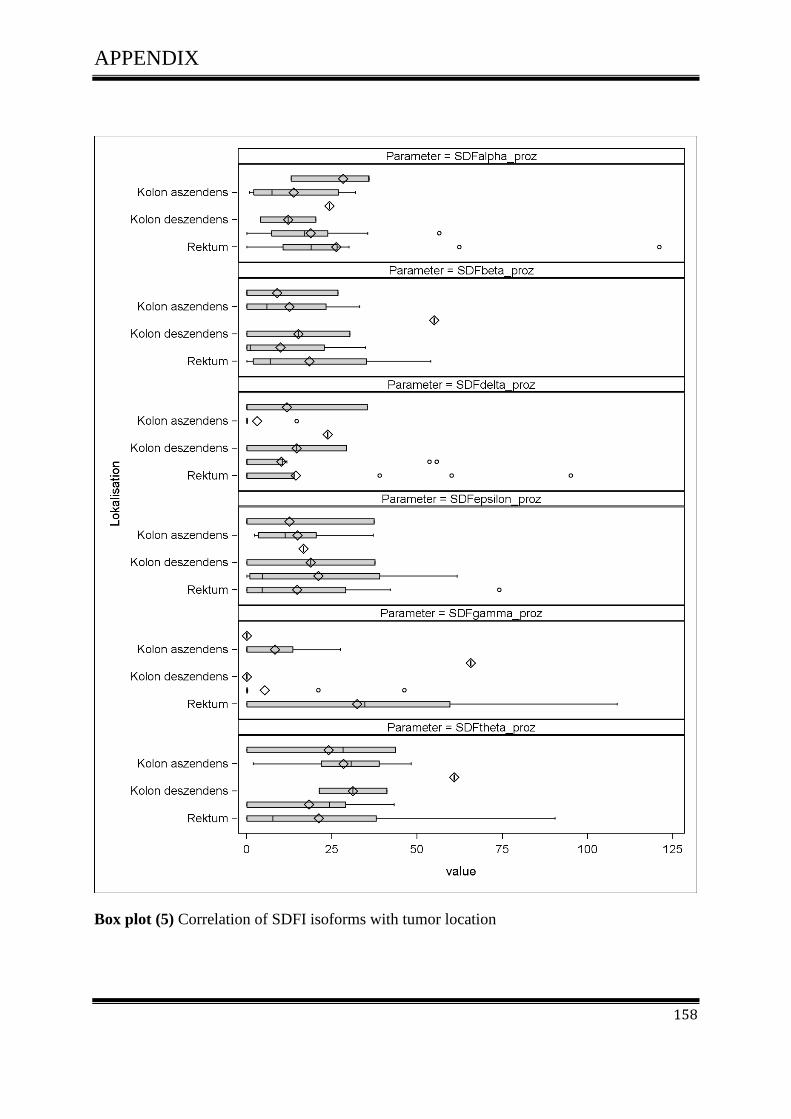
APPENDIX
158
Box plot (5) Correlation of SDFI isoforms with tumor location
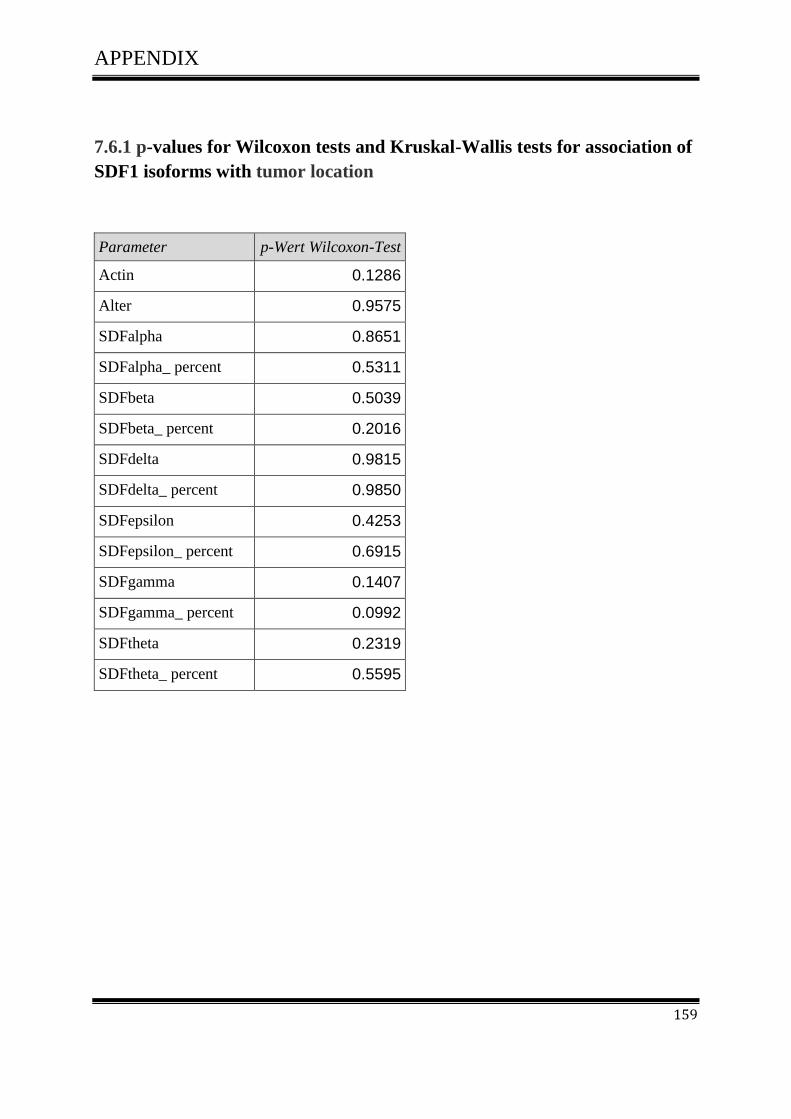
APPENDIX
159
7.6.1 p-values for Wilcoxon tests and Kruskal-Wallis tests for association of
SDF1 isoforms with tumor location
Parameter p-Wert Wilcoxon-Test
Actin 0.1286
Alter 0.9575
SDFalpha 0.8651
SDFalpha_ percent 0.5311
SDFbeta 0.5039
SDFbeta_ percent 0.2016
SDFdelta 0.9815
SDFdelta_ percent 0.9850
SDFepsilon 0.4253
SDFepsilon_ percent 0.6915
SDFgamma 0.1407
SDFgamma_ percent 0.0992
SDFtheta 0.2319
SDFtheta_ percent 0.5595

APPENDIX
160
7.7 Scatter plot
7.7.1 Correlation among SDF-1 isoforms
Actin and the SDF1 isoforms did exhibit correlation with age. Further, there was significant
association among the SDF1 isoforms. Also SDF tends to decrease when actin increases.
After standardisation, some correlations are substantially different from zero, in particular
SDF1 and SDF1.
Pearson Correlation Coefficients
Prob > |r| under H0: Rho=0 Number of Observations
Alter Actin alpha beta gamma delta epsilon theta
Alter Alter
1.00000
39
-0.13972 0.3962
39
-0.04777 0.7728
39
-0.02730 0.8690
39
0.19317 0.2387
39
0.07543 0.6481
39
-0.21384 0.1912
39
0.10631 0.5195
39
Actin Actin
-0.13972 0.3962
39
1.00000
40
-0.01916 0.9066
40
-0.08372 0.6075
40
-0.35767 0.0235
40
0.10351 0.5250
40
-0.05144 0.7526
40
-0.09977 0.5402
40
alpha alpha
-0.04777 0.7728
39
-0.01916 0.9066
40
1.00000
40
0.23404 0.1461
40
0.16911 0.2969
40
0.21220 0.1887
40
-0.04299 0.7922
40
0.11430 0.4825
40
beta beta
-0.02730 0.8690
39
-0.08372 0.6075
40
0.23404 0.1461
40
1.00000
40
0.16463 0.3100
40
0.60533 <.0001
40
0.28580 0.0738
40
0.03862 0.8130
40
gamma gamma
0.19317 0.2387
39
-0.35767 0.0235
40
0.16911 0.2969
40
0.16463 0.3100
40
1.00000
40
-0.15802 0.3301
40
-0.12948 0.4258
40
0.25850 0.1073
40
delta
delta 0.07543
0.6481 39
0.10351 0.5250
40
0.21220 0.1887
40
0.60533 <.0001
40
-0.15802 0.3301
40
1.00000
40
0.05196 0.7502
40
-0.25492 0.1124
40
epsilon epsilon
-0.21384 0.1912
39
-0.05144 0.7526
40
-0.04299 0.7922
40
0.28580 0.0738
40
-0.12948 0.4258
40
0.05196 0.7502
40
1.00000
40
-0.16050 0.3225
40
theta theta
0.10631 0.5195
39
-0.09977 0.5402
40
0.11430 0.4825
40
0.03862 0.8130
40
0.25850 0.1073
40
-0.25492 0.1124
40
-0.16050 0.3225
40
1.00000
40

APPENDIX
161
Scatter plot (1) Correlation among SDF-1 isoforms

APPENDIX
162
Scatter plot (2) Correlation between SDF-1 isoforms with actin and age
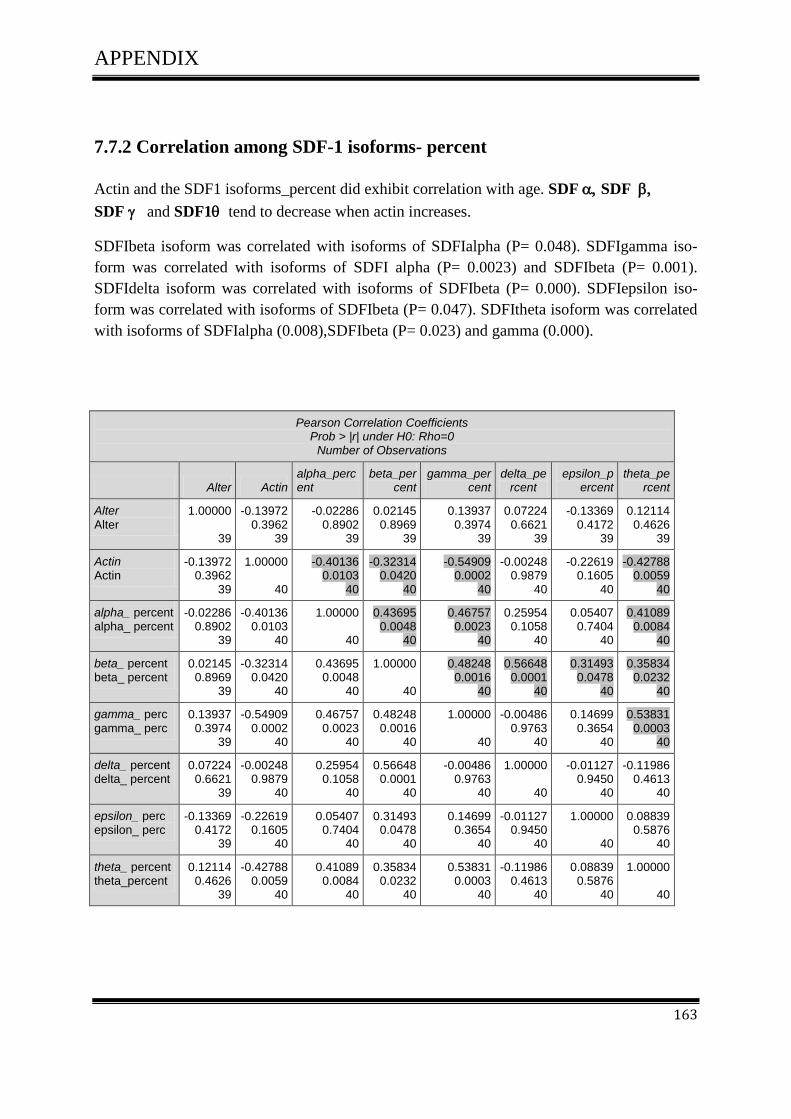
APPENDIX
163
7.7.2 Correlation among SDF-1 isoforms- percent
Actin and the SDF1 isoforms_percent did exhibit correlation with age. SDF SDF
SDF and SDF1 tend to decrease when actin increases.
SDFIbeta isoform was correlated with isoforms of SDFIalpha (P= 0.048). SDFIgamma iso-
form was correlated with isoforms of SDFI alpha (P= 0.0023) and SDFIbeta (P= 0.001).
SDFIdelta isoform was correlated with isoforms of SDFIbeta (P= 0.000). SDFIepsilon iso-
form was correlated with isoforms of SDFIbeta (P= 0.047). SDFItheta isoform was correlated
with isoforms of SDFIalpha (0.008),SDFIbeta (P= 0.023) and gamma (0.000).
Pearson Correlation Coefficients Prob > |r| under H0: Rho=0
Number of Observations
Alter Actin alpha_percent
beta_percent
gamma_percent
delta_percent
epsilon_percent
theta_percent
Alter
Alter 1.00000
39
-0.13972 0.3962
39
-0.02286 0.8902
39
0.02145 0.8969
39
0.13937 0.3974
39
0.07224 0.6621
39
-0.13369 0.4172
39
0.12114 0.4626
39
Actin Actin
-0.13972 0.3962
39
1.00000
40
-0.40136 0.0103
40
-0.32314 0.0420
40
-0.54909 0.0002
40
-0.00248 0.9879
40
-0.22619 0.1605
40
-0.42788 0.0059
40
alpha_ percent alpha_ percent
-0.02286 0.8902
39
-0.40136 0.0103
40
1.00000
40
0.43695 0.0048
40
0.46757 0.0023
40
0.25954 0.1058
40
0.05407 0.7404
40
0.41089 0.0084
40
beta_ percent beta_ percent
0.02145 0.8969
39
-0.32314 0.0420
40
0.43695 0.0048
40
1.00000
40
0.48248 0.0016
40
0.56648 0.0001
40
0.31493 0.0478
40
0.35834 0.0232
40
gamma_ perc
gamma_ perc 0.13937
0.3974 39
-0.54909 0.0002
40
0.46757 0.0023
40
0.48248 0.0016
40
1.00000
40
-0.00486 0.9763
40
0.14699 0.3654
40
0.53831 0.0003
40
delta_ percent delta_ percent
0.07224 0.6621
39
-0.00248 0.9879
40
0.25954 0.1058
40
0.56648 0.0001
40
-0.00486 0.9763
40
1.00000
40
-0.01127 0.9450
40
-0.11986 0.4613
40
epsilon_ perc epsilon_ perc
-0.13369 0.4172
39
-0.22619 0.1605
40
0.05407 0.7404
40
0.31493 0.0478
40
0.14699 0.3654
40
-0.01127 0.9450
40
1.00000
40
0.08839 0.5876
40
theta_ percent theta_percent
0.12114 0.4626
39
-0.42788 0.0059
40
0.41089 0.0084
40
0.35834 0.0232
40
0.53831 0.0003
40
-0.11986 0.4613
40
0.08839 0.5876
40
1.00000
40

APPENDIX
164
Scatter plot (3) Correlation among SDF-1 isoforms_percent

APPENDIX
165
Scatter plot (4) Correlation between SDF-1 isoforms_percent with actin and age
CURRICULUM VITAE
166
8. CURRICULUM VITAE
Personal Details
Name:
Date/Place of birth:
Nationality:
Marital status:
Risala Allami
March 17. 1975, Baghdad,Iraq
Iraqi
Married
Education
Schooling:
Studies:
1980-1989:
Basic primary school
1990-1993:
High school graduation
1994-1998:
B.sc Degree in Biology-Baghdad University-Iraq
1999-2001:
M.sc Degree in Genetic Engineering and Biotechnology
Faculty of Science - Baghdad university- Iraq
Work Experience
Since Jan -2010
Postgraduate studies (PhD) Project.
Performance of RT-PCR, RFLP analyses, immunohistochemical
staining, Western blot analysis, nucleic acid and protein isolation,
flow cytometry, cloning, transfection with si-RNA and plasmids,
cell culture techniques ,animal testing.

CURRICULUM VITAE
167
Field of responsibility:
Sep2001- Dec 2006
A member of staff in Department of Biology / Faculty of Arts and
Science –Libya.
Aug1999- Aug 2001
Postgraduate studies (M.SC) project.
Aug1998- Juli1999
Lab-technician in Department of Biology / Faculty of science
Baghdad university
Interships
1.11.09-20.12.2009
at the Johannes Gutenberg university, interdisciplinary translational
oncological laboratory of PD.Dr.Schimanski and Prof.Dr.Gockel
1.02.2008-28.02.2008
at the Johannes Gutenberg university, institute of molecular genet-
ics and biosafety research, laboratory of Prof.Dr.E.Schmidt
Personal skills
Languages
Computer
Arabic (mother tongue)
English
German
MS Word, MS Power Point, Adobe Photoshop, PubMed

![chemokine/chemokine receptor pair ccL20/ccR6 in human ... · pancreas, stomach, prostate, testis, uterine cervix and skin[11]. The chemokine receptor CCR6 was originally described](https://img.pdfslide.net/doc/110x75/5f9ac7b0798b75658905651c/chemokinechemokine-receptor-pair-ccl20ccr6-in-human-pancreas-stomach-prostate.jpg)