Embed Size (px)
Citation preview
Influence of the loading path on the strength of fiber-reinforced composites subjected to transverse compression and shear
Essam Totry , Carlos Gonzalez , Javier LLorca
Departamento de Ciencia de Materiales, Universidad Politecnica de Madrid, 28040 Madrid, Spain Instituto Madrileno de Estudios Avanzados en Materiales (IMDEA-Materiales), E. T. S. de Ingenieros de Caminos, 28040 Madrid, Spain
Abstract
The influence of the loading path on the failure locus of a composite lamina subjected to transverse compression and out-of-plane shear is analyzed through computational micromechanics. This is carried out using the finite element simulation of a representative volume element of the micro structure, which takes into account explicitly fiber and matrix spatial distribution within the lamina. In addition, the actual failure mechanisms (plastic deformation of the matrix and interface decohesion) are included in the simulations through the corresponding constitutive models. Two different interface strength values were chosen to explore the limiting cases of composites with strong or weak interfaces. It was found that failure locus was independent of the loading path for the three cases analyzed (pseudo-radial, compression followed by shear and shear followed by compression) in the composites with strong and weak interfaces. This result was attributed to the fact that the dominant failure mechanism in each material was the same in transverse compression and in shear. Failure is also controlled by the same mechanisms under a combination of both stresses and the failure locus depended mainly on the magnitude of the stresses that trigger fracture rather than in the loading path to reach the critical condition.
Keywords: A: fracture mechanisms; A: microstructures; B: fiber-reinforced composite material; B: constitutive behavior; C: finite elements
1. Introduction
Predicting the failure of materials is one of the oldest problems in engineering and one of the least perfectly solved. This issue is particularly critical in fiber-reinforced composites (FRC), which tend to fail catastroph-ically and by different mechanisms that depend on stress state and loading conditions (static, fatigue, impact). As a result, the burden is immense in testing the safety of composite structures upon whose integrity human lives depend and there is considerable interest from industry in developing accurate and reliable strategies to predict the critical conditions for failure in structural components made up of F R C (Cox and Yang, 2006).
The standard approach to design against failure in composite materials was borrowed from the yield surfaces which determine the onset of plastic deformation in metals and it is based on the formulation of failure criteria. They define a closed surface in the stress space and failure occurs when the stress state at a given location is on or outside the surface. Obviously, the coexistence of various physical mechanisms of failure in FRC implied the use of different failure criteria as a function of the dominant stress state, and the failure surface is formed by the intersection of various smooth surfaces, each one representing the critical condition for a given fracture mode. Since the pioneer work of Hashin (1980), many different failure criteria have been developed based on physically-based phenomenological considerations (Soden et al., 1998; Puck and Schurmann, 2002; Davila et al., 2005).
Failure criteria predict fracture under complex stress states regardless of the loading path to achieve the critical condition. This assumption is strictly valid if the materials remain elastic prior fracture but this is not usually the case in composites, in which damage in the form of interface decohesion, matrix cracking and plastic deformation as well as interply delamination often take place before fracture. Thus, it is important to find out whether the loading path significantly changes the failure locus in order to test safety, but this is not an easy task in composite materials. For instance, standard methods to determine the properties of structural composites under combined shear and tension/compression (Arcan and Iopescu specimens or tensile and compressive tests of off-axis lamina) are always restricted to proportional loading paths. Different loading paths in tension/compression and shear can be obtained through mechanical testing of thin-walled tubes in an axial/ torsion machine (Swanson and Toombes, 1989; Jelf and Fleck, 1994) but composite tubes are difficult to process without defects, and the accuracy of results is often limited by buckling, splitting and failure at the grips. More accurate results were provided by Kyriakides and co-workers (Vogler and Kyriakides, 1999; Vogler et al., 2000) using a custom biaxial testing machine, who showed that the loading path did not significantly modify the failure envelope in composite lamina subjected to longitudinal or transverse compression and in-plane shear.
The main aim of this investigation was to determine whether the limited evidence of the loading path's negligible influence on the failure locus of composite lamina could be extended to other loading conditions, which cannot be easily reproduced experimentally and to composite materials with very different properties. This was achieved by determining the mechanical behavior of composite lamina until fracture by means of the numerical simulation of a representative volume element (RVE) of the composite microstructure, which explicitly takes into account the fibers, matrix and interfaces. The actual fracture mechanisms experimentally observed in the matrix, fibers and interfaces are included in the simulations through the appropriate constitutive equations. Recent examples of the simulation strategy include the analysis of the tensile deformation of particle-reinforced meta-matrix composites (Segurado and LLorca, 2006; LLorca and Segurado, 2004), the fracture toughness perpendicular to the fibers of Ti/SiC composite panels at ambient and elevated temperature (Gonzalez and LLorca, 2006, 2007c) or the failure of fiber-reinforced polymer lamina under transverse compression (Gonzalez and LLorca, 2007a). In addition, complex multiaxial stress states and loading paths (which cannot be obtained experimentally) are available using the appropriate boundary conditions. Thus this approach provides full control of the constituent properties and spatial distribution as well as loading, eliminating many sources of experimental error.
Using this strategy, the failure locus of a composite lamina, made up of 50 vol % of carbon fibers embedded in an epoxy matrix, was determined under transverse compression and out-of-plane shear, a biaxial stress state whose experimental reproduction is highly complex. Results were presented for composite lamina with different failure mechanisms owing to large differences in the interfacial strength, and the effect of the loading path on the failure surface was assessed for each material.
2. Numerical simulation strategy
The mechanical behavior until fracture of a uniaxially reinforced composite lamina subjected to transverse compression (<r2) and out-of-plane shear stresses perpendicular to the fibers (x23) can be obtained through the numerical analysis of a RVE of the lamina (Fig. 1). This technique was pioneered by Brockenbrough et al. (1991), who showed that the fiber shape and spatial distribution (either regular or random) modify the composite response to a large extent. Subsequent investigations focused on the minimum size of the RVE to repro-
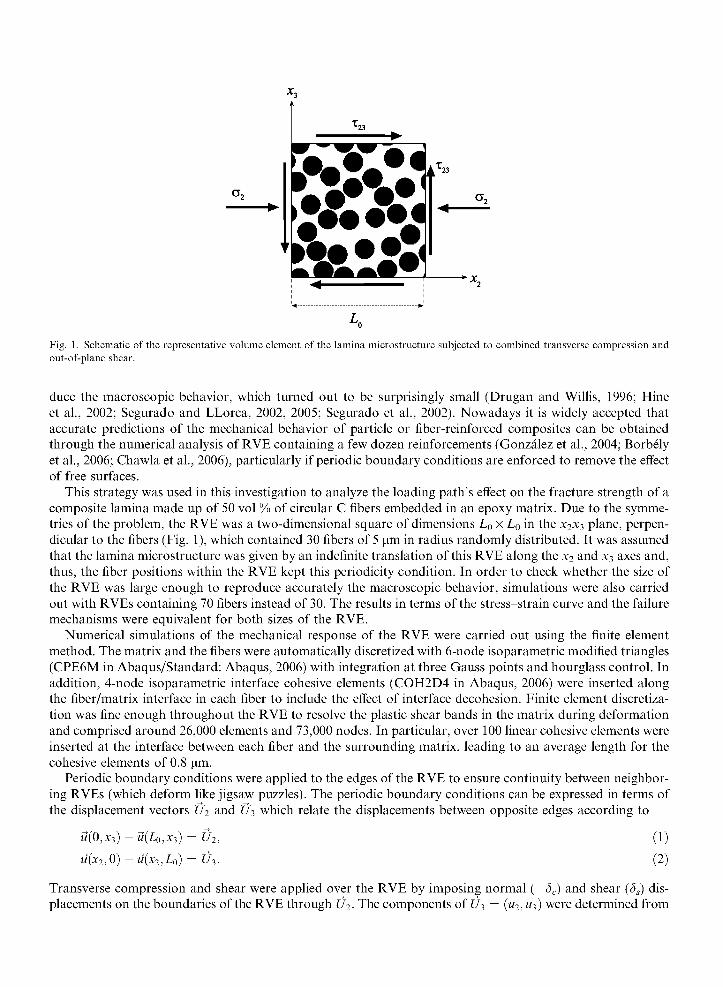
Fig. 1. Schematic of the representative volume element of the lamina microstructure subjected to combined transverse compression and out-of-plane shear.
duce the macroscopic behavior, which turned out to be surprisingly small (Drugan and Willis, 1996; Hine et al., 2002; Segurado and LLorca, 2002, 2005; Segurado et al., 2002). Nowadays it is widely accepted that accurate predictions of the mechanical behavior of particle or fiber-reinforced composites can be obtained through the numerical analysis of RVE containing a few dozen reinforcements (Gonzalez et al., 2004; Borbely et al., 2006; Chawla et al., 2006), particularly if periodic boundary conditions are enforced to remove the effect of free surfaces.
This strategy was used in this investigation to analyze the loading path's effect on the fracture strength of a composite lamina made up of 50 vol % of circular C fibers embedded in an epoxy matrix. Due to the symmetries of the problem, the RVE was a two-dimensional square of dimensions L0 x L0 in the x2x3 plane, perpendicular to the fibers (Fig. 1), which contained 30 fibers of 5 urn in radius randomly distributed. It was assumed that the lamina microstructure was given by an indefinite translation of this RVE along the x2 and x3 axes and, thus, the fiber positions within the RVE kept this periodicity condition. In order to check whether the size of the RVE was large enough to reproduce accurately the macroscopic behavior, simulations were also carried out with RVEs containing 70 fibers instead of 30. The results in terms of the stress-strain curve and the failure mechanisms were equivalent for both sizes of the RVE.
Numerical simulations of the mechanical response of the RVE were carried out using the finite element method. The matrix and the fibers were automatically discretized with 6-node isoparametric modified triangles (CPE6M in Abaqus/Standard: Abaqus, 2006) with integration at three Gauss points and hourglass control. In addition, 4-node isoparametric interface cohesive elements (COH2D4 in Abaqus, 2006) were inserted along the fiber/matrix interface in each fiber to include the effect of interface decohesion. Finite element discretization was fine enough throughout the RVE to resolve the plastic shear bands in the matrix during deformation and comprised around 26,000 elements and 73,000 nodes. In particular, over 100 linear cohesive elements were inserted at the interface between each fiber and the surrounding matrix, leading to an average length for the cohesive elements of 0.8 urn.
Periodic boundary conditions were applied to the edges of the RVE to ensure continuity between neighboring RVEs (which deform like jigsaw puzzles). The periodic boundary conditions can be expressed in terms of the displacement vectors U2 and £/3 which relate the displacements between opposite edges according to
M(0,X3) - M(IO,X3) = U2,
u(x2,0) -U(X2,L0) = U3.
(1)
(2)
Transverse compression and shear were applied over the RVE by imposing normal (—<5C) and shear (8S) displacements on the boundaries of the RVE through U2. The components of £/3 = (u2, w3) were determined from
the conditions that the average normal traction perpendicular to the compression axis should be 0, and from the condition of static equilibrium (the total moment induced by the shear stresses acting on the boundaries should be zero).
The compressive (e2) and shear (y23) strains were given by ln{l — Sc/L0} and avctan{SJ(L0 — Sc)}, respectively. The corresponding normal (<r2) and shear (x23) stresses were computed from the resultant normal and tangential forces acting on the edges divided by the actual cross-section Q as
ff2 = — / t„dx2 and x23 = — / ^dx2 (3)
The mechanical response of the RVE until failure was computed using three different loading paths. The first one was a pseudo-radial path in which normal and tangential displacements were increased proportionally according to U2 = (—Sc, Ss). In the second one, the RVE was subjected to uniaxal compression until a prescribed compressive stress. The compressive force acting on the RVE was then held constant and the specimen was loaded in shear until failure. The third loading path began by deforming the RVE in simple shear up to a given value of the shear stress. The shear force applied in the RVE was then held constant while uniaxial compression was applied over the RVE until failure.
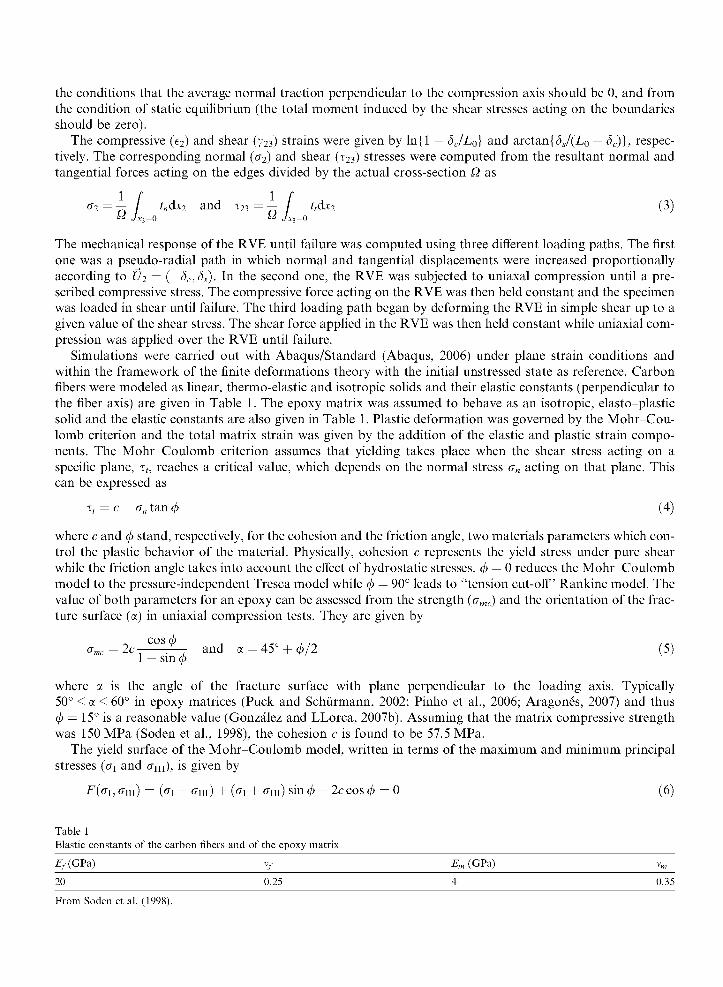
Simulations were carried out with Abaqus/Standard (Abaqus, 2006) under plane strain conditions and within the framework of the finite deformations theory with the initial unstressed state as reference. Carbon fibers were modeled as linear, thermo-elastic and isotropic solids and their elastic constants (perpendicular to the fiber axis) are given in Table 1. The epoxy matrix was assumed to behave as an isotropic, elasto-plastic solid and the elastic constants are also given in Table 1. Plastic deformation was governed by the Mohr-Coulomb criterion and the total matrix strain was given by the addition of the elastic and plastic strain components. The Mohr-Coulomb criterion assumes that yielding takes place when the shear stress acting on a specific plane, zt, reaches a critical value, which depends on the normal stress an acting on that plane. This can be expressed as
T, = c - <r„ tan <f> (4)
where c and </> stand, respectively, for the cohesion and the friction angle, two materials parameters which control the plastic behavior of the material. Physically, cohesion c represents the yield stress under pure shear while the friction angle takes into account the effect of hydrostatic stresses. <f> — 0 reduces the Mohr-Coulomb model to the pressure-independent Tresca model while <f> — 90° leads to "tension cut-off' Rankine model. The value of both parameters for an epoxy can be assessed from the strength (amc) and the orientation of the fracture surface (a) in uniaxial compression tests. They are given by
cos (b amc = 2c- ?—- and a = 45° + <j>/2 (5)
1 — sin <p
where a is the angle of the fracture surface with plane perpendicular to the loading axis. Typically 50° < a < 60° in epoxy matrices (Puck and Schurmann, 2002; Pinho et al., 2006; Aragones, 2007) and thus <f> — 15° is a reasonable value (Gonzalez and LLorca, 2007b). Assuming that the matrix compressive strength was 150 MPa (Soden et al., 1998), the cohesion c is found to be 57.5 MPa.
The yield surface of the Mohr-Coulomb model, written in terms of the maximum and minimum principal stresses (oj and <Tin), is given by
F(<Ti,<Tm) = (ci - cm) + (ffi + cm) sin <f> - 2ccos <f> = 0 (6)
Table 1
Elastic constants of the carbon fibers and of the epoxy matrix
Ef (GPa) vf Em (GPa) vm
20 0.25 4 0.35
From Soden et al. (1998).
and it was assumed that c and <j> were constant and independent of the accumulated plastic strain. A non-associative flow rule was used to compute the directions of plastic flow in the stress space and the corresponding potential flow G was expressed as
4( l -e 2 )cos 2 6> + ( 2 e - l ) 2 3 - s i n ^
~ 2(1 - e2) c o s 0 + (2e - 1)^4(1 - e2) cos2 0 + 5e2 - 4e 6cos<£
in which e — (3 — sin</>)/(3 + sin</>) and 0 is obtained from
0 = - arccos \-j-\ (8)
where J2 and / 3 are, respectively, the second and the third invariants of the deviatoric stress tensor. More details about the numerical implementation of the Mohr-Coulomb model can be found in Abaqus (1998) and Menetrey and Willam (1995).
Finally, interface decohesion was included in the simulations through a cohesive crack model which dictates the fracture of the elements inserted at the fiber/matrix interface. The mechanical behavior of these elements was expressed in terms of a traction-separation law which relates the displacement jump across the interface with the traction vector acting upon it. The interface elements initially provide a linear, stiff response which ensures displacement continuity at the interface. The onset of damage is dictated by a maximum stress criterion expressed mathematically as
max{M,!} = , (9)
in which () stand for the Macaulay brackets, which return the argument if positive and zero otherwise, to impede the development of damage when the interface is under compression, and N and S are the normal and tangential interfacial strengths which, for simplicity were assumed to be equal (N— S).
Once the damage begins, the stress transferred through the crack is reduced depending on the interface damage parameter d, which evolves from 0 (in the absence of damage) to 1 (no stresses transmitted across the interface) following a linear traction-separation law. In addition, the energy necessary to completely break the interface is always equal to r, the interface fracture energy, regardless of the loading path. It has been shown previously that the compressive strength of fiber-reinforced composites is very sensitive to interface strength but not to interface toughness (Gonzalez and LLorca, 2007a). Thus, results for two different materials are presented below, the first with a strong interface (N — S — c) and the second with a weak one (N — S — 0.25c). In both cases, the interface fracture energy was 100 J/m2, a reasonable magnitude for C/ epoxy interfaces according to available experimental data (Zhou et al., 2001). More details about the numerical implementation of the Mohr-Coulomb and cohesive crack models can be found in a previous investigation (Gonzalez and LLorca, 2007a). It was checked at the end of the simulations that the cohesive cracks at the interface were much longer (at least 5-10 times) than the length of the linear cohesive elements.
3. Results
3.1. Basic deformation failure mechanisms
Mechanical behavior under either uniaxial compression or out-of-plane shear was analyzed first to establish the dominant deformation and failure mechanisms in each case. These will provide fundamental information to support the discussion on the loading path's influence in the subsections below. The corresponding <r2-e2
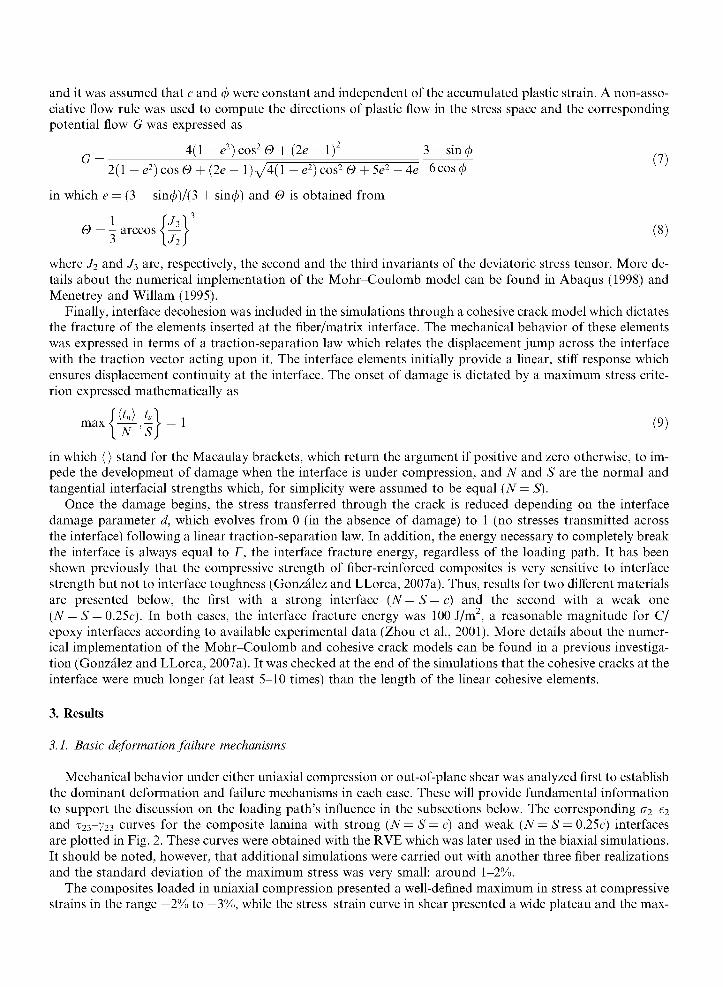
and T23-723 curves for the composite lamina with strong (N — S— c) and weak (N — S— 0.25c) interfaces are plotted in Fig. 2. These curves were obtained with the RVE which was later used in the biaxial simulations. It should be noted, however, that additional simulations were carried out with another three fiber realizations and the standard deviation of the maximum stress was very small: around 1-2%.
The composites loaded in uniaxial compression presented a well-defined maximum in stress at compressive strains in the range —2% to —3%, while the stress-strain curve in shear presented a wide plateau and the max-
160
Strain (e2 or y23/
Fig. 2. Stress-strain curves under uniaxial compression and out-of-plane shear for the composite lamina with strong and weak fiber/ matrix interfaces. The absolute values of the stress and strain are used to plot the curves in compression.
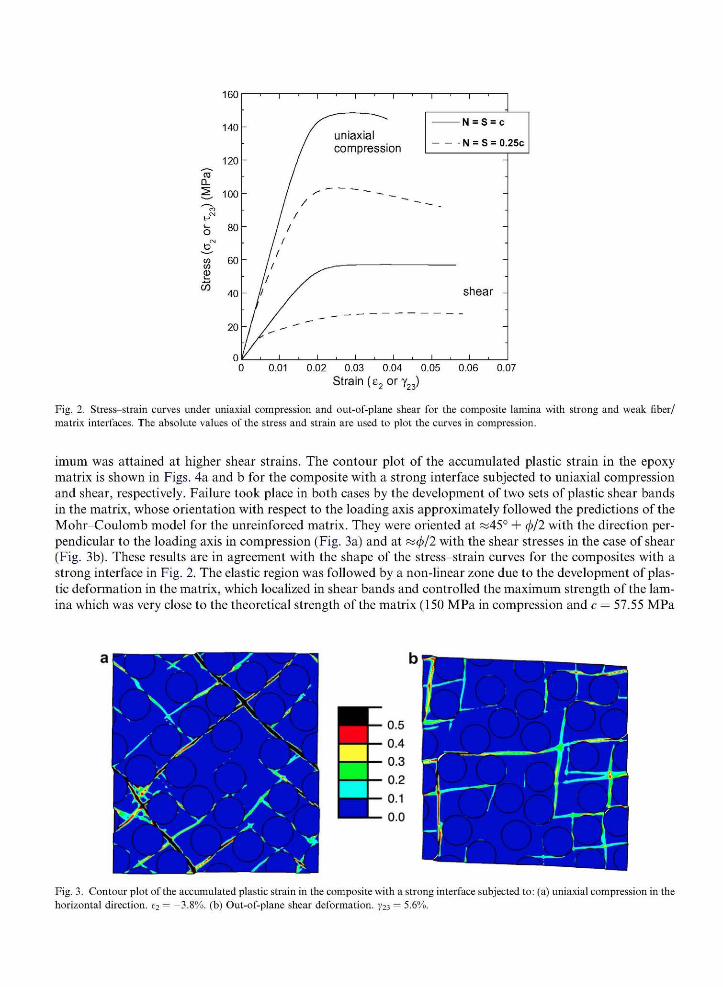
imum was attained at higher shear strains. The contour plot of the accumulated plastic strain in the epoxy matrix is shown in Figs. 4a and b for the composite with a strong interface subjected to uniaxial compression and shear, respectively. Failure took place in both cases by the development of two sets of plastic shear bands in the matrix, whose orientation with respect to the loading axis approximately followed the predictions of the Mohr-Coulomb model for the unreinforced matrix. They were oriented at «45° + <f>/2 with the direction perpendicular to the loading axis in compression (Fig. 3a) and at «</>/2 with the shear stresses in the case of shear (Fig. 3b). These results are in agreement with the shape of the stress-strain curves for the composites with a strong interface in Fig. 2. The elastic region was followed by a non-linear zone due to the development of plastic deformation in the matrix, which localized in shear bands and controlled the maximum strength of the lamina which was very close to the theoretical strength of the matrix (150 MPa in compression and c — 57.55 MPa
Fig. 3. Contour plot of the accumulated plastic strain in the composite with a strong interface subjected to: (a) uniaxial compression in the horizontal direction. e2 = —3.8%. (b) Out-of-plane shear deformation. y23 = 5.6%.
in shear). Interface decohesion only played a minor role in the fracture process in this case and promoted the final localization of damage along a shear band, whose precise orientation depended on the details of the fiber spatial distribution, which did not always grow along the theoretical angle.
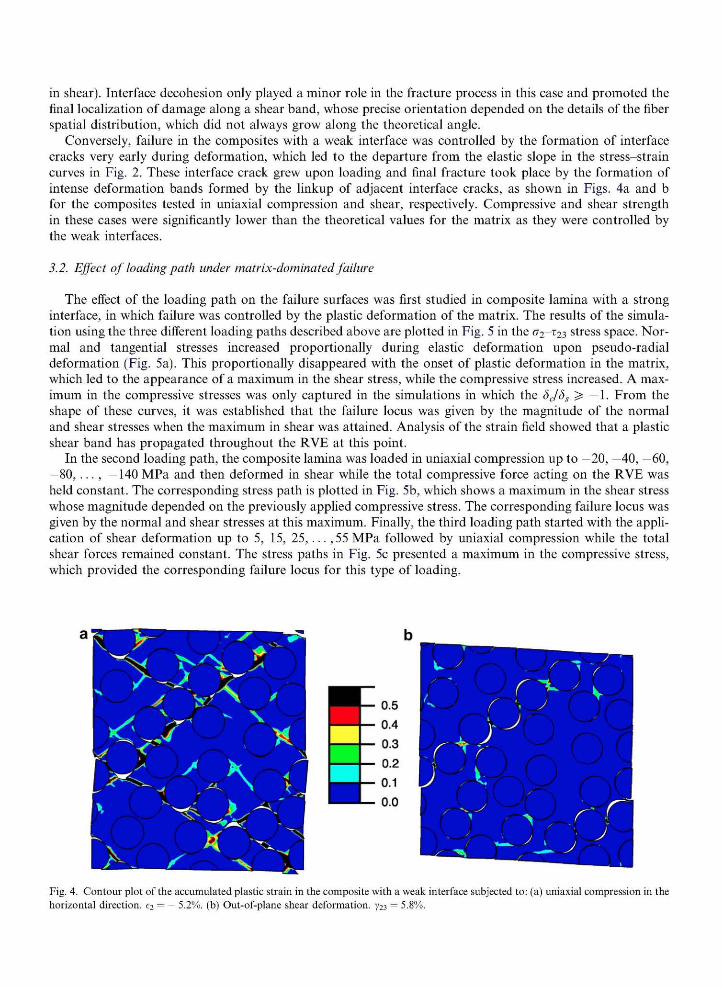
Conversely, failure in the composites with a weak interface was controlled by the formation of interface cracks very early during deformation, which led to the departure from the elastic slope in the stress-strain curves in Fig. 2. These interface crack grew upon loading and final fracture took place by the formation of intense deformation bands formed by the linkup of adjacent interface cracks, as shown in Figs. 4a and b for the composites tested in uniaxial compression and shear, respectively. Compressive and shear strength in these cases were significantly lower than the theoretical values for the matrix as they were controlled by the weak interfaces.
3.2. Effect of loading path under matrix-dominated failure
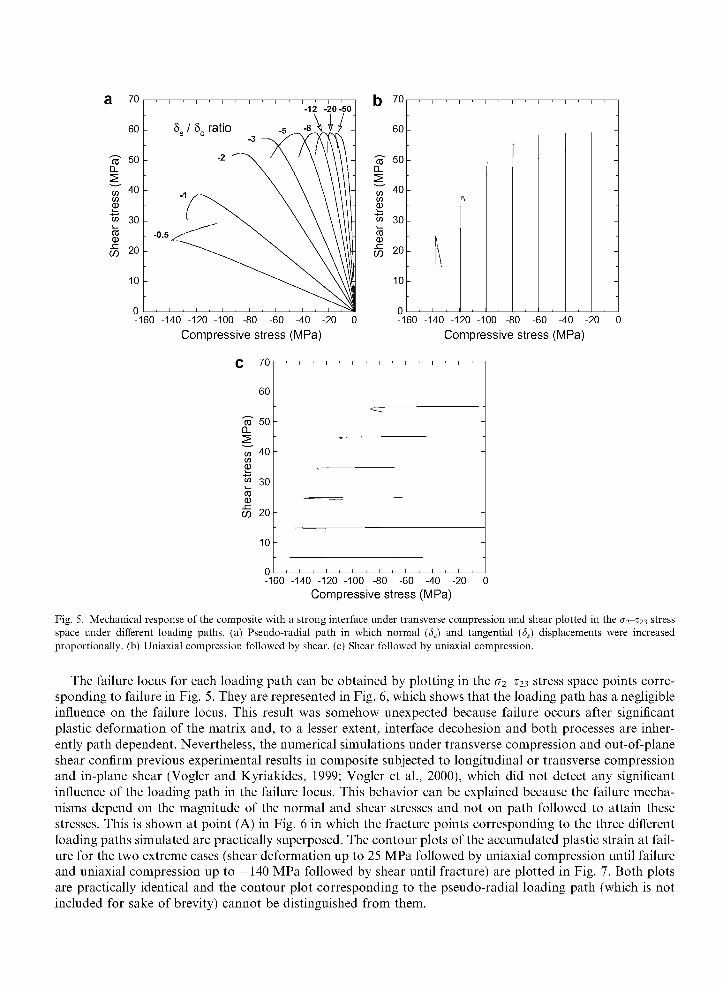
The effect of the loading path on the failure surfaces was first studied in composite lamina with a strong interface, in which failure was controlled by the plastic deformation of the matrix. The results of the simulation using the three different loading paths described above are plotted in Fig. 5 in the 02-T23 stress space. Normal and tangential stresses increased proportionally during elastic deformation upon pseudo-radial deformation (Fig. 5a). This proportionally disappeared with the onset of plastic deformation in the matrix, which led to the appearance of a maximum in the shear stress, while the compressive stress increased. A maximum in the compressive stresses was only captured in the simulations in which the 8J8S ^ — 1. From the shape of these curves, it was established that the failure locus was given by the magnitude of the normal and shear stresses when the maximum in shear was attained. Analysis of the strain field showed that a plastic shear band has propagated throughout the RVE at this point.
In the second loading path, the composite lamina was loaded in uniaxial compression up to —20, —40, —60, —80, . . . , —140 MPa and then deformed in shear while the total compressive force acting on the RVE was held constant. The corresponding stress path is plotted in Fig. 5b, which shows a maximum in the shear stress whose magnitude depended on the previously applied compressive stress. The corresponding failure locus was given by the normal and shear stresses at this maximum. Finally, the third loading path started with the application of shear deformation up to 5, 15, 2 5 , . . . ,55 MPa followed by uniaxial compression while the total shear forces remained constant. The stress paths in Fig. 5c presented a maximum in the compressive stress, which provided the corresponding failure locus for this type of loading.
Fig. 4. Contour plot of the accumulated plastic strain in the composite with a weak interface subjected to: (a) uniaxial compression in the horizontal direction. e2 = — 5.2%. (b) Out-of-plane shear deformation. y23 = 5.8%.
70
60
ro~ 50 D.
co 40 CO 03 i_
w 30 \— CD 03
W 20
10
0
-12 -20-50
8s / 8c ratio
-160 -140 -120 -100 -80 -60 -40 -20 0
Compressive stress (MPa)
b 70
60
"to 50 D.
co 40 CO 03 i_
w 30 i_ CD 03 W 20
10
0
-
^
\
I -
-160 -140 -120 -100 -80 -60 -40 -20
Compressive stress (MPa)
-140 -120 -100 -80 -60 -40 -20 0
Compressive stress (MPa)
Fig. 5. Mechanical response of the composite with a strong interface under transverse compression and shear plotted in the (T2-T23 stress space under different loading paths, (a) Pseudo-radial path in which normal (<S,.) and tangential (Ss) displacements were increased proportionally, (b) Uniaxial compression followed by shear, (c) Shear followed by uniaxial compression.
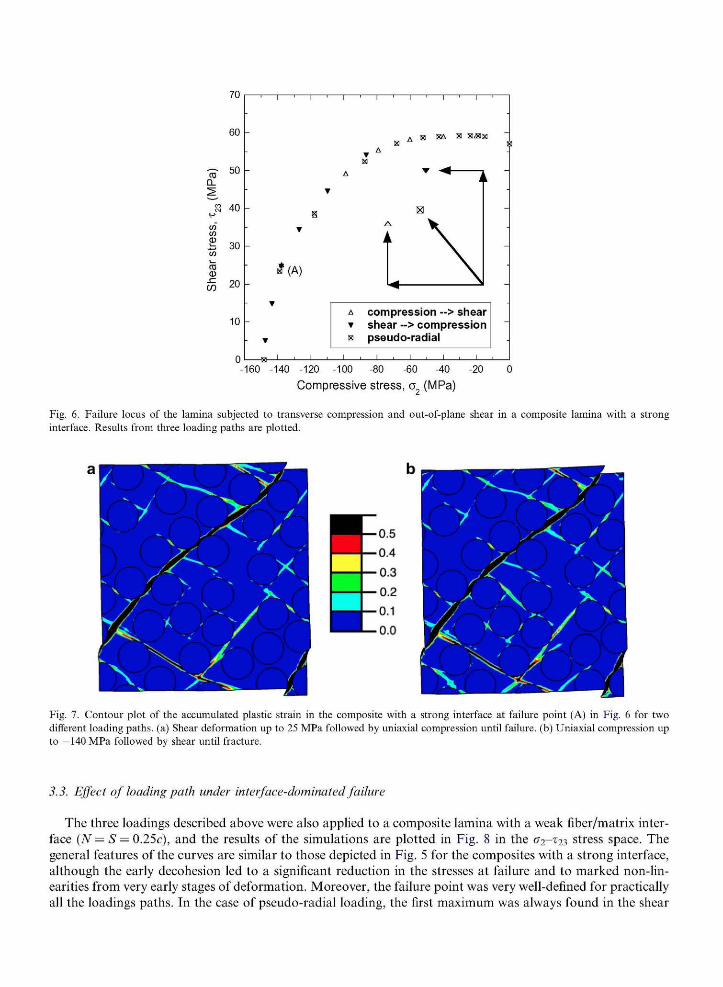
The failure locus for each loading path can be obtained by plotting in the <T2-T23 stress space points corresponding to failure in Fig. 5. They are represented in Fig. 6, which shows that the loading path has a negligible influence on the failure locus. This result was somehow unexpected because failure occurs after significant plastic deformation of the matrix and, to a lesser extent, interface decohesion and both processes are inherently path dependent. Nevertheless, the numerical simulations under transverse compression and out-of-plane shear confirm previous experimental results in composite subjected to longitudinal or transverse compression and in-plane shear (Vogler and Kyriakides, 1999; Vogler et al., 2000), which did not detect any significant influence of the loading path in the failure locus. This behavior can be explained because the failure mechanisms depend on the magnitude of the normal and shear stresses and not on path followed to attain these stresses. This is shown at point (A) in Fig. 6 in which the fracture points corresponding to the three different loading paths simulated are practically superposed. The contour plots of the accumulated plastic strain at failure for the two extreme cases (shear deformation up to 25 MPa followed by uniaxial compression until failure and uniaxial compression up to —140 MPa followed by shear until fracture) are plotted in Fig. 7. Both plots are practically identical and the contour plot corresponding to the pseudo-radial loading path (which is not included for sake of brevity) cannot be distinguished from them.
CD D.
CD CD
W
60
50
40
30
20
10
n
1 I ' I '
T
g
T
i(A)
T
T
B—l ' 1 •-
| i | i | i | i | i
X
A T * A
B
| \
"* ^
--
_
-
A compression --> shear • shear --> compression x pseudo-radial
, -160 -140 -120 -100 -80 -60 -40 -20
Compressive stress, o2 (MPa)
Fig. 6. Failure locus of the lamina subjected to transverse compression and out-of-plane shear in a composite lamina with a strong interface. Results from three loading paths are plotted.
Fig. 7. Contour plot of the accumulated plastic strain in the composite with a strong interface at failure point (A) in Fig. 6 for two different loading paths, (a) Shear deformation up to 25 MPa followed by uniaxial compression until failure, (b) Uniaxial compression up to —140 MPa followed by shear until fracture.
3.3. Effect of loading path under interface-dominated failure
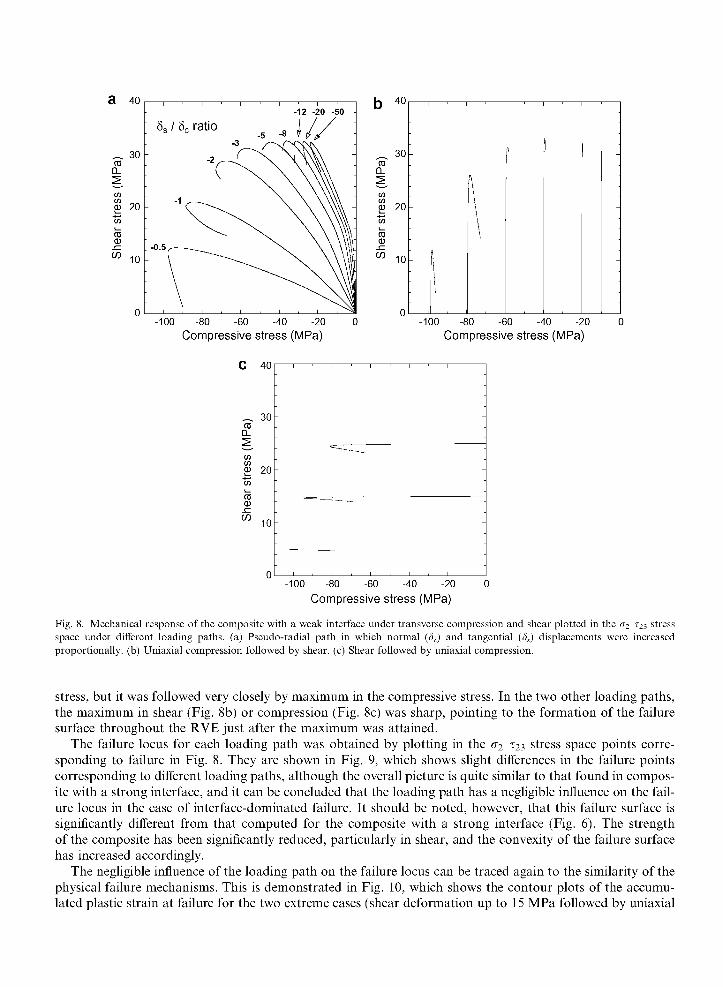
The three loadings described above were also applied to a composite lamina with a weak fiber/matrix interface (N — S — 0.25c), and the results of the simulations are plotted in Fig. 8 in the 02-T23 stress space. The general features of the curves are similar to those depicted in Fig. 5 for the composites with a strong interface, although the early decohesion led to a significant reduction in the stresses at failure and to marked non-linearities from very early stages of deformation. Moreover, the failure point was very well-defined for practically all the loadings paths. In the case of pseudo-radial loading, the first maximum was always found in the shear
a 40
30 CD
D.
co
jg 20 to i_ CD CD
W 10
-12 -20 -50
8S / 8C ratio
40
-100 -80 -60 -40 -20 Compressive stress (MPa)
30 CD D.
CO
jg 20
i _ CD CD
W 10 _
I \
\ I "
-100 -80 -60 -40 -20 Compressive stress (MPa)
-100 -80 -60 -40 -20 Compressive stress (MPa)
Fig. 8. Mechanical response of the composite with a weak interface under transverse compression and shear plotted in the (T2-T23 stress space under different loading paths, (a) Pseudo-radial path in which normal (<S,.) and tangential (Ss) displacements were increased proportionally, (b) Uniaxial compression followed by shear, (c) Shear followed by uniaxial compression.
stress, but it was followed very closely by maximum in the compressive stress. In the two other loading paths, the maximum in shear (Fig. 8b) or compression (Fig. 8c) was sharp, pointing to the formation of the failure surface throughout the RVE just after the maximum was attained.
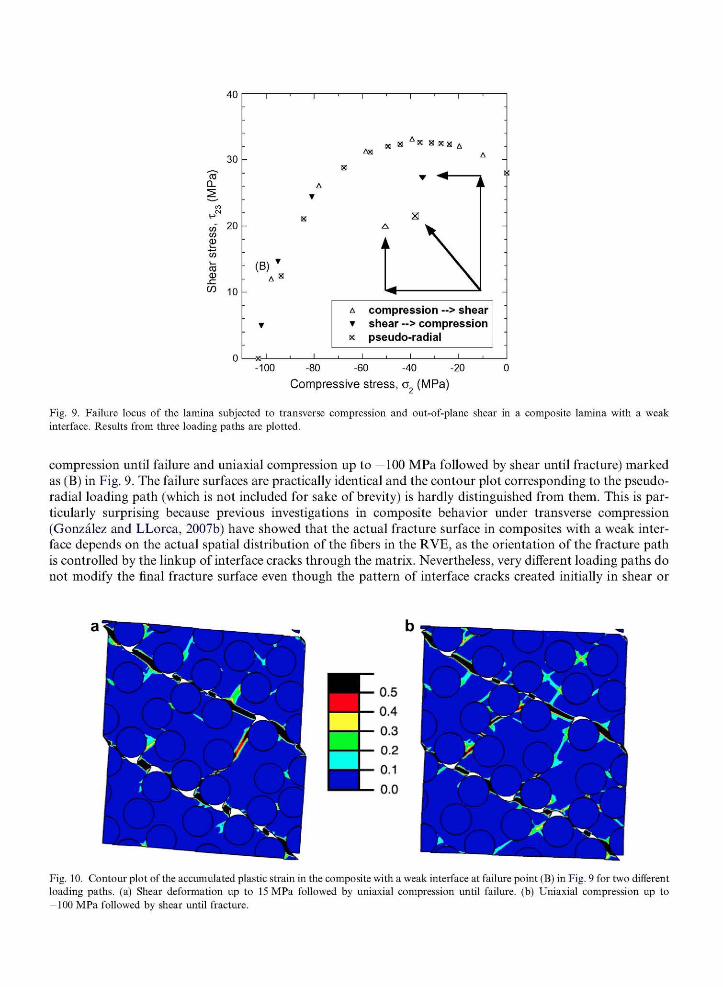
The failure locus for each loading path was obtained by plotting in the 02-T23 stress space points corresponding to failure in Fig. 8. They are shown in Fig. 9, which shows slight differences in the failure points corresponding to different loading paths, although the overall picture is quite similar to that found in composite with a strong interface, and it can be concluded that the loading path has a negligible influence on the failure locus in the case of interface-dominated failure. It should be noted, however, that this failure surface is significantly different from that computed for the composite with a strong interface (Fig. 6). The strength of the composite has been significantly reduced, particularly in shear, and the convexity of the failure surface has increased accordingly.
The negligible influence of the loading path on the failure locus can be traced again to the similarity of the physical failure mechanisms. This is demonstrated in Fig. 10, which shows the contour plots of the accumulated plastic strain at failure for the two extreme cases (shear deformation up to 15 MPa followed by uniaxial
t u
30
^ D. 2
CO CM
w" 20 CO 03 i_ U3
CD 03
w 1 0
0
I ' I
A
T
X
" (B) T
A H
T
— B - l ' 1
I i I i I
X
' "" A .
A compression --> shear • shear --> compression x pseudo-radial
-
-100 -80 -60 -40 -20
Compressive stress, o2 (MPa)
Fig. 9. Failure locus of the lamina subjected to transverse compression and out-of-plane shear in a composite lamina with a weak interface. Results from three loading paths are plotted.
compression until failure and uniaxial compression up to —100 MPa followed by shear until fracture) marked as (B) in Fig. 9. The failure surfaces are practically identical and the contour plot corresponding to the pseudo-radial loading path (which is not included for sake of brevity) is hardly distinguished from them. This is particularly surprising because previous investigations in composite behavior under transverse compression (Gonzalez and LLorca, 2007b) have showed that the actual fracture surface in composites with a weak interface depends on the actual spatial distribution of the fibers in the RVE, as the orientation of the fracture path is controlled by the linkup of interface cracks through the matrix. Nevertheless, very different loading paths do not modify the final fracture surface even though the pattern of interface cracks created initially in shear or
Fig. 10. Contour plot of the accumulated plastic strain in the composite with a weak interface at failure point (B) in Fig. 9 for two different loading paths, (a) Shear deformation up to 15 MPa followed by uniaxial compression until failure, (b) Uniaxial compression up to — 100 MPa followed by shear until fracture.
compression depends on whether the material is initially loaded in compression or shear. This implies that the localization of damage occurs very quickly once the stress state approaches the failure surface and it is not dependent on the process to reach that point.
4. Concluding remarks
The mechanical behavior of a FRC lamina subjected to transverse compression and out-of-plane shear has been simulated using computational micromechanics. This is carried out using finite element simulation of a RVE of the lamina microstructure, which explicitly includes fiber and matrix spatial distribution within the lamina. In addition, the actual failure mechanisms (plastic deformation of the matrix and interface decohe-sion) are included in the simulations through the corresponding constitutive models. This strategy was applied to assess the effect of the loading path on the failure locus under transverse compression and out-of-plane shear, a biaxial stress state very difficult to reproduce experimentally. The matrix and fiber properties were those of a epoxy/C composite and two different values of the interface strength were selected to explore the limiting cases of composites with strong or weak interface.
Three different loading paths were analyzed for each material. The first one was a pseudo-radial path in which normal and tangential displacements were increased proportionally. The second one began by uniaxal compression until a prescribed compressive stress, followed by shear until failure while the compressive force was held constant. The third loading path began by shear deformation up to a given value of the shear stress, followed by uniaxial compression while the shear force was held constant. It was found that the influence of the loading path on the failure surface was negligible for the materials with strong and weak interfaces. Failure in the former was dominated by the development of plastic shear bands in the matrix and by the development of interface cracks in the latter but the failure mechanisms in each material did not depend on the loading path. This lack of sensitivity by the failure locus to the loading path is very probably due to the fact that the dominant failure mechanism in each material was the same in transverse compression and in shear. Failure is also controlled by the same mechanisms under a combination of both stresses and failure locus depended mainly on the magnitude of the stresses that trigger fracture rather than on the loading path to reach the critical condition. This explanation is in agreement with the experimental results in Vogler and Kyriakides (1999) and Vogler et al. (2000), which showed that the loading path did not significantly modify the failure envelope in composite lamina subjected to longitudinal compression and in-plane shear or to transverse compression and in-plane shear. Failure in the former took place by the localization of the deformation in a narrow band of highly bent fibers, regardless of the loading path, while failure in the latter was controlled by matrix fracture in shear. Our results provide an explanation for these experimental data and extend their validity to lamina loaded in transverse compression and out-of-plane shear. From a practical viewpoint, these conclusions support the use of failure criteria to assess the fracture of composite structures, as the failure condition is independent of the path, which can be very different in the individual lamina and in the structure.
Acknowledgments
This investigation was supported by the Ministerio de Eduacion y Ciencia de Espana through the Grant MAT 2006-2602 and by the Comunidad de Madrid through the program ESTRUMAT-CM (reference MAT/0077).
References
Abaqus, 1998. Theory Manual. HKS, Inc. Abaqus, 2006. Users' Manual. ABAQUS, Inc. Aragones, D., 2007. Fracture micromechanisms in C/epoxy composites under transverse compression. Master Thesis, Universidad
Politecnica de Madrid. Borbely, A., Kenesei, P., Biermann, H., 2006. Estimation of the effective properties of particle-reinforced metalmatrix composites from
microtomographic reconstructions. Acta Materialia 54, 2735-2744. Brockenbrough, J.R., Suresh, S., Wienecke, H.A., 1991. Deformation of metalmatrix composites with continuous fibers: geometrical
effects of fiber distribution and shape. Acta Metallurgica et Materialia 39, 735-752.
Chawla, N., Sidhu, R.S., Ganesh, V.V., 2006. Three-dimensional visualization and microstructure-based modeling of deformation in particle-reinforced composites. Acta Materialia 54, 1541-1548.
Cox, B., Yang, Q., 2006. In quest of virtual tests for structural composites. Science 314, 1102-1107. Davila, C , Camanho, P.P., Rose, C.A., 2005. Failure criteria for FRP laminates. Journal of Composite Materials 39, 323-345. Drugan, W.J., Willis, J.R., 1996. A micromechanics-based nonlocal constitutive equation and estimates of the representative volume
element size for elastic composites. Journal of the Mechanics and Physics of Solids 44, 497-524. Gonzalez, C , LLorca, J., 2006. Multiscale modeling of fracture in fiber-reinforced composites. Acta Materialia 54, 4171-4181. Gonzalez, C , LLorca, J., 2007a. Mechanical behavior of unidirectional fiber-reinforced polymers under transverse compression:
microscopic mechanisms and modeling. Composites Science and Technology 67, 2795-2806. Gonzalez, C , LLorca, J., 2007b. Numerical simulation of the fracture behavior of Ti/SiC composites between 20 °C and 400 °C.
Metallurgical and Materials Transactions A 38, 169-179. Gonzalez, C , LLorca, J., 2007c. Virtual fracture testing of fiber-reinforced composites: a computational micromechanics approach.
Engineering Fracture Mechanics 74, 1126-1138. Gonzalez, C , Segurado, J., LLorca, J., 2004. Numerical simulation of elastoplastic deformation of composites: evolution of stress
microfields and implications for homogenization models. Journal of the Mechanics and Physics of Solids 52, 1573-1593. Hashin, Z., 1980. Failure criteria for unidirectional fiber composites. Journal of Applied Mechanics 47, 329-334. Hine, P.J., Lusti, H.R., Gusev, A.A., 2002. Numerical simulation of the effects of volume fraction, aspect ratio and fibre length
distribution on the elastic and thermoelastic properties of short fibre composites. Composites Science and Technology 62, 1445-1453. Jelf, P.M., Fleck, N.A., 1994. The failure of composite tubes due to combined compression and torsion. Journal of Materials Science 29,
3080-3084. LLorca, J., Segurado, J., 2004. Three-dimensional multiparticle cell simulations of deformation and damage in sphere-reinforced
composites. Materials Science and Engineering A365, 267-274. Menetrey, P., Willam, K.J., 1995. Triaxial failure criterion for concrete and its generalization. ACI Structural Journal 92, 311-318. Pinho, S.T., Iannucci, L., Robinson, P., 2006. Physically-based failure models and criteria for laminated fibre-reinforced composites with
emphasis on fibre-kinking. Part I: development. Composites: Part A 37, 63-73. Puck, A., Schurmann, H., 2002. Failure analysis of FRP laminates by means of physically based phenomenological models. Composites
Science and Technology 62, 1633-1662. Segurado, J., LLorca, J., 2002. A numerical approximation to the elastic properties of sphere-reinforced composites. Journal of the
Mechanics and Physics of Solids 50, 2107-2121. Segurado, J., LLorca, J., 2005. A computational micromechanics study of the effect of interface decohesion on the mechanical behavior of
composites. Acta Materialia 53, 4931-4942. Segurado, J., LLorca, J., 2006. Computational micromechanics of composites: the effect of particle spatial distribution. Mechanics of
Materials 38, 873-883. Segurado, J., LLorca, J., Gonzalez, C , 2002. On the accuracy of mean-field approaches to simulate the plastic deformation of composites.
Scripta Materialia 46, 525-529. Soden, P.D., Hinton, M.J., Kaddour, A.S., 1998. Lamina properties, lay-up configurations and loading conditions for a range of fibre-
reinforced composite laminates. Composites Science and Technology 58, 1011-1022. Swanson, S.R., Toombes, G.R., 1989. Characterization of prepeg tow carbon/epoxy laminates. Transactions of the ASME 111, 150-153. Vogler, T.J., Kyriakides, S., 1999. Inelastic behavior of an AS4/PEEK composite under combined transverse compression and shear. Part
I: experiments. International Journal of Plasticity 15, 783-806. Vogler, T.J., Hsu, S.-Y., Kyriakides, S., 2000. Composite failure under combined compression and shear. International Journal of Solids
and Structures 37, 1765-1791. Zhou, X.-F., Wagner, H.D., Nutt, S.R., 2001. Interfacial properties of polymer composites measured by push-out and fragmentation tests.
Composites: Part A 32, 1543-1551.