Embed Size (px)
Citation preview

1
Influence of Trapped Electrons on ECCD in Heliotron J
K. Nagasaki1), S. Yamamoto1), H. Yoshino2), K. Sakamoto1), N. B. Marushchenko3),
Y. Turkin3), T. Mizuuchi1), H. Okada1), K. Hanatani1), T. Minami1), K. Masuda1),
S. Kobayashi1), S. Konoshima1), M. Takeuchi1), Y. Nakamura2), S. Ohshima4), K. Mukai2),
H. Y. Lee2), K. Mizuno2), Y. Yoshimura5), G. Motojima5), Á. Cappa6), B. D. Blackwell7), F. Sano1)
1) Institute of Advanced Energy, Gokasho, Uji, Kyoto University, Japan
2) Graduate School of Energy Science, Gokasho, Uji, Kyoto University, Japan
3) Max-Planck-Institut für Plasmaphysik, IPP-EURATOM Association, D-17491, Greifswald,
Germany
4) Kyoto Univ. Pioneering Research Unit for Next Generation, Gokasho, Uji, Japan
5) National Institute for Fusion Science, Toki, Japan
6) Laboratorio Nacional de Fusión, EURATOM-CIEMAT, Spain
7) Plasma Research Laboratory, Australian National University, Canberra, Australia
E-mail contact of main author: [email protected]
Abstract
Second-harmonic electron cyclotron current drive (ECCD) experiments have been performed in the
stellarator/heliotron device (S/H), Heliotron J. A focused Gaussian beam is injected with the parallel
refractive index, N||, ranging from -0.05 to 0.6. The EC driven current is estimated by excluding the
bootstrap current from the total current. The experimental results show that the EC driven current is
determined by the local magnetic field structure where the EC power is deposited. The maximum EC
driven current is attained around N||=0.5 when the EC power is deposited at nearly the top of the
magnetic ripple. A large increase in electron cyclotron emission (ECE) signals is observed when the
EC current is driven, indicating an important role for high-energy electrons in the ECCD. The
experimental results for N|| and B dependence agree with a ray tracing simulation using a parallel
momentum conservation model in which the trapped particle effect is included.

2
1. Introduction
Noninductive current plays an important role in the realization of high-performance plasmas and
the sustainment of steady-state plasmas in toroidal fusion devices. In stellarator/heliotron (S/H)
systems, no Ohmic current is required for equilibrium since the confinement magnetic field is
generated by external coils. However, it is known that noninductive current flows in S/H systems as
well as in tokamaks. Finite plasma pressure gradient drives bootstrap current, and tangential neutral
beam injection (NBI) generates a noninductive NB current. Both bootstrap and NB currents modify
the rotational transform profile, thereby affecting the equilibrium and stability. In the S/H device,
Heliotron J, we have demonstrated that magnetohydrodynamic (MHD) activity of the m/n=2/1 mode
(m and n are the poloidal and toroidal mode numbers, respectively) is excited when the rotational
transform increases from 0.48 to 0.50 by bootstrap current and NB driven current [1]. The
noninductive current also modifies the edge field topology and divertor performance [2]. Furthermore,
a transition onset to an improved confinement mode in NBI plasmas has been observed in relation to
the noninductive current in the Heliotron J [3].
Electron cyclotron current drive (ECCD) is recognized as being a useful scheme for stabilizing
MHD instabilities in tokamaks[4, 5]. In S/H systems, ECCD is expected to be an effective current
drive scheme to suppress the noninductive current and to tailor the rotational transform profile,
particularly in low-shear devices. An ECCD experiment in the Heliotron J has shown that the EC
driven current strongly depends on the magnetic field configuration [6, 7], suggesting that ECCD is
determined by the balance between the Fisch–Boozer effect [8] and the Ohkawa effect [9]. We also
demonstrated that a net zero current state was maintained by cancelling the bootstrap current with
ECCD. From the viewpoint of diagnostics, S/H systems have the advantage of allowing precise
measurement of the EC driven current. Because no Ohmic current is required in S/H systems, they
achieve an accuracy of 0.1 kA using conventional Rogowski coils. Comparing experimental results
between tokamaks and helical systems gives us a deeper understanding of the ECCD physical
mechanism in toroidal devices. Experimental research on ECCD has been performed in the Heliotron
J, W7-AS [10], TJ-II [11], CHS [12] and LHD [13]. Comparative studies among various helical
devices have also been performed under international collaboration, and the ECCD efficiency was
found to be similar [14].
We have previously launched a non-focused Gaussian beam with a fixed angle for electron
cyclotron heating (ECH)/ECCD in the Heliotron J. Although several experimental ECCD findings
have been obtained using this launcher, the system has limitations for ECCD study. We have recently
installed an upgraded launcher to extend the ECCD controllability. This paper presents recent
experimental results on ECCD using the new launcher system in the Heliotron J. The dependence of
ECCD on the parallel refractive index, N||, is investigated. The role of high-energy electrons in ECCD
related to magnetic trapping is also discussed. We compare the experimental results with theoretical
analysis by using a ray-tracing simulation code, TRAVIS [15]. This paper is organized as follows. The
experimental setup including the Heliotron J device and the ECH/ECCD system is described in Sec. 2.

3
In Sec. 3 we present the experimental results, especially the dependence on N|| and the magnetic field
structure. The experimental results in the Heliotron J are compared with the results from the TRAVIS
code in Sec. 4. A summary is given in Sec. 5.
2. 70-GHz ECH/ECCD System for Heliotron J
The Heliotron J is a medium-sized plasma experimental S/H device [16, 17]. The device
parameters are: plasma major radius R = 1.2 m, averaged minor radius a = 0.1–0.2 m, rotational
transform /2= 0.3–0.8 and maximum magnetic field strength on the magnetic field axis B = 1.5 T.
The coil system is composed of an L = 1, M = 4 helical coil, two types of toroidal coils A and B, and
three pairs of vertical field coils. The configuration is scanned by varying the current ratios in each
coil, making it possible to investigate the properties of noninductive current over a wide range of
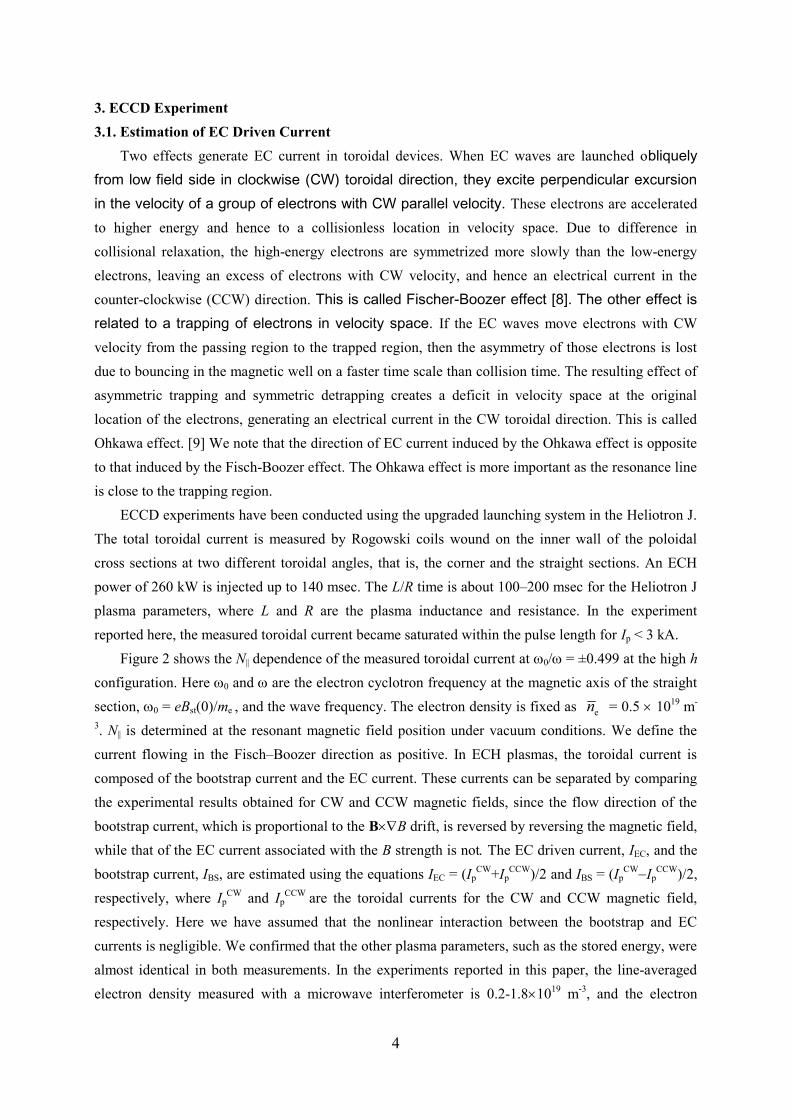
magnetic configurations. Figure 1 illustrates the magnetic field strength along the magnetic axis. The
magnetic field ripple is defined by the ratio of the magnetic field at the straight section ( = 0 deg) to
that at the corner section ( = ±45 deg), h = Bstr/Bcor. Three configurations, h = 1.06 (b = 0.01), 0.95
(b = 0.06) and 0.82 (b = 0.15), are chosen. Here b is defined as b = B04/B00 at the averaged minor
radius, = 0.67, which is varied by controlling the currents in toroidal coils A and B. Bmn is the
Fourier component of the magnetic field strength in Boozer coordinates, and m and n are the poloidal
and toroidal Fourier harmonic numbers, respectively. The toroidicity (t = B10/B00), helicity (h =
B14/B00), rotational transform and plasma volume are kept almost constant.
Plasmas are produced and heated by 70-GHz second harmonic X-mode ECH, which has a cut-off
density of 3.0 × 10¹⁹ m−3. We have recently installed an upgraded EC launching system in the
Heliotron J in order to extend the controllability of EC driven current [18]. The upgraded 70-GHz
launching system consists of an ellipsoidal mirror and a steerable flat mirror. The steerable mirror
enables us to change the beam angle flexibly in the toroidal and poloidal directions. A low power test
using a Gunn oscillator shows that the beam radius of 1/e2 power is 3 cm at the magnetic axis, smaller
than the minor radius, a ~ 17 cm, and the available N|| ranges from -0.05 to 0.6, limited by the
chamber port size. Here N|| is determined by the angle between the resonant magnetic field and EC
wave vector under vacuum conditions. The new EC launcher is positioned between the straight and
corner sections, while it was positioned at the straight section in the previous experiment, meaning
that the power is deposited at a different ripple position. See reference [6] for the previous launching
condition. EC beam injection with N|| = 0 corresponds to injection toward the corner section (~ 30
deg) in the new launcher. For large N||, the EC power is injected toward the straight section direction
(~ 15 deg), and is deposited near the ripple top for h = 1.06 and near the ripple bottom for h = 0.82.
The X-mode fraction is more than 80% for the available N||, especially more than 90% for 0.1 < N|| <
0.6. The reason why the polarization is not perfect is that only one polarizer mirror is set in the
waveguide transmission line due to the limited number of miter bends. The groove parameter is
chosen to have an X-mode fraction as high as possible in the available N|| range.
4
3. ECCD Experiment
3.1. Estimation of EC Driven Current
Two effects generate EC current in toroidal devices. When EC waves are launched obliquely
from low field side in clockwise (CW) toroidal direction, they excite perpendicular excursion
in the velocity of a group of electrons with CW parallel velocity. These electrons are accelerated
to higher energy and hence to a collisionless location in velocity space. Due to difference in
collisional relaxation, the high-energy electrons are symmetrized more slowly than the low-energy
electrons, leaving an excess of electrons with CW velocity, and hence an electrical current in the
counter-clockwise (CCW) direction. This is called Fischer-Boozer effect [8]. The other effect is
related to a trapping of electrons in velocity space. If the EC waves move electrons with CW
velocity from the passing region to the trapped region, then the asymmetry of those electrons is lost
due to bouncing in the magnetic well on a faster time scale than collision time. The resulting effect of
asymmetric trapping and symmetric detrapping creates a deficit in velocity space at the original
location of the electrons, generating an electrical current in the CW toroidal direction. This is called
Ohkawa effect. [9] We note that the direction of EC current induced by the Ohkawa effect is opposite
to that induced by the Fisch-Boozer effect. The Ohkawa effect is more important as the resonance line
is close to the trapping region.
ECCD experiments have been conducted using the upgraded launching system in the Heliotron J.
The total toroidal current is measured by Rogowski coils wound on the inner wall of the poloidal
cross sections at two different toroidal angles, that is, the corner and the straight sections. An ECH
power of 260 kW is injected up to 140 msec. The L/R time is about 100–200 msec for the Heliotron J
plasma parameters, where L and R are the plasma inductance and resistance. In the experiment
reported here, the measured toroidal current became saturated within the pulse length for Ip < 3 kA.
Figure 2 shows the N|| dependence of the measured toroidal current at 0/ = ±0.499 at the high h
configuration. Here 0 and are the electron cyclotron frequency at the magnetic axis of the straight
section, 0 = eBst(0)/me , and the wave frequency. The electron density is fixed as en = 0.5 1019 m-
3. N|| is determined at the resonant magnetic field position under vacuum conditions. We define the
current flowing in the Fisch–Boozer direction as positive. In ECH plasmas, the toroidal current is
composed of the bootstrap current and the EC current. These currents can be separated by comparing
the experimental results obtained for CW and CCW magnetic fields, since the flow direction of the
bootstrap current, which is proportional to the BB drift, is reversed by reversing the magnetic field,
while that of the EC current associated with the B strength is not The EC driven current, IEC, and the
bootstrap current, IBS, are estimated using the equations IEC = (IpCW+Ip
CCW)/2 and IBS = (IpCWIp
CCW)/2,
respectively, where IpCW and Ip
CCW are the toroidal currents for the CW and CCW magnetic field,
respectively. Here we have assumed that the nonlinear interaction between the bootstrap and EC
currents is negligible. We confirmed that the other plasma parameters, such as the stored energy, were
almost identical in both measurements. In the experiments reported in this paper, the line-averaged
electron density measured with a microwave interferometer is 0.2-1.81019 m-3, and the electron

5
temperature measured with a pulse height analysis is 0.3-1.0 keV. The electron temperature at ne=
0.51019 m-3 ranges from 0.5 to 0.8 keV.
3.2. N|| Dependence of ECCD
Figure 3 shows the EC driven current as a function of N|| in three configurations. The EC driven
current numerically calculated by the TRAVIS code (discussed in Sec. 4) is also plotted. Before
performing the N|| scanning experiment, we adjusted the magnetic field at a fixed N|| of 0.4, to find the
magnetic field for the highest EC driven current. For high and medium h configurations, the EC
driven current increases with N|| in the Fisch–Boozer direction, having maxima of Ip = 2.3 kA and 1.8
kA at N|| ~ 0.5. For the low h configuration (h = 0.82), the EC driven current is nearly zero,
independent of N||. The estimated bootstrap current is IBS = -0.1 kA, 0.6 kA and 0.53 kA at N|| = 0 for
the configurations of h = 1.06, 0.95 and 0.82, respectively. These values are close to those derived
from neoclassical theory [4]. The reasons for the finite IEC at N|| = 0 may be that the off-center EC
waves have a finite N|| and that the refraction effect makes N|| finite. For example, according to the
TRAVIS code, the N|| of the rays at the peak deposition ranges -0.06 < N|| < 0.01 for h=0.95
configuration when N|| of central ray is set to be zero. The N|| dependence in three configurations
indicates that the EC current is more strongly driven when the power is deposited at the high field
position in the magnetic ripple structure, and it is suppressed when the EC power is deposited at
nearly the bottom of the magnetic field ripple. These EC driven currents are half or less those in the
previous experiment (5 kA and -2 kA for h=1.05 and h=0.82, respectively [7]). This may be
associated with the difference in EC power deposition position. The EC power was deposited just at
either the top or the bottom of the magnetic field ripple in the previous experiment, while the EC
power is deposited at in-between position in the experiment reported here (see Fig. 1). Although the
achieved EC driven current is reduced, N|| control ability is improved by installation of the steerable
mirror.
Figure 4 shows the electron cyclotron emission (ECE) signal intensity against N|| for three
configurations. The ECE signal is measured with a multi-channel radiometer, which views the plasma
at the second harmonic frequency near magnetic axis. The ECE intensity is normalized by that at N|| =
0 in each configuration to clarify the configuration dependence. An enhancement of the ECE signals
by one order of magnitude and a high correlation between the toroidal current and the ECE intensity
have been observed for high h configuration. Since the optical thickness at this low density is gray,
~ 1, and the stored energy is weakly changed during the N|| scan, the ECE signal reflects not only the
bulk Te but also the high-energy tail. No such enhancement has been observed in the low h
configuration where the EC driven current is nearly zero. Although an increase in ECE signals at low
density has been also observed in other S/H devices such as W7-AS [19, 20] and L-2M [21], it is not
physically clear yet how enhancement of the ECE intensity is connected with the EC driven current.
The oblique launch shifts the EC absorption to a higher energy range, increasing the population of
high-energy electrons. For low h configuration, the trapped region is so wide that the produced high-

6
energy electrons do not move to the other toroidal pitch section, possibly resulting in the radiometer
located in a different toroidal section seeing only a few high-energy electrons. Although Soft-X ray
spectra measured with the pulse height diagnostic were not available in the N|| scanning experiment,
an increase in electron energy spectrum in the range of 4-10 keV was observed in the previous
experiment when the EC current was driven [7].
4. Comparison with Theory
In this section, we compare the experimental results on ECCD in the Heliotron J with a numerical
simulation in order to clarify the effect of magnetic field configuration, especially the trapped particle
effect. TRAVIS [15] is a ray tracing code for ECH/ECCD and ECE diagnostics in arbitrary 3D
magnetic configurations. The code has been applied and benchmarked with some other codes for W7-
X [22, 23] and ITER [24, 25]. For ECH/ECCD calculations, the absorption is decomposed into the
contributions from trapped and passing electrons by analyzing during integration along the resonance
line. The energy range of electrons responsible for absorption is also calculated. The resonant
harmonics, which may participate in cyclotron interaction, are defined in the code automatically by
analyzing the magnetic configuration. The CD efficiency is calculated by applying the adjoint
approach with parallel momentum conservation (PMC) taken into account [26, 27].
We apply the TRAVIS code to the Heliotron J configurations to calculate the deposition profiles
and the ECCD performance. The magnetic configuration provided by the 3D equilibrium code VMEC
is converted to Boozer coordinates and interpolated by a highly optimized package. The electron
density and temperature profiles are assumed in the simulations to be broad and peaked as ne() =
ne(0){0.01+(1-0.01)(1-8)4} and Te ()= Te(0){0.01+(1-0.01)(1-3)1.5}, which is typically observed in
ECH plasmas of S/H devices. The effective charge is fixed as Zeff = 2. Parallel Gaussian beam rays are
injected with a beam radius of 3 cm, based on the experimental cold test result. Poloidal and toroidal
cross-sections of ray trajectories calculated by TRAVIS code are shown in Fig. 5. The electron
density is ne(0)=0.51019m-3, and the electron temperature is Te(0)=0.8 keV. The magnetic field is
adjusted to locate the power deposition on axis. Figure 6 shows examples of EC power absorption
density profiles and EC driven current density profiles in three configurations. N|| is set to about 0.4
and the magnetic field strength is adjusted so that the EC driven current can be peaked on the axis. To
calculate the efficiency, both the collisional and collisionless limits were applied, which correspond to
neglecting and taking into account the trapped electrons, respectively. In the former case, i.e., without
the trapped electron effect, the total EC driven current predicted by simulation is IEC ~ 12 kA,
independent of the configuration. This amount of current corresponds to an ECCD efficiency of =
neIECR/PEC = 2.4 1017 A/Wm2 and = 32.7neIECR/PECTe = 0.10 where ne is in units of 1020 m−3, IEC in
A, R in m, PEC in W and Te in keV. It is noted that the EC power is not fully absorbed in a single path
because of the relatively gray optical depth, ~ 2. As a consequence, the EC power is absorbed by
electrons not only with k||v|| > 0, but also with k||v|| < 0, lowering the current drive efficiency as shown
in Fig. 7. The main contribution in EC absorption comes from the resonant electrons with velocities

7
vres/vth=1.2-2.7 (here vth = (2Te/me)1/2 is the thermal velocity). As the EC power is deposited at the
ripple bottom (low h configuration), the power fraction absorbed by trapped particles increases: 42%,
52% and 70% for h = 1.06, 0.95 and 0.82, respectively. This leads to a reduction in the EC driven
current if the trapped particle effect is included. In the PMC model with the trapped particle effect,
the total EC driven current is calculated as 3.0, 1.9 and -0.4 kA for h = 1.06, 0.95 and 0.82,
respectively. The EC driven current using the PMC model with the trapped particle effect is
calculated under the experimental conditions and compared with the experimental results as shown in
Fig. 3. The central electron temperature is assumed as Te(0) = 0.5–0.8 keV, based on a soft-X ray
pulse height analysis measurement. The TRAVIS calculation reproduces the N|| dependence well in all
three magnetic configurations considered in the experiments, though there is uncertainty (error bars
shown in the theoretical values) in the input parameters such as the ne and Te profiles and the effective
charge, which have not yet been measured experimentally.
We also compare experimental results obtained using the previous launching system with the
TRAVIS code calculation. An unfocused Gaussian beam of 350-kW power was launched from the top
of the torus in the straight section where the flux surfaces are bean-shaped and the B-contour forms a
saddle-type profile. Although the wave beam was injected perpendicular with respect to the equatorial
plane, it crossed the resonance layer obliquely because of the 3-D magnetic field structure, resulting
in a finite parallel refractive index N|| of 0.44 that drove the EC current. Details of the experimental
conditions are described in Ref. [4]. Figure 8 shows the B dependence of the EC driven current in
three configurations. The central electron temperature is again assumed as Te(0) = 0.5–0.8 keV. The
EC power is absorbed on the axis at 0/= 0.49 due to Doppler shift resonance. The numerical
results from the TRAVIS code agree with the experimental results and reproduce the configuration
dependence. The EC driven current is reduced when the EC power is deposited at the bottom of the
magnetic field ripple. The fraction of power absorbed by trapped electrons as a function of magnetic
field strength is shown in Fig. 9. The EC driven current in the collisional limit is too large to explain
the experimental results, and the trapped particle effect is required to explain the experimental results.
The power fraction absorbed by trapped electrons increases with an increase in magnetic field
strength, making the EC driven current nearly zero. This tendency is seen also in the other
configurations. Figure 10 shows the ne dependence of the ECCD efficiency, . The experimentally
estimated efficiency is insensitive to the electron density, and this dependence is also seen in the
simulation. There is discrepancy in the efficiency between experiment and theory by a factor of two,
although the physical reason for this is not clear. One of the reasons may be related to experimental
accuracy in magnetic field strength. The magnetic field has a saddle-type structure at the EC
launching port in the density scan experiment, where the resonant layer position is sensitive to
magnetic field strength. In this poloidal cross-section, a few percentage change in the magnetic field
strength moves the resonant layer markedly in the core region. The Heliotron J coil system has a
setting error in magnetic field about 1 %, causing a discrepancy in the efficiency between experiment
and theory especially at 0/~0.49. Experimental data such as ne and Te profiles and effective charge

8
are also required to measure for more quantitative comparison of the ECCD efficiency.
5. Summary
Second-harmonic X-mode ECCD experiments have been conducted in the Heliotron J using a
focused Gaussian beam with a controllable injection angle. The EC driven current was experimentally
estimated by excluding the bootstrap current from the total current. The experimental results show
that the EC driven current can be controlled by N|| and depends on the magnetic configuration. The
maximum EC driven current is attained around N|| = 0.5 when the EC power is deposited nearly at the
top of the magnetic ripple, and the EC driven current is nearly zero independent of N|| when the EC
power is deposited near the bottom of the magnetic ripple. The ECE signal has high correlation with
the observed EC current intensity, indicating an important role for high-energy electrons. The
experimental results including the B and N|| dependences agree with ray tracing simulations using the
TRAVIS code in which the parallel momentum conservation with trapped particle effect is
considered. Comparing between the collisional and collisionless limit models indicates clear influence
of trapped electrons on the ECCD. ECCD may be an effective tool to study the role of rotational
transform on confinement and transport such as MHD stabilization and H-mode transition. We will
study the effect of localized ECCD on rotational transform profile in the forthcoming experiment. .
Acknowledgments
The authors are grateful to the Heliotron J staff for conducting the experiments. This work was
performed with the support and under the auspices of the Collaboration Program of the Laboratory for
Complex Energy Processes, IAE, Kyoto University, and the NIFS Collaborative Research Program
(NIFS08KOAR010, NIFS10KUHL030), the NIFS/NINS project of Formation of International
Network for Scientific Collaborations, and a Grant-in-Aid for Scientific Research, MEXT.

9
References
[1] G. Motojima, et al., Plasma and Fusion Res. 3 (2008) S1067.
[2] T. Mizuuchi, et al., Nucl. Fusion 47 (2007) 395.
[3] S. Kobayashi, et al., “Study of spontaneous transition by toroidal current control in a low
magnetic shear helical device”, 11th IAEA TM on H-mode Phys. Trans. Barriers (Tsukuba, 2007)
(http://www-jt60.naka.jaea.go.jp/h-mode-tm-11/index.html).
[4] K. Nagasaki, et al., Nucl. Fusion 45 (2005) 1608–1617.
[5] H. Zohm, et al., Nucl. Fusion 47 (2007) 228–232.
[6] G. Motojima, et al., Nucl. Fusion 47 (2007) 1045.
[7] K. Nagasaki, et al., Nucl. Fusion 50 (2010) 025003.
[8] N. J. Fisch and A. Boozer, Phys. Rev. Lett. 45 (1980) 720.
[9] T. Ohkawa, ‘‘Steady state operation of tokamaks by rf heating,’’ General Atomics Report GA-
A13847 (1976); see National Technical Information Service Document PB2000-108008. Copies
may be ordered from NTIS, Springfield, Virginia 22161.
[10]V. Erckmann, et al., Nucl. Fusion 43 (2003) 1313.
[11]A. Fernández, et al., Fusion Sci. Tech. 53 (2008) 254-260.
[12]Y. Yoshimura, et al., Fusion Sci. Tech. 53 (2008) 54-61.
[13]T. Notake, et al., Plasma and Fusion Res. 3 (2008) S1077.
[14]K. Nagasaki, et al., Plasma and Fusion Res. 3 (2008) S1008.
[15]N. B. Marushchenko, et al., Plasma and Fusion Res., 2 (2007) S1129.
[16]M. Wakatani, et al., Nucl. Fusion 40 (2000) 569.
[17]T. Obiki, et al., Nucl. Fusion 41 (2001) 833.
[18]K. Nagasaki, et al., Contrib. Plasma Phys. 50 (2010) 656.
[19]M. Romé, et al., Plasma Phys. Control. Fusion 39 (1997) 117.
[20]N. B. Marushchenko, et al., “On non-local effects of ECE measurements at W7-AS”, Proc.
13th Joint Workshop on ECE& ECRH, Nizhny Novgorod, 17 -20, May, 2004, p. 125.
[21]D. K. Akulina, et al., Plasma Phys. Rep. 32 (2006) 461.
[22]V. Erckmann, et al., Fusion Sci. Technol. 52 (2007) 291.
[23]Yu. Turkin, et al., Proc. 34th EPS Conference on Plasma Phys. Warsaw, 2 - 6 July 2007 ECA
Vol.31F, P-1.148 (2007).
[24]N. B. Marushchenko, et al., Nucl. Fusion 48 (2008) 054002;
[25]N. B. Marushchenko, et al., Nucl. Fusion 49 (2009) 129801.
[26]N. B. Marushchenko, et al., Fusion Sci. Technol. 55 (2009) 180.
[27]N. B. Marushchenko, et al., Phys. Plasmas 18 (2011) 032501.
10
-45 -30 -15 0 15 30 451.0
1.1
1.2
1.3
1.4
1.5
1.6
Cornersection
Straightsection
B(T
)
Toroidal Angle (deg)
h=1.06 (b=0.01)
h=0.95 (b=0.06)
h=0.82 (b=0.15)
ECinjection port
Fig. 1. Magnetic field strength along the magnetic axis for three configurations. The ECpower is injected at the chamber port between the straight and corner sections, =22.5deg. The shaded area denotes the available injection range.

0.0 0.2 0.4 0.6-1
0
1
2
3
4
Ip (positive B)Ip (negative B)
I p(k
A)
N||
#38102-38141#39503-39528h=1.06
0/=0.499
ne~0.5x10
19m
-3
Fig. 2. Measured toroidal current as a function of N|| for positive and negativemagnetic fields. The injected EC power is 260 kW and the electron density is
11
fixed as en ~0.51019m-3.

0.0 0.2 0.4 0.6-1
0
1
2
3
4
I EC
(kA
)
N||
h=1.06P
ECH=260kW
0/=0.499
ne~0.5x10
19m
-3
IEC
(exp)
IEC
(theory)
0.0 0.2 0.4 0.6-1
0
1
2
3
4
I EC
(kA
)
N||
h=0.95P
ECH=260kW
0/=0.478
ne~0.5x10
19m
-3
IEC
(exp)
IEC
(theory)
0.0 0.2 0.4 0.6-1
0
1
2
3
4
IEC
(exp)
IEC
(theory)
I EC
(kA
)
N||
h=0.82P
ECH=260kW
0/=0.490
ne~0.5x10
19m
-3
Fig. 3. N|| dependence of EC current in three configurations (h=1.06, 0.95 and 0.82). Theclosed and open symbols denote the experimental and theoretical EC driven current,respectively. The injected EC power is 260kW and the electron density is fixed as
12
ne~0.51019m-3.

13
0.0 0.2 0.4 0.60
2
4
6
8
10
12
h=1.06, 0/=0.499
h=0.95, 0/=0.478
h=0.82, 0/=0.490
I EC
E/I
EC
E(N
||=
0)
N||
#38088-38145#35326-35347#39384-39416
Fig. 4. ECE intensity against N|| for three configurations.

14
Fig. 5. Poloidal and toroidal cross-sections of ray trajectories calculated by TRAVIScode in two configuration, (a) h=1.06 and (b) h=0.82. The electron density isne(0)=0.51019m-3, and the electron temperature is Te(0)=0.8 keV. The magnetic fieldis adjusted to locate the power on axis. The bold purple line denotes B=1.25T(0/=0.5), and the red color denotes the absorbed region.

0.0 0.2 0.4 0.6 0.8 1.00
2
4
6
8
10
h=1.06
0/=0.5034
ne(0)=0.5x10
19m
-3
Te(0)=0.8keV
dP
/dV
(MW
/m3)
reff/a
Passing particlesTrapped particlesTotal
PEC
=85.3%
(a)
0.0 0.2 0.4 0.6 0.8 1.00
2
4
6
8
10
dP
/dV
(MW
/m3)
reff/a
Passing particlesTrapped particlesTotal
h=0.95
0/=0.488
ne(0)=0.5x10
19m
-3
Te(0)=0.8keV
PEC
=86.2%
(b)
0.0 0.2 0.4 0.6 0.8 1.00
2
4
6
8
10
h=0.82
0/=0.476
ne(0)=0.5x10
19m
-3
Te(0)=0.8keV
dP
/dV
(MW
/m3)
reff/a
Passing particlesTrapped particlesTotal
PEC
=88.3%
(c)
0.0 0.2 0.4 0.6 0.8 1.0-2
0
2
4
6
8
10
JEC
(w/o trapped particle)
JEC
(w/ trapped particle)
h=0.82
0/=0.476
ne(0)=0.5x10
19m
-3
Te(0)=0.8keV
JE
C(M
W/m
2)
reff/a
IEC
=11.9kA
0.0 0.2 0.4 0.6 0.8 1.0-2
0
2
4
6
8
10
JEC
(w/o trapped particle)
JEC
(w/ trapped particle)
h=0.95
0/=0.4878
ne(0)=0.5x10
19m
-3
Te(0)=0.8keV
JE
C(M
W/m
2)
reff/a
IEC
=12.2kA
0.0 0.2 0.4 0.6 0.8 1.0-2
0
2
4
6
8
10
JEC
(w/o trapped particle)
JEC
(w/ trapped particle)
h=1.06
0/=0.5034
ne(0)=0.5x10
19m
-3
Te(0)=0.8keV
JE
C(M
W/m
2)
reff/a
IEC
=12.260kA
Fig. 6. Power absorption profiles and EC current density profiles calculated by TRAVIS codein three configurations, (a) h=1.06, (b) h=0.95 and (c) h=0.82. The black, red and blue curvesdenote the total power density and the power density absorbed by passing and trappedparticles, respectively. The injected EC power is 350 kW and the electron density is fixed as
15
ne(0)=0.51019m-3 and the central electron temperature is 0.8 keV.

16
0.5 0.6 0.7 0.80
1
2
3
4
5
dP
/ds
(MW
/m)
Length along ray (m)
dP/dsh=1.06
0/=0.5034
ne(0)=0.5x10
19m
-3
Te(0)=0.8keV
-100
-50
0
50
100
150
dIEC
/ds
dI E
C/d
s(k
A/m
)
(a)
0.5 0.6 0.7 0.80
1
2
3
4
5
h=0.95
0/=0.488
ne(0)=0.5x10
19m
-3
Te(0)=0.8keV
dP
/ds
(MW
/m)
Length along ray (m)
dP/ds
-100
-50
0
50
100
150
dIEC
/ds
dI E
C/d
s(k
A/m
)
(b)
0.5 0.6 0.7 0.80
1
2
3
4
5
h=0.82
0/=0.476
ne(0)=0.5x10
19m
-3
Te(0)=0.8keV
dP
/ds
(MW
/m)
Length along ray (m)
dP/ds
-100
-50
0
50
100
150
dIEC
/ds
dI E
C/d
s(k
A/m
)
(c)
Fig.7. Power absorption and EC current along central ray, calculated by TRAVIS code in threeconfigurations, (a) h=1.06, (b) h=0.95 and (c) h=0.82. The trapped particle effect is included.The input parameters are the same as in Fig. 8.

17
Fig. 8. B dependence of EC driven current in three configurations (h=1.06, 0.95 and 0.82).The closed and open symbols denote the experimental and theoretical EC driven currents,respectively. The injected EC power is 350 kW and the electron density is fixed as
en ~0.51019m-3. Te(0) ranges from 0.5 to 0.8 keV in the TRAVIS calculation.
0.47 0.48 0.49 0.50 0.51 0.52 0.53 0.54-4
-2
0
2
4
6
8
10
IEC
(exp)
IEC
(theory)
I EC
(kA
)
0/
h=1.06P
EC=350kW
ne=0.5x10
19m
-3
0.47 0.48 0.49 0.50 0.51 0.52 0.53 0.54 0.55-4
-2
0
2
4
6
8
10
IEC
(exp)
IEC
(theory)
I EC
(kA
)
0/
h=0.95P
EC=350kW
ne=0.5x10
19m
-3
0.47 0.48 0.49 0.50 0.51 0.52 0.53 0.54-4
-2
0
2
4
6
8
10
IEC
(exp)
IEC
(theory)
I EC
(kA
)
0/
h=0.82P
EC=350kW
ne(0)~0.5x10
19m
-3

18
0.47 0.48 0.49 0.50 0.51 0.52 0.53 0.54-15
-10
-5
0
5
10
15
20
25I E
C(k
A)
0/
h=1.06P
EC=350kW
ne(0)=0.5x10
19m
-3
Te(0)=0.8keV
IEC
w/ trapped particle
IEC
w/o trapped particle
Ptrap
/Ptot
0
20
40
60
80
100
Ptr
ap/P
tot(%
)
Fig. 9. B dependence of EC driven current calculated by using PMC model in the high hconfiguration. The power fraction absorbed by trapped particles is also plotted.

19
Fig. 10. ne dependence of current drive efficiency, =neRIp/PEC (A/Wm2), in threeconfigurations.
0.0 0.5 1.0 1.5 2.0-0.015
-0.010
-0.005
0.000
0.005
0.010
0.015
(A
/Wm
2)
ne
(1019
m-3)
h=1.06 (exp)h=1.06 (theory)h=0.95 (exp)h=0.95 (theory)h=0.82 (exp)h=0.82 (theory)