Embed Size (px)
Citation preview
268
Science Education International Vol.23, No.3, September 2012, 268-285 Influence of V-diagrams on 10th grade Turkish students’ achievement in the subject of mechanical waves
Hanife Tekeş, Selahattin Gönen*
Dicle University, Turkey
Abstract
The purpose of the present study was to examine how the use of V-diagrams one of the learning techniques used in laboratory studies in experiments conducted regarding the 10th grade lesson unit of ‘waves’ influenced students’ achievements. In the study, a quasi-experimental design with a pretest and posttest control group was used. The study was carried out with 68 high school 10th grade students attending in central Diyarbakir in the spring term of the academic year of 2010-2011. An achievement test made up of 30 multiple-choice questions covering the lesson unit of waves and a concept test made up of 20 fill-in-the-blanks and true-false questions were applied as pretest and posttest. When the scores obtained from these tests were compared, it was seen that the experimental group students were significantly more successful than the control group students. Besides these tests, the ‘V-diagram Student Views Questionnaire’ was applied to the experimental group students to determine their views about V-diagrams. Accordingly, it was concluded that the students enjoyed doing experiments by using V-diagrams and that they considered V-diagrams as a useful technique for learning the concepts related to V-diagrams and for presenting meaningful information in an organized manner.
Key words: physics education, V-diagram, concept map, achievement, mechanic waves
Introduction
Thanks to the laboratory method in physics and science education, students have the opportunity to learn by doing/experimenting in individual or group works (Algan, 1999). In general, the basic purpose of laboratories is to provide students with meaningful learning by allowing them to put their theoretical knowledge into practice via laboratory experiments. Most laboratory papers prepared for use in conducting experiments aim at helping students achieve their goals via a series of steps like recipes. However, it is seen that traditional approaches based on deduction do not help students learn science lessons in laboratories at all (Nakiboğlu & Meriç 2000; Hoffstein & Lunetta, 1982, 2003). Therefore, students cannot * Corresponding author. Email: [email protected]
Influence of V-diagrams on 10th-grade Turkish students’ achievement in the subject of mechanical waves
269
establish interaction between their previous knowledge and the new information they produce during laboratory studies. For this reason, in order to transform a laboratory into an environment in which meaningful learning is achieved, different instructional techniques should be used (Atılboz & Yakışan, 2003).
In this study, importance of V-diagrams for conceptual learning, using of it for integration of theoretical knowledge with laboratory activities and how this diagram can be prepared have been introduced. The V-diagrams can be used in various fields, including curriculum planning and developing, assessment and as an analytical tool for teacher’s responses (Esiobu & Soyibo, 1995; Novak, 2002; Kataibeh, 2005). For this aim, mechanical waves were chosen as application subject. Mechanical waves are fundamental topic in physics and teaching this subject important for physics education. The subject of mechanical waves is commonly encountered with its applications in many physics subject at higher physics education particularly, in optics and quantum mechanics. The students to make sense some of the concepts such as reflection, refraction, transmission, phase difference, wave velocity, amplitude, wave velocity and interference related to subject. According to Qiaovu (2002), better learning of these concepts facilitates the learning of upper-level concepts related to wave subjects.
Literature Review
Today, instead of traditional laboratory papers and experiment reports, more comprehensive learning methods and techniques are used. One of these techniques is the V-diagram. The purpose of use of V-diagrams is to help students establish a relationship between concepts and the ways of forming these concepts (Aydoğdu & Kesercioğlu, 2005). V-diagram was first introduced to the related literature on education in 1970s by Gowin and his students in order to understand and structure information better in laboratories. Information is structured by using previous knowledge and making new interpretations thanks to V-diagram, and active interaction of all the elements with each other is put into a scheme. Following the laboratory activities that students carry out and participate in thanks to V-diagrams, they can simultaneously see the relationships between what they already know and the events they have observed. In this way, the information will be recorded regularly, and learning will be more regular and permanent (Novak & Gowin, 1984).
V-diagrams act not only as a report of an experiment but also as a technique that contributes to meaningful learning. While preparing V-diagrams, it will be beneficial if students are prepared for the subject of the experiment and if they use such tools and techniques in the concept part of the diagram as concept maps, concept networks, meaning analysis tables and mind maps. In this way, students will be able to associate the concepts related to the subject before the experiment and learn by doing/experiencing during the experiment. Use of such tools in the concept part of V-diagrams as concept maps, mind maps and meaning analysis tables demonstrates that V-diagrams cover all these materials.
To sum up, V-diagrams are laboratory application and evaluation tools that contribute to the learning activity to demonstrate how to interpret the records obtained during the examination of the theoretical information in laboratories and to help determine and overcome students’ misconceptions.
Novak and Gowin (1977), in their study, first introduced the V-diagram to undergraduate students and faculty members. Following this, they agreed that the V-diagram could be used
Hanife Tekeş, Selahattin Gönen
270
in almost all disciplines (sciences) at universities. The first research on secondary school students was conducted in 1978. The purpose of the study was to help students with the subject of “learning to learn” in sciences. Since then, V-diagrams have been used in most phases of studies conducted at high schools and at universities as a tool that contributes to learning.
In another study, Novak et al. (1983) examined the influence of use of V-diagrams and concept maps in the course of science on 155 secondary school 7th and 8th grade students. In the study, it was reported that especially these tools not only helped cope with the confusion regarding the students’ knowledge and but also helped develop their problem solving skills.
The first written source regarding V-diagrams is the book titled ‘How to learn to learn?’ (Gowin & Novak, 1984). In this book, Gowin presented comprehensive information about V-diagrams. In 1984, when this book, considered as the most basic source, was released, there were a few other studies conducted on this subject.
Another study carried out by Novak (1984) demonstrated how to use concept maps and V-diagrams in teaching chemistry – apart from 7 other items based on Ausubel’s education theory.
Heinze et al. (1984), in their study, claimed that V-diagrams could be used in computer-supported instruction.
In another study conducted with students attending a school of minorities, Lehman et al. (1985) investigated the influence of applications of V-diagrams and concept maps. The researchers put forward the hypothesis that the group which concept maps and V-diagrams were to be applied to would be more successful. However, their study revealed no significant difference between the two groups.
In another study carried out by Germann (1989) based on the research-based instruction and scientific problem-solving method, forming V-diagrams was reported to be a functional and useful learning tool.
Novak continued his research on concept maps and V-diagrams. In one study carried out in 1990, the researcher defined concept maps and V-diagrams as two metacognitive tools and stated that these tools could be used with students ranging from elementary school 1st grade level to university level. In addition, in the study, the psychological and informational qualities of these tools were discussed, and the changes in the students’ attitudes depending on the use of these tools were reported. The study was quite a comprehensive one including 64 references.
In another study carried out by Germann (1991) on the development of scientific process skills, the V-diagram was reported to be one of the effective tools that could be used to develop scientific process skills besides the concept map and background organizers.
Okebukalo (1992) conducted a study to determine chemistry, physics, biology and mathematics teachers’ views about the concept map and V-diagram. The concept map method was found easy by all the teachers participating in the study, while the V-diagram was considered by mathematics teachers to be difficult to learn.
Influence of V-diagrams on 10th-grade Turkish students’ achievement in the subject of mechanical waves
271
Roth and Bowen (1993), in their study on V-diagrams, used sample diagrams to explain the elements of the V-diagram and how to form it. In the study, the researchers mentioned questions which the students would need to complete their studies and which would guide them in the process of discovering the information. They also stated that these questions were necessary to complete the V-diagram and that V-diagrams could help students understand the research process they conducted. In addition, the researchers explained how to use the concept map and V-diagrams.
Roychoudhury and Roth (1993), in their study, concluded that use of concept maps and V-diagrams facilitated the structuring of information. Moreover, they reported that the concept maps and V-diagrams are useful techniques which are compatible with constructive learning and which reveal how information is structured.
In their study, Roth and Verechaka (1993) suggested using Gowin’s traditional V-diagram just like a road map. The researchers pointed out that the V-diagram acts as a tool that determines the direction between the background knowledge and the information to be learnt.
In another study, Nakhleh (1994) searched for various methods to examine how learning occurs in the laboratory. The researcher pointed out that concept maps and V-diagrams were appropriate to this goal and that they were effective tools allowing students to understand the principles related to the lesson subjects and to establish connection between the laboratory applications and what they learnt during the lessons.
Esiobu and Soyibo (1995), in their study, examined the influence of concept maps and V-diagrams on students’ achievements in the genetic and ecology fields within the context of 3 different modes. As a result of this examination, the researchers tried to reveal the influence of concept maps and V-diagrams on instruction depending on cooperative, cooperative-competitive and individual classroom environments. At the end of their study, they found out that the group in the cooperative-competitive classroom environment was the most successful.
Cannon (1996) explored the effects of V-diagrams on teacher candidates’ scientific experiences. In the study, both in and out of the classroom, by having the students carry out scientific activities, they were asked to state their observations using the V-diagram. At the end of the study, it was suggested that V-diagrams could be used as an evaluation tool.
In another study, Leibowitz (1998) pointed out that thanks to V-diagrams; the students were engaged in more thinking and learning compared to the traditional laboratory approach.
Nakiboğlu et al. (2000), in their study, found out that during the preliminary preparation before the laboratory time, V-diagrams encouraged students to research, provided them with a standard for writing reports, led to meaningful and permanent learning and developed their ability to direct questions.
In another comprehensive study, Roehrig et al. (2001) presented the V-diagram as an alternative evaluation tool compared to the traditional laboratory reports. The V-diagram was examined and discussed under 6 different dimensions: 1) Focus question, 2) Word list, 3) Concept map, 4) Events, 5) Data and analysis and 6) Conclusion. The study focused on how and why to use V-diagrams.
Hanife Tekeş, Selahattin Gönen
272
Luft et al. (2001) reported that students using the V-diagram were more successful in such processes as organizing the experiment, analyzing and generalizing the data, stating the results clearly, and thinking and learning.
Tsai et al. (2001) examined how students did their homework based on the V-diagram as the primary activity and then how they evaluated their homework together in class. At the end of their study, the researchers stated that an evaluation tool based on the V-diagram was a method beneficial for pre-service teachers to prepare scientific activities.
Çömlekoğlu and Gür (2002), in their study, reported that there should be all the elements of the V-diagram within a well-prepared structure of information.
In another study, Meriç (2003) emphasized that V-diagrams could become the only tool for instruction and evaluation which could also prevent boring hours of lessons and which could lead to meaningful learning.
Ahlberg et al. (2005), in their 4-year action research on the development of the curriculum for the course of home economics in pre-service teacher training program, used concept maps and V-diagrams for the planning, execution and evaluation of the research process. Consequently, the researchers observed that these were all influential on teacher candidates’ professional development and on their thinking.
Calais (2009) investigated the use of V-diagrams in other fields besides mathematics and science. As a result of the applications, the researcher pointed out that V-diagrams not only helped students to understand and transfer the information but also provided teachers with practical benefits.
In line with the qualitative data obtained in a study conducted by Afamasaga-Fuat’i (2011), the researcher found out that students’ use of such techniques as V-diagrams in learning mathematics, in establishing reason-result relationships and in solving problems led to significant cognitive development. These findings demonstrated that V-diagrams could be applied in secondary and elementary school mathematic courses.
In most studies conducted, it was concluded that students’ preliminary preparation before laboratory applications thanks to V-diagrams contributed to the learning of concepts and helped determine their misconceptions. In addition, studies also revealed that V-diagrams not only developed students’ kinesthetic skills but also structured the theoretical information in their minds while conducting experiments in the laboratory (Tamir, 1989; Roth, 1990; Tiskus, 1992; Passmore, 1998; Nakiboğlu et.al., 2002; Atılboz & Yakışan, 2003; Afamasaga-Fuat’i, 2004; Sarıkaya et.al., 2004; Nakiboğlu & Arık, 2005; Gür & Bütüner, 2006; Tortop et.al., 2007; Çelikler et al., 2008; Demirci & Çınkı, 2009; Al-Zaanen, 2010; Evren & Sülün, 2010; Immonen-Orpana & Ahlberg, 2010; İnce et.al., 2010; Özatlı & Bahar, 2010; Oğraş & Bozkurt, 2011; Özden et al., 2011).
In this study, first, the experimental and control groups were determined, and the experimental group students were informed about V-diagrams. Following this, the experiments chosen regarding the subject of Mechanical Waves in the 10th grade physics course were conducted with V-diagram applications. As a result of these applications, comparison of the changes in the achievements of the students who used the V-diagram with those of the students who used the traditional laboratory method helped examine the influence
Influence of V-diagrams on 10th-grade Turkish students’ achievement in the subject of mechanical waves
273
of V-diagrams on students’ achievements and evaluate the students’ views about these materials.
Methodology
Participants
The participants in the study were 68 tenth grade students attending a high school in the central town of Diyarbakir in the spring term of the academic year of 2010-2011. The students were divided into two different groups as the experimental group (N = 34) and the control group (N = 34). Comparison of the pretest results and the physics mean scores of the students in the first academic term revealed that the two groups were similar.
Data collection tools
As the data collection tools in the present study, an achievement test, a concept test and a questionnaire for the students’ views were used. In order to measure the participants’ academic achievements, an achievement test of 30 multiple-choice questions covering the subjects of the 10th grade Lesson Unit of Waves and a concept test of 20 fill-in-the-blanks and true-false questions were developed. Experts were asked for their views for the development of the achievement test. In line with the experts’ views, the test was finalized, and for reliability studies, the test was applied to a group of 130 students who were taught the lesson unit of Waves. The correlation coefficient calculated with the split-half method of dividing into two equivalent halves was put into the Spearman Brown formula, and the reliability coefficient of the test was found as α = 0.868. For the development of the concept test, a similar way was followed, and the reliability coefficient of the test was calculated as α = 0.752. In addition, in order to determine the experimental group students’ views about V-diagrams following the applications, the ‘V-diagram Student View Questionnaire’ was developed. This questionnaire helped determine whether V-diagrams contributed to the students’ learning and understanding of the physical concepts related to the subject of Waves; whether they enjoyed studying with V-diagrams; and whether they wanted to carry on studying with V-diagrams. The V-diagram Student View Questionnaire included three open-ended questions interrogating the positive and negative views of the students about V-diagrams and 15 propositions with the options of ‘Yes’, ‘Mostly’, ‘Sometimes’ and ‘No’. The Cronbach-alpha value calculated for the 15 Likert-type propositions in the scale was found as 0.90.
Application and data analysis
Before the application, the lesson unit of Waves chosen among the subjects of the 10th grade physics course was analyzed. Considering the subjects envisaged by the Ministry of National Education to be taught in the lesson unit of Waves, the experiments in which V-diagrams would be applied were determined. All the phases of the applications were executed by the physics course teacher within the scope of the same plan and program without ignoring the lesson plan at the same school under the supervision of the researchers. Before the applications, the experimental group students were prepared for the actual application via slides for the use and introduction of V-diagrams and via practical samples. The sample applications were examined and discussed together with the students to find answers to the questions in the students’ minds regarding the parts of V-diagrams to be filled out before and after the experiments. In addition, the students were asked to use a V-diagram for the experiments they conducted regarding the subjects they had previously learnt. In present
Hanife Tekeş, Selahattin Gönen
274
study, the V-diagram format, which was adapted from Roth and Verechaka (1993) was used (See Appendix A). The researchers provided feedback after examining the sample V-diagrams prepared by the students. In this way, the students understood V-diagrams better. Before the applications, first, empty V-diagram paper sheets were given to the experimental group students, and the focus group questions of the V-diagrams for the experiments to be conducted were determined together with the students before the experiments. The students filled out the necessary parts in the diagram before coming to the laboratory and the remaining parts of the diagram during and following the experiment. The example of V-diagram developed by student has been given in Appendix B. As for the control group, the experiments determined were conducted in the laboratory with the usual experiment report method.
The quantitative data in the present study carried out based on the pretest and posttest method were analyzed with SPSS 15.0 package program. For the analysis of the data, percentages, mean scores, dependent and independent groups t-test were used.
Findings
The findings obtained in the study were interpreted and presented in Tables. Before the application, a pretest was used to determine whether the experimental and control groups had similar background knowledge.
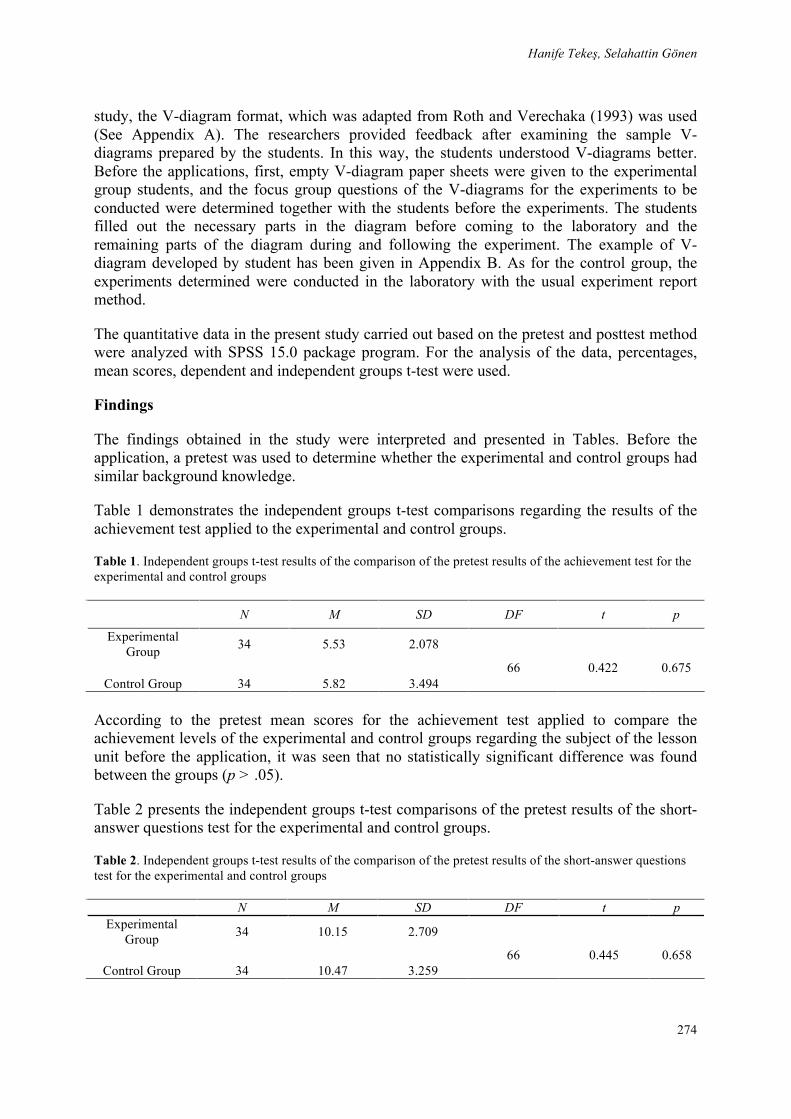
Table 1 demonstrates the independent groups t-test comparisons regarding the results of the achievement test applied to the experimental and control groups.
Table 1. Independent groups t-test results of the comparison of the pretest results of the achievement test for the experimental and control groups
N M SD DF t p
Experimental Group 34 5.53 2.078
66 0.422 0.675 Control Group 34 5.82 3.494
According to the pretest mean scores for the achievement test applied to compare the achievement levels of the experimental and control groups regarding the subject of the lesson unit before the application, it was seen that no statistically significant difference was found between the groups (p > .05).
Table 2 presents the independent groups t-test comparisons of the pretest results of the short-answer questions test for the experimental and control groups.
Table 2. Independent groups t-test results of the comparison of the pretest results of the short-answer questions test for the experimental and control groups
N M SD DF t p Experimental
Group 34 10.15 2.709
66 0.445 0.658 Control Group 34 10.47 3.259
Influence of V-diagrams on 10th-grade Turkish students’ achievement in the subject of mechanical waves
275
According to the pretest mean scores of the Short-answer questions test applied to compare the conceptual achievement levels of the experimental and control groups regarding the subject of the lesson unit before the application, there was no statistically significant difference between the two groups (p > .05).
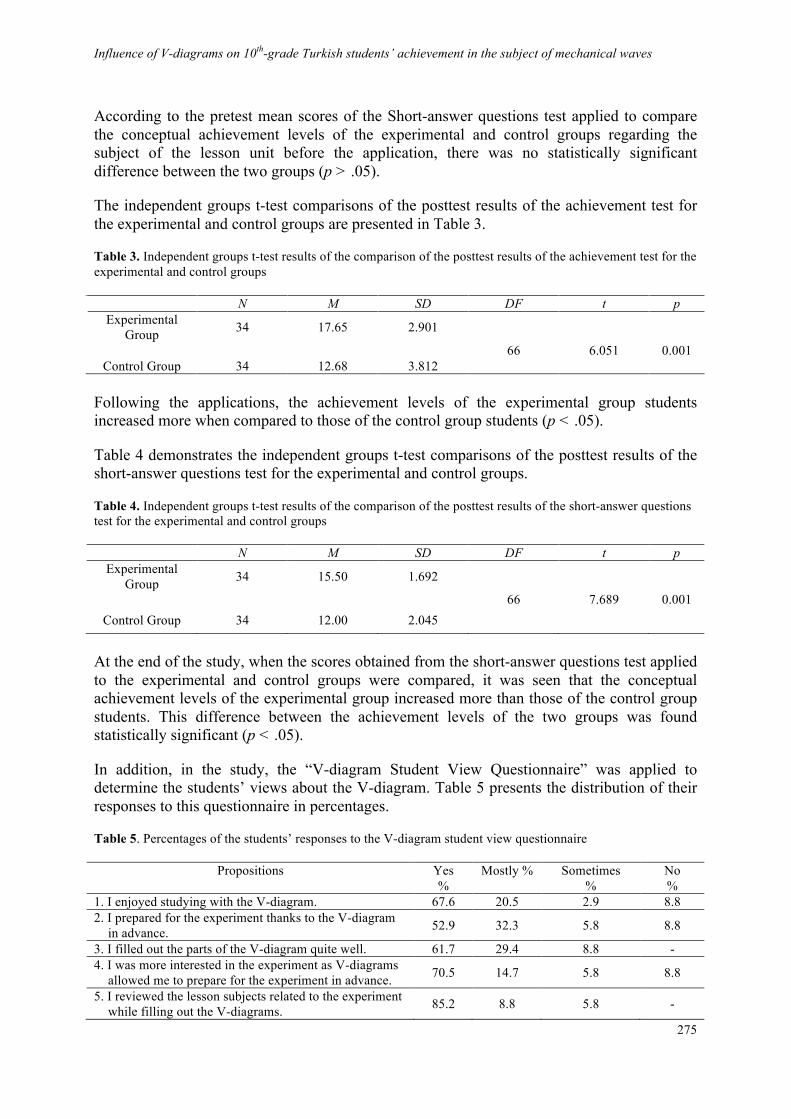
The independent groups t-test comparisons of the posttest results of the achievement test for the experimental and control groups are presented in Table 3.
Table 3. Independent groups t-test results of the comparison of the posttest results of the achievement test for the experimental and control groups
N M SD DF t p Experimental
Group 34 17.65 2.901
66 6.051 0.001 Control Group 34 12.68 3.812
Following the applications, the achievement levels of the experimental group students increased more when compared to those of the control group students (p < .05).
Table 4 demonstrates the independent groups t-test comparisons of the posttest results of the short-answer questions test for the experimental and control groups.
Table 4. Independent groups t-test results of the comparison of the posttest results of the short-answer questions test for the experimental and control groups
N M SD DF t p Experimental
Group 34 15.50 1.692
66 7.689 0.001 Control Group 34 12.00 2.045
At the end of the study, when the scores obtained from the short-answer questions test applied to the experimental and control groups were compared, it was seen that the conceptual achievement levels of the experimental group increased more than those of the control group students. This difference between the achievement levels of the two groups was found statistically significant (p < .05).
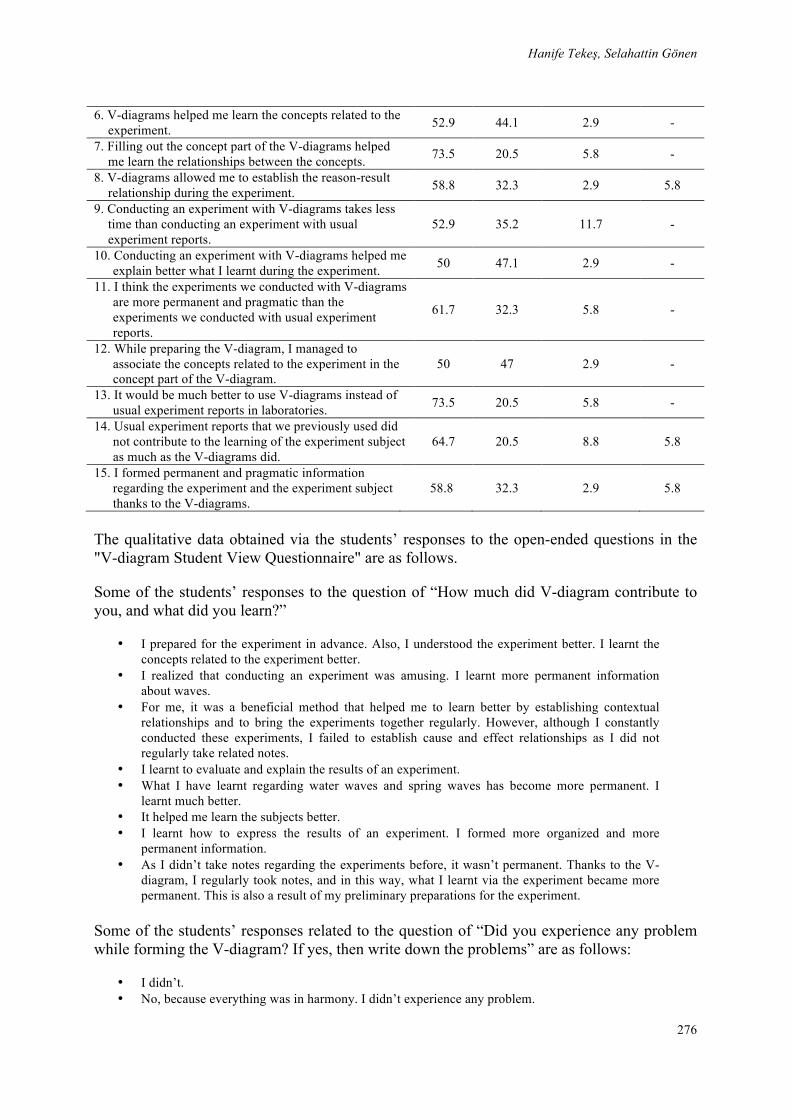
In addition, in the study, the “V-diagram Student View Questionnaire” was applied to determine the students’ views about the V-diagram. Table 5 presents the distribution of their responses to this questionnaire in percentages.
Table 5. Percentages of the students’ responses to the V-diagram student view questionnaire
Propositions Yes %
Mostly % Sometimes %
No %
1. I enjoyed studying with the V-diagram. 67.6 20.5 2.9 8.8 2. I prepared for the experiment thanks to the V-diagram
in advance. 52.9 32.3 5.8 8.8
3. I filled out the parts of the V-diagram quite well. 61.7 29.4 8.8 - 4. I was more interested in the experiment as V-diagrams
allowed me to prepare for the experiment in advance. 70.5 14.7 5.8 8.8
5. I reviewed the lesson subjects related to the experiment while filling out the V-diagrams. 85.2 8.8 5.8 -
Hanife Tekeş, Selahattin Gönen
276
6. V-diagrams helped me learn the concepts related to the experiment. 52.9 44.1 2.9 -
7. Filling out the concept part of the V-diagrams helped me learn the relationships between the concepts. 73.5 20.5 5.8 -
8. V-diagrams allowed me to establish the reason-result relationship during the experiment. 58.8 32.3 2.9 5.8
9. Conducting an experiment with V-diagrams takes less time than conducting an experiment with usual experiment reports.
52.9 35.2 11.7 -
10. Conducting an experiment with V-diagrams helped me explain better what I learnt during the experiment. 50 47.1 2.9 -
11. I think the experiments we conducted with V-diagrams are more permanent and pragmatic than the experiments we conducted with usual experiment reports.
61.7 32.3 5.8 -
12. While preparing the V-diagram, I managed to associate the concepts related to the experiment in the concept part of the V-diagram.
50 47 2.9 -
13. It would be much better to use V-diagrams instead of usual experiment reports in laboratories. 73.5 20.5 5.8 -
14. Usual experiment reports that we previously used did not contribute to the learning of the experiment subject as much as the V-diagrams did.
64.7 20.5 8.8 5.8
15. I formed permanent and pragmatic information regarding the experiment and the experiment subject thanks to the V-diagrams.
58.8 32.3 2.9 5.8
The qualitative data obtained via the students’ responses to the open-ended questions in the "V-diagram Student View Questionnaire" are as follows.
Some of the students’ responses to the question of “How much did V-diagram contribute to you, and what did you learn?”
• I prepared for the experiment in advance. Also, I understood the experiment better. I learnt the concepts related to the experiment better.
• I realized that conducting an experiment was amusing. I learnt more permanent information about waves.
• For me, it was a beneficial method that helped me to learn better by establishing contextual relationships and to bring the experiments together regularly. However, although I constantly conducted these experiments, I failed to establish cause and effect relationships as I did not regularly take related notes.
• I learnt to evaluate and explain the results of an experiment. • What I have learnt regarding water waves and spring waves has become more permanent. I
learnt much better. • It helped me learn the subjects better. • I learnt how to express the results of an experiment. I formed more organized and more
permanent information. • As I didn’t take notes regarding the experiments before, it wasn’t permanent. Thanks to the V-
diagram, I regularly took notes, and in this way, what I learnt via the experiment became more permanent. This is also a result of my preliminary preparations for the experiment.
Some of the students’ responses related to the question of “Did you experience any problem while forming the V-diagram? If yes, then write down the problems” are as follows:
• I didn’t. • No, because everything was in harmony. I didn’t experience any problem.
Influence of V-diagrams on 10th-grade Turkish students’ achievement in the subject of mechanical waves
277
• I had difficulty taking notes while simultaneously conducting the experiment. • While our teacher was introducing the V-diagram to us, I felt a little frustrated thinking that it
would be a little difficult for me. But, with some sample V-diagrams that our teacher made us form, I didn’t experience any difficulty.
• No, because I didn’t have any question left in my mind. • Yes, because I didn’t understand the experiment fully and because the time was limited, I
couldn’t do it at all. • No, I didn’t because I was able to observe the results with the experiment. • I had difficulty understanding how to conduct the experiment, but thanks to our teacher’s help, I
could complete all the parts. Below are the students’ responses to the question of what do you think about the contributions of V-diagrams to learning?
• To me, it is quite a good method. It makes your knowledge permanent and helps you learn better. It will also be beneficial as it will not only help establish reason and result relationships between experiments but also make it easier to remember them in future.
• V-diagrams were good for me. I don’t have any negative thoughts about them. • I don’t have any negative views about it. The experiment made it more permanent in our minds. • It facilitates learning. • The V-diagram was quite a good experiment for us. It set a good example for our future experiments. • The V-diagram helped me understand the subject fully. • To me, it was very good and facilitated understanding. • Associating the concepts with each other during the experiment helped me learn the subject-
related concepts quite well. I don’t have any negative views about it. • It doesn’t have any permanent effect, but it just helps during the experiment. It doesn’t take
much time. • It helped me understand the subject better.
Depending on the data obtained from the students and the experiences gained in the laboratory during the application, the students’ views about V-diagrams could be gathered under the following themes:
• Appreciating the technique. • Enjoying conducting experiments in the laboratory and writing down the experiment reports. • Preparing for the experiment in advance. • Learning permanently both the concepts related to the experiment conducted and the
relationships in-between. • Resulting in more organized and effective learning in a shorter time when compared to
the usual experiment report method. Discussion and Conclusion
Usual experiment reports are not effective enough for students to develop such scientific process skills as planning the experiments, making observations, measurement and drawing conclusions. Usual experiment reports include certain phases such as the purpose of an experiment, conducting the experiment and recording the data obtained. As these reports do not consist of the parts that require both interpreting the results of an experiment and drawing basic conclusions, students fail to think about that experiment in detail. This situation causes students to learn the information superficially and thus influences their achievement negatively (Sarıkaya et al., 2004).
In this respect, V-diagrams are more organized and systematic than usual experiment reports since students themselves, under the guidance of their teacher or other students, determine why the experiment or the research will be conducted. This allows students to embrace the
Hanife Tekeş, Selahattin Gönen
278
experiment and to do preliminary preparation and research. One of the most important parts of a V-diagram is the part of concepts found in the conceptual part of the V-diagram that students will fill out while preparing in advance. It is also important to benefit from different instructional methods and techniques such as the concept map and the meaning/content analysis table while filling out this part. When students explain the concepts by using the concept map or the meaning analysis table, this will allow determining their level of knowledge about the relationships between concepts. In this way, it will be possible to overcome any mistakes or deficiencies in students’ knowledge about concepts under the guidance of the teacher. From this perspective, Meriç (2003) finds it necessary to involve this technique in courses or research since the researcher believes that the V-diagram helps to teach concepts and to determine and overcome misconceptions and problems. In addition, Passmore (1998) reported that students using concept maps and V-diagrams develop their metacognitive thinking strategies, learn the information meaningfully examining its conceptual, relational and hierarchical structure and nature and decrease their misconceptions. In terms of physics teaching, it is important to determine and overcome the misconceptions that make physics teaching difficult with appropriate methods and techniques. In this study, it was seen that the students had certain misconceptions not only about the fact that wave motion is transmitted not with vibration but with the substance but also about how the speed of water waves changes depending on the depth and shallowness. The misconceptions determined while examining the V-diagrams prepared by the experimental group students were overcome thanks to the instant interrogations, explanations and guidance of the teacher.
In order to determine and overcome misconceptions immediately, the teacher is supposed to benefit from the studies on misconceptions related to the subject in literature. When teachers do so, they will have opportunities to develop more methods to achieve conceptual change. Such preparations will contribute positively to the professional development of the teacher.
Considering all these features of V-diagrams, it could be stated that they allow developing students’ knowledge in a meaningful and organized manner. In this respect, it is seen that usual experiment reports are quite insufficient when compared with V-diagrams. Usual experiment reports help students only during the experiment. However, V-diagrams both push students to research before the experiment and help them work in cooperation during the experiment. In this way, they can synthesize the information cooperatively and experience the feeling of achievement. In this respect, V-diagrams are reported by Luft et al. (2001) to be a tool that helps create more effective and student-centered laboratory reports. In order to test these advantages of V-diagrams as reported in related literature, the 10th grade lesson unit of waves was chosen as the focus of the present study because the lesson unit was taught at the end of the academic term and because most of the subjects included in the lesson unit were difficult for students to fully understand.
V-diagrams help students organize their knowledge. It was also reported by Roychoudhury and Roth (1993) that V-diagrams are appropriate to the nature of the constructive approach and have a key role in helping students organize their knowledge. In addition, depending on the students’ responses to the propositions found in the V-diagram Student View Questionnaire applied to the experimental group students, it could be stated that the students enjoyed studying with V-diagrams and increased their knowledge in a more meaningful and organized manner by identifying the relationships between the concepts especially while placing the concepts in the diagram (Table 5).
Influence of V-diagrams on 10th-grade Turkish students’ achievement in the subject of mechanical waves
279
When the experiences gained via the present study and the results obtained by other researchers are taken into consideration, it is seen that V-diagrams could be used in almost all learning levels. In addition, based on the structure, goals and gains of V-diagrams, it could be stated that they support the activities found in physics curriculum (Passmore, 1998; Nakleh, 1994; Immonen-Orpana & Calais, 2009; Åhlberg, 2010; Afamasaga-Fuat’i, 2011). Moreover, depending not only on the results obtained via the achievement and concept tests but also on the participants’ responses to the opinion questionnaire, V-diagrams can be said to contribute to the development of students’ skills such as problem solving, critical thinking and establishing cause and effect relationships. The results obtained in the present study are also consistent with those of another study conducted by Afamasaga-Fuat’i (2011).
V-diagrams used as a technique for learning purposes motivate students prior to the experiment and encourages them to research and work in groups cooperatively. It was also reported by Immonen-Orpana and Ahlberg (2010) that V-diagrams lead to a higher level of achievement with groups involving active application of the cooperative learning method when compared to the groups involving individual work.
In addition, students’ preliminary preparations for an experiment allow them to focus more on the subject during the application and to make them ready for learning. Thanks to V-diagrams, the information acquired following the laboratory activities will be restated in a more organized manner; as a result, students develop their knowledge in a permanent, organized and meaningful way. Nakiboğlu et. al. (2000) pointed out that during preliminary preparations before the laboratory application, V-diagrams urge students to research, provide a standard for preparing a report, help students understand the subject better by developing their questioning skills and improve their discussion skills by allowing them to take part in group work. In addition, when, following the experiment, students restate the experimental assertions found in the methodology part of the V-diagram, they will have a higher level of confidence in their new knowledge.
Consequently, use of V-diagrams in teaching contributes to students’ meaningful learning and increases their achievements in learning. Therefore, laboratory lessons play an important role in helping students acquire such skills as conducting research, problem solving, doing observations and establishing relationships between variables. In order to use laboratories as a real learning environment and to escape from the parrot-fashion of traditional methods, it is necessary to benefit from such learning techniques as V-diagrams. Özer (2002) states that students from different class grades need different learning techniques and tools. Depending on the current experiences gained in the application process and on the findings obtained in the study, the following suggestions could be put forward:
• Before starting with the laboratory applications, the V-diagram technique should be introduced effectively to the students in detail. For instance, sample activities should be organized to increase the comprehensibility of the V-diagram, and students’ wrong or imperfect knowledge should be corrected by asking them to form the V-diagram and to explain the experiments they have not conducted before.
• In the preliminary preparation phase, which is the most important step in preparing the V-diagram, the conceptual part should be filled out by the students themselves before the experiment.
• While students are filling out the concepts part, one of the parts of the V-diagram, they should be encouraged to fill out a concept map by means of which they can express
Hanife Tekeş, Selahattin Gönen
280
the concepts by associating them with each other. In this way, any misconceptions of students can be identified and overcome.
• Teacher candidates attending the departments of physics, chemistry and biology in education faculties should be informed about V-diagrams as a laboratory technique, and in this respect, laboratory activities and experiments should be carried out by using this technique.
• Instead of usual experiment reports, use of the V-diagram technique should be promoted in laboratory applications related to physics lessons.
References
Afamasaga, K. (2004). An undergraduate students understanding of differential equations through concept maps and Vee diagrams. First International Conference on Concept Mapping, Pamplona. Spain.
Afamasaga-Fuat’i, K. (2011). Students’ attitudes and problem solving with Vee diagrams. The Assessment Handbook, 5, 1-20.
Ahlberg, M., Aanismaa, P., & Dillon, P. (2005). Education for sustainable living: integrating theory, practice, design and development. Scandinavian Journal of Educational Research, 49(2), 167-186.
Algan, Ş. (1999). Laboratuar destekli fizik öğretiminin öğrenci başarısına etkisi ve 1962-1985 yılları arasında Türkiye’de uygulanan modern matematik ve fen programları [Effects of laboratory aided physics teaching on student achievement and modern mathematics and science programs applied between the years of 1962-1985 in Turkey]. Unpublished Master Thesis, Gazi Üniversitesi, Ankara.
Al-Zaanen, J. (2010). The impact of (v) diagram and experiment demonstration strategies on practical performance for the 8th grade students and their acquisition of cognitive skills which implemented in the international (TIMSS) tests in Gaza Strip. An-Najah University Journal for Research –Humanities, 24(8), 2289-2310.
Atılboz, N.G., & Yakışan, M. (2003). V-diyagramlarının genel biyoloji laboratuarı konularını öğrenme başarısı üzerine etkisi: canlı dokularda enzimler ve enzim aktivitesini etkileyen faktörler [The effect of v-diagrams on the learning of biology laboratory subject matters: enzymes on living tissues and the factors affecting activity of enzymes]. Hacettepe Üniversitesi Eğitim Fakültesi Dergisi, 25, 8-13.
Aydoğdu, M., & Kesercioğlu, T. (2005). İlköğretimde fen ve teknoloji öğretimi [Teaching science and technology in primary school]. Ankara, Anı Yayıncılık.
Calais, G.J. (2009). The Vee diagrams as a problem solving strategy: content area reading/writing implications. National Forum Teacher Education Journal, 19(3), 1-8.
Cannon, J.R. (1996). Extra credit, extra science. Science and Children, 34(1), 38-40. Çelikler, D., Güneş, M.H., Güneş,T., & Şendil, K. (2008). V-diyagramı uygulamalarının
temel kimya laboratuarı dersinde öğrenci başarısına etkisi [The effect of using v diagrams on the achievement of student in basic chemistry laboratory courses]. Ahi Evran Üniversitesi Kırşehir Eğitim Fakültesi Dergisi, 9(2), 51-58.
Çömlekoğlu, G., & Gür, H. (2001). Ortaöğretim matematik eğitiminde Vee diyagramları’nın değerlendirme aracı olarak kullanımı [Using Vee diagrams’ as an assessment tool in secondary mathematics education]. X. Ulusal Eğitim Bilimleri Kongresi Bildiriler Kitabı, 2, 653-659, Abant İzzet Baysal Üniversitesi, Bolu.
Demirci, N., & Çınkı, A. (2009). V-diyagramları kullanımının ilköğretim 6. Sınıf öğrencilerinin fen deneylerindeki başarılarına etkisi [The effect of v-diagrams on sixth
Influence of V-diagrams on 10th-grade Turkish students’ achievement in the subject of mechanical waves
281
grade primary school students’ achievements in science experiments]. Ondokuz Mayıs Üniversitesi Eğitim Fakültesi Dergisi, 28, 23-36.
Esiobu, G.O., & Soyibo, K. (1995). Effects of concept and Vee mappings under three learning modes on students' cognitive achievement in ecology and genetics. Journal of Research in Science Teaching, 32(9), 971-995.
Evren, A., & Sülün, Y. (2010). The effect of teaching animal physiology though “V-diagrams” on students’ success and retention level. Procedia Social and Behavioral Sciences, 2(2), 4285-4292.
Germann, P.J. (1989). Directed inquiry approach to learning science process skills: treatment effect and aptitude -treatment. Journal of Research in Science Teaching, 26(3), 237-250.
Germann, P.J. (1991). Developing science process skills through directed inquiry. American Biology Teacher, 53(4), 243-247.
Gowin, D.B., & Novak, J.D. (1984). Learning how to learn?. Cambridge University Press. Gür, H., & Bütüner, S.Ö. (2006). “Vee diagramı” [Vee diagram]. İstek Vakfı Okulları Fen ve
Matematik Öğretmenleri 2. Sempozyumu, 8 Nisan, İstanbul. Heinze-Fry, J.A., Crovello, T.J., & Novak, J.D. (1984). Integration of ausubelian learning
theory and educational computing. American Biology Teacher, 46(3), 152-156. Hoffstein, A., & Lunetta, V.N. (1982). The role of the laboratory in science teaching:
neglected aspects of research. Review of Educational Research, 52(2), 201-217. Immonen-Orpana, P., & Åhlberg, M. (2010). Collaborative learning by developing (lbd)
using concept maps and Vee diagrams. In Torres, P., Marriott, R. (Eds.) Handbook of Research on Collaborative Learning Using Concept Mapping. Hershey, NY: IGI Global, 215-235.
İnce E., Güven E., & Aydoğdu M. (2010). Fen bilgisi laboratuar uygulamaları dersinde kavram haritası ve v-diyagramının akademik başarı ve kalıcılığa etkisi [The effect of concept map and v-diagram on the academic achievement and permanence in science laboratory lesson]. Ç.Ü. Sosyal Bilimler Enstitüsü Dergisi, 19(2), 378-394.
Lehman, J.D., Carter, C., & Kahle, J.B. (1985). Concept mapping, Vee mapping, and achievement: results of a field study with black high school students. Journal of Research in Science Teaching, 22(7), 663-673.
Leibowitz, S.J. (1998). Use of Vee maps in a college science laboratory. University of Arizona, Paper Presented at the Annual Meeting of the National Association for Research in Science Teaching (NARST). San Diego, CA, 19-22.
Luft, J.A., Tollefson, S.J., & Roehrig, G.H. (2001). Using an alternative report format in undergraduate hydrology laboratories. Journal of Geoscience Education, 49(5), 454-460.
Meriç, G. (2003). bir değerlendirme ve laboratuar aracı olarak v-diyagramı’nın tarihi, kullanımı ve fen eğitimine sağlayacağı katkılar üzerine bir inceleme [A study on v-diagrams history, usage and its contributions to the science education as an assesment and laboratory tool]. Pamukkale Üniversitesi Eğitim Fakültesi Dergisi, 13(1), 136-149.
Nakhleh, M.B. (1994). Chemical education research in the laboratory environment. Journal of Chemical Education, 71(3), 201-205.
Nakiboğlu, C., & Meriç, G. (2000). Genel kimya laboratuarlarında v-diyagramı kullanımı ve uygulamaları [Use of v-diagrams in general chemistry laboratory and their applications]. Balıkesir Üniversitesi Fen Bilimleri Enstitüsü Dergisi, 2(1), 58-75.
Nakiboğlu, C., & Sarıkaya, Ş. (2000). Kimya öğretmenlerinin derslerinde laboratuar kullanmalarına mezun oldukları programın etkisi [The effect of graduated programs on chemistry teachers’ laboratory usage]. Kastamonu Eğitim Dergisi, 8(1), 95-106.
Nakiboğlu, C., & Özkılıç, A.R. (2005). 4. sınıf öğrencilerinin “gazlar” ile ilgili kavram yanılgılarının v-diyagramı kullanılarak belirlenmesi [Determination of the 4th grade
Hanife Tekeş, Selahattin Gönen
282
students misconceptions related to gases]. Yeditepe Üniversitesi Eğitim Fakültesi Dergisi, İstek Vakfı Okulları I. Fen ve Matematik Öğretmenleri Sempozyum Özel Sayısı, 1(2), 1-17.
Novak, J.D. (1977). A theory of education. Ithaca, NY: Cornell University Press. Novak, J.D., Gowin B., Johansen, T. (1983). The use of concept mapping and knowledge Vee
mapping with junior high school science students. Science Education, 67(5), 625-645. Novak, J.D. (1984). Application of advances in learning theory and philosophy of science to
the improvement of chemistry teaching. Journal of Chemical Education, 61(7), 607-612. Oğraş, A., & Bozkurt, A. (2011). Kavram haritası ve Vee diyagramı kullanımının ilköğretim
7. sınıf matematik eğitiminde öğrenci başarısına etkisi [The effect of using concept mapping and v-diagrams in primary school grade 7 mathematics course upon student success]. Gümüşhane Üniversitesi Sosyal Bilimler Enstitüsü Dergisi, 2(3), 1-13.
Okebukola, P. (1992). Attitude of teachers towards consept maping and Vee diagramming as metalearning tools in science and mathematics. Educational Research, 34(3), 201-213.
Özatlı, N. S., & Bahar, M. (2010). Öğrencilerin boşaltım sistemi konusundaki bilişsel yapılarının yeni teknikler ile ortaya konması [Revealing students’ cognitive structures regarding excretory system by new techniques]. Abant İzzet Baysal Üniversitesi Dergisi, 10(2), 9-26.
Özden, M., Akdağ, G., & Açıkgül, E. (2011). V-diyagramı uygulamalarının öğretmen adaylarının bilimsel süreç becerilerine ve laboratuara ilişkin tutumlarına etkisi [The effects of v-diagrams on the pre-service teachers’ scientific process skills and attitudes towards laboratory]. Atatürk Üniversitesi Kazım Karabekir Eğitim Fakültesi II. Ulusal Kimya Eğitimi Kongresi, Erzurum.
Özer, B. (2002). İlköğretim ve ortaöğretim okullarının eğitim programlarında öğrenme stratejileri [Primary and secondary schools educational programs learning strategies]. Eğitim Bilimleri ve Uygulama Dergisi, 1(1), 17-32.
Passmore, G. (1998). Using Vee diagrams to facilitate meaningful learning and misconception. Radiological Science and Education, 4(1), 11-28.
Qiaovu, L. (2002). Examining the effectiveness of interactivity in a 3-dimensional web based tutorial on interference phenomenon (master thesis, mississippi state university). Retrieved From ProQuest Dissertations & Theses. (AAT 1418231).
Roehrig, G., Luft, V.A., & Edwards, M. (2001). Versatile Vee maps. The Science Teacher, 68(1), 28-31.
Roth, W.M. (1990). Map your way to a better lab. The Science Teacher, 57(4), 30-34. Roth, W.M., Verechaka, G. (1993). Plotting a course with Vee maps: direct your students on
the road to inquiry science. Science and Children, 30(4), 24-27. Roth, W. M., Bowen, M. (1993). The unfolding Vee. Science Scope; 16 (5), 28-32. Roth, M.W., & Roychoudhury, A. (1993). Using Vee and concept maps in collaborative
settings: elementary education majors construct meaning in physical science courses. School Science and Mathematics, 93(5), 237-245.
Sarıkaya, R., Selvi, M., Selvi, M., & Yakışan, M. (2004). V-diyagramları’nın hayvan fizyolojisi laboratuarı konularını öğrenme başarısı üzerine etkisi [The effects of v-diagrams on learning achievement of the animal physiology laboratory topics]. G.Ü. Gazi Eğitim Fakültesi Dergisi, 24(3), 341-347.
Tamir, P. (1977). How are the laboratories used?. Journal of Research in Science Teaching, 14(4), 311-316.
Tiskus, P.J. (1992). Secondary students’ conceptual understanding in the chemistry laboratory. Retrieved April (1993) From Proquest Database, 540(7), 613.
Tortop, H.S., Çiçek Bezir, N., Uzunkavak, M., & Özek, N. (2007). Dalgalar laboratuarında, kavram yanılgılarını belirlemek için v-diyagramları’nın kullanımı ve derse karşı
Influence of V-diagrams on 10th-grade Turkish students’ achievement in the subject of mechanical waves
283
geliştirilen tutuma olan etkisi [Using v-diagrams to determine the misconceptions in waves laboratory and the effects of the developing attitude towards the course]. Süleyman Demirel Üniversitesi, Fen Bilimleri Enstitüsü Dergisi, 11(2), 110-115.
Tsai, C., Liu, E., Zhi-Feng, L., Sunny, S.J., & Yuan, S.M. (2001). A networked peer assessment system based on a Vee heuristic. Innovations in Education and Teaching International, 38(3), 220-230.
Appendixes
Appendix A: How to form the V-diagram?
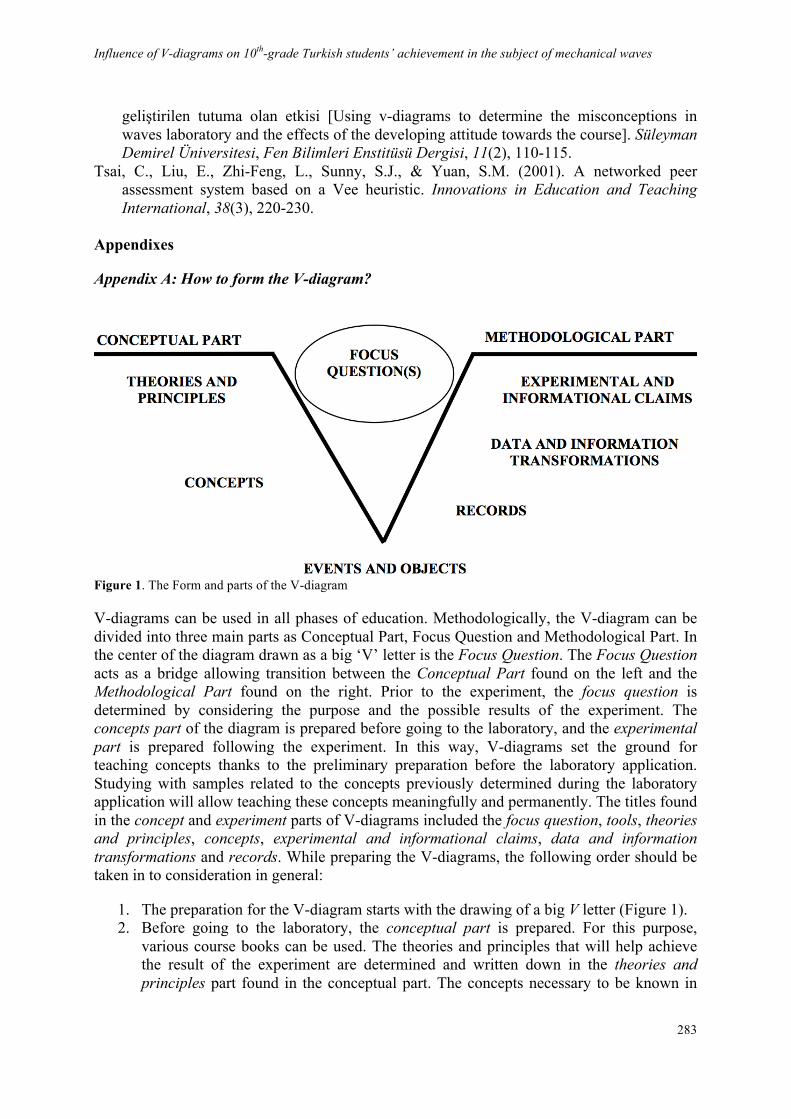
Figure 1. The Form and parts of the V-diagram
V-diagrams can be used in all phases of education. Methodologically, the V-diagram can be divided into three main parts as Conceptual Part, Focus Question and Methodological Part. In the center of the diagram drawn as a big ‘V’ letter is the Focus Question. The Focus Question acts as a bridge allowing transition between the Conceptual Part found on the left and the Methodological Part found on the right. Prior to the experiment, the focus question is determined by considering the purpose and the possible results of the experiment. The concepts part of the diagram is prepared before going to the laboratory, and the experimental part is prepared following the experiment. In this way, V-diagrams set the ground for teaching concepts thanks to the preliminary preparation before the laboratory application. Studying with samples related to the concepts previously determined during the laboratory application will allow teaching these concepts meaningfully and permanently. The titles found in the concept and experiment parts of V-diagrams included the focus question, tools, theories and principles, concepts, experimental and informational claims, data and information transformations and records. While preparing the V-diagrams, the following order should be taken in to consideration in general:
1. The preparation for the V-diagram starts with the drawing of a big V letter (Figure 1). 2. Before going to the laboratory, the conceptual part is prepared. For this purpose,
various course books can be used. The theories and principles that will help achieve the result of the experiment are determined and written down in the theories and principles part found in the conceptual part. The concepts necessary to be known in
Hanife Tekeş, Selahattin Gönen
284
this experiment can be written down in order under the concepts part with the help of such materials as the concept map.
3. Again prior to the experiment, the focus question is determined considering the purpose and the gains of the experiment (there could be two focus questions at most). The focus question is determined by the teacher at elementary school level, while at high schools, students determine it under the guidance of the teacher. As for the university, students themselves determine the focus question.
4. Prior to the experiment, the events and objects to be used in the experiment are written down in the related part in the diagram, which is at the bottom of the V letter.
5. The experiment is conducted, and all the measurements, observations and results during the experiment are written down in the records part of the diagram.
6. The records, comparisons, differences, tables, graphics and drawings are reorganized as appropriate to the experiment. The assumptions, limitations and issues considered important during the experiment are determined, if any, for the experiment. The version of these records and information reorganized as appropriate to the experiment is written down in the data and information part of the diagram.
7. Both the results experimentally obtained using the transformations of the data and the interpretations regarding these results are written down in the experimental claims part.
8. By explaining the experimental claims in general via the principles and theories in the concept part or by suggesting new questions that will lead to new research and claims, the informational claims are put forward and written down in the related part of the diagram. However, in some experiments, the experimental claims may not respond to the focus questions. These claims should be consistent with the conceptual and methodological information that guides the focus question.
Influence of V-diagrams on 10th-grade Turkish students’ achievement in the subject of mechanical waves
285
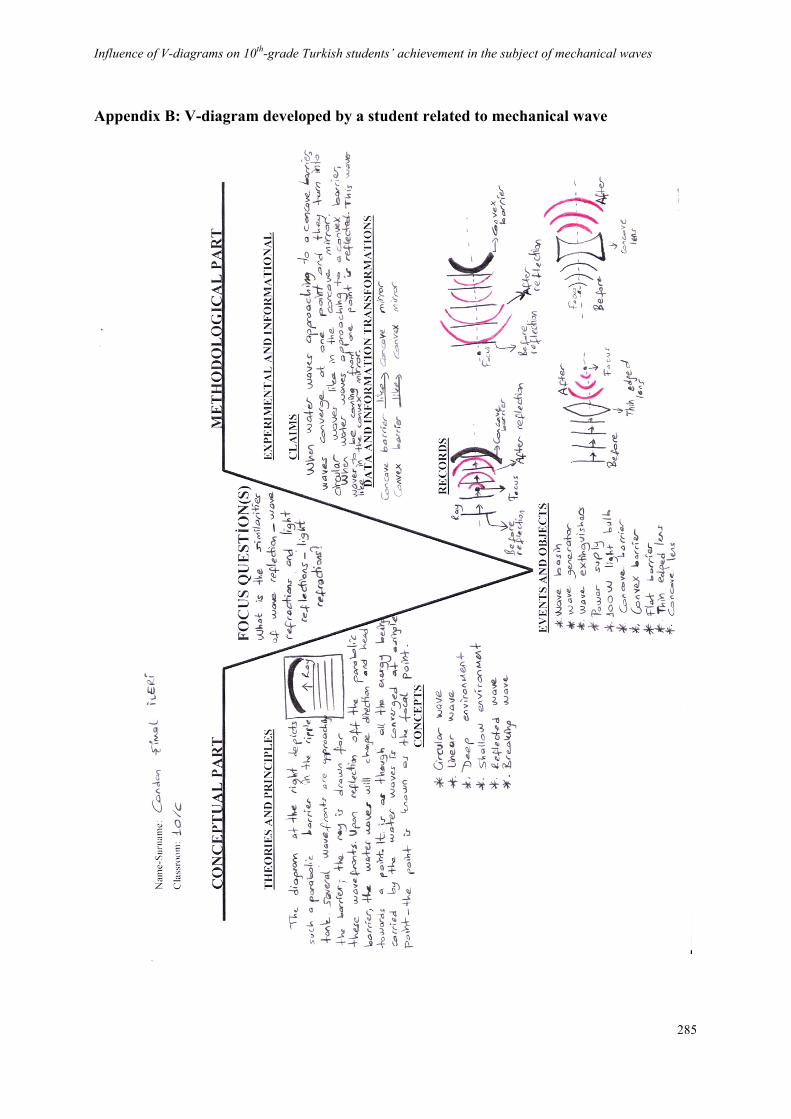
Appendix B: V-diagram developed by a student related to mechanical wave