Embed Size (px)
Citation preview
Research ArticleInfluence of Vitamin D Binding Protein on Accuracy of25-Hydroxyvitamin D Measurement Using the ADVIA CentaurVitamin D Total Assay
James Freeman, Kimberly Wilson, Ryan Spears, Victoria Shalhoub, and Paul Sibley
Siemens Healthcare Diagnostics, 511 Benedict Avenue, Tarrytown, NY 10591, USA
Correspondence should be addressed to James Freeman; [email protected]
Received 13 December 2013; Revised 7 April 2014; Accepted 28 April 2014; Published 19 June 2014
Academic Editor: Arthur Santora
Copyright © 2014 James Freeman et al.This is an open access article distributed under the Creative Commons Attribution License,which permits unrestricted use, distribution, and reproduction in any medium, provided the original work is properly cited.
Vitamin D status in different populations relies on accurate measurement of total serum 25-hydroxyvitamin D [25(OH)D]concentrations [i.e., 25(OH)D
3and 25(OH)D
2]. This study evaluated agreement between the ADVIA Centaur Vitamin D Total
assay for 25(OH)D testing (traceable to the NIST-Ghent reference method procedure) and a liquid chromatography tandem massspectrometry (LC-MS/MS) method for various populations with different levels of vitamin D binding protein (DBP). Total serum25(OH)D concentrations were measured for 36 pregnant women, 40 hemodialysis patients, and 30 samples (DBP-spiked or not)from healthy subjects. ELISA measured DBP levels. The mean serum DBP concentrations were higher for pregnancy (415𝜇g/mL)and lower for hemodialysis subjects (198𝜇g/mL) than for healthy subjects and were highest for spiked serum (545𝜇g/mL). Theaverage bias between the ADVIA Centaur assay and the LC-MS/MS method was −1.4% (healthy), −6.1% (pregnancy), and 4.4%(hemodialysis).The slightly greater bias for samples from some pregnancy and hemodialysis subjects with serumDBP levels outsideof the normal healthy range fell within a clinically acceptable range—reflected by analysis of their low-range (≤136 𝜇g/mL),medium-range (137–559 𝜇g/mL), and high-range (≥560𝜇g/mL) DBP groups.Thus, the ADVIACentaur Vitamin D Total assay demonstratesacceptable performance compared with an LC-MS/MS method for populations containing different amounts of DBP.
1. Introduction
Increasing awareness of the important role of vitaminD for bone and other diseases has led to increased 25-hydroxyvitamin D [25(OH)D] testing (D represents D
3
and D2forms). However, variability within and between
methods and laboratories has often compromised correctdiagnosis and the ability to compare results from differentstudies and national surveys [1–5]. Automated antibody-based, radioimmunoassays, high performance liquid chro-matography (HPLC), and mass spectrometry methods for25(OH)D testing are subject to variability issues that can arisefrom a variety of sources, such as differential detection ofthe D
3and D
2forms, interference by detection polyclonal
antibodies, and nonspecific detection of other vitamin Dmetabolites such as the 3-epimer form of 25(OH)D [3-epi-25(OH)D] and 24,25(OH)
2D3. In addition, incomplete
release of 25(OH)D from the vitamin D binding protein
(DBP) has been identified as a potential source of variabilityfor both manual and automated immunoassays [6].
Establishing an immunoassay for 25(OH)D is challengingbecause the majority of the highly hydrophobic 25(OH)Dis tightly bound (dissociation constant, Kd, 5 × 10⁻⁸M) toa vast excess of DBP from which it must be separated;almost no 25(OH)D is found “free” (non-protein bound)in the circulation, and less than 5% of the available DBPbinding sites are occupied by vitamin D compounds [7]. Inaddition, DBP binds vitaminD
3along with othermetabolites
and vitamin D2, whose similar structures may be easier to
release from DBP and difficult to differentiate; DBP has ahigher affinity for vitamin D
3than other metabolites and
vitamin D2[8]; and generating specific antibodies against
small antigenic molecules, such as 25(OH)D, is difficult,but it is mandatory because the Vitamin D StandardizationProgram (VDSP) states that 25(OH)D assays shouldmeasure
Hindawi Publishing CorporationInternational Journal of EndocrinologyVolume 2014, Article ID 691679, 12 pageshttp://dx.doi.org/10.1155/2014/691679
2 International Journal of Endocrinology
equimolar amounts of 25(OH)D3and 25(OH)D
2(total vita-
min D) [9]. Measuring total vitamin D is required becausesome supplements contain the D
2form, and not measuring
D2would lead to lower 25(OH)D values. In methods such
as radioimmunoassay, HPLC, and mass spectrometry, aninitial extraction step with organic solvents releases all bound25(OH)D from DBP [10–13]. However, organic solvents arenot compatible with most automated immunoassays, andalternative releasing agents, which are proprietary, are usedinstead. Recent studies performed in populations with differ-ent levels of DBP have questioned the effectiveness of theseproprietary releasing agents to completely free 25(OH)Dfrom DBP [6].
The goal of this study was to examine the ability of theADVIA Centaur Vitamin D Total assay by comparison withan LC-MS/MSmethod to accuratelymeasure 25(OH)D levelsin serum samples from healthy adults (endogenous) andhealthy adults with exogenous DBP (endogenous + spiked)and from pregnant women and chronic kidney disease(CKD) patients receiving dialysis, who have higher and lowerthan normal serum levels of DBP, respectively [7, 14, 15].The ADVIA Centaur Vitamin D Total assay is traceable tothe NIST-Ghent reference measurement procedure (RMP)for vitamin D testing. (This version of the ADVIA CentaurVitaminDTotal assay is not currently available commerciallyin all regions, including the USA.)
2. Materials and Methods
In order to determine the influence of DBP on a vitaminD immunoassay, a study examining DBP as an endogenousinterference, similar to how hemoglobin, cholesterol, or totalprotein would be measured, following Clinical and Labora-tory Standards Institute (CLSI) Document EP7-A2 [16] wasperformed at the Siemens R&D facility in Tarrytown, NY,USA. Human native DBP (>95% pure) was purchased fromAthens Research & Technology, Inc.
2.1. LC-MS/MS. The LC-MS/MS method used in this studyis traceable to the Esoterix ID-LC-MS/MS method, whichis traceable to NIST. The LC-MS/MS method performed atSiemens used the Waters Acquity H-class ultrahigh perfor-mance liquid chromatography (UPLC) and triple quadrupole(TQD) tandem mass spectroscopy (MS) with MassLynx andQuanLynx software (Waters Acquity TQD system, WatersCorporation, Manchester, UK). This method is able to sep-arate, identify, and separately quantify the concentrations of25(OH)D
2, 25(OH)D
3, and 3-epi-25(OH)D
3in a serum sam-
ple. As reported by themanufacturer, the LC-MS/MSmethoddemonstrated a dynamic assay range of 2.5–220 ng/mL (6.25–550 nmol/L) (𝑟2 > 0.997). Three levels of 25(OH)D
2and
25(OH)D3concentrations tested over five consecutive days
yielded intra-assay coefficients of variation (CVs) of ≤7.7%and interassay precision CVs of <12% for 25(OH)D
2and
25(OH)D3.
2.2. ADVIA Centaur Vitamin D Total Assay. The ADVIACentaur Vitamin D Total assay used in this study is traceable
to the Ghent University ID-LC-MS/MS 25(OH)DRMP. (Thisversion of the assay is not currently available commerciallyin all regions, including the USA.) The Ghent University is areference laboratory for the Vitamin D Standardization Pro-gram (VDSP).The sample reference material (SRM) used forthe Ghent University method is traceable to the NIST SRM2972 [4, 9, 17]. Recently, Siemens received confirmation fromthe Centers for Disease Control and Prevention (CDC) thatthe ADVIA Centaur Vitamin D Total assay is now a certifiedprocedure of the Vitamin D Standardization-CertificationProgram (VDSCP). Certification was achieved by demon-strating that the total vitamin D [25(OH)D] results for the40 VDSCP samples (10 quarterly challenges) agreed with theresults from the ID-LC-MS/MS RMP method. The ADVIACentaur Vitamin D Total assay achieved a mean bias of 0.3%(acceptance criterion was ±5.0%) and a mean imprecision of5.5% (acceptance criterionwas<10.0%).TheADVIACentaurVitamin D Total assay is a one-pass, 18-minute antibodycompetitive chemiluminescent immunoassay. Release of the25(OH)D metabolites from the DBP is accomplished bydenaturing and blocking agents. 25(OH)D in serum com-petes with a 25(OH)D analog (labeled with fluorescein) foran anti-25(OH)D monoclonal mouse antibody (labeled withacridinium ester). Detection occurs after the remaining anti-25(OH)D monoclonal antibody (labeled with acridiniumester) complexes with vitamin D analog (labeled with fluo-rescein) and anti-fluoresceinmonoclonal antibody covalentlybound to paramagnetic particles. Results are inversely relatedto 25(OH)D serum concentrations. The standardized assaydemonstrates equimolar cross-reactivity with 25(OH)D
2
(104.5%) and 25(OH)D3(100.7%), minimal cross-reactivity
with 3-epimer-25(OH)D3(1.1%), and a broad dynamic assay
range of 4.2–150 ng/mL (10.5–375 nmol/L) [18]. Precision wasdetermined by assaying six samples twice a day in replicatesof 4, over 20 days (𝑛 = 160 replicates per sample) accordingto the Clinical and Laboratory Standards Institute (CLSI)protocol EP5-A2 [19]; the run-to-run CVs were in the rangeof 4.2% and 11.9% [18]. All samples were run in singlicateon both the LC-MS/MS and a single ADVIA Centaursystem.
2.3. Sample Population. Clinical serum samples from 18healthy adults were purchased from a commercial vendor(ProMedDx, Norton, MA, USA). Serum samples from 36pregnant women in their third trimester and 40 CKDhemodialysis patientswere purchased fromanother commer-cial vendor (Research Sample Bank, Delray Beach, FL, USA).
2.4. Samples. Peripheral venous blood samples were col-lected, placed at 4∘C, and centrifuged; serum aliquots wereprepared and stored for less than four months at –20∘C untilanalysis. Generally, no difference was found in the serumconcentrations of DBP for men and women [11, 15].
2.5. Protocol. Serum samples were sent to Siemens Health-care Diagnostics (Tarrytown, NY, USA) for DBP and25(OH)D measurements. The serum samples from the 18healthy adults were divided into five serum pools; each of
International Journal of Endocrinology 3
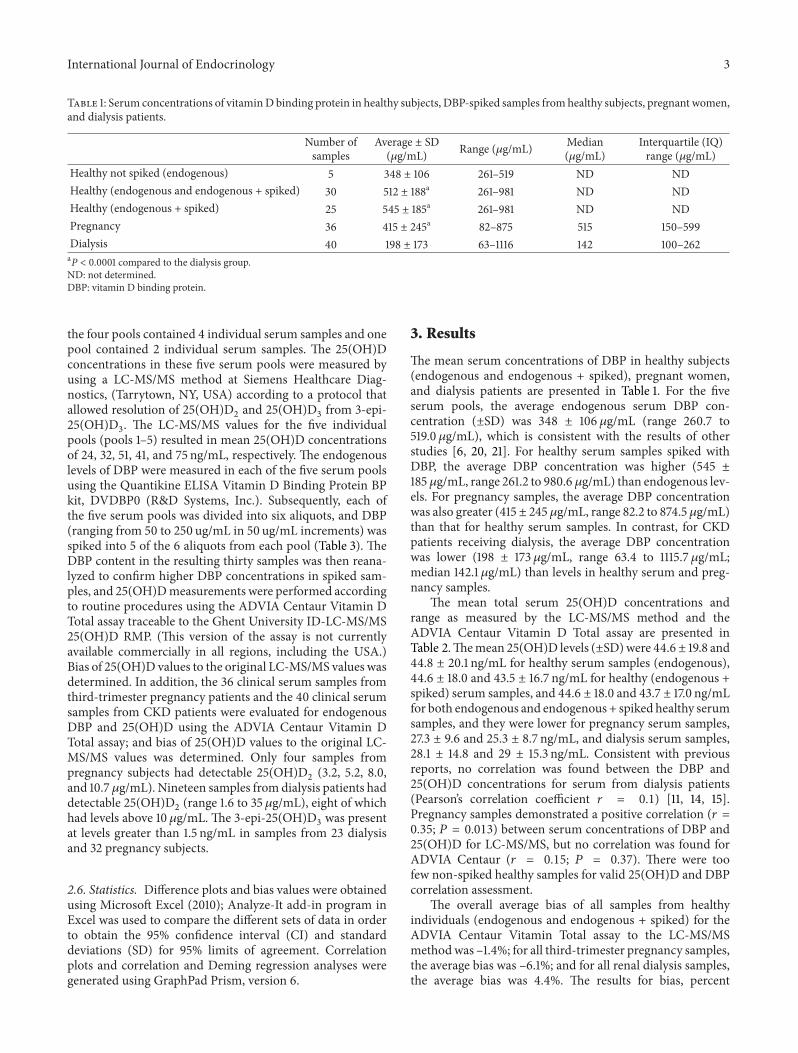
Table 1: Serum concentrations of vitaminD binding protein in healthy subjects, DBP-spiked samples fromhealthy subjects, pregnant women,and dialysis patients.
Number ofsamples
Average ± SD(𝜇g/mL) Range (𝜇g/mL) Median
(𝜇g/mL)Interquartile (IQ)range (𝜇g/mL)
Healthy not spiked (endogenous) 5 348 ± 106 261–519 ND NDHealthy (endogenous and endogenous + spiked) 30 512 ± 188a 261–981 ND NDHealthy (endogenous + spiked) 25 545 ± 185a 261–981 ND NDPregnancy 36 415 ± 245a 82–875 515 150–599Dialysis 40 198 ± 173 63–1116 142 100–262aP < 0.0001 compared to the dialysis group.ND: not determined.DBP: vitamin D binding protein.
the four pools contained 4 individual serum samples and onepool contained 2 individual serum samples. The 25(OH)Dconcentrations in these five serum pools were measured byusing a LC-MS/MS method at Siemens Healthcare Diag-nostics, (Tarrytown, NY, USA) according to a protocol thatallowed resolution of 25(OH)D
2and 25(OH)D
3from 3-epi-
25(OH)D3. The LC-MS/MS values for the five individual
pools (pools 1–5) resulted in mean 25(OH)D concentrationsof 24, 32, 51, 41, and 75 ng/mL, respectively. The endogenouslevels of DBP were measured in each of the five serum poolsusing the Quantikine ELISA Vitamin D Binding Protein BPkit, DVDBP0 (R&D Systems, Inc.). Subsequently, each ofthe five serum pools was divided into six aliquots, and DBP(ranging from 50 to 250 ug/mL in 50 ug/mL increments) wasspiked into 5 of the 6 aliquots from each pool (Table 3). TheDBP content in the resulting thirty samples was then reana-lyzed to confirm higher DBP concentrations in spiked sam-ples, and 25(OH)Dmeasurements were performed accordingto routine procedures using the ADVIA Centaur Vitamin DTotal assay traceable to the Ghent University ID-LC-MS/MS25(OH)D RMP. (This version of the assay is not currentlyavailable commercially in all regions, including the USA.)Bias of 25(OH)D values to the original LC-MS/MS values wasdetermined. In addition, the 36 clinical serum samples fromthird-trimester pregnancy patients and the 40 clinical serumsamples from CKD patients were evaluated for endogenousDBP and 25(OH)D using the ADVIA Centaur Vitamin DTotal assay; and bias of 25(OH)D values to the original LC-MS/MS values was determined. Only four samples frompregnancy subjects had detectable 25(OH)D
2(3.2, 5.2, 8.0,
and 10.7 𝜇g/mL). Nineteen samples from dialysis patients haddetectable 25(OH)D
2(range 1.6 to 35 𝜇g/mL), eight of which
had levels above 10 𝜇g/mL. The 3-epi-25(OH)D3was present
at levels greater than 1.5 ng/mL in samples from 23 dialysisand 32 pregnancy subjects.
2.6. Statistics. Difference plots and bias values were obtainedusing Microsoft Excel (2010); Analyze-It add-in program inExcel was used to compare the different sets of data in orderto obtain the 95% confidence interval (CI) and standarddeviations (SD) for 95% limits of agreement. Correlationplots and correlation and Deming regression analyses weregenerated using GraphPad Prism, version 6.
3. Results
The mean serum concentrations of DBP in healthy subjects(endogenous and endogenous + spiked), pregnant women,and dialysis patients are presented in Table 1. For the fiveserum pools, the average endogenous serum DBP con-centration (±SD) was 348 ± 106 𝜇g/mL (range 260.7 to519.0 𝜇g/mL), which is consistent with the results of otherstudies [6, 20, 21]. For healthy serum samples spiked withDBP, the average DBP concentration was higher (545 ±185 𝜇g/mL, range 261.2 to 980.6 𝜇g/mL) than endogenous lev-els. For pregnancy samples, the average DBP concentrationwas also greater (415 ± 245𝜇g/mL, range 82.2 to 874.5𝜇g/mL)than that for healthy serum samples. In contrast, for CKDpatients receiving dialysis, the average DBP concentrationwas lower (198 ± 173 𝜇g/mL, range 63.4 to 1115.7 𝜇g/mL;median 142.1 𝜇g/mL) than levels in healthy serum and preg-nancy samples.
The mean total serum 25(OH)D concentrations andrange as measured by the LC-MS/MS method and theADVIA Centaur Vitamin D Total assay are presented inTable 2.Themean 25(OH)D levels (±SD)were 44.6± 19.8 and44.8 ± 20.1 ng/mL for healthy serum samples (endogenous),44.6 ± 18.0 and 43.5 ± 16.7 ng/mL for healthy (endogenous +spiked) serum samples, and 44.6 ± 18.0 and 43.7 ± 17.0 ng/mLfor both endogenous and endogenous + spiked healthy serumsamples, and they were lower for pregnancy serum samples,27.3 ± 9.6 and 25.3 ± 8.7 ng/mL, and dialysis serum samples,28.1 ± 14.8 and 29 ± 15.3 ng/mL. Consistent with previousreports, no correlation was found between the DBP and25(OH)D concentrations for serum from dialysis patients(Pearson’s correlation coefficient 𝑟 = 0.1) [11, 14, 15].Pregnancy samples demonstrated a positive correlation (𝑟 =0.35; 𝑃 = 0.013) between serum concentrations of DBP and25(OH)D for LC-MS/MS, but no correlation was found forADVIA Centaur (𝑟 = 0.15; 𝑃 = 0.37). There were toofew non-spiked healthy samples for valid 25(OH)D and DBPcorrelation assessment.
The overall average bias of all samples from healthyindividuals (endogenous and endogenous + spiked) for theADVIA Centaur Vitamin Total assay to the LC-MS/MSmethodwas –1.4%; for all third-trimester pregnancy samples,the average bias was –6.1%; and for all renal dialysis samples,the average bias was 4.4%. The results for bias, percent
4 International Journal of Endocrinology
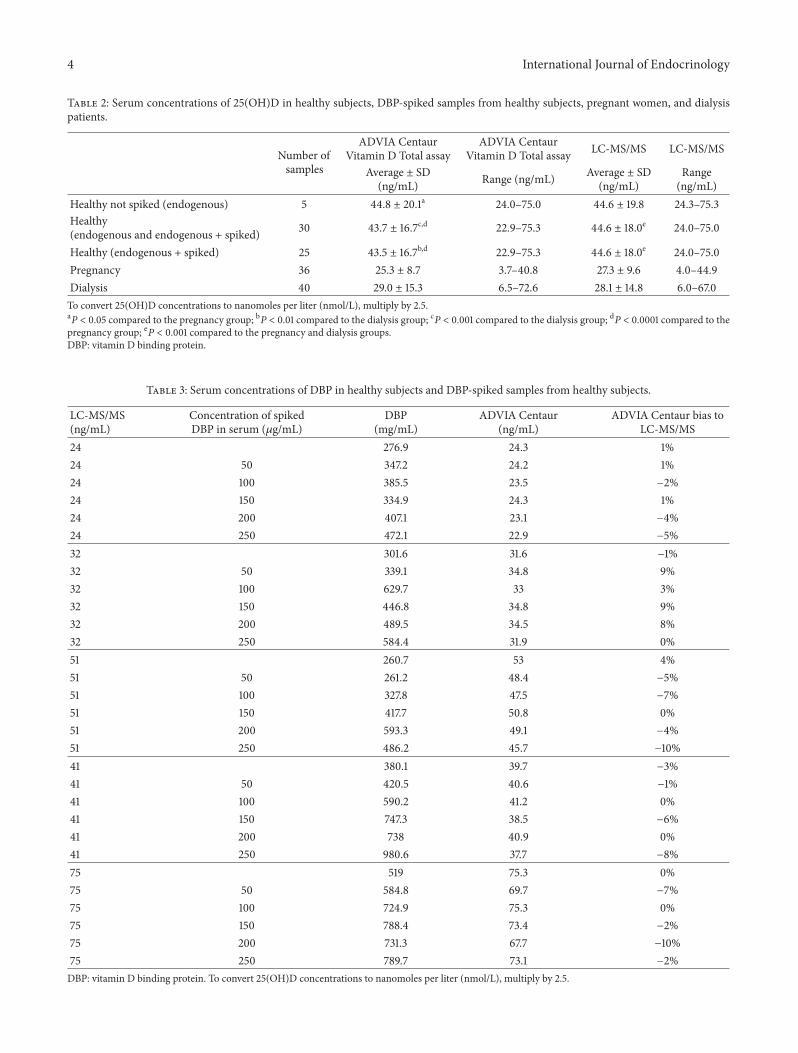
Table 2: Serum concentrations of 25(OH)D in healthy subjects, DBP-spiked samples from healthy subjects, pregnant women, and dialysispatients.
Number ofsamples
ADVIA CentaurVitamin D Total assay
ADVIA CentaurVitamin D Total assay LC-MS/MS LC-MS/MS
Average ± SD(ng/mL) Range (ng/mL) Average ± SD
(ng/mL)Range(ng/mL)
Healthy not spiked (endogenous) 5 44.8 ± 20.1a 24.0–75.0 44.6 ± 19.8 24.3–75.3Healthy(endogenous and endogenous + spiked) 30 43.7 ± 16.7c,d 22.9–75.3 44.6 ± 18.0e 24.0–75.0
Healthy (endogenous + spiked) 25 43.5 ± 16.7b,d 22.9–75.3 44.6 ± 18.0e 24.0–75.0Pregnancy 36 25.3 ± 8.7 3.7–40.8 27.3 ± 9.6 4.0–44.9Dialysis 40 29.0 ± 15.3 6.5–72.6 28.1 ± 14.8 6.0–67.0To convert 25(OH)D concentrations to nanomoles per liter (nmol/L), multiply by 2.5.aP < 0.05 compared to the pregnancy group; bP < 0.01 compared to the dialysis group; cP < 0.001 compared to the dialysis group; dP < 0.0001 compared to thepregnancy group; eP < 0.001 compared to the pregnancy and dialysis groups.DBP: vitamin D binding protein.
Table 3: Serum concentrations of DBP in healthy subjects and DBP-spiked samples from healthy subjects.
LC-MS/MS(ng/mL)
Concentration of spikedDBP in serum (𝜇g/mL)
DBP(mg/mL)
ADVIA Centaur(ng/mL)
ADVIA Centaur bias toLC-MS/MS
24 276.9 24.3 1%24 50 347.2 24.2 1%24 100 385.5 23.5 −2%24 150 334.9 24.3 1%24 200 407.1 23.1 −4%24 250 472.1 22.9 −5%32 301.6 31.6 −1%32 50 339.1 34.8 9%32 100 629.7 33 3%32 150 446.8 34.8 9%32 200 489.5 34.5 8%32 250 584.4 31.9 0%51 260.7 53 4%51 50 261.2 48.4 −5%51 100 327.8 47.5 −7%51 150 417.7 50.8 0%51 200 593.3 49.1 −4%51 250 486.2 45.7 −10%41 380.1 39.7 −3%41 50 420.5 40.6 −1%41 100 590.2 41.2 0%41 150 747.3 38.5 −6%41 200 738 40.9 0%41 250 980.6 37.7 −8%75 519 75.3 0%75 50 584.8 69.7 −7%75 100 724.9 75.3 0%75 150 788.4 73.4 −2%75 200 731.3 67.7 −10%75 250 789.7 73.1 −2%DBP: vitamin D binding protein. To convert 25(OH)D concentrations to nanomoles per liter (nmol/L), multiply by 2.5.

International Journal of Endocrinology 5
15
10
5
0
−5
−10
−150 200 400 600 800 1000 1200
DBP (𝜇g/mL)
Healthy and spikedPregnancyRenal dialysis
Mean bias, −0.59 ± 3.59
n Mean 95% CI SE SDDBP spiked 106 360.93 23.480 241.742
All samples (ng/mL) 106 −0.591 0.3487 3.5902
AD
VIA
Cen
taur
bia
s to
LC-M
S/M
S (n
g/m
L)
314.38–407.49−1.28–0.10
(a)
0 200 400 600 800 1000 1200
DBP (𝜇g/mL)
Healthy and spikedPregnancyRenal dialysis
n Mean 95% CI SE SDDBP spiked 106 360.93 23.480 241.742
106
30
20
10
0
−10
−20
−30
−40
All samples % bias −0.830 1.1423 11.7607
AD
VIA
Cen
taur
% b
ias t
oLC
-MS/
MS
(%)
Mean % bias, −0.83 ± 11.76
314.38–407.49−3.10–1.43
(b)
0
DBP (𝜇g/mL)
n Mean 95% CI SE SDDBP spiked 30
30
4
2
0
−2
−4
−6
−8
AD
VIA
Cen
taur
bia
s to
LC-M
S/M
S(n
g/m
L); h
ealth
y an
d sp
iked
511.88
−0.92
34.354
0.431
188.163
2.363Bias to LC-MS/MS(ng/mL)
200 400 600 800 1000 1200
Mean bias, −0.92 ± 2.36
441.62–582.14−1.80–−0.03
(c)
0
DBP (𝜇g/mL)
n Mean 95% CI SE SDDBP spiked 30
30
511.88 34.354 188.163
200 400 600 800 1000 1200
10
5
0
−5
−10
−15
AD
VIA
Cen
taur
% b
ias t
o LC
-MS/
MS;
heal
thy
and
spik
ed (%
)
Bias to LC-MS/MS(%)
−1.4 0.90 4.92
Mean % bias, −1.4 ± 4.92
441.62–582.14−3.20–0.47
(d)
DBP (𝜇g/mL)
n Mean 95% CI SE SD
200 400 600 800 1000
8
4
0
−4
−8
−12
AD
VIA
Cen
taur
bia
s to
LC-M
S/M
S(n
g/m
L); p
regn
ancy
Bias to LC-MS/MS(ng/mL)
36 415.36
36 −1.933 0.6119 3.6712
40.855 245.131Pregnancy
Mean bias, −1.93 ± 3.67
332.42–498.30−3.18–−0.69
(e)
30
20
10
0
−10
−20
−30
−40
AD
VIA
Cen
taur
% b
ias t
o LC
-MS/
MS;
preg
nanc
y (%
)
−6.1 2.13 12.80
0
DBP (𝜇g/mL)
n Mean 95% CI SE SD
200 400 600 800 1000
(%)Bias to LC-MS/MS
36 415.36
36
40.855 245.131Pregnancy
Mean % bias, −6.1 ± 12.80
−10.47–−1.81332.42–498.30
(f)
Figure 1: Continued.
6 International Journal of Endocrinology
12
8
4
0
−4
−8
−12AD
VIA
Cen
taur
bia
s to
LC-M
S/M
S(n
g/m
L); r
enal
dia
lysis
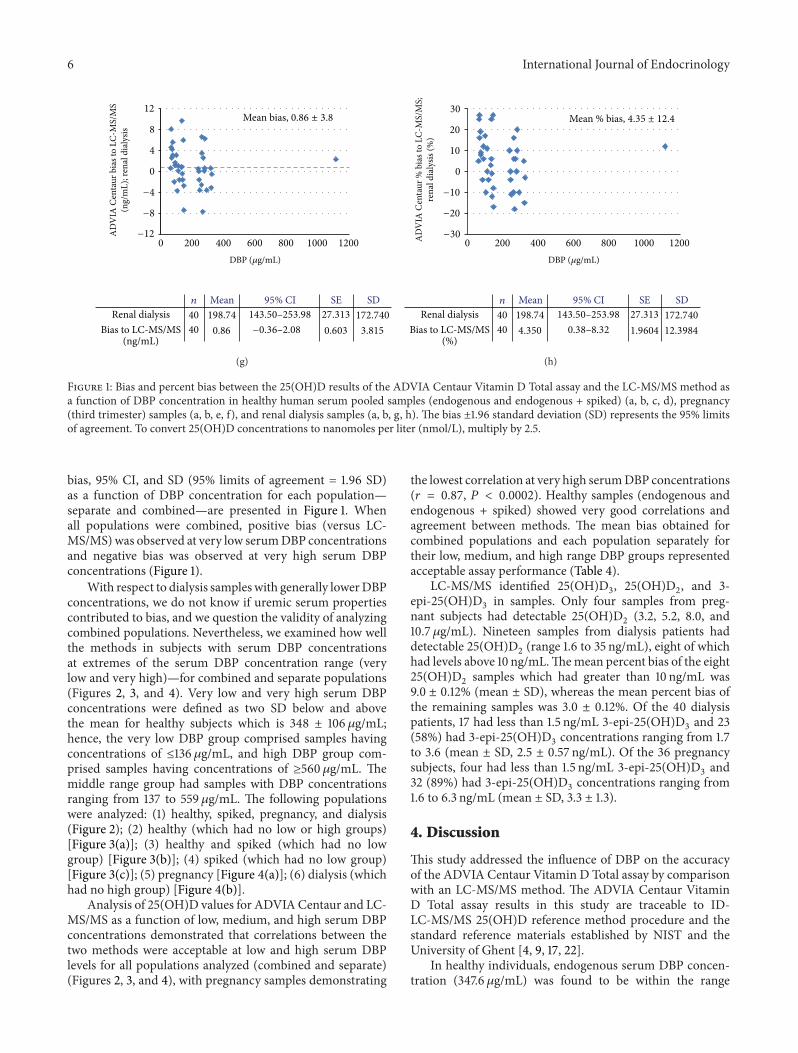
Renal dialysis 198.74 27.313 172.740
0.86 0.603 3.815
0
DBP (𝜇g/mL)
n Mean 95% CI SE SD40
40Bias to LC-MS/MS(ng/mL)
200 400 600 800 1000 1200
Mean bias, 0.86 ± 3.8
143.50–253.98−0.36–2.08
(g)
30
20
10
0
−10
−20
−30AD
VIA
Cen
taur
% b
ias t
o LC
-MS/
MS;
rena
l dia
lysis
(%)
4.350 1.9604 12.3984
Renal dialysis 198.74 27.313 172.740
0
DBP (𝜇g/mL)
n Mean 95% CI SE SD40
40
(%)Bias to LC-MS/MS
200 400 600 800 1000 1200
Mean % bias, 4.35 ± 12.4
0.38–8.32143.50–253.98
(h)
Figure 1: Bias and percent bias between the 25(OH)D results of the ADVIA Centaur Vitamin D Total assay and the LC-MS/MS method asa function of DBP concentration in healthy human serum pooled samples (endogenous and endogenous + spiked) (a, b, c, d), pregnancy(third trimester) samples (a, b, e, f), and renal dialysis samples (a, b, g, h). The bias ±1.96 standard deviation (SD) represents the 95% limitsof agreement. To convert 25(OH)D concentrations to nanomoles per liter (nmol/L), multiply by 2.5.
bias, 95% CI, and SD (95% limits of agreement = 1.96 SD)as a function of DBP concentration for each population—separate and combined—are presented in Figure 1. Whenall populations were combined, positive bias (versus LC-MS/MS)was observed at very low serumDBP concentrationsand negative bias was observed at very high serum DBPconcentrations (Figure 1).
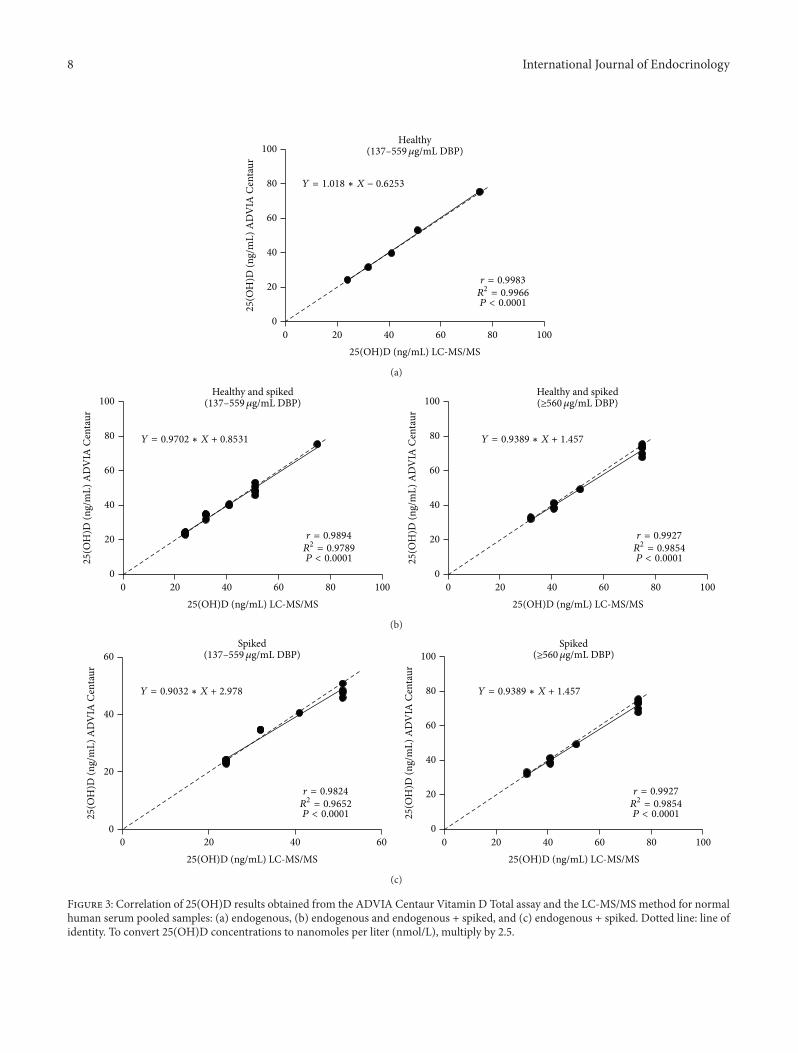
With respect to dialysis sampleswith generally lowerDBPconcentrations, we do not know if uremic serum propertiescontributed to bias, and we question the validity of analyzingcombined populations. Nevertheless, we examined how wellthe methods in subjects with serum DBP concentrationsat extremes of the serum DBP concentration range (verylow and very high)—for combined and separate populations(Figures 2, 3, and 4). Very low and very high serum DBPconcentrations were defined as two SD below and abovethe mean for healthy subjects which is 348 ± 106 𝜇g/mL;hence, the very low DBP group comprised samples havingconcentrations of ≤136 𝜇g/mL, and high DBP group com-prised samples having concentrations of ≥560𝜇g/mL. Themiddle range group had samples with DBP concentrationsranging from 137 to 559 𝜇g/mL. The following populationswere analyzed: (1) healthy, spiked, pregnancy, and dialysis(Figure 2); (2) healthy (which had no low or high groups)[Figure 3(a)]; (3) healthy and spiked (which had no lowgroup) [Figure 3(b)]; (4) spiked (which had no low group)[Figure 3(c)]; (5) pregnancy [Figure 4(a)]; (6) dialysis (whichhad no high group) [Figure 4(b)].
Analysis of 25(OH)D values for ADVIA Centaur and LC-MS/MS as a function of low, medium, and high serum DBPconcentrations demonstrated that correlations between thetwo methods were acceptable at low and high serum DBPlevels for all populations analyzed (combined and separate)(Figures 2, 3, and 4), with pregnancy samples demonstrating
the lowest correlation at very high serumDBP concentrations(𝑟 = 0.87, 𝑃 < 0.0002). Healthy samples (endogenous andendogenous + spiked) showed very good correlations andagreement between methods. The mean bias obtained forcombined populations and each population separately fortheir low, medium, and high range DBP groups representedacceptable assay performance (Table 4).
LC-MS/MS identified 25(OH)D3, 25(OH)D
2, and 3-
epi-25(OH)D3in samples. Only four samples from preg-
nant subjects had detectable 25(OH)D2(3.2, 5.2, 8.0, and
10.7 𝜇g/mL). Nineteen samples from dialysis patients haddetectable 25(OH)D
2(range 1.6 to 35 ng/mL), eight of which
had levels above 10 ng/mL.Themean percent bias of the eight25(OH)D
2samples which had greater than 10 ng/mL was
9.0 ± 0.12% (mean ± SD), whereas the mean percent bias ofthe remaining samples was 3.0 ± 0.12%. Of the 40 dialysispatients, 17 had less than 1.5 ng/mL 3-epi-25(OH)D
3and 23
(58%) had 3-epi-25(OH)D3concentrations ranging from 1.7
to 3.6 (mean ± SD, 2.5 ± 0.57 ng/mL). Of the 36 pregnancysubjects, four had less than 1.5 ng/mL 3-epi-25(OH)D
3and
32 (89%) had 3-epi-25(OH)D3concentrations ranging from
1.6 to 6.3 ng/mL (mean ± SD, 3.3 ± 1.3).
4. Discussion
This study addressed the influence of DBP on the accuracyof the ADVIA Centaur Vitamin D Total assay by comparisonwith an LC-MS/MS method. The ADVIA Centaur VitaminD Total assay results in this study are traceable to ID-LC-MS/MS 25(OH)D reference method procedure and thestandard reference materials established by NIST and theUniversity of Ghent [4, 9, 17, 22].
In healthy individuals, endogenous serum DBP concen-tration (347.6 𝜇g/mL) was found to be within the range
International Journal of Endocrinology 7
0
20
40
60
80
100
0 20 40 60 80 100
Y = 1.042 ∗ X + 0.5264
P < 0.0001
r = 0.9724
R2= 0.9455
25(OH)D (ng/mL) LC-MS/MS
25
(OH
)D (n
g/m
L) A
DV
IA C
enta
urHealthy, spiked, pregnancy, and dialysis
(≤136𝜇g/mL DBP)
(a)
0
20
40
60
80
100
0 20 40 60 80 100
25(OH)D (ng/mL) LC-MS/MS
25
(OH
)D (n
g/m
L) A
DV
IA C
enta
ur
Healthy, spiked, pregnancy, and dialysis(137–559𝜇g/mL DBP)
Y = 1.005 ∗ X − 0.6121
P < 0.0001
r = 0.9773
R2= 0.9551
(b)
0
20
40
60
80
100
0 20 40 60 80 100
25(OH)D (ng/mL) LC-MS/MS
25
(OH
)D (n
g/m
L) A
DV
IA C
enta
ur
Y = 0.9994 ∗ X − 3.044
P < 0.0001
r = 0.9818
R2= 0.9640
Healthy, spiked, pregnancy, and dialysis(≥560𝜇g/mL DBP)
(c)
Figure 2: Correlation of 25(OH)D results obtained from theADVIACentaurVitaminDTotal assay and the LC-MS/MSmethod for combinednormal human serum pooled samples (endogenous and endogenous + spiked), pregnancy (third trimester samples), and renal dialysissamples for (a) low, (b) medium, and (c) high DBP groups. Dotted line: line of identity. To convert 25(OH)D concentrations to nanomolesper liter (nmol/L), multiply by 2.5.
reported by others (300–600𝜇g/mL) [20] and increasedafter DBP spiking (545 𝜇g/mL). Despite the increase in DBPconcentrations after spiking, 25(OH)D measurements inindividual samples were equivalent between the two meth-ods. There were no healthy (endogenous or endogenous +spiked) samples in the low DBP range, as defined by two SDvalues below the mean of healthy samples (i.e., ≤136 𝜇g/mL)(Figure 3). The high DBP range, as defined by two SDvalues above the mean of healthy samples (i.e., ≥560𝜇g/mL),comprised twelve spiked samples (Figure 3), and 25(OH)Dagreement was good between the methods for 25(OH)Dvalues (𝑟 = 0.9927, 𝑃 < 0.0001; bias −3.0 ± 3.98%). Thus,there was not a significant bias observed for the ADVIACentaur for healthy samples (endogenous + spiked). Thisdemonstrates that DBP concentrations as high as 980 𝜇g/mLdid not appear to interfere with the assay for this popula-tion. By comparison, endogenous serumDBP concentrationspeaked at 519 𝜇g/mL in healthy subjects. Because the use of
DBP-spiked samples may be suspect, these results will beconfirmed in future studies which evaluate a greater numberof samples from healthy subjects containing endogenousserum DBP concentrations in the higher range (althoughit is unlikely that normal healthy subjects exist with DBPconcentrations that can be achieved at the high spikingconcentrations).
Depending on hormonal status or disease state serummatrix components may be different, and the levels of DBPmay be higher or lower than those of healthy individuals [14,15]. In women who are receiving estrogen therapy and thosewho are pregnant, higher serum estrogen levels correlate withincreases in circulating DBP and total 1,25(OH)
2D. During
pregnancy, increased 1,25(OH)2D3occurs in response to the
growing calcium demands of the fetus [14, 15]. Consistentwith these reports, the mean DBP concentration was greater(415 𝜇g/mL) for samples frompregnantwomen than for thosefrom healthy subjects (347.6 𝜇g/mL) and dialysis patients
8 International Journal of Endocrinology
0 20 40 60 80 100
25(OH)D (ng/mL) LC-MS/MS
Healthy(137–559𝜇g/mL DBP)
Y = 1.018 ∗ X − 0.6253
r = 0.9983
R2= 0.9966
P < 0.0001
0
20
40
60
80
100
25
(OH
)D (n
g/m
L) A
DV
IA C
enta
ur
(a)
0
20
40
60
80
100
0 20 40 60 80 100
25(OH)D (ng/mL) LC-MS/MS
Healthy and spiked(137–559𝜇g/mL DBP)
Y = 0.9702 ∗ X + 0.8531
r = 0.9894
R2= 0.9789
P < 0.000125
(OH
)D (n
g/m
L) A
DV
IA C
enta
ur
Y = 0.9389 ∗ X + 1.457
r = 0.9927
R2= 0.9854
P < 0.0001
Healthy and spiked(≥560𝜇g/mL DBP)
0
20
40
60
80
100
0 20 40 60 80 100
25(OH)D (ng/mL) LC-MS/MS
25
(OH
)D (n
g/m
L) A
DV
IA C
enta
ur
(b)
0
20
40
60
0 20 40 60
25(OH)D (ng/mL) LC-MS/MS
Spiked(137–559𝜇g/mL DBP)
Y = 0.9032 ∗ X + 2.978
r = 0.9824
R2= 0.9652
P < 0.000125
(OH
)D (n
g/m
L) A
DV
IA C
enta
ur
Y = 0.9389 ∗ X + 1.457
r = 0.9927
R2= 0.9854
P < 0.0001
Spiked(≥560𝜇g/mL DBP)
0 20 40 60 80 100
25(OH)D (ng/mL) LC-MS/MS
0
20
40
60
80
100
25
(OH
)D (n
g/m
L) A
DV
IA C
enta
ur
(c)
Figure 3: Correlation of 25(OH)D results obtained from the ADVIA Centaur Vitamin D Total assay and the LC-MS/MSmethod for normalhuman serum pooled samples: (a) endogenous, (b) endogenous and endogenous + spiked, and (c) endogenous + spiked. Dotted line: line ofidentity. To convert 25(OH)D concentrations to nanomoles per liter (nmol/L), multiply by 2.5.
International Journal of Endocrinology 9
40
30
20
10
0
403020100
Y = 0.8989 ∗ X + 2.491
r = 0.9649
R2= 0.9311
P < 0.0018
25(OH)D (ng/mL) LC-MS/MS
25
(OH
)D (n
g/m
L) A
DV
IA C
enta
ur
Pregnancy(≤136𝜇g/mL DBP)
50
40
30
20
10
0
50403020100
Pregnancy(137–559𝜇g/mL DBP)
Y = 1.004 ∗ X − 0.8132
r = 0.9568
R2= 0.9155
P < 0.0001
25(OH)D (ng/mL) LC-MS/MS
25
(OH
)D (n
g/m
L) A
DV
IA C
enta
ur
Y = 0.8596 ∗ X − 0.2324
r = 0.8733
R2= 0.7627
P < 0.0002
Pregnancy(≥560𝜇g/mL DBP)50
40
30
20
10
0
50403020100
25(OH)D (ng/mL) LC-MS/MS
25
(OH
)D (n
g/m
L) A
DV
IA C
enta
ur
(a)
100
80
60
40
20
0
100806040200
Dialysis(137–559𝜇g/mL DBP)
r = 0.9763
R2= 0.9531
P < 0.0001
25(OH)D (ng/mL) LC-MS/MS
25
(OH
)D (n
g/m
L) A
DV
IA C
enta
ur
100
80
60
40
20
0
100806040200
25(OH)D (ng/mL) LC-MS/MS
25
(OH
)D (n
g/m
L) A
DV
IA C
enta
ur
r = 0.9684
R2= 0.9378
P < 0.0001
Y = 1.023 ∗ X − 1.051Y = 1.049 ∗ X + 0.8515
Dialysis(≤136𝜇g/mL DBP)
(b)
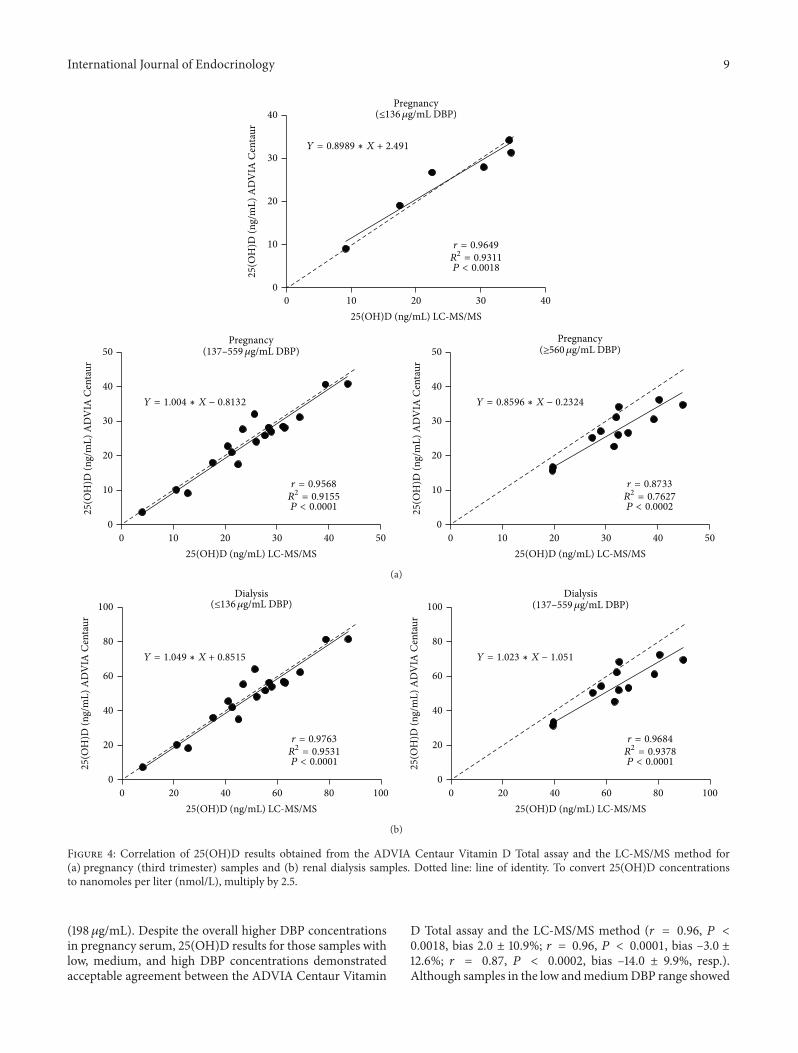
Figure 4: Correlation of 25(OH)D results obtained from the ADVIA Centaur Vitamin D Total assay and the LC-MS/MS method for(a) pregnancy (third trimester) samples and (b) renal dialysis samples. Dotted line: line of identity. To convert 25(OH)D concentrationsto nanomoles per liter (nmol/L), multiply by 2.5.
(198 𝜇g/mL). Despite the overall higher DBP concentrationsin pregnancy serum, 25(OH)D results for those samples withlow, medium, and high DBP concentrations demonstratedacceptable agreement between the ADVIA Centaur Vitamin
D Total assay and the LC-MS/MS method (𝑟 = 0.96, 𝑃 <0.0018, bias 2.0 ± 10.9%; 𝑟 = 0.96, 𝑃 < 0.0001, bias –3.0 ±12.6%; 𝑟 = 0.87, 𝑃 < 0.0002, bias –14.0 ± 9.9%, resp.).Although samples in the low andmediumDBP range showed
10 International Journal of Endocrinology
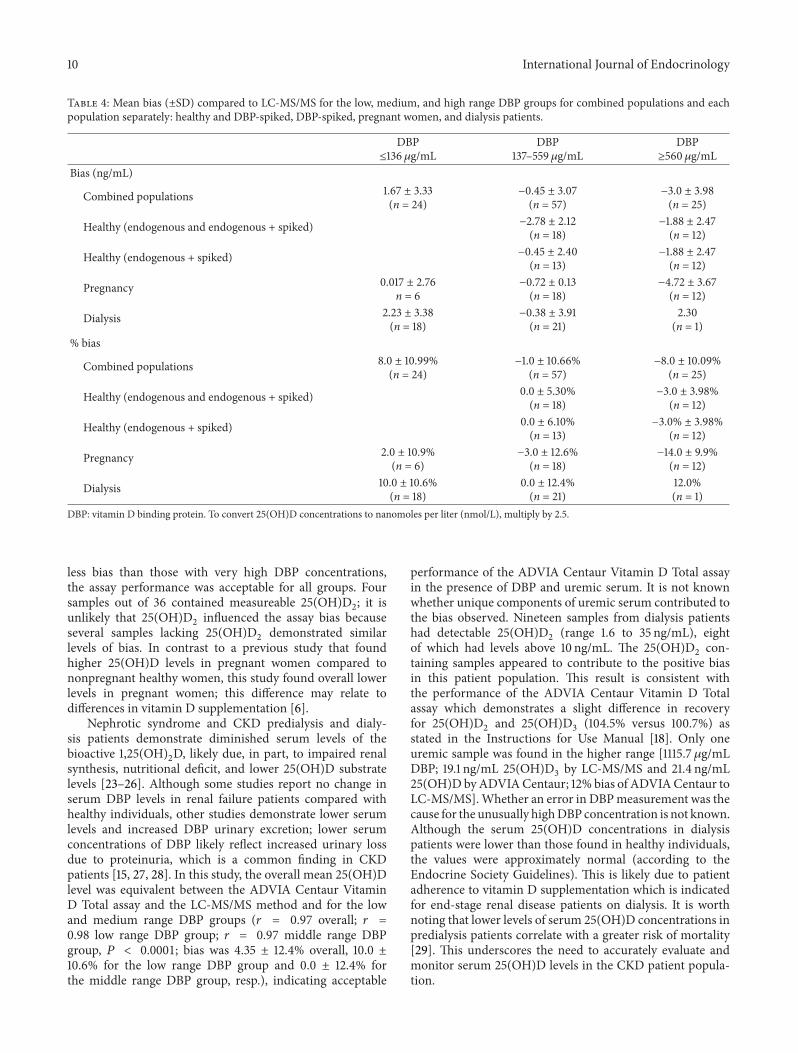
Table 4: Mean bias (±SD) compared to LC-MS/MS for the low, medium, and high range DBP groups for combined populations and eachpopulation separately: healthy and DBP-spiked, DBP-spiked, pregnant women, and dialysis patients.
DBP≤136𝜇g/mL
DBP137–559 𝜇g/mL
DBP≥560 𝜇g/mL
Bias (ng/mL)
Combined populations 1.67 ± 3.33(n = 24)
−0.45 ± 3.07(n = 57)
−3.0 ± 3.98(n = 25)
Healthy (endogenous and endogenous + spiked) −2.78 ± 2.12(n = 18)
−1.88 ± 2.47(n = 12)
Healthy (endogenous + spiked) −0.45 ± 2.40(n = 13)
−1.88 ± 2.47(n = 12)
Pregnancy 0.017 ± 2.76n = 6
−0.72 ± 0.13(n = 18)
−4.72 ± 3.67(n = 12)
Dialysis 2.23 ± 3.38(n = 18)
−0.38 ± 3.91(n = 21)
2.30(n = 1)
% bias
Combined populations 8.0 ± 10.99%(n = 24)
−1.0 ± 10.66%(n = 57)
−8.0 ± 10.09%(n = 25)
Healthy (endogenous and endogenous + spiked) 0.0 ± 5.30%(n = 18)
−3.0 ± 3.98%(n = 12)
Healthy (endogenous + spiked) 0.0 ± 6.10%(n = 13)
−3.0% ± 3.98%(n = 12)
Pregnancy 2.0 ± 10.9%(n = 6)
−3.0 ± 12.6%(n = 18)
−14.0 ± 9.9%(n = 12)
Dialysis 10.0 ± 10.6%(n = 18)
0.0 ± 12.4%(n = 21)
12.0%(n = 1)
DBP: vitamin D binding protein. To convert 25(OH)D concentrations to nanomoles per liter (nmol/L), multiply by 2.5.
less bias than those with very high DBP concentrations,the assay performance was acceptable for all groups. Foursamples out of 36 contained measureable 25(OH)D
2; it is
unlikely that 25(OH)D2influenced the assay bias because
several samples lacking 25(OH)D2demonstrated similar
levels of bias. In contrast to a previous study that foundhigher 25(OH)D levels in pregnant women compared tononpregnant healthy women, this study found overall lowerlevels in pregnant women; this difference may relate todifferences in vitamin D supplementation [6].
Nephrotic syndrome and CKD predialysis and dialy-sis patients demonstrate diminished serum levels of thebioactive 1,25(OH)
2D, likely due, in part, to impaired renal
synthesis, nutritional deficit, and lower 25(OH)D substratelevels [23–26]. Although some studies report no change inserum DBP levels in renal failure patients compared withhealthy individuals, other studies demonstrate lower serumlevels and increased DBP urinary excretion; lower serumconcentrations of DBP likely reflect increased urinary lossdue to proteinuria, which is a common finding in CKDpatients [15, 27, 28]. In this study, the overall mean 25(OH)Dlevel was equivalent between the ADVIA Centaur VitaminD Total assay and the LC-MS/MS method and for the lowand medium range DBP groups (𝑟 = 0.97 overall; 𝑟 =0.98 low range DBP group; 𝑟 = 0.97 middle range DBPgroup, 𝑃 < 0.0001; bias was 4.35 ± 12.4% overall, 10.0 ±10.6% for the low range DBP group and 0.0 ± 12.4% forthe middle range DBP group, resp.), indicating acceptable
performance of the ADVIA Centaur Vitamin D Total assayin the presence of DBP and uremic serum. It is not knownwhether unique components of uremic serum contributed tothe bias observed. Nineteen samples from dialysis patientshad detectable 25(OH)D
2(range 1.6 to 35 ng/mL), eight
of which had levels above 10 ng/mL. The 25(OH)D2con-
taining samples appeared to contribute to the positive biasin this patient population. This result is consistent withthe performance of the ADVIA Centaur Vitamin D Totalassay which demonstrates a slight difference in recoveryfor 25(OH)D
2and 25(OH)D
3(104.5% versus 100.7%) as
stated in the Instructions for Use Manual [18]. Only oneuremic sample was found in the higher range [1115.7 𝜇g/mLDBP; 19.1 ng/mL 25(OH)D
3by LC-MS/MS and 21.4 ng/mL
25(OH)D byADVIACentaur; 12% bias of ADVIACentaur toLC-MS/MS].Whether an error in DBPmeasurement was thecause for the unusually highDBP concentration is not known.Although the serum 25(OH)D concentrations in dialysispatients were lower than those found in healthy individuals,the values were approximately normal (according to theEndocrine Society Guidelines). This is likely due to patientadherence to vitamin D supplementation which is indicatedfor end-stage renal disease patients on dialysis. It is worthnoting that lower levels of serum 25(OH)D concentrations inpredialysis patients correlate with a greater risk of mortality[29]. This underscores the need to accurately evaluate andmonitor serum 25(OH)D levels in the CKD patient popula-tion.
International Journal of Endocrinology 11
A recent study implicated ineffective 25(OH)D-DBPextraction procedures as the cause of variability in an eval-uation of five automated assays compared to an RMP LC-MS/MSmethod [6].The study, which included samples fromhealthy individuals, pregnant women, dialysis patients, andintensive care patients, found that the bias was, at least inpart, dependent on DBP concentration.The ADVIA CentaurVitamin D Total assay in the present study differed fromthe assay in the previous study in that it has a differentstandardization; this version is standardized with internalstandards traceable to the NIST-Ghent VDSP RMP.This mayhave had some impact on why the results of this study differfrom those previously reported.
5. Conclusions
The small positive bias found in renal dialysis patients withDBP concentrations below those found in normal healthysubjects and small negative bias found in pregnant subjectswithDBP levels above those found in normal healthy subjectswere within the acceptable range for the assay. Thus, forpopulations with different levels of DBP, the 25(OH)D resultsobtained by theADVIACentaurVitaminDTotal immunoas-say were equivalent to the sum of 25(OH)D
2and 25(OH)D
3
using the LC-MS/MS method—especially for individualswith serum DBP concentrations within the range for thehealthy population (137 to 559𝜇g/mL).
Disclosure
All authors are employees of Siemens Healthcare DiagnosticsInc.
Conflict of Interests
The authors declare that there is no conflict of interestsregarding the publication of this paper.
Acknowledgment
This study was supported by Siemens Healthcare DiagnosticsInc.
References
[1] G. D. Carter, “Accuracy of 25-hydroxyvitamin D assays: con-fronting the issues,” Current Drug Targets, vol. 12, no. 1, pp. 19–28, 2011.
[2] G. D. Carter, J. L. Berry, E. Gunter et al., “Proficiency testingof 25-hydroxyvitamin D (25-OHD) assays,” Journal of SteroidBiochemistry and Molecular Biology, vol. 121, no. 1-2, pp. 176–179, 2010.
[3] B. W. Hollis, “Editorial: the determination of circulating 25-hydroxyvitaminD: no easy task,” Journal of Clinical Endocrinol-ogy and Metabolism, vol. 89, no. 7, pp. 3149–3151, 2004.
[4] C. T. Sempos, H. W. Vesper, K. W. Phinney, L. M. Thienpont, P.M. Coates, and Vitamin D Standardization Program (VDSP),“Vitamin D status as an international issue: national surveysand the problem of standardization,” Scandinavian Journal of
Clinical and Laboratory Investigation, vol. 72, no. 243, pp. 32–40, 2012.
[5] A. M. Wallace, S. Gibson, A. de la Hunty, C. Lamberg-Allardt, and M. Ashwell, “Measurement of 25-hydroxyvitaminD in the clinical laboratory: current procedures, performancecharacteristics and limitations,” Steroids, vol. 75, no. 7, pp. 477–488, 2010.
[6] A. C. Heijboer, M. A. Blankenstein, I. P. Kema, and M. M.Buijs, “Accuracy of 6 routine 25-hydroxyvitamin D assays:influence of vitamin D binding protein concentration,” ClinicalChemistry, vol. 58, no. 3, pp. 543–548, 2012.
[7] N. E. Cooke and J. G. Haddad, “VitaminD binding protein (Gc-globulin),” Endocrine Reviews, vol. 10, no. 3, pp. 294–307, 1989.
[8] B. W. Hollis, “Comparison of equilibrium and disequilibriumassay conditions for ergocalciferol, cholecalciferol and theirmajor metabolites,” Journal of Steroid Biochemistry, vol. 21, no.1, pp. 81–86, 1984.
[9] L. M. Thienpont, H. C. M. Stepman, and H. W. Vesper,“Standardization of measurements of 25-Hydroxyvitamin D3and D2,” Scandinavian Journal of Clinical and LaboratoryInvestigation, vol. 72, no. 243, pp. 41–49, 2012.
[10] US Renal Data System, Annual Data Report: Atlas of End-StageRenal Disease in the United States: International Comparisons,National Institutes of Health, National Institute of Diabetes andDigestive and Kidney Diseases, Bethesda, Md, USA, 2007.
[11] R. Bouillon, H. van Baelen, and P. de Moor, “The measurementof the vitamin D binding protein in human serum,” Journal ofClinical Endocrinology and Metabolism, vol. 45, no. 2, pp. 225–231, 1977.
[12] T. J. Gilbertson and R. P. Stryd, “High-performance liquidchromatographic assay for 25-hydroxyvitamin D3 in serum,”Clinical Chemistry, vol. 23, no. 9, pp. 1700–1704, 1977.
[13] V. Justova, L. Starka, H. Wilczek, and V. Pacovsky, “A simpleradioassay for 25 hydroxycholecalciferol without chromatogra-phy,” Clinica Chimica Acta, vol. 70, no. 1, pp. 97–102, 1976.
[14] R. Bouillon, F. A. van Assche, H. van Baelen, W. Heyns, and P.de Moor, “Influence of the vitamin D-binding protein on theserumconcentration of 1,25-dihydroxyvitaminD3. Significanceof the free 1,25-dihydroxyvitamin D3 concentration,” Journal ofClinical Investigation, vol. 67, no. 3, pp. 589–596, 1981.
[15] J. G.Haddad Jr. and J.Walgate, “Radioimmunoassay of the bind-ing protein for vitamin D and its metabolites in human serum.Concentrations in normal subjects and patients with disordersofmineral homeostasis,” Journal of Clinical Investigation, vol. 58,no. 5, pp. 1217–1222, 1976.
[16] Clinical and Laboratory Standards Institute (NCCLS), Interfer-ence Testing in Clinical Chemistry, NCCLS Document EP7-A2,Clinical and Laboratory Standards Institute, Wayne, Pa, USA,2nd edition, 2005.
[17] H. C. M. Stepman, A. Vanderroost, K. van Uytfanghe, and L.M. Thienpont, “Candidate reference measurement proceduresfor serum 25-hydroxyvitamin D3and 25-hydroxyvitamin D2by using isotope-dilution liquid chromatography-tandem massspectrometry,” Clinical Chemistry, vol. 57, no. 3, pp. 441–448,2011.
[18] Siemens ADVIA Centaur XP Vitamin D Total (VitD) Assay,[Directional Insert 10699279 en rev a], Siemens HealthcareDiagnostics, Tarrytown, NY, USA, 2013.
[19] Clinical and Laboratory Standards Institute (NCCLS), Eval-uation of Precision Performance of Quantitative MeasurementMethods, NCCLS Document EP5-A2, Clinical and LaboratoryStandards Institute, Wayne, Pa, USA, 2nd edition, 2004.

12 International Journal of Endocrinology
[20] M. Kawakami, C. B. Blum, R. Ramakrishnan, R. B. Dell, andD. S. Goodman, “Turnover of the plasma bindng protein forvitamin D and its metabolites in normal human subjects,”Journal of Clinical Endocrinology and Metabolism, vol. 53, no.6, pp. 1110–1116, 1981.
[21] M. Speeckaert, G. Huang, J. R. Delanghe, and Y. E. C. Taes,“Biological and clinical aspects of the vitaminDbinding protein(Gc-globulin) and its polymorphism,”ClinicaChimicaActa, vol.372, no. 1-2, pp. 33–42, 2006.
[22] W. G. Miller, G. L. Myers, M. L. Gantzer et al., “Roadmap forharmonization of clinical laboratorymeasurement procedures,”Clinical Chemistry, vol. 57, no. 8, pp. 1108–1117, 2011.
[23] W. Al-Badr and K. J. Martin, “Vitamin D and kidney disease,”Clinical Journal of the American Society of Nephrology, vol. 3, no.5, pp. 1555–1560, 2008.
[24] E. A. Gonzalez, A. Sachdeva, D. A. Oliver, and K. J. Martin,“Vitamin D insufficiency and deficiency in chronic kidneydisease: a single center observational study,” The AmericanJournal of Nephrology, vol. 24, no. 5, pp. 503–510, 2004.
[25] R. E. LaClair, R. N. Hellman, S. L. Karp et al., “Prevalenceof calcidiol deficiency in CKD: a cross-sectional study acrosslatitudes in the United States,” The American Journal of KidneyDiseases, vol. 45, no. 6, pp. 1026–1033, 2005.
[26] S. Williams, K. Malatesta, and K. Norris, “Vitamin D andchronic kidney disease,” Ethnicity & Disease, vol. 19, no. 4,supplement 5, pp. S5-8–S5-11, 2009.
[27] K. M. Thrailkill, C. Jo, G. E. Cockrell, C. S. Moreau, and J. L.Fowlkes, “Enhanced excretion of vitamin D binding proteinin type 1 diabetes: a role in vitamin D deficiency?” Journal ofClinical Endocrinology and Metabolism, vol. 96, no. 1, pp. 142–149, 2011.
[28] H. J. C. van Hoof, R. G. L. de Sevaux, H. van Baelen et al.,“Relationship between free and total 1,25-dihydroxyvitaminD in conditions of modified binding,” European Journal ofEndocrinology, vol. 144, no. 4, pp. 391–396, 2001.
[29] R. Mehrotra, D. A. Kermah, I. B. Salusky et al., “Chronic kidneydisease, hypovitaminosis D, and mortality in the United States,”Kidney International, vol. 76, no. 9, pp. 977–983, 2009.

Submit your manuscripts athttp://www.hindawi.com
Stem CellsInternational
Hindawi Publishing Corporationhttp://www.hindawi.com Volume 2014
Hindawi Publishing Corporationhttp://www.hindawi.com Volume 2014
MEDIATORSINFLAMMATION
of
Hindawi Publishing Corporationhttp://www.hindawi.com Volume 2014
Behavioural Neurology
EndocrinologyInternational Journal of
Hindawi Publishing Corporationhttp://www.hindawi.com Volume 2014
Hindawi Publishing Corporationhttp://www.hindawi.com Volume 2014
Disease Markers
Hindawi Publishing Corporationhttp://www.hindawi.com Volume 2014
BioMed Research International
OncologyJournal of
Hindawi Publishing Corporationhttp://www.hindawi.com Volume 2014
Hindawi Publishing Corporationhttp://www.hindawi.com Volume 2014
Oxidative Medicine and Cellular Longevity
Hindawi Publishing Corporationhttp://www.hindawi.com Volume 2014
PPAR Research
The Scientific World JournalHindawi Publishing Corporation http://www.hindawi.com Volume 2014
Immunology ResearchHindawi Publishing Corporationhttp://www.hindawi.com Volume 2014
Journal of
ObesityJournal of
Hindawi Publishing Corporationhttp://www.hindawi.com Volume 2014
Hindawi Publishing Corporationhttp://www.hindawi.com Volume 2014
Computational and Mathematical Methods in Medicine
OphthalmologyJournal of
Hindawi Publishing Corporationhttp://www.hindawi.com Volume 2014
Diabetes ResearchJournal of
Hindawi Publishing Corporationhttp://www.hindawi.com Volume 2014
Hindawi Publishing Corporationhttp://www.hindawi.com Volume 2014
Research and TreatmentAIDS
Hindawi Publishing Corporationhttp://www.hindawi.com Volume 2014
Gastroenterology Research and Practice
Hindawi Publishing Corporationhttp://www.hindawi.com Volume 2014
Parkinson’s Disease
Evidence-Based Complementary and Alternative Medicine
Volume 2014Hindawi Publishing Corporationhttp://www.hindawi.com


![1 Dr Mughals Vitamin D talk [Read-Only] dr mughals vitamin d talk.pdf · Vitamin D Zulf Mughal Consultantin Paediatric Bone Disorders ... Vitamin D stores acquired during fetal life](https://img.pdfslide.net/doc/110x75/5b93e73f09d3f2012e8c317b/1-dr-mughals-vitamin-d-talk-read-only-dr-mughals-vitamin-d-talkpdf-vitamin.jpg)