Embed Size (px)
Citation preview
5/5/2017
1
1
Influences and Implications of Indoor Air Background Concentrations on Health Risks in Residences, Schools, and Commercial Buildings
Peter Scaramella Richard J. Rago Jay Peters Gina M. Plantz
Outline
2
1 Description of Indoor Air Background
Selection of Residential and Non-residential Studies
Risk Assessment Methods
Results
Discussion of Implications
2
3
4
5
Indoor Air Background • “Indoor air concentrations resulting from sources other than
vapor intrusion (i.e., ambient air and indoor sources) are commonly referred to as “background.” (EPA, 2011)
• “Information on ‘background’ contributions of site-related, vapor-forming chemicals in indoor air is important to risk managers because generally EPA does not clean up to concentrations below natural or anthropogenic background levels.” (EPA, 2015)
• EPA provides guidance in the Superfund remedy selection process (Role of Background in the CERCLA Cleanup Program, OSWER Directive No. 9285.607P, April 26, 2002)
• “Background IA sources can be broken down into several categories …household activities, consumer products, building materials and furnishings, ambient air pollution.” (NJDEP, VITG 2013)
5/5/2017
2
Indoor Air Background (continued)
• VOCs are very common in personal, indoor air (Gordon, et al, 1999; Clayton, et al, 1999; Sexton, et al, 2004; Bradley, et al, 2004, RIOPA, 2005, Rago, et al, 2007; EPRI, 2007; MT DEQ, 2012), and ambient sources (EPA, 1988; EPA, 2000)
• Higher background levels of VOCs have been observed in homes with attached garages (Kurtz, 2004; Graham, et al, 2004)
– Attached Garage > Garage, Not Attached > No Garage (McCafferty, 2006)
Indoor Air Background (continued)
• VOCs are also commonly encountered in office buildings (Girman, et al, 1999; Daisey, et al, 1994) and schools (Adgate, et al, 2004)
• Obvious potential for overlap of site contaminants from subsurface sources and personal, indoor, and ambient sources to residential and non-residential indoor air
• Requires careful consideration in vapor intrusion (VI) assessments
Residential Indoor Air Background - Data Sources Considered
• Background Indoor Air Concentrations of Volatile Organic Compounds in North American Residences (1990–2005): A Compilation of Statistics for Assessing Vapor Intrusion, EPA 530-R-10-001, June 2011
• Compiles data from 15 studies (1990-2005) for percentiles, number of samples, frequency of detection, and analytical reporting limits
• 2,898 indoor air background samples; studies focused on AZ, CA, CO, IL, MA, MN, NJ, NY, TX, OH, Ottawa
6

5/5/2017
3
Other Residential Data Sources Considered
• “Relationships of Indoor, Outdoor, and Personal Air (RIOPA),” Weisel et al, The Health Effects Institute, November 2005
– 100 indoor air background samples in Los Angeles, CA
– 100 indoor air background samples in Houston, TX
• “Typical Indoor Air Concentrations of Volatile Organic Compounds in Non-Smoking Montana Residences Not Impacted by Vapor Intrusion,” Montana Department of Environmental Quality, August 2012
– 100 indoor air background samples in Montana
7
Non-residential Data Sources Considered Indoor Air Background References
• Offices
– EPA Building Assessment Survey and Evaluation (BASE) Study (1999)
– California Health Buildings Study (Daisey et al, 1994)
– H&A: Rago et al (2013-2015; n=64); manuscript in preparation
• Schools
– Adgate et al (2004)
• Concentrations of most VOCs: O ≈ S < P ≤ H
– H&A: Rago et al (2013-2015; n=25); manuscript in preparation
8
USA TODAY – 12/8/2008 and 12/9/2008
9
5/5/2017
4
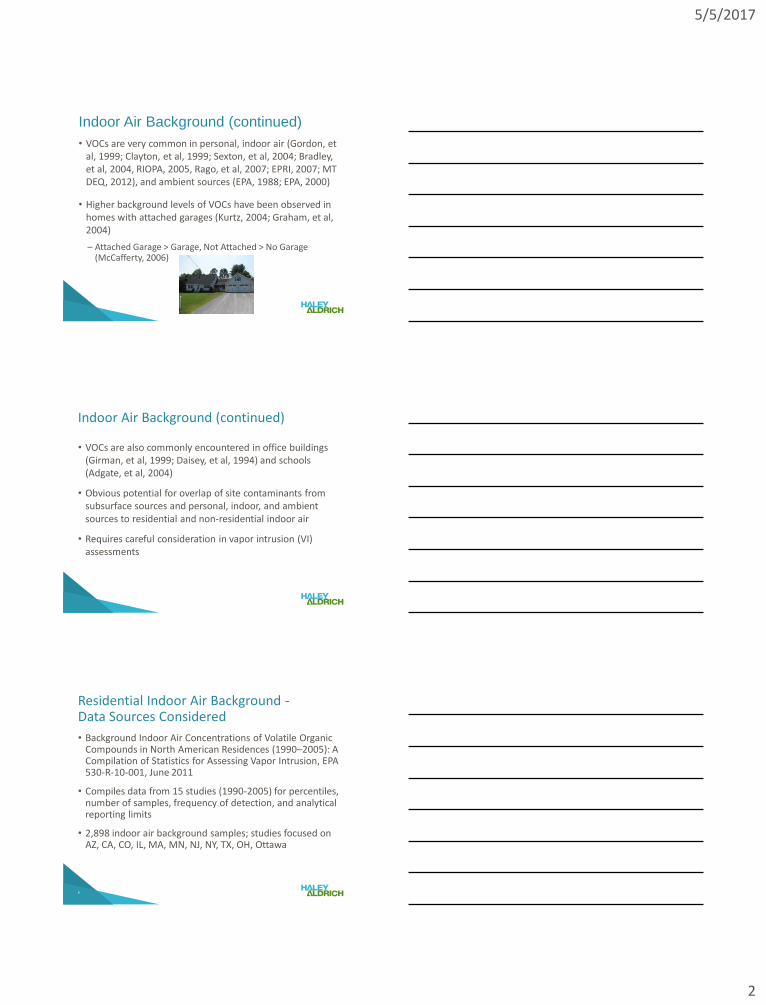
New Study Indoor Air Background Study Sampling Locations (2013-2015)
Sample locations
59 office building samples (professional, academic, and municipal)
25 school building samples (K-8, middle and high school, university)
>100 µg/m3 TCE
>100 µg/m3 TCE
(2004)
New Indoor Air Background Study (2013-2015) Analytical Focus
• Sampling conducted using fused silica lined canisters fitted with 24-hour flow controllers
– USEPA Method TO-15 (acquired in full scan mode) • ~104 target VOCS
– USEPA Method TO-15 (subset acquired in SIM mode) • ~57 target VOCs
– MassDEP Air-Phase Petroleum Hydrocarbons (APH) • 1,3-Butadiene, Methyl tert-butyl ether, Benzene, Toluene, Ethylbenzene,
p/m-Xylene, o-Xylene, Naphthalene, C5-C8 Aliphatics, C9-C12 Aliphatics, C9-C10 Aromatics
• ~15,000 data points in database
Detected VOCs and APH • Offices and schools
– Full Scan: 57 VOCs detected (of 105 tested) • 105: slight target compound list variation
– SIM: 37 VOCs detected (of 58 tested) • 4-ethyltoluene
• Offices – Full Scan: 56 VOCs detected (of 105 tested)
– SIM: 22 VOCs detected (of 58 tested)
• Schools – Full Scan: 37 VOCs detected (of 105 tested)
– SIM: 26 VOCs detected (of 57 tested)
• APH: 9/11 in offices; 6/11 in schools • methyl tert-butyl ether and 1,3-butadiene – not detected by APH
12
5/5/2017
5
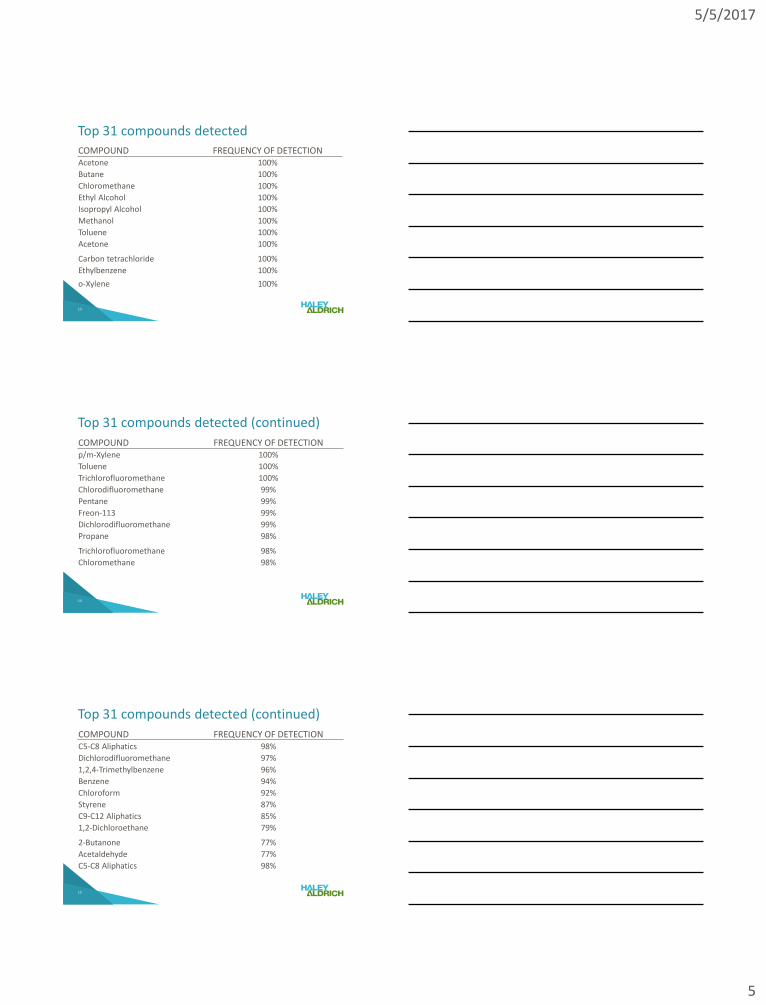
Top 31 compounds detected
13
COMPOUND FREQUENCY OF DETECTION Acetone 100%
Butane 100%
Chloromethane 100%
Ethyl Alcohol 100%
Isopropyl Alcohol 100%
Methanol 100%
Toluene 100%
Acetone 100%
Carbon tetrachloride 100%
Ethylbenzene 100%
o-Xylene 100%
Top 31 compounds detected (continued)
14
COMPOUND FREQUENCY OF DETECTION p/m-Xylene 100%
Toluene 100%
Trichlorofluoromethane 100%
Chlorodifluoromethane 99%
Pentane 99%
Freon-113 99%
Dichlorodifluoromethane 99%
Propane 98%
Trichlorofluoromethane 98%
Chloromethane 98%
Top 31 compounds detected (continued)
15
COMPOUND FREQUENCY OF DETECTION C5-C8 Aliphatics 98%
Dichlorodifluoromethane 97%
1,2,4-Trimethylbenzene 96%
Benzene 94%
Chloroform 92%
Styrene 87%
C9-C12 Aliphatics 85%
1,2-Dichloroethane 79%
2-Butanone 77%
Acetaldehyde 77%
C5-C8 Aliphatics 98%
5/5/2017
6
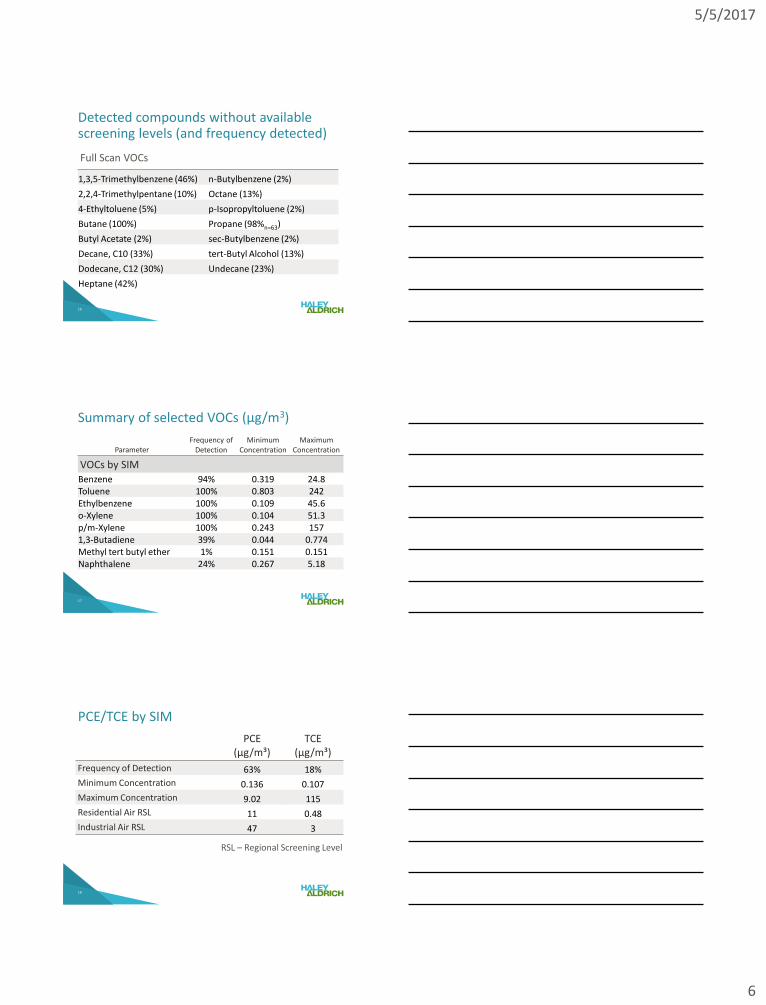
Detected compounds without available screening levels (and frequency detected)
16
Full Scan VOCs
1,3,5-Trimethylbenzene (46%) n-Butylbenzene (2%)
2,2,4-Trimethylpentane (10%) Octane (13%)
4-Ethyltoluene (5%) p-Isopropyltoluene (2%)
Butane (100%) Propane (98%n=63)
Butyl Acetate (2%) sec-Butylbenzene (2%)
Decane, C10 (33%) tert-Butyl Alcohol (13%)
Dodecane, C12 (30%) Undecane (23%)
Heptane (42%)
Summary of selected VOCs (µg/m3)
17
Parameter Frequency of
Detection Minimum
Concentration Maximum
Concentration
VOCs by SIM Benzene 94% 0.319 24.8 Toluene 100% 0.803 242 Ethylbenzene 100% 0.109 45.6 o-Xylene 100% 0.104 51.3 p/m-Xylene 100% 0.243 157 1,3-Butadiene 39% 0.044 0.774 Methyl tert butyl ether 1% 0.151 0.151 Naphthalene 24% 0.267 5.18
PCE/TCE by SIM
18
PCE (µg/m³)
TCE (µg/m³)
Frequency of Detection 63% 18%
Minimum Concentration 0.136 0.107
Maximum Concentration 9.02 115
Residential Air RSL 11 0.48
Industrial Air RSL 47 3
RSL – Regional Screening Level
5/5/2017
7
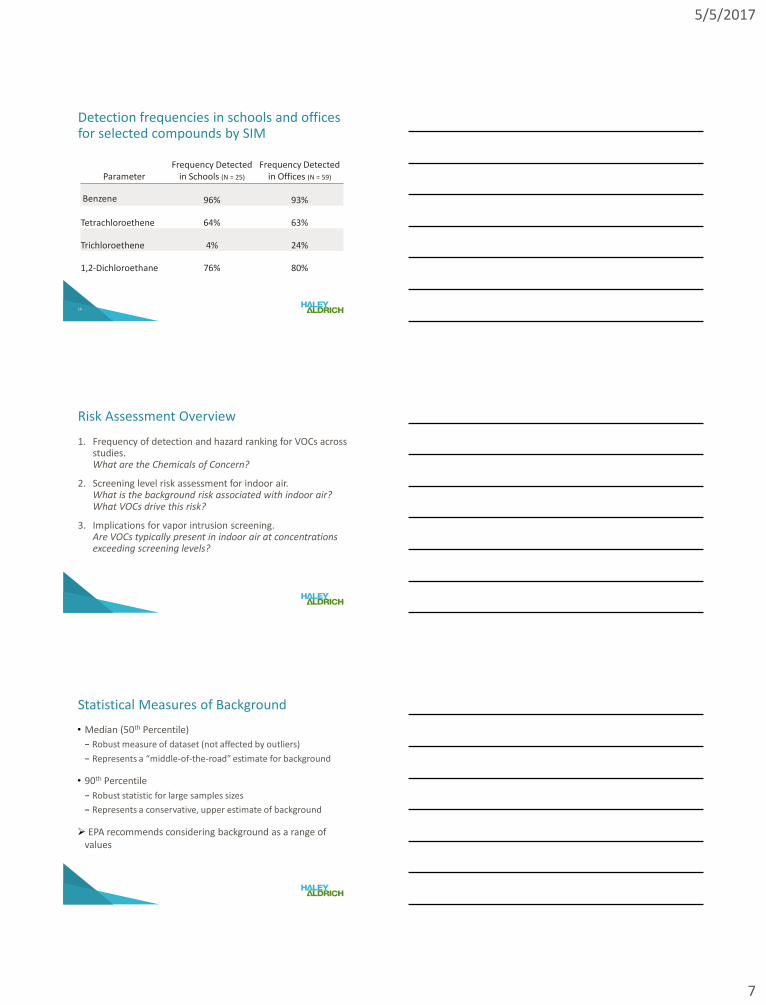
Detection frequencies in schools and offices for selected compounds by SIM
19
Parameter Frequency Detected
in Schools (N = 25)
Frequency Detected in Offices (N = 59)
Benzene 96% 93%
Tetrachloroethene 64% 63%
Trichloroethene 4% 24%
1,2-Dichloroethane 76% 80%
Risk Assessment Overview
1. Frequency of detection and hazard ranking for VOCs across studies. What are the Chemicals of Concern?
2. Screening level risk assessment for indoor air. What is the background risk associated with indoor air? What VOCs drive this risk?
3. Implications for vapor intrusion screening. Are VOCs typically present in indoor air at concentrations exceeding screening levels?
Statistical Measures of Background
• Median (50th Percentile)
− Robust measure of dataset (not affected by outliers)
− Represents a “middle-of-the-road” estimate for background
• 90th Percentile
− Robust statistic for large samples sizes
− Represents a conservative, upper estimate of background
EPA recommends considering background as a range of values
5/5/2017
8
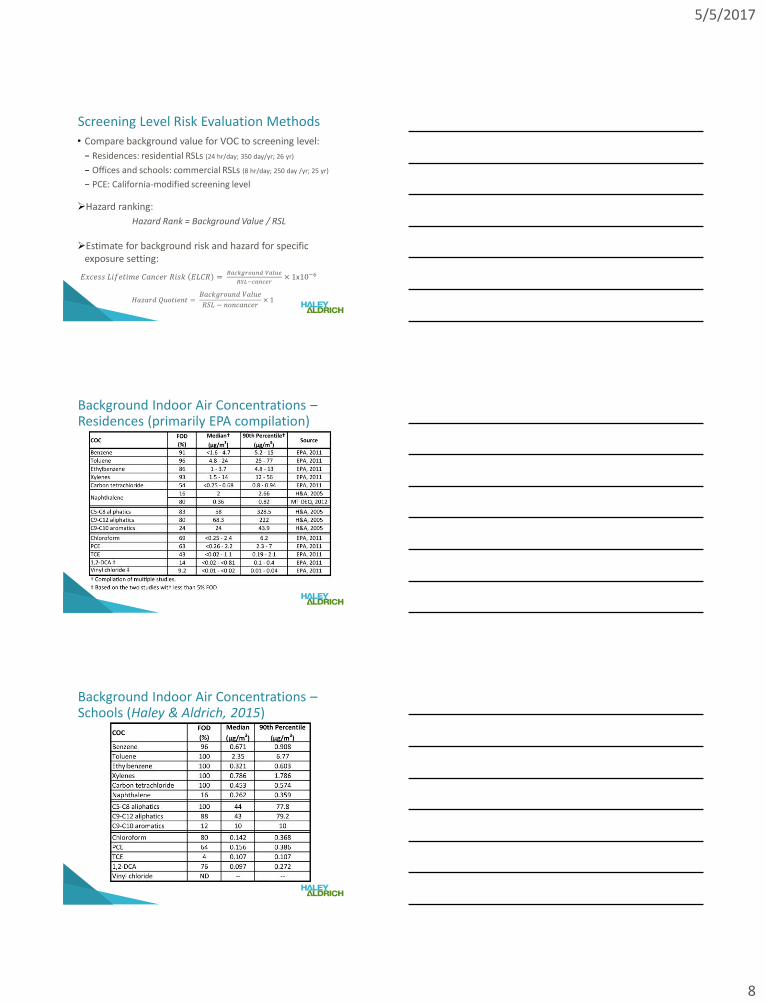
Screening Level Risk Evaluation Methods
• Compare background value for VOC to screening level:
− Residences: residential RSLs (24 hr/day; 350 day/yr; 26 yr)
− Offices and schools: commercial RSLs (8 hr/day; 250 day /yr; 25 yr)
− PCE: California-modified screening level
Hazard ranking:
Hazard Rank = Background Value / RSL
Estimate for background risk and hazard for specific exposure setting:
𝐸𝑥𝑐𝑒𝑠𝑠 𝐿𝑖𝑓𝑒𝑡𝑖𝑚𝑒 𝐶𝑎𝑛𝑐𝑒𝑟 𝑅𝑖𝑠𝑘 𝐸𝐿𝐶𝑅 = 𝐵𝑎𝑐𝑘𝑔𝑟𝑜𝑢𝑛𝑑 𝑉𝑎𝑙𝑢𝑒
𝑅𝑆𝐿−𝑐𝑎𝑛𝑐𝑒𝑟× 1x10⁻⁶
𝐻𝑎𝑧𝑎𝑟𝑑 𝑄𝑢𝑜𝑡𝑖𝑒𝑛𝑡 = 𝐵𝑎𝑐𝑘𝑔𝑟𝑜𝑢𝑛𝑑 𝑉𝑎𝑙𝑢𝑒
𝑅𝑆𝐿 − 𝑛𝑜𝑛𝑐𝑎𝑛𝑐𝑒𝑟× 1
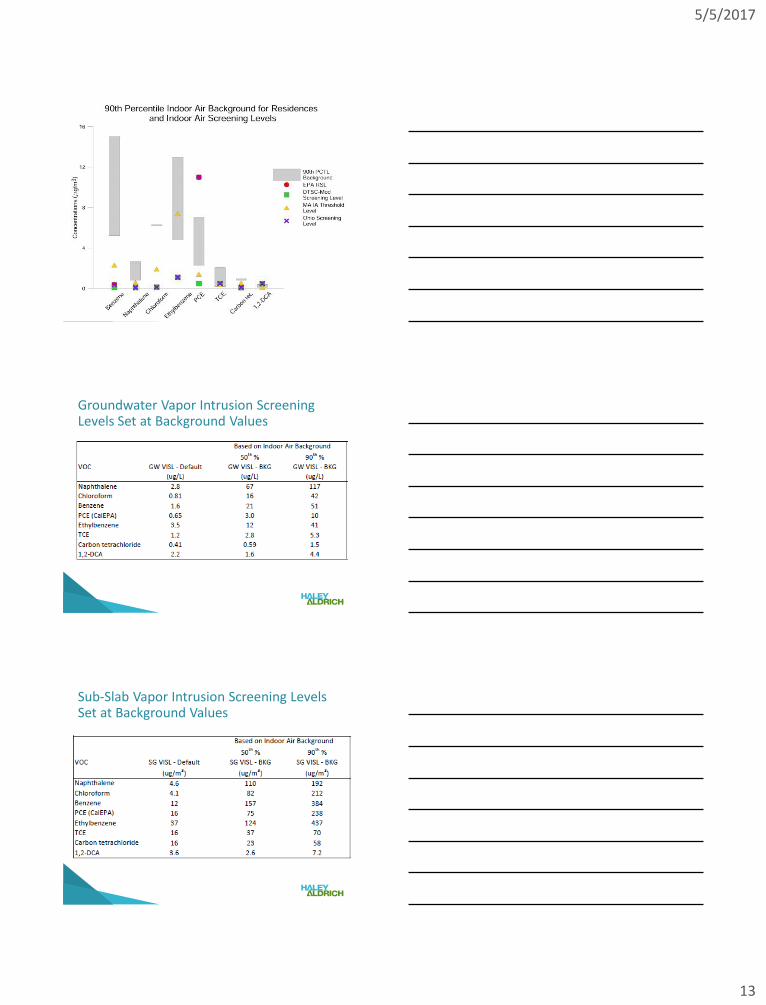
Background Indoor Air Concentrations – Residences (primarily EPA compilation)
Background Indoor Air Concentrations – Schools (Haley & Aldrich, 2015)
5/5/2017
9
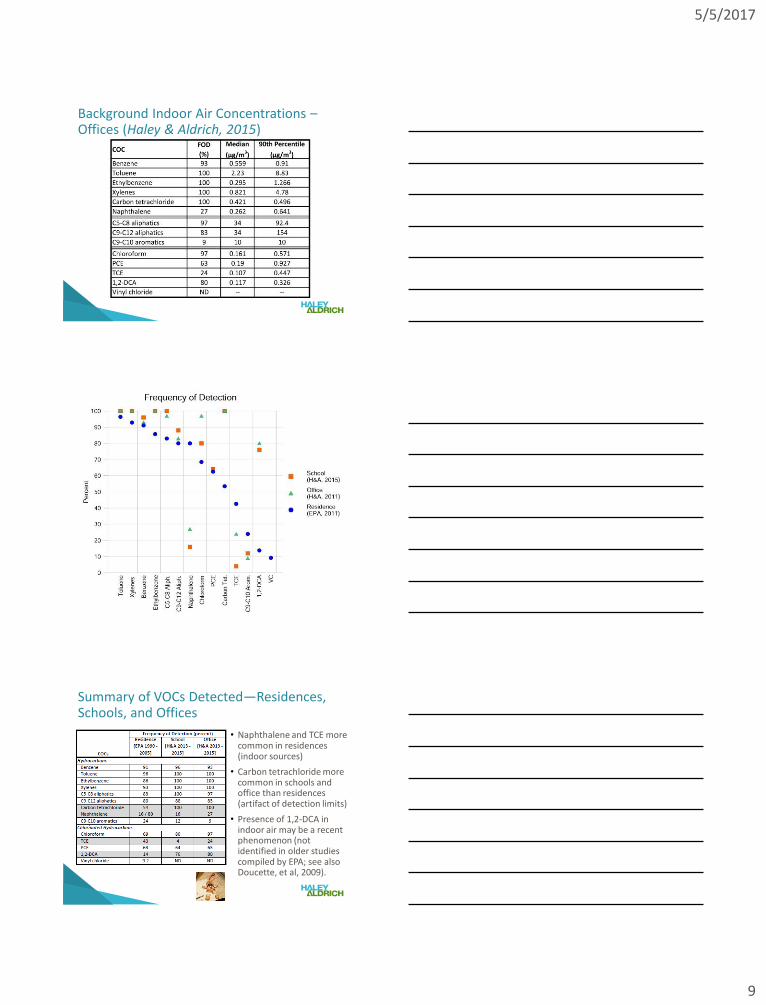
Background Indoor Air Concentrations – Offices (Haley & Aldrich, 2015)
Summary of VOCs Detected—Residences, Schools, and Offices
• Naphthalene and TCE more common in residences (indoor sources)
• Carbon tetrachloride more common in schools and office than residences (artifact of detection limits)
• Presence of 1,2-DCA in indoor air may be a recent phenomenon (not identified in older studies compiled by EPA; see also Doucette, et al, 2009).
5/5/2017
10
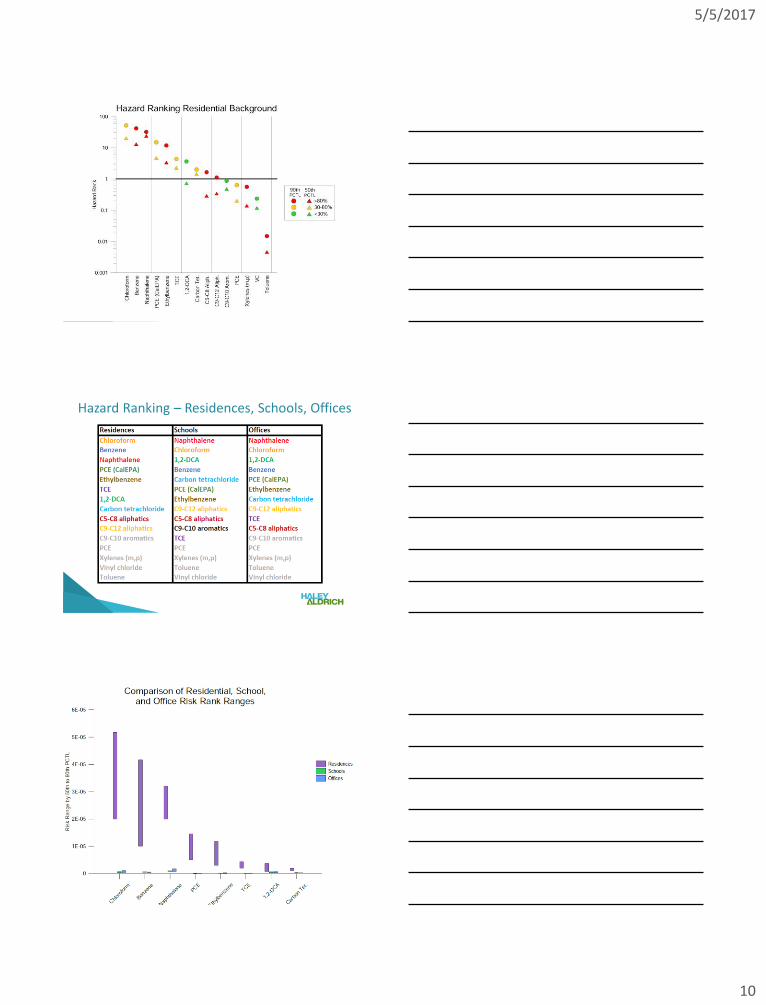
Hazard Ranking – Residences, Schools, Offices
INSERT GRAPHIC HERE: COMPARE RES, OFFICE, SCHOOL BACKGROUND FOR THE 7 COCs
5/5/2017
11
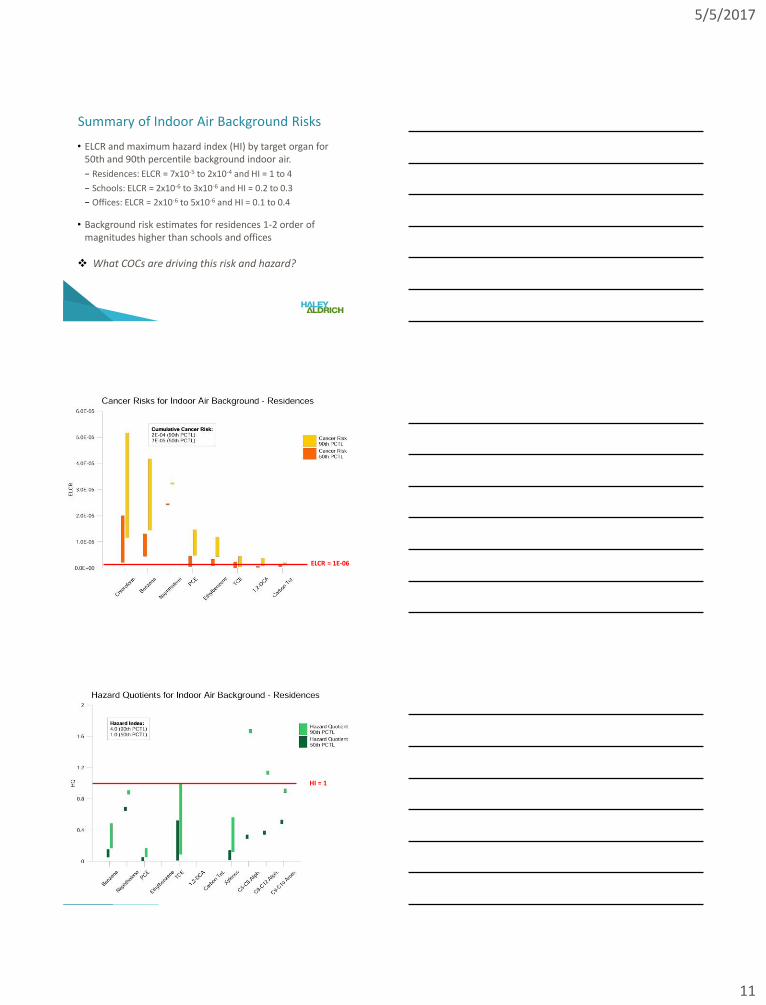
Summary of Indoor Air Background Risks
• ELCR and maximum hazard index (HI) by target organ for 50th and 90th percentile background indoor air.
− Residences: ELCR = 7x10⁻⁵ to 2x10⁻⁴ and HI = 1 to 4
− Schools: ELCR = 2x10⁻⁶ to 3x10⁻⁶ and HI = 0.2 to 0.3
− Offices: ELCR = 2x10⁻⁶ to 5x10⁻⁶ and HI = 0.1 to 0.4
• Background risk estimates for residences 1-2 order of magnitudes higher than schools and offices
What COCs are driving this risk and hazard?
ELCR = 1E-06
HI = 1
5/5/2017
12
5/5/2017
13
Groundwater Vapor Intrusion Screening Levels Set at Background Values
Sub-Slab Vapor Intrusion Screening Levels Set at Background Values
5/5/2017
14
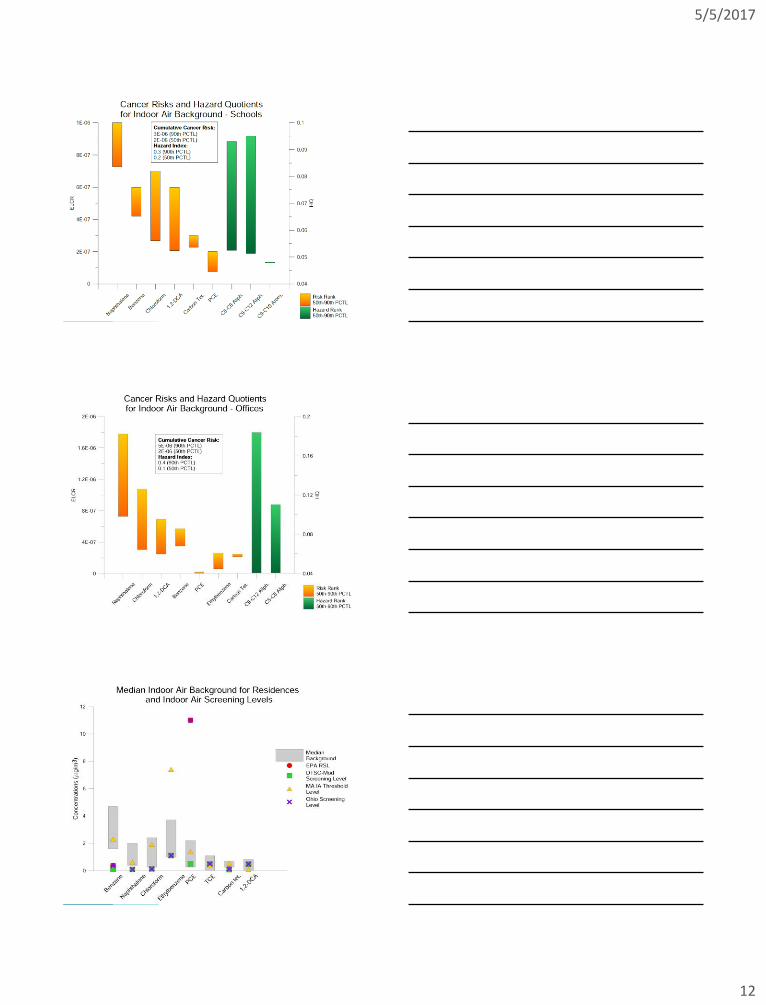
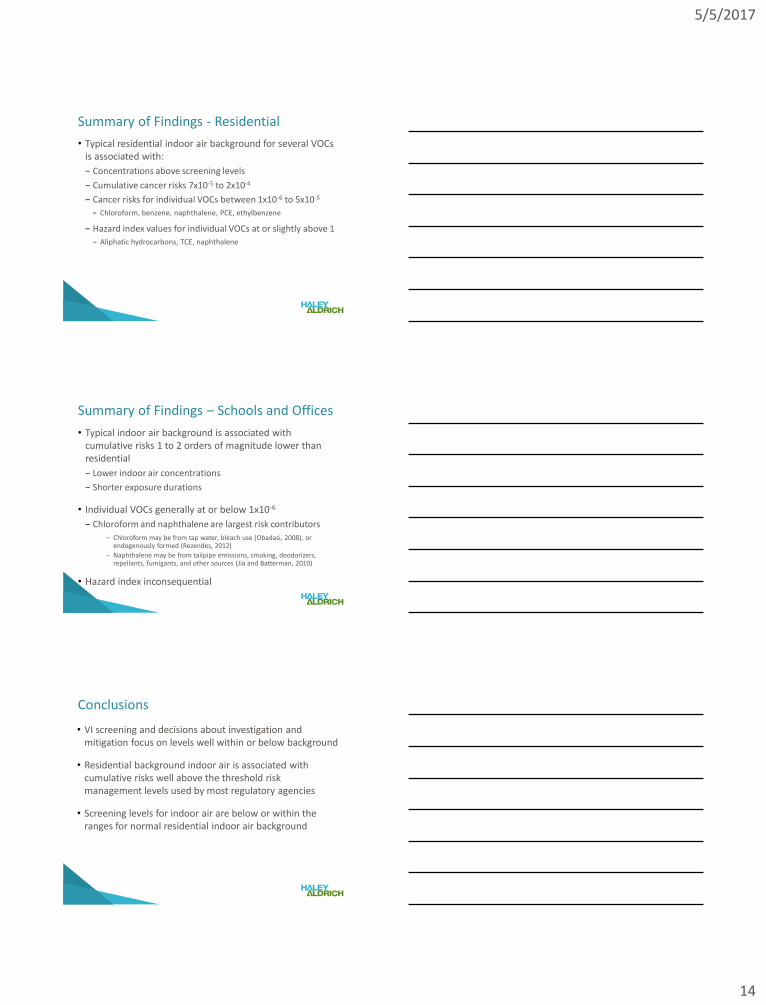
Summary of Findings - Residential
• Typical residential indoor air background for several VOCs is associated with:
− Concentrations above screening levels
− Cumulative cancer risks 7x10⁻⁵ to 2x10⁻⁴
− Cancer risks for individual VOCs between 1x10⁻⁶ to 5x10⁻⁵
− Chloroform, benzene, naphthalene, PCE, ethylbenzene
− Hazard index values for individual VOCs at or slightly above 1
− Aliphatic hydrocarbons, TCE, naphthalene
Summary of Findings – Schools and Offices
• Typical indoor air background is associated with cumulative risks 1 to 2 orders of magnitude lower than residential
− Lower indoor air concentrations
− Shorter exposure durations
• Individual VOCs generally at or below 1x10⁻⁶
− Chloroform and naphthalene are largest risk contributors
− Chloroform may be from tap water, bleach use (Obadasi, 2008), or endogenously formed (Rezendes, 2012)
− Naphthalene may be from tailpipe emissions, smoking, deodorizers, repellants, fumigants, and other sources (Jia and Batterman, 2010)
• Hazard index inconsequential
Conclusions
• VI screening and decisions about investigation and mitigation focus on levels well within or below background
• Residential background indoor air is associated with cumulative risks well above the threshold risk management levels used by most regulatory agencies
• Screening levels for indoor air are below or within the ranges for normal residential indoor air background
5/5/2017
15
References
1. New Jersey Department of Environmental Protection; Vapor Intrusion Technical Guidance; March 2013.
2. U.S. Environmental Protection Agency, Office of Solid Waste and Emergency Response, Office of Emergency and Remedial Response Role of Background in the CERCLA Cleanup Program, OSWER 9285.6-07P, April 26, 2002,
3. S.M. Gordon P.J. Callahan, M.G. Nishioka, M.C. Brinkman, M.K. ORourke, M.D. Lebowitz, and D.J. Moschandreas, Residential environmental measurements in the National Human Exposure Assessment Survey (NHEXAS) pilot study in Arizona: preliminary results for pesticides and VOCs, Journal of Exposure Analysis and Environmental Epidemiology. Vol. 9, pp. 456-470 (1999).
4. C.A. Clayton, E.D. Pellizzari, R.W. Whitmore, R.L. Perritt and J.J. Quackenboss, “National Human Exposure Assessment Survey (NHEXAS): distributions and associations of lead, arsenic and volatile organic compounds in EPA Region 5,” Journal of Exposure Analysis and Environmental Epidemiology. Vol. 9, pp. 381-392 (1999).
5. L. Bradley, ENSR International, Westford, MA and J. Ferry, NiSource Inc., Columbus, OH, “Background Levels of Benzene in Indoor and Outdoor Air”, poster 2004.
6. Relationships of Indoor, Outdoor, and Personal Air (RIOPA). Health Effects Institute, Houston, TX. November 2005. Report Number 7.
7. Rago, Richard J., McCafferty, R., and Lingle, J., “An Evaluation of Indoor Air Background Data and Residential Indoor Air Data Obtained From Soil Vapor Intrusion Assessments At Former Manufactured Gas Plant (MGP) Sites In New York,” Pp. 256-277, proceedings of the Air and Waste Management Association - Vapor Intrusion Specialty Conference; September 2007.
8. EPRI, Palo Alto, CA, “Residential Indoor Air Background Data – A Comparison of Indoor Air Results from Vapor Intrusion Studies at MGP Sites in New York,” publication #1012590, 2007.
References
9. Montana Department of Environmental Quality, Typical Indoor Air Concentrations of Volatile Organic Compounds in Non-Smoking Montana Residences Not Impacted by Vapor Intrusion, August 2012
10. Hodgson, A.T., A.F. Rudd, D. Beal and S. Chandra. “Volatile Organic Compound Concentrations and Emission Rates in New Manufactured and Site-built Houses,” Indoor Air 10: 178-192. Report No. LBNL-43519, 2000.
11. U.S. Environmental Protection Agency, Atmospheric Sciences Research Laboratory. National Ambient Volatile Organic Compounds (VOCs) Data Base Update. EPA/600/3-88/010(a). Research Triangle Park, NC, 1988.
12. U.S. Environmental Protection Agency, Office of Air Quality Planning and Standards. National Pollutant Emission Trends 1990-1998. EPA-454/R-00-002. Research Triangle Park, NC, 2000.
13. J.P. Kurtz and D.J. Folkes, “Indoor Air Background Subpopulations and Seasonality at the CDOT MTL Site,” Denver, Colorado. UMass Soils Conference presentation, 2004.
14. L. Graham, L. Noseworthy, D. Fugler, K. O’Leary, D. Karman, C. Grande, “Contribution of Vehicle Emissions from an Attached Garage to Residential Indoor Air Pollution Levels,” Journal of the Air and Waste Management Association (2004);54:563-584 (2004).
15. R. McCafferty, Study of Background Levels of Air-Phase Petroleum Hydrocarbons in Massachusetts Residences, Tufts University thesis submittal, 2006.
16. J.R. Girman, G.E. Hadwen, L.E. Burton, S.E. Womble, and J.F. McCarthy. Individual Volatile Organic Compound Prevalence and Concentrations in 56 Buildings of the Building Assessment Survey and Evaluation (Base) Study. (1999).
References
17. J.M. Daisey, A.T. Hodgson, W.J. Fisk, M.J. Mendell, and J.T. Brinke, “Volatile Organic Compounds in Twelve California Office Buildings: Classes Concentrations and Sources,” Atmospheric Environment. Vol. 28, No. 22, pp. 3557-3562, 1994.
18. J.L. Adgate, T.R. Church, A.D. Ryan, G. Ramachandran, A.L. Fredrickson, T.H. Stock, M.T. Morandi, and K. Sexton, “Outdoor, Indoor, and Personal Exposure to VOCs in Children,”. Environmental Health Perspectives. Vol. 112, No. 14, p. 423, 2004.
19. Background Indoor Air Concentrations of Volatile Organic Compounds in North American Residences (1990–2005): A Compilation of Statistics for Assessing Vapor Intrusion, EPA 530-R-10-001, June 2011
20. Foster, S.J., J.P. Kurtz, and A.K. Woodland. Background indoor air risks at selected residences in Denver Colorado. In Proceedings: Indoor Air 2002, the proceedings of the 9th International Conference on Indoor Air Quality and Climate, Monterey, CA, June 30–July 5, p. 932-937, 2002.
21. Kurtz, J.P., and D.J. Folkes. Background concentrations of selected chlorinated hydrocarbons in residential indoor air. Pp. 920–925 in Proceedings: Indoor Air 2002, the proceedings of the 9th International Conference on Indoor Air Quality and Climate, Monterey, CA, June 30–July 5, 2002.
22. Kurtz, J.P., Wolfe, E.M., Woodland, A.K., and Foster, S.J., Evidence for increasing indoor sources of 1,2-dichloroethane since 2004 at two Colorado residential vapor intrusion sites. Ground Water Monitoring & Remediation: 30(3):107-112., 2010.
23. Rago, R., R. McCafferty, and A. Rezendez. Background Residential Indoor Air Quality in Massachusetts. In Proceedings of the Association for Environmental Health and Science Vapor Intrusion Workshop, Amherst, MA, October, 2004, October 2005.
24. Weisel, C.P., J. Zhang, B.J. Turpin, M.T. Morandi, S. Colome, T.H. Stock, D.M Spektor, et al. Relationships of Indoor, Outdoor, and Personal Air (RIOPA): Part 1. Collection Methods and Descriptive Analyses. HEI Research Report 130; NUATRC Research Report 7. Health Effects Institute, Boston, MA; Mickey Leland National Urban Toxics Research Center, Houston, TX, 2005. Available at http://pubs.healtheffects.org/view.php?id=31
5/5/2017
16
References
25. Weisel, C.P. Investigation of Indoor Air Sources of VOC Contamination. Final Report, Year 2, SR03-033. New Jersey Department of Environmental Protection. October 2006.
26. Weisel, C.P., S. Alimokhtari, and P.F. Sanders. Indoor air VOC concentrations in suburban and rural New Jersey. Environmental Science & Technology 42(22):8231–8238.
27. Zhu, J., R. Newhook, L. Marro, and C. Chan. 2005. Selected volatile organic compounds in residential air in the City of Ottawa, Canada. Environmental Science & Technology 39(11):3964–3971, 2008.
28. K. Sexton, J.L. Adgate, G. Ramachandran, G.C. Pratt, S.J. Mongin, T.H. Stock and M.T. Morandi, “Comparison of Personal, Indoor, and Outdoor Exposures to Hazardous Air. Pollutants in Three Urban Communities,” Environ. Sci. Technol. Vol. 38, No. 2, pp. 423-430 2004
29. Sexton K, Greaves IA, Church TR, Adgate JL, Ramachandran G, Tweedie RL, et al. A school-based strategy to assess children's environmental exposures and related health effects in economically disadvantaged urban neighborhoods. J Expo Anal Environ Epidemiol 10:682-694, 2000.
30. Sexton K, Adgate J, Church T, Greaves I, Ramachandran G, Fredrickson A, et al. Recruitment, retention, and compliance results from a probability study of children's environmental health in economically disadvantaged neighborhoods. Environ Health Perspect 111 :731-736, 2003.
31. Mukerjee, S., W. Ellenson, R.G. Lewis, R.K. Stevens, M.C. Somerville, D.S. Shadwick, and R.D Willis. An environmental scoping study in the Lower Rio Grande Valley of Texas—III. Residential microenvironmental monitoring for air, house dust, and soil. Environment International 23(5):657–673, 1997.
32. NYSDOH (New York State Department of Health). Study of Volatile Organic Chemicals in Air of Fuel Oil Heated Homes. In: Final NYSDOH Soil Vapor Intrusion Guidance. Appendix C.1. http://www.health.state.ny.us/environmental/investigations/soil_gas/svi_guidance/docs/svi_appendc.pdf . October 2006.
References
33. Heavner, D.L., W.T. Morgan, and M.E. Ogden. Determination of volatile organic compounds and ETS apportionment in 49 homes. Environmental International 21(1):3–21, 1995.
34. Heavner, D.L., W.T. Morgan, and M.W. Ogden. Determination of volatile organic compounds and respirable suspended particulate matter in New Jersey and Pennsylvania homes and workplaces. Environment International 22(2):159–183, 1996.
35. Sheldon, L., A. Clayton, B. Jones, J. Keever, R. Perritt, D. Smith, D. Whitaker, and R. Whitmore. Indoor Pollutant Concentrations and Exposures. Final Report. California Air Resources Board Report No. A833-153. Prepared for the California Air Resources Board by Research Triangle Institute, Research Triangle Park, NC. January 1992.
36. Van Winkle, M.R., and P.A Scheff. Volatile organic compounds, polycyclic aromatic hydrocarbons and elements in the air of 10 urban homes. Indoor Air 2001 11:49–64, 2002.
37. Doucette, W.J., Hall, A. J., and Gorder, K.A. Emissions of 1,2-dichloroethane from holiday decorations as a source of indoor air contamination. Ground Water Monitoring & Remediation: V30 N1; p. 67-73, 2009.
38. Obadasi, M., “Halogenated Volatile Organic Compounds from the Use of Chlorine Bleach Containing Household Products,” Environ. Sci. Technol. 2008, 42, 1445-1461.
39. Rezendes, A., Elcoate, W., and Raposo, M., “The Potential Formation and Off-Gassing of Trihalomethanes (THMs) and Other VOCs into Soil Vapor and Ambient Air,” presented to the AWMA Vapor Intrusion Conference, Denver, CO, October 2012.
40. Jia, Chunrong and Batterman, Stuart, “A Critical Review of Naphthalene Sources and Exposures Relevant to Indoor and Outdoor Air,” International Journal of Environmental Research and Public Health, ISSN 1660-1601, July 2010 .
Thank You! Richard Rago, Jay Peters, Gina Plantz, and Peter Scaramella Haley & Aldrich, Inc. Tel. 860.290.3115 Cell 617.719.6128 [email protected]


![Index [] · Spray Slidy 11 TABLETENNISTABLES 12-16 TABLES Basic 13 Training Indoor 13 Progress Indoor 13 Challenge Indoor 13 Advance Indoor 13 Master Indoor 14 Club Indoor 14](https://img.pdfslide.net/doc/110x75/609ea898873dde113652cff3/index-spray-slidy-11-tabletennistables-12-16-tables-basic-13-training-indoor.jpg)