Embed Size (px)
Citation preview

Research Report DCSF-RR007
Influences on Children’sDevelopment andProgress in Key Stage 2:Social/behaviouraloutcomes in Year 5
Pam Sammons$, Kathy Sylva+, Edward Melhuish#,Iram Siraj-Blatchford*, Brenda Taggart*,Sofka Barreau* and Yvonne Grabbe*
$University of Nottingham, +University of Oxford,#Birkbeck, University of London and *Institute of Education, University of London

Effective Pre-school and Primary Education 3-11 Project(EPPE 3-11)
Influences on Children’s Development andProgress in Key Stage 2:
Social/behavioural outcomes in Year 5
Pam Sammons$, Kathy Sylva+, Edward Melhuish#,Iram Siraj-Blatchford*, Brenda Taggart*, Sofka Barreau*
and Yvonne Grabbe*
$University of Nottingham, +University of Oxford, #Birkbeck, University of Londonand *Institute of Education, University of London
The views expressed in this report are the authors’ and do not necessarily reflect those of the Department for Children, Schoolsand Families.
© Institute of Education, University of London 2007ISBN 978 1 84775 024 2
Research Report NoDCSF-RR007

THE EPPE 3-11 RESEARCH TEAM
Principal Investigators
Professor Kathy SylvaDepartment of Educational Studies, University of Oxford00 44 (0)1865 274 008 / email [email protected]
Professor Edward MelhuishInstitute for the Study of Children, Families and Social IssuesBirkbeck University of London00 44 (0)207 079 0834 / email [email protected]
Professor Pam SammonsSchool of Education, University of Nottingham00 44 (0)115 951 4434 / email [email protected]
Professor Iram Siraj-BlatchfordInstitute of Education, University of London00 44 (0)207 612 6218 / email [email protected]
*Brenda TaggartInstitute of Education, University of London00 44 (0)207 612 6219 / email [email protected]
Research Officers
Dr Sofka BarreauInstitute of Education, University of London00 44 (0)207 612 6608 / email [email protected]
Dr Yvonne GrabbeInstitute of Education, University of London00 44 (0)207 612 6608 / email [email protected]
Database Manager
Dr Stephen HuntInstitute of Education, University of London00 44 (0)207 612 6684 / email [email protected]
Tracking Officer
Wesley WelcommeInstitute of Education, University of London00 44 (0)207 612 6684 / email [email protected]
*Also Research Co-ordinator

ACKNOWLEDGEMENTS
The EPPE 3-11 project is a major longitudinal study funded by the Department for Children, Schoolsand Families (DCSF). The research would not be possible without the support and co-operation ofthe six Local Authorities (LAs) and the many pre-school centres, primary schools, children andparents participating in the research. We are particularly grateful to Wesley Welcomme for hiscontribution in preparing this report.
Address for correspondence:
EPPE 3-11 ProjectRoom 416Institute of EducationUniversity of London Tel: +44 (0) 207 612 621920 Bedford Way Fax:+44 (0) 207 612 6230London WC1H 0AL Email [email protected] Website http://www.ioe.ac.uk/projects/eppe

Contents Page Number
Executive Summary ....................................................................................................................... i
Introduction ................................................................................................................................... 1
Background............................................................................................................................... 1
Children’s Educational Outcomes in Key Stage 2....................................................................... 1
Aims.......................................................................................................................................... 2
Methods .................................................................................................................................... 2
Structure of the Report and Analyses......................................................................................... 4
Section 1: Characteristics of the sample at the end of Year 5 .................................................... 5
Section 2: Social/behavioural assessment and data analysis .................................................... 8
2.1 Associations between social/behavioural development and cognitive attainment and
between the different aspects of social behaviour over time ....................................................... 9
2.2 Multilevel model estimates of prior social/behaviour measures on Year 5
social/behavioural outcomes.................................................................................................... 11
Section 3: Links between Child and Family Characteristics and Children’s Social Behaviour
in Year 5....................................................................................................................................... 12
3.1 Child Measures.................................................................................................................. 12
Gender ..............................................................................................................................12
Birth weight........................................................................................................................13
Language ..........................................................................................................................13
Ethnic Groups....................................................................................................................14
Health, behavioural and developmental problems and Special Education Needs ................16
Siblings .............................................................................................................................17
Summary of child measures...............................................................................................18
3.2 Family measures ............................................................................................................... 18
Mother’s qualification .........................................................................................................18
Father’s qualification ..........................................................................................................19
Absent fathers ...................................................................................................................20
Marital status and maternal employment ............................................................................20
Family earned income........................................................................................................20
Free school meals (FSM)...................................................................................................21
Socio-Economic Status (SES)............................................................................................21
Multiple Disadvantage........................................................................................................22
Summary of Family measures............................................................................................22
3.3 Home Learning Environment (HLE).................................................................................... 22

Early years Home Learning Environment (HLE) .................................................................22
Key Stage 1 (KS1) Home Learning Environment (HLE) ......................................................23
3.4 An overview of the social/behavioural dimensions .............................................................. 25
‘Hyperactivity’ ....................................................................................................................25
‘Self-regulation’..................................................................................................................26
‘Anti-social’ behaviour ........................................................................................................27
‘Pro-social’ behaviour.........................................................................................................28
Section 4: Exploring the Impact of Background Factors on Children’s Social/Behavioural
developmental level and developmental progress over time.................................................... 29
4.1 Exploring the Impact of Background Factors on Children’s Social/Behavioural
developmental level in Year 5 Compared to Year 1 .................................................................. 29
Child Measures..................................................................................................................29
Family Measures ...............................................................................................................31
Early Years Home Learning Environment (HLE) Measures.................................................32
4.2 Estimating social/behavioural developmental progress over time........................................ 32
Section 5: The overall impact of background characteristics and prior developmental level
on social/behavioural development ........................................................................................... 36
5.1 Null models........................................................................................................................ 36
5.2 Contextualised and Simple value added models................................................................. 36
Intra-school correlations.....................................................................................................37
Child level variance - differences between individual children .............................................38
School level variance - differences between schools ..........................................................38
Total variance ....................................................................................................................39
Section 6: Pre-school quality and effectiveness and primary school effectiveness................ 40
6.1 The effect of attending pre-school compared to none ......................................................... 40
6.2 The impact of pre-school effectiveness (as measured by value added analyses) ................ 40
6.3 The impact of pre-school quality......................................................................................... 42
6.4 Primary school academic effectiveness (measured by value added analyses) .................... 44
6.5 An overview of pre- and primary school effects................................................................... 45
6.6 The combined impact of pre-school quality and primary school academic effectiveness...... 46
Section 7: Summary and Conclusions ....................................................................................... 52
7.1 Background influences and the Home Learning Environment (HLE) ................................... 52
7.2 Educational experiences .................................................................................................... 53
7.3 Implications ....................................................................................................................... 55
References .................................................................................................................................. 57
Appendix 1: EPPE Technical Papers in the series..................................................................... 60
Appendix 2: Details of Selected Measures used in the EPPE Study......................................... 62

Appendix 3: Methodology for the social/behavioural analysis ................................................. 64
Appendix 4: Details of normalisation procedures ..................................................................... 67
Appendix 5: EPPE 3-11 imputation of missing data .................................................................. 68
Appendix 6: Results of contextualised multilevel analyses...................................................... 69
Appendix 7: Effect Sizes ............................................................................................................. 74
Appendix 8: Glossary of terms................................................................................................... 75

i
Executive Summary
The Effective Pre-school and Primary Education Project 3-11 (EPPE 3-11) is a largescale longitudinal study of the influence of pre-school and primary school on children’scognitive and social/behavioural development. The study originally followed children fromthe start of pre-school (at age 3 years plus) through to primary school entry and thenacross Key Stage 1 (KS1). Over 3000 children and 141 pre-school centres wereincluded in the first phase of the research. Children were tracked from age 3 years to theend of KS1 in primary school at age 7 years.
The follow-up phase of the research investigates the development of the same group ofchildren across Key Stage 2 (KS2) of primary education (7 to 11 years). It consists ofthree “Tiers”. Tier 1 involves the analysis of primary school academic effectivenessacross all primary schools in England using value added approaches measuring pupilprogress for three successive cohorts across KS2 in terms of National Assessmentoutcomes (Melhuish et al., 2006a; 2006b). Tier 2 focuses on the academic andsocial/behavioural progress of around 2,500 children in the original sample and uses theresults from Tier 1 to provide measures of primary school academic effectiveness for theschools attended by EPPE 3-11 children. Tier 3 explores variations in teachers’classroom practices during Key Stage 2 by focusing on a sample of 125 schools andYear 5 classes drawn from the 850 plus primary schools that the EPPE children attended(see Sammons et al., 2006). This paper is part of the Tier 2 analysis of the project andinvestigates children’s social/behavioural development in Year 5 of primary school (age10). A separate paper reports the equivalent findings related to children’s Reading andMathematics attainment at this same age (Sammons et al; 2007).
Key Findings1 Four main dimensions of children’s social/behavioural development were
identified based on teachers’ assessments of individual children: ‘Self-regulation’, ‘Hyperactivity’ ‘Pro-social’ behaviour and ‘Anti-social’ behaviour.Overall the vast majority of children are rated positively (show good socialbehaviour) at age 10, but there is still variation and a small proportion (6.1%) areidentified as showing behavioural problems. As with cognitive outcomes inReading and Mathematics social behaviour is found to be affected by children’sbackground characteristics and their pre-school and educational experiences.
2 Child, family and Home Learning Environment (HLE) factors remain importantinfluences on children’s social/behavioural development at age 10, especially on‘Hyperactivity’ and ‘Self-regulation’.
3 There is no longer an effect of pre-school centre-based child care (below 2years) upon ‘Anti-social’ behaviour. By contrast, there remains a longer termpositive effect of attending a pre-school in terms of ‘Pro-social’ behaviour.
4 Overall it appears that ‘just’ attending a pre-school is not sufficient to ensurebetter social/behavioural development in the longer term, except for ‘Pro-social’behaviour. However, children who attend higher quality pre-schools show themost benefits in all aspects of social development. This supports earlier findingsat both entry to primary school and in Year 1 that consistently indicate thathigher pre-school quality has a positive impact on both cognitive andsocial/behavioural development.
ii
5 In line with findings on cognitive development, pre-school quality still affectschildren’s social behaviour at age 10. Similarly measures of pre-schooleffectiveness are also associated with better social development at age 10.Children who attended a more effective pre-school (one that was associated withbetter social/behavioural development before they started primary school)continued to show longer term benefits.
6 Children who had attended a more academically effective primary schoolshowed reduced ‘Anti-social’ behaviour at age 10, although academiceffectiveness did not show a significant association with other aspects of socialbehaviour.1
7 The influence of pre-schools and primary schools on children’ssocial/behavioural outcomes are most clearly seen when the levels of pre-schoolquality and primary school academic effectiveness are analysed in combination.
8 Comparing different combinations of pre-school quality and primary schooleffectiveness reveals that medium and particularly high quality pre-school canhelp to protect the child against the disadvantage of attending a lowacademically effective primary school in terms of several social/behaviouraloutcomes including ‘Hyperactivity’, ‘Self-regulation’ and ‘Pro-social’ behaviour.
9 The combination of the Home Learning Environment (HLE) and pre-schoolquality is important. High HLE on its own is not enough. Children who had ahigh Early years HLE and went to a poor quality pre-school showed worseoutcomes in Self-regulation at age 10 than those who had a high Early yearsHLE and went to a medium or high quality pre-school.
10 Children with low HLE are especially vulnerable, irrespective of pre-schoolquality, in terms of Self-regulation at age 10.
11 A child who has three of the following characteristics: a) experienced a goodHome Learning Environment (HLE) in the early years, b) attended a high qualitypre-school, c) and moved on to attend a highly academically effective primaryschool will tend to do better than a child with two, who will do better than a childwith one or none of these characteristics. Hence, it is the combination of thesethree aspects, HLE, pre-school and primary school over time that is important forpromoting positive longer term outcomes in children’s social/behaviouraldevelopment. The child who has a better Early years HLE, goes to a highquality, effective pre-school setting followed by a more academically effectiveprimary school appears to have a combination of ‘protective’ experiences thatare more likely to benefit social/behavioural development.
12 These findings on the benefits of this combination of protective experiencesmirror those found for the same sample of children’s results in attainment inReading and Mathematics at age 10. Thus, we conclude that the educationalexperiences that tend to benefit social/behavioural development are similar tothose that benefit cognitive outcomes in the longer term. This has importantimplications for the achievement of good all round development for children andthus the Every Child Matters agenda.
1 As might be expected the benefits of attending a more academically effective primary school showed strongerpositive associations with children’s reading and mathematics outcomes at this age.

iii
Aims• To explore the impact of child, parent and Home Learning Environment (HLE)
characteristics on children’s social/behavioural development at age 10.• To explore evidence of any continuing pre-school influences on children’s
subsequent social/behavioural development.• To examine the combined impact of a ‘good’ Early years Home Learning
Environment (HLE) and ‘good’ pre-school on social/behavioural development at age10.
• To investigate the net influence of primary school academic effectiveness onsocial/behavioural development.
• To investigate the interactive effect of pre-school experience and primary schoolexperience on social/behavioural outcomes in Year 5.
MethodsAn educational effectiveness research design was adopted to explore the influence ofdifferent child, family, and HLE factors on a range of child outcomes (Sammons et al.,2005; Siraj-Blatchford et al., 2006). The analyses show the net effects of differentpersonal, familial and educational influences on young children's social/behaviouraldevelopment. Social/behavioural development was assessed by teachers using anextended version of the Goodman (1997) Strengths and Difficulties Questionnaire. Thispaper focuses on four measures of social/behavioural development: ‘Self-regulation’,‘Hyperactivity’ ‘Pro-social’ behaviour and ‘Anti-social’ behaviour, as rated by the classteacher at the end of Year 5.
Background information on child, parent and family characteristics was obtained throughparent interviews conducted soon after children were recruited to the original pre-schoolstudy. The parent interviews collected information about a child’s health and carehistory, details of family structure and parents’ educational and occupationalbackgrounds as well as parent-child activities and routines. The later information wasused to create an Early years Home Learning Environment (HLE) index.
Background information was again collected during KS1 using a parental questionnaire.This information was used to update background measures such as marital status,number of siblings, employment etc. In addition, this parents’ questionnaire was used tocollect additional measures of the HLE when children were age KS1 to complementinterview based information on the Early years HLE. The individual items wereaggregated to form four factors representing different parental activities during Key Stage1 (KS1): ‘Home computing’, ‘One-to-one interaction’, ‘Enrichment outings’ and‘Expressive play’.
Statistical analyses (contextualised multilevel models) were used to identify the unique(net) contribution of individual background characteristics to children’s social/behaviouraldevelopment at the end of year 5 (age 10), as well as their combined overall influence.These analyses are equivalent to those conducted during the first phase of the researchwhen children entered pre-school and again when they started primary school. Similarmodels were also used to explore children’s attainments in Reading and Mathematics atage 10 (see Sammons et al., 2007).
Value added multilevel models were then used to investigate changes in children’ssocial/behavioural outcomes over time (from age 6 to age 10) by including prior

iv
social/behavioural measures (collected in Year 1 of primary school) in addition toinformation about background characteristics in the statistical analyses.
The earlier analyses over the pre-school period showed that variations in the quality andeffectiveness of the individual pre-school centre attended by children before they startedprimary school, and the time (duration in months) in pre-school had a positive impact onchildren’s cognitive and social/behavioural gains by entry to primary school. The earlieranalyses also showed that pre-school influences continued to remain evident at the endof KS1 (see Sammons et al., 2004a). The present paper extends the earlier findings onthe pre- school and KS1 period, by investigating the extent to which the positive impactsof pre-school are still evident in child outcomes measured at the end Year 5 (age 10years).
Findings for an additional sample of ‘Home’ children (those with no pre-school centreexperience before starting primary school) recruited to the study at entry to primaryschool are also reported for comparison with the original pre-school sample. Thecontextualised multilevel analyses explore whether ‘Home’ children remain at adisadvantage in terms of overall social/behavioural development at the end of Year 5, aswas found to occur at younger ages.
The impact of child, family and home characteristics on children’s socialdevelopment at the end of Year 5
‘Hyperactivity’Gender, early health problems, early behaviour problems, mother’s qualifications andfamily income have the strongest links with ‘Hyperactivity’ at the end of Year 5. Boys,and children with early health and developmental problems had somewhat raised scoresfor ‘Hyperactivity’ when rated by their teachers. Increased ‘Hyperactivity’ was alsoassociated with children of single or separated mothers, children in need of EAL support,those eligible for free school meals (FSM) and Black Caribbean children2. Children whowere reported by parents as having more ‘Enrichment outings’ during KS1, and those whowere infrequently engaged in ‘Expressive play’ during KS1 also showed increased levelsof ‘Hyperactivity’3.
Children of mothers with a high level of qualification, and children in middle incomehouseholds were reported by their teachers as displaying reduced levels of‘Hyperactivity’ relative to children of mothers with a low qualification level and fromhouseholds associated with the low or the high income bands. Reduced ‘Hyperactivity’was also associated with children whose mothers are not working and those ofBangladeshi, Pakistani and Indian ethnic origins.
While eligibility for free school meals (FSM) is a significant predictor of increased‘Hyperactivity’, it is not as strong as some other predictors in the model. The effect sizeof FSM is relatively small in comparison with family income or maternal qualifications.
2 We analysed differences associated with ethnic groups. However, several ethnic groups are small in size andtherefore their results should be treated with caution. They are reported here because they are in line with otherresearch. There may be interplay between cultural influences outside school (family, community and peer) and teacherexpectations.
3 It may be that some parents took children on more outings because their children tended to show more hyperactivebehaviour but it is not possible to ascertain this with the data available.

v
‘Self-regulation’The highest levels of ‘Self-regulation’ were found in children with high Early years HLEscores, higher levels of father’s qualification and higher family income. The lowest levelsof ‘Self-regulation’ were associated with the factors, need of EAL support, developmentalproblems (as reported by parents on entry to the study) and low birth weight.
Gender, which was the strongest predictor for ‘Hyperactivity’, ‘Pro-social’ and ‘Anti-social’behaviour, had the weakest impact on ‘Self-regulation’, both relative to the othersocial/behavioural dimensions and relative to other child factors in the ‘Self-regulation’model.
Overall, the model predicting ‘Self-regulation’ shares more similarities with the modelspredicting the children’s cognitive outcomes (especially Reading) in Year 5 (seeSammons et al., 2007), compared with the other social/behavioural measures.Similarities between the models for ‘Self-regulation’ and Reading were evident in terms ofthe combination of predictors that were significant in the final analyses and in thepatterns of association between predictors and outcomes.
‘Self-regulation’ is a measure of pupil’s autonomy, confidence and self sufficiencyspecifically related to behaviour in learning, rather than a social, context. It is therefore tobe expected that higher ‘Self-regulation’ would coincide with high attainment as indicatedby the moderately high correlations between these measures. However, the finding ofgreater similarity between the predictive models for ‘Self-regulation’ and Reading thanbetween ‘Self-regulation’ and the other social/behavioural outcomes, suggests that ‘Self-regulation’ is an outcome with a strong cognitive aspect. It may, to some extent, beaffected by the same underlying child characteristics as Reading. Higher levels of ‘Self-regulation’ seem to foster the development of Reading skills, however it is also likely thatchildren whose reading attainment is boosted at a younger age develop more autonomyand confidence in their learning. Thus, improvements in both Reading and ‘Self-regulation’ are likely to be mutually reinforcing.
‘Anti-social’ behaviourTeachers’ ratings indicated slightly increased scores on average for ‘Anti-social’behaviour for boys, Black African children, children eligible for FSM, children whosefathers are absent, those whose parents reported as having behavioural problems (atentry to the study), and children who have low levels of ‘One-to-one interaction’ with theirparents (as reported in the parent questionnaire) during KS1. Reduced ‘Anti-social’behaviour was associated with high maternal qualifications and with moderate levels ofengagement during ‘Expressive play’ in KS1 rather than either high or low levels.
Eligibility for free school meals (FSM) was the strongest net family predictor of ‘Anti-social’ behaviour. Its impact on ‘Anti-social’ behaviour was also the strongest relative tothe other social/behavioural dimensions.
‘Pro-social’ behaviourGender was, by a very big margin, the strongest predictor of ‘Pro-social’ behaviour, withgirls having more positive scores as a group. This was then followed by family income,‘Expressive play’ during KS1, maternal qualifications and eligibility for free-school meals(FSM). Eligibility for FSM was a weaker predictor than other predictors in the modelsuggesting that this measure of socio-economic disadvantage has a lesser role to play in‘Pro-social’ behaviour than in ‘Anti-social’ behaviour or in cognitive development.

vi
Girls, children from middle income families, and children of highly educated mothers weregenerally rated by their teachers as showing somewhat better ‘Pro-social’ behaviour atage 10. Children who use computers infrequently also show increased ‘Pro-social’behaviour compared with those using computers a lot at home (note that many moreboys than girls were reported to play with the computer a lot at home). In contrast,children whose parents reported them as having developmental problems at entry to thestudy, those eligible for FSM, and children whose parents reported as engaginginfrequently in ‘Expressive play’ during KS1, show decreased levels of ‘Pro-social’behaviour.
Estimating changes in social/behavioural development (developmental progress)over timeComplex value added analyses were conducted for the four social/behavioural outcomesto explore changes in social/behavioural development that we term progress from Year 1to Year 5. For these analyses we added to the contextualised multilevel models priorsocial/behavioural developmental level, using the relevant social/behavioural outcomecollected at Year 1 in addition to the background factors presented above. Theseanalyses were undertaken to explore whether the child, family and HLE characteristics,found to be significant in predicting aspects of social behaviour measured at the end ofYear 5 were also associated with differential progress or change in social behaviourbetween Year 1 and Year 5 of primary school education.
‘Hyperactivity’For ‘Hyperactivity’ the findings indicate that girls, Indian, Pakistani and Bangladeshichildren, children who have highly qualified mothers (‘18 academic’ and above) and whobelong to families of medium income are showing better progress in terms of reducedhyperactive behaviour. On the other hand, children whose parents reported behaviouralproblems at entry to the study and children of single or separated mothers made lessprogress between their first and their fifth year of primary school education. Children whowere reported by parents as having more ‘Enrichment outings’ during KS1, or infrequentlyengaging in ‘Expressive play’ during KS1 also showed less progress in this area. Genderand mother’s education have stronger links with progress for ‘Hyperactivity’ than otherbackground measures in the analysis.
‘Self-regulation’Improved ‘Self-regulation’ was seen in children with highly educated fathers, children offamilies with medium income, and children with the highest Early years HLE scores.Children with lower HLE did not show as much progress in ‘Self-regulation’ between Year1 and Year 5. Progress in ‘Self-regulation’ was poorer for children reported by parents tohave one developmental problem during pre-school and those still needing EAL supportat age 10.
‘Anti-social’ behaviourIncreases in ‘Anti-social’ behaviour (poorer progress), as reported by teachers, wereassociated with boys, children eligible for FSM, children whose mothers had vocationallevel qualifications and children with absent fathers. Moderate levels of engagement in‘Expressive play’ during KS1, as reported by parents, were also associated withreductions (improved progress) in ‘Anti-social’ behaviour by age 10.

vii
‘Pro-social’ behaviourApart from FSM no longer being significant, the factors predicting progress in ‘Pro-social’behaviour did not change significantly from the contextualised models reported in thispaper. Gender was still the strongest indicator of better progress of ‘Pro-social’behaviour followed by family income and maternal qualifications. Girls, children frommiddle income families and children of mothers with the ‘18 academic’ qualification leveland above (i.e. degree/higher degree), and children reported by parents to usecomputers in moderation (neither high nor low), at home in KS1, showed better progressin ‘Pro-social’ behaviour. In contrast, children whose parents reported a behaviouralproblem at entry to the study, and children whose parents reported they engagedinfrequently in ‘Expressive play’ during KS1, showed poorer progress in ‘Pro-social’behaviour during KS2.
Pre-school quality and effectiveness and primary school effectiveness
Continuing pre-school influencesAs children move through primary school, we would expect pre-school influences to losesome of their potency, or to be masked by the effects of the primary schools attended.Nevertheless, significant pre-school effects are still evident in children’s social behaviourfive years into primary education.
Simply attending pre-school still makes a difference to children’s ‘Pro-social’ behaviour atthe end of Year 5 - those who have attended any pre-school are independently rated bytheir teachers as showing significantly increased levels of positive social behaviourrelative to children who had stayed at home. There are also indications that those whostarted pre-school early (before 3 years of age), also showed more ‘Pro-social’behaviour. However, for other dimensions of social behaviour, the effect of simplyattending a pre-school has washed out. By contrast, the results show that the quality andeffectiveness of the pre-school attended still made a significant difference to longer termdevelopmental outcomes.
All four indicators of pre-school effectiveness in promoting children’s earlier socialbehaviour, before they started primary school, were still significant predictors of later‘Self-regulation’ and ‘Pro-social’ behaviour at age 10. However, there were no significantdifferences between the ‘Home’ group and those who had attended low effective pre-schools. For ‘Hyperactivity’ at age 10 only pre-schools that were found to be moreeffective in reducing ‘Anti-social’ behaviour before children joined primary schoolcontinued to show positive effects five years later, while the ‘Home’ group also showedsomewhat better scores for this outcome than those from medium or low effective pre-schools for this dimension.
Pre-school quality continues to show associations with later social behaviour, butdifferent aspects of quality were found to be associated with different aspects ofbehaviour. The measure of quality associated with the academic aspects of pre-schooleducation (ECERS-E) was particularly associated with increased ‘Self-regulation’, whilethe measure of pre-school quality associated with the ‘caring and emotional/relationship’aspects of pre-school (ECERS-R) was associated with reduced ‘Hyperactivity’ andincreased ‘Pro-social’ behaviour.
Good Early years HLE still predicted better Self-regulation at age 10. Further analysesinvestigated the combined effect of the Early years HLE and pre-school quality to explore

viii
the interplay between these two predictors and the relative contribution each makes to‘Self-regulation’. For this analysis the HLE index was regrouped into three categoriesrepresenting low, medium and high.
The greatest boost in ‘Self-regulation’ comes from the combined effect of medium or highpre-school quality and high HLE. High HLE alone is not enough - children who have highHLE scores and attend low quality pre-schools have poorer ‘Self-regulation’ at age 10years than children with medium Early years HLE scores who had attended high qualitypre-school. Similarly, high quality pre-schools improve ‘Self-regulation’ but it is notenough by itself. Self-regulating behaviour in children who go to high quality pre-schoolsis still affected by the HLE. ‘Home’ children with high Early years HLE scores are doingwell relative to ‘Home’ children with low and medium HLE scores, but they are not doingas well as similar children who had also attended medium and high quality pre-school.
Earlier EPPE reports (Sammons et al., 2004a; Sammons et al., 2003; Melhuish et al.,2001) had shown that an early start to centre-based child care before the age of 2 wasassociated with higher scores on anti-social behaviour at ages 3, 5 and 6. However, byage 10 there was no relationship between an early start in child care and higher rates ofanti-social behaviour. It appears that the slightly increased risk of anti-social behaviouridentified previously in children with an early start in group child care has faded by age10.
Primary school academic effectiveness (value added)Analyses considered the impact of primary school academic effectiveness onsocial/behavioural development. The effectiveness indicators for primary schools werecalculated using National Assessment data for all primary schools in England linking KS1and KS2 results. Separate indicators were calculated for English, Mathematics andScience (see Melhuish et al., 2006a; 2006b). These indicators are thus independentlyderived and provide a measure of the overall academic success (value added) of theprimary school in promoting their pupils’ academic progress over KS2 for threesuccessive pupil cohorts.
Primary school academic effectiveness is a significant predictor of reduced ‘Anti-social’behaviour. However, it is not a significant predictor of the other aspects ofsocial/behavioural development. We conclude that the academic effectiveness of theprimary school attended benefits children in terms of reductions in longer-term ‘Anti-social’ development. It makes an identifiable and separate contribution to children’s‘Anti-social’ behaviour at Year 5, after controlling for child, family and HLE influences.This suggests that school organisation and classroom processes that are associated withbetter academic results may influence the behavioural climate of the school positively.
However, the associations between school academic effectiveness and ‘Anti-social’behaviour may also be bi-directional. Raised overall levels of ‘Anti-social’ behaviour in aschool are likely also to impede teaching and may result in lower academic effectiveness.School effectiveness research has indicated that the creation of an orderly and positivebehavioural climate in school, taking account of differences in intake, is a keycharacteristic of more effective schools (Teddlie & Reynolds, 2000). Also, schoolimprovement research has indicated that improvement in behaviour climate is associatedwith improvements in subsequent academic results. While we cannot draw causalconnections, the results indicate that, taking into account the EPPE sample’s owncharacteristics, going to a more academically effective school does show positive netbenefits in reducing their scores in terms of ‘Anti-social’ behaviour at age 10.

ix
The combined impact of pre-school quality and primary school effectivenessOverall, the effects of pre-school quality and primary school academic effectiveness aremost strongly associated with ‘Self-regulation’ and ‘Pro-social’ behaviour; the maineffects are weak for pre-school quality and non-significant for primary school academiceffectiveness. However, when pre-school quality and primary school effectiveness arecombined, the net impact on behaviour is statistically significant and relatively strongcompared with other predictors. Taken together these findings suggest that pre- andprimary school effects are additive and important.
Analyses of the combined influence of pre-school quality and primary school academiceffectiveness suggest that those children who attended low quality pre-school followed bya low effectiveness primary school show the poorest ‘Self-regulation’ and ‘Pro-social’behaviour at age 10. The protective effects of pre-school quality are most clearly evidentfor those attending medium effective primary schools, which is the majority of children.
High quality pre-school also seems to offer protection against low academic effectiveprimary schools in terms of reducing ‘Hyperactive’ behaviour. The effects of pre-schoolquality on ‘Hyperactivity’, however, may be hidden in high academic effectivenessprimary schools because both quality and effectiveness are having positive effects. Bycontrast ‘Home’ children who attended high academic effective primary schools showedthe best outcomes in terms of reduced ‘Hyperactivity’ and ‘Anti-social’ behaviour scores.Interestingly, ‘Home’ children who went to low academically effective primary schoolsshowed increased ‘Anti-social’ scores compared to all other groups including those whowent to low quality pre-school and a low academically effective primary. Thus, pre-schoolseems to offer some protection against attending a low academic effective primary interms of several social/behavioural outcomes at age 10. ‘Home’ children who went to alow academic effective primary school did less well in terms of outcomes for ‘Anti-social’and hyperactive behaviour. This result is in broad agreement with findings on cognitiveattainment at the same age for the EPPE sample (see Sammons et al., 2007).
When we examine primary school academic effectiveness in relation tosocial/behavioural development the relationship between negative social behaviour andlevel of academic effectiveness appears to be reciprocal. As long as there are not toomany interruptions to prevent primary schools from implementing well establishedstrategies, children in more effective schools tend to do well academically. Therelationship between positive social behaviour and primary school academiceffectiveness appears to be more complex and deserves further investigation. Thepatterns associated with the ‘Home’ group suggest that pre-schools may have a greaterrole to play in promoting later ‘Self-regulation’ and ‘Pro-social’ behaviour than primaryschools. On the other hand, differences between schools after prior (Year 1)developmental level is taken into account indicate that some primary schools have quitea significant impact on children’s positive social behaviour. This is especially true for‘Self-regulation’. The findings overall also indicate strong links between ‘Self-regulation’and cognitive attainment in children in both KS1 and KS2, it would, therefore, bereasonable to assume that such associations exist on a school level too, but furtheranalyses are required to explore such links.
In summary, while pre-school and primary school effects are present for all socialbehavioural outcomes, pre-school measures are more strongly related to improvementsin positive social behaviour (‘Self regulation’ and ‘Pro-social’), while primary schoolmeasures seem to be more strongly related to improvements in negative socialbehaviour (‘Hyperactivity’ and ‘Anti-social’).

x
ImplicationsIn line with findings for cognitive outcomes at age 10 (reported separately in Sammons etal., 2007) the present findings further support the conclusion that good (i.e. high qualityand effective) pre-school still matters for children’s developmental outcomes in the longerterm. There is evidence of continuing pre-school effects in terms of bettersocial/behavioural development. Taken together the results indicate that attending a pre-school has long term benefits for ‘Pro-social’ behaviour. Also, in contrast to otheroutcomes, it appears that an earlier start (under 3) is linked with better outcomes in termsof ‘Pro-social’ behaviour at age 10. By Year 5 there are no longer any significantdifferences related to an earlier start in terms of raised scores for ‘Hyperactivity’ or ‘Anti-social’ behaviour for this sample. However, for other aspects of children’s behaviour atage 10, differences in the effectiveness of pre-school attended seem to contribute tobetter outcomes in the longer term rather than just attending or not attending a pre-school setting. Children who had attended pre-schools that had the most positive impacton social/behavioural development before starting primary school show betterbehavioural profiles across the board at age 10. By contrast, turning to quality we findthat those children who attended low quality pre-school no longer show benefits and poorquality pre-school is also associated with poorer self-regulation and increasedhyperactivity. Thus, quality and effectiveness of pre-school are especially relevant forsustaining better developmental outcomes in the longer term.
The implications of this are clear, improving the access to high quality and more effectivepre-school is likely to benefit children throughout their time in primary school byimproving social adjustment to school and also by promoting cognitive development.These benefits are likely to contribute to raising both educational standards andpromoting social inclusion.
Primary school academic effectiveness (measured independently by value addedanalyses of National Assessment data for matched pupil cohorts KS1 to KS2 acrossthree years) is also a significant influence, in combination with pre-school quality. Thosewho attended more academically effective primary schools tend to show betterattainment and better social/behavioural development at age 10, in terms of reduced‘Anti-social’ behaviour.
The findings suggest that the academic effectiveness of the primary school tends to helpin reducing ‘Anti-social’ behaviour as well as benefiting Reading and Mathematicsattainment and progress, and that this may be especially relevant for the ‘Home’ group ofchildren at age 10. It appears that the processes and organisational features of moreacademically effective schools may also be associated with reducing ‘Anti-social’behaviour, perhaps by influencing school/classroom climate and culture. There is noevidence of any negative impact of academic effectiveness on social/behaviouraldevelopment, and this is important because some have claimed that a focus onacademic progress may lead to poorer outcomes in other aspects of development. TheEPPE research evidence at age 10 does not support such claims. We also suggest thatthere may be reciprocal effects between primary school academic effectiveness and‘Anti-social’ behaviour, as has been suggested in other studies in the schooleffectiveness and improvement tradition.
The present research provides new evidence concerning the combined effects of pre-school and primary school in shaping children’s later developmental outcomes at age 10

xi
years. It suggests that raising the effectiveness and quality of both will help to improvechildren’s all round development.
We can conclude that no one factor is the key to enhancing outcomes in the longer termacross Key Stage 2 – it is the combination of experiences over time that matters. Thechild who has a better Early years HLE, goes to a high quality, effective pre-schoolsetting and who then goes on to attend a more academically effective primary schoolappears to have a combination of ‘protective’ experiences that benefit social/behaviouraldevelopment. High quality and more effective pre-schools seem to support betteroutcomes in longer term cognitive and social/behavioural domains. Likewise, we alsofind that a higher quality Early years HLE benefits both cognitive and social/behaviouraldevelopment throughout pre-school and primary school.
The implication of these findings and those on cognitive outcomes for the same samplethat have been reported separately, is that policy should promote strategies to supportimprovements in the Early years HLE, especially for vulnerable groups, and also work toimprove the quality and effectiveness of pre-school provision. Pre-schools are wellplaced to identify children who may need extra support if they do not experience a highquality HLE and settings could be guided to work with parents to improve the HLE.Improving poorer quality pre-schools needs to be given a high priority, since poor qualityprovision does not appear to offer long term benefits in improved cognitive orsocial/behavioural development.
The finding that both social/behavioural development and Reading and Mathematicsattainment can be boosted by attending an academically more effective primary schoolhas important messages for the achievement of the Every Child Matters agenda,because it shows that the promotion of better academic outcomes is not at odds with thedevelopment of better social/behavioural development.
The focus on supporting the improvement of primary schools identified as less effectiveand of lower quality remains important given other findings from the EPPE researchwhich used classroom observations and showed that quality tends to vary widely andmay be lower in some primary schools serving more disadvantaged communities(Sammons et al., 2006).
As with cognitive outcomes the findings again suggest that, in order to help reduce theachievement gap for multiply disadvantaged groups, actions to improve their HLE, pre-school and primary school experiences will be needed in concert, since improvements toany one in isolation would be insufficient to boost outcomes sufficiently to help close theattainment or social/behavioural ‘gap’ on its own. In addition, it is likely that speciallytargeted interventions for children who are identified as well behind their peers incognitive or social/behavioural profiles at the start of primary school will also be helpful toprevent or at least ameliorate a widening of the gap during KS1 and KS2. This hasimplications for the use of baseline assessment and SEN identification and thedevelopment of well founded, evidence based interventions to support vulnerablechildren when they first start school, particularly if they have not attended pre-school orhave had only poor quality or disruptive pre-school experiences.

1
IntroductionThe Effective Pre-school and Primary Education Project 3-11 (EPPE 3-11) is a large-scalelongitudinal study of the impact of pre-school and primary school on children’s developmentaloutcomes, both cognitive and social/behavioural. The study has been following children from thestart of pre-school (at age 3 years plus) through to primary school entry and across Key Stage 1(KS1) and Key Stage 2 (KS2). This paper describes the results of analyses of children’s socialbehaviour at age 10 years, a separate paper reports the findings on children’s Reading andMathematics attainment at this age (Sammons et al., 2007).
BackgroundEPPE 3-11 began in 1996 with the aim of investigating the influence of Early Childhood provisionon young children’s progress and development during their time at pre-school, and to explorewhether any pre-school effects continue to influence children after they start primary school. Atthe time, it was the first study of pre-schools in Europe to use a longitudinal, mixed method,educational effectiveness design based on sampling children in a range of different pre-schoolsettings and using statistical approaches that enable the identification of individual pre-schoolcentre effects.
The initial phase of the research followed children from pre-school to the end of KS1. Beginningaround the age of 3 years children were assessed and then followed up at entry to primaryschool. Multilevel models were used to calculate value added estimates (residuals) of individualcentre level effects at the end of the pre-school period and on entry to reception (see Sammonset al., 2002a, 2003). These ‘value added’ measures were used as indicators of pre-schooleffectiveness in later analyses that tracked the children’s development up to age 7 years.Measures of the quality of individual pre-school centres4 were also collected (based onobservations by trained researchers) and these were found to influence young children’s progressand development from age 3 to 5 years. The continuing impact of pre-school on children’s latereducational outcomes was further explored at the end of KS1. This set of analyses exploredwhether ‘Home’ children (a sample of 315 children who were recruited at entry to school and whohad very little or no pre-school centre experience) were lagging behind other children, andwhether duration of time, quality and effectiveness of the pre-school attended still showedsignificant positive effects on attainment and social/behavioural development at the end of KS1(age 7), as they were found to at entry to school.
Children’s Educational Outcomes in Key Stage 2The second follow-up phase of the longitudinal research investigates the development of thesame group of children across Key Stage 2 (KS2) of primary education (age 7 to 11 years). Itconsists of three “Tiers”. Tier 1 involves the analysis of primary school academic effectivenessacross all primary schools in England using value added approaches measuring pupil progressfor three successive cohorts across KS2 in terms of National Assessment outcomes (Melhuish etal., 2006a; 2006b). Tier 2 focuses on the academic and social/behavioural progress of around2,500 individual children in the original EPPE sample and uses the results from Tier 1 to providemeasures of primary school academic effectiveness for the schools attended by EPPE children.Tier 3 explores variations in observed classroom practices during KS2 focusing on a sample of125 schools and Year 5 classes drawn from among the 850 plus primaries in which the EPPEchildren were located (see Sammons et al., 2006).
This paper is part of the Tier 2 analysis focusing on children’s social/behavioural development inYear 5 (a separate paper reports the results of analyses of children’s attainments and progress inReading and Mathematics at age 10)5. Social/behavioural development was assessed byteachers using an extended version of the Goodman (1997) Strengths and DifficultiesQuestionnaire. A range of statistical methods was used to analyse data for 2,520 EPPE childrenfor whom social/behavioural outcome data was collected in Year 5. This represents eighty-threeper cent of the total child sample assessed at entry to primary school (n=3,048 children with 4 The quality measures are described in Sylva et al., 1999a.5 See Sammons et al., 2007.

2
equivalent entry to primary school cognitive and/or social/behavioural measures). A wide rangeof information has been drawn upon, including teachers’ assessments of social/behaviouraldevelopment at age 3, 5, 7 and 10; information about child, family and Home LearningEnvironment (HLE) characteristics collected from parental interviews when children wererecruited to the study and again in KS1; measures of pre-school quality and indicators ofeffectiveness collected during the first phase of the study; and independent indicators of primaryschool academic effectiveness derived from the Tier 1 analyses of National Assessment data forsuccessive cohorts (Melhuish et al., 2006a).
AimsThe aims of the social/behavioural analyses are:• To explore the impact of child, parent and home characteristics on children’s
social/behavioural development at this age.• To investigate any continuing impact of pre-school, including any variations in children’s
social outcomes for those who attended pre-school and those who received no pre-schoolprovision - the ‘Home’ sample.
• To explore evidence of any continuing pre-school influence, particularly in measures of thequality and effectiveness of the pre-school setting attended on children’s subsequentsocial/behavioural development
• To examine the combined impact of a ‘good’ HLE and ‘good’ pre-school on thesedevelopmental outcomes at age 10.
• To investigate the net influence of primary school effectiveness on social/behaviouraldevelopment, controlling for child and family and HLE characteristics.
• To investigate the interactive effect of pre-school experience and primary school experienceon social/behavioural outcomes in Year 5.
MethodsAn educational effectiveness research design was adopted to explore the impact of differentchild, family, and HLE factors on a range of child outcomes. The analyses employ a variety ofstatistical techniques including descriptive and correlation analysis and multilevel (hierarchical)regression methods to examine personal, familial and educational influences on children'ssocial/behavioural development. This paper focuses on four measures of social/behaviouraldevelopment: ‘Self-regulation’, ‘Hyperactivity’ ‘Pro-social’ behaviour and ‘Anti-social’ behaviour.The information was collected via a questionnaire completed about each child by their classteacher at the end of Year 5.
Background information about child, parent and family characteristics, was obtained throughparent interviews conducted soon after children were recruited to the study6. The parentinterviews were designed to obtain information about a child’s health and care history, details offamily structure and parents’ own educational and occupational backgrounds as well as someindications of parent-child activities and routines. Parents were assured of confidentiality andanonymity in presenting results.
Background information was again collected during KS1 using a questionnaire with a responserate of eighty-one per cent. Information obtained by the parent questionnaire was used to updatevarious background measures such as marital status, number of siblings, employment etc. Inaddition, the parent questionnaire was used to collect additional measures of the HLE in KS1when children were age 6, to complement information on the pre-school HLE, such as ‘Homecomputing’ during KS1 and other activities (including Reading, play of various kinds, involvementin sport, music, dance etc).
6 It should be noted, that most interviews were with children’s mothers and usually took place at the child’s pre-schoolcentre, although for some working parents telephone interviews were found to be more convenient. All parents gavesigned consent. An excellent response rate (97%) to the interview was achieved, although in some instances particularquestions had a slightly lower rate of response (e.g. related to occupations). In most cases the parent interviews wereconducted within 10 weeks of recruiting a child to the study, though for a small number of children in ‘hard to reach’groups a longer time gap sometimes occurred.

3
Contextualised multilevel models were used to identify the unique (net) contribution of differentbackground characteristics to children’s social/behavioural development at different time points.These contextualised multilevel analyses are equivalent to those conducted during the first phaseof the research when children entered pre-school and again when they started primary school(see Sammons et al., 1999; Melhuish et al., 2001; Sammons et al., 2002a; 2003), andsubsequently at the end of Year 1 (see Sammons et al., 2004b) and Year 2 (see Sammons et al.,2004a).
Value added multilevel models were used to investigate children’s progress over time byincluding prior social/behavioural measures in addition to information about children’s backgroundcharacteristics in the statistical analysis. Value added models have already been used toinvestigate children’s progress over their time in pre-school. These analyses were used to createvalue added indicators of each pre-school centre’s effectiveness in promoting positive social skillsin several areas (‘Independence and Concentration’, ‘Co-operation and Conformity’, ‘Peer-sociability’, or in helping to reduce ‘Anti-social’ behaviour) during the first phase of the study. Pre-school centres where children had made significantly greater progress than predicted on thebasis of prior social behaviour and intake characteristics can be viewed as more effective(positive outliers in value added terms). Similarly, centres where children made less progressthan predicted can be viewed as less effective (negative outliers in value added terms). Thesevalue added indicators of centre effectiveness in these aspects of the social/behavioural domainhave been included in subsequent analyses of children’s educational and social/behaviouraloutcomes in primary school to establish whether the effectiveness of the pre-school attendedcontinues to have an impact on later cognitive attainment or social/behavioural development inYear 5.
The earlier analyses over the pre-school period showed that variations in quality and the extent oftime (duration) in pre-school had an impact on children’s cognitive and social/behavioural gains atentry to primary school and that pre-school influences remained evident in KS1. This paperextends the earlier findings on the pre-school and KS1 period, by investigating the extent to whichthe positive impacts of pre-school are still evident in child outcomes measured at the end Year 5(age 10 years).
Findings for a sample of ‘Home’ children, who had no pre-school centre experience beforestarting primary school, are also reported for comparison with the pre-school sample. Thecontextualised multilevel analyses explore whether ‘Home’ children remain at a disadvantage interms of social/behavioural development at the end of Year 5, as has been found at youngerages.
Independent indicators of primary school academic effectiveness for the schools attended byEPPE 3-11 children were obtained from the Tier 1 analysis of primary school effectiveness acrossall primary schools in England7. Mean value added scores of school academic effectivenessacross the years 2002 to 2004 were calculated for each primary school in England and thenextracted for schools attended by children in the EPPE 3-11 sample8. Note, however, that thesevalue added measures are indicators of a school’s academic effectiveness in terms of NationalAssessment performance. Nevertheless, analyses conducted at earlier time points in the EPPE
7 Applying value added approaches, the Tier 1 analysis measured pupil progress using matched National Assessment
data across KS1 to KS2 test results (Melhuish et al., 2006a). Multilevel models controlling for individual pupils’ priorattainment (KS1 results) and a variety of pupil background and area characteristics (such as gender, eligibility for freeschool meals [FSM], ethnicity, etc.) were used to calculate differences between expected and observed attainments atthe end of KS2 for each school in England. These differences between expected and observed attainment (alsoreferred to as ‘residuals’) provide a value added indicator of each school’s effectiveness in promoting pupil progress ina given outcome. Using three Key Stage 2 (KS2) test results (English, Mathematics, and Science), value addedmeasures were calculated for three consecutive years (2002, 2003, 2004).
8 A mean value added score provides a more stable estimate of effectiveness as it helps to smooth fluctuations in
effectiveness over time. The mean value added scores obtained were used in all subsequent analyses.

4
research showed significant associations between cognitive attainment and social/behaviouraldevelopment (especially for ‘Self-regulation’); these value added indicators of effectiveness,therefore, have been included in the current analyses to examine whether going on to attend amore academically effective primary school influences a child’s social/behaviour development atage 10 years. In a separate report (see Sammons et al., 2007) we describe the links between aschool’s academic effectiveness and the individual child’s attainment and progress in Readingand Mathematics at age 10.
Structure of the Report and AnalysesThis report is divided into five sections. The first provides some detailed descriptive statisticsconcerning the characteristics of the children in the EPPE 3-11 sample for whomsocial/behavioural measures were available at the end of Year 5. The second section provides abrief description of data, the items included and the method used to derive the social/behaviouralmeasures.
Section three presents differences in social/behavioural development at the end of Year 5 fordifferent groups of children in terms of various child, family and HLE characteristics. Absolutedifferences in average social/behavioural development levels are presented alongside differencesin ‘net’ impact of different child and family predictors, showing the unique contribution of apredictor to an outcome once all other predictors are taken into account. Contextualisedmultilevel analyses are used to identify the unique (net) contribution of particular characteristics tovariation in children’s social/behavioural outcomes. ‘Net’ impact is reported in terms of effectsizes (ES), which are statistical measures of the relative strength of different predictors in the finalmodel.
The fourth section describes the extent of change in the influence of different background factorswhile young children move through primary school. Contextualised multilevel models were usedto estimate the net impact of different background factors on social/behavioural outcomes in bothYear 1 and Year 5. Effect sizes (ES) for the different factors were calculated and a comparisonbetween the two years was made in terms of the relative strength of influence measured bychanges in the ES over the four years. This section therefore describes whether thesocial/behavioural differences found for different groups of children have remained the samebetween Year 1 and Year 5 or whether the gaps between certain groups have reduced orincreased.
Section five examines the impact of pre- and primary school on children’s social/behaviouraldevelopment at age 10. The first phase of the EPPE 3-11 research had shown that pre-schoolexperience gave children a better start to school, in terms of higher cognitive attainments andimproved social/behavioural outcomes. Particularly for more vulnerable groups of young children,lack of pre-school experience was found to be an additional disadvantage at the start of primaryschool (rising 5 years). In addition to the effect of pre-school attendance, indicators of pre-schoolquality and effectiveness are tested to explore any continuing effect of pre-school on children’ssocial behaviour at the end of Year 5 in primary school. Further analyses seek to establishwhether the academic effectiveness of the primary school attended has any influence on pupils’social/behavioural outcomes in Year 5. In the last part of Section 5 the combined impact of pre-school quality and primary school effectiveness is examined to establish the nature and pattern ofeducational influences on children’s social/behavioural development at age 10.
In Section 5 the differential effect of pre-school on different sub-groups of children are explored.In particular, the differential effects of pre-school in relation to gender, FSM eligibility and pre-school HLE will be presented.Section 6 presents results of analyses that explore children’s social development from the end ofYear 1 at primary school to the end of Year 5. Value added analyses of children’ssocial/behavioural development across KS1 and KS2 have been conducted. These analysescontrol for prior social behaviour (at the end of Year 1) in analysing development over time.
The final section summarises the results drawing together the main findings and conclusions.

5
Section 1: Characteristics of the sample at the end of Year 5
The research design of the EPPE study is described in detail in EPPE Technical Paper 1 (seeSylva et al., 1999b). In summary, six English Local Authorities (LAs) in five regions participated inthe research with children recruited from six main types of pre-school provision (nursery classes,playgroups, private day nurseries, local authority day nurseries, nursery schools and integratedcentres [that combine education and care]). In order to enable comparison of centre and type ofprovision effects, the project sought to recruit around 500 children, 20 in each of 20-25 centres,from the various types of provision. Within each LA centres of each type were selected bystratified random sampling, and due to the small size of some centres (e.g. rural playgroups),more of these centres were recruited than originally proposed, bringing the sample total to 141centres. There were 2,857 children in the EPPE pre-school sample. An additional sample of 315‘Home’ children (those who had not attended a pre-school setting) was identified at entry toprimary school, for comparison with those who had attended a pre-school centre, bringing thetotal sample to 3,172.
This section provides descriptive statistics for the child sample at the end of year 5, age 10 year.Table 1.1 provides a brief summary of selected characteristics9 of children for whomsocial/behavioural outcome data were available.
Overall 2,520 children had valid social/behavioural outcome data. Within this sample fifty-one percent of children are male; three quarters are of White UK heritage and a tenth had English as anAdditional Language (EAL), but only forty per cent of those (or only 3.8% in the total sample)required EAL support at age 10. In terms of family constitution, the majority of children (63.5%)live with one sibling, nineteen per cent are singletons and fifteen per cent are part of largerfamilies with 2 siblings or more; forty-three per cent of families have higher scores (25+) on anindex of Early years Home Learning Environment (HLE) measured in the pre-school period. Asubstantial minority of children (30%) were from families where scores on the Early years HLEindex were relatively low (below 20 was poor).
About eighteen per cent of mothers and 24 per cent of fathers have a degree or higher degree.The large majority of parents, however, are educated to GCSE level (academic 16) or below.Low family socio-economic status (SES) was recorded for seventeen per cent of the sample,forty-six per cent belong to the medium (skilled manual or skilled non manual) group and thirty-five per cent are from the higher (professional) groups. Over a third of the children in the sample(36.7%) live in households where the family earned income was reported to be under £17,500,and a fifth were recorded as eligible for free school meals (FSM). On an index of multipledisadvantage a quarter were identified as of medium to high disadvantage (3+ disadvantages=24.7%)10.
Overall, this sample (2520) is not noticeably different when compared to the total sample (3172);variations in the distributions of background variables are generally within 1%. There is asomewhat higher proportional representation of children of white UK heritage (2.5%), childrenwhose family earned income is either ‘none’ or lower than £17,500 (3.5%) and of children witheither no disadvantage or low (1) disadvantage (3.2%) in comparison to the characteristics of thesample tracked at entry to primary school (age rising 5 years).
All background variables used in the models were obtained from a detailed parent interviewconducted on entry to the study with the exception of maternal employment (not shown in Table
9
To prevent loss of sample size for further analyses, missing values of number of siblings and eligibility for free schoolmeals (FSM) were imputed using ‘the last observation carried forward’ method. Please see Appendix 5 for a descriptionof this imputation method.10
Only a small number of children with valid social/behavioural data had missing demographic data. The proportion ofmissing data generally did not exceed 4% with the exception of ‘need of EAL support’ (8.8%), multiple disadvantage(7.5%) and family salary (15.9%).

6
1.1) and family earned income; these measures were obtained during Key Stage 1 (KS1 - 6-7years old) through a follow up parental questionnaire. Other more recent information (e.g. KS1)on background variables were also tested in the model but showed weaker associations with thesocial/behavioural outcomes than those collected at entry to the study (age 3+); except for currentmaternal employment during KS1 which had a slightly stronger effect.
Measures of FSM eligibility and ‘Need of EAL support’ are collected yearly through the teachercompleted child profile; the measure obtained for a given year is the measure used in the modelsfor that year’s outcomes, e.g. Year 5 FSM for Year 5 models, Year 1 FSM for Year 1 models etc.
Throughout the report the variable of family earned income is used as a measure of the incomelevel of the family. The ‘no’ family earned income group may have income through benefits orother sources. The ‘no’ family earned income group is used as the reference group incomparisons. Family earned income is a categorised into 6 levels (see Table 1.1). Any referencethrough out the report to ‘income’ equates to family earned income.
Table 1.1Characteristics of children with valid Year 5 data compared to the total sample at entry to primary school
Year 5N=2,520
Total sampleN=3,172
n % n %
Gender
Male 1289 51.2 1636 51.6
Female 1231 48.8 1536 48.4
Ethnicity
White UK Heritage 1887 74.9 2295 72.4
White European Heritage 79 3.1 122 3.8
Black Caribbean Heritage 91 3.6 116 3.7
Black African Heritage 50 2.0 66 2.1
Indian Heritage 53 2.1 93 2.9
Pakistani Heritage 52 2.1 67 2.1
Bangladeshi Heritage 136 5.4 177 5.6
Mixed Heritage 28 1.1 40 1.3
Any Other Ethnic Minority Heritage 141 5.6 192 6.1
English as an Additional Language (EAL) 239 9.5 354 11.2
Child needs EAL support at Year 5
(missing 8.8%)
95 3.8 98 3.1
Number of siblings 355 14.1 455 14.3
No siblings 477 18.9 624 19.7
1 sibling 1601 63.5 1955 61.6
2+ siblings 385 15.3 483 15.2
Early years Home Learning Environment(HLE) Index
(missing 4%)0 – 13 227 9.0 308 9.7
14 – 19 530 21.0 665 21.0
20 – 24 580 23.0 727 22.9
25 – 32 786 31.2 960 30.3
33 – 45 296 11.7 346 10.9
Type of Pre-School
Nursery Class 479 19.0 588 18.5
Playgroup 482 19.1 609 19.2
Private Day Nursery 435 17.3 516 16.3

7
Type of Pre-School- continued
Local Authority Day nursery 320 12.7 433 13.7
Nursery school 421 16.7 519 16.4
Integrated (Combined) Centre 135 5.4 191 6.0
‘Home’ sample 246 9.8 314 9.9
Mother’s Qualifications
None 478 19.0 647 20.4
Vocational 366 14.5 442 13.9
16 Academic 915 36.3 1118 35.2
18 Academic 207 8.2 257 8.1
Other professional 21 .8 25 .8
Degree and higher degree 442 17.5 533 16.8
Father’s Qualifications
None 386 20.4 484 15.3
Vocational 289 15.3 346 10.9
16 academic 562 29.7 676 21.3
18 academic 185 9.8 223 7.0
Degree or equivalent 313 16.6 378 11.9
Higher degree 132 7.0 165 5.2
Other professional 24 1.3 32 1.0
Missing (father absent) 570 22.6 757 23.9
Family Highest SES
Professional Non Manual 232 9.2 281 8.9
Other Professional Non manual 641 25.4 776 24.5
Skilled Non Manual 796 31.6 974 30.7
Skilled Manual 365 14.5 452 14.2
Semi-Skilled 303 12.0 406 12.8
Unskilled 57 2.3 79 2.5
Unemployed / Not working 62 2.5 88 2.8
Income indicator:
Free School Meals (FSM)(at Year 5 or earlier)
496 19.7 673 21.2
No Free school meals 2011 79.8 2374 74.8
Family earned income
No salary 493 19.6 569 17.9
£ 2,500 – 17,499 431 17.1 485 15.3
£ 17,500 – 29,999 372 14.8 411 13.0
£ 30,000 – 37,499 242 9.6 271 8.5
£ 37,500 – 67,499 419 16.6 470 14.8
£ 67,500 – 132,000+ 161 6.4 173 5.5
No salary data 401 15.9 792 25.0
Total Multiple Disadvantage Index
0 (low disadvantage) 557 22.1 644 20.3
1 655 26.0 781 24.6
2 498 19.8 613 19.3
3 288 11.4 391 12.3
4 183 7.3 257 8.1
5 plus (high disadvantage) 151 6.0 213 6.7
Some figures do not include non-response to questions therefore the total is not always 2520 (100%)
8
Section 2: Social/behavioural assessment and data analysis
An extended version of the Strengths and Difficulties Questionnaire (Goodman, 1997) was usedto measure different features of children’s social/behavioural development in Year 5. Thissocial/behavioural child profile was completed by the class teacher who knew the child well. Aprincipal component analysis was used to identify the main underlying dimensions of socialbehaviour 11 (see Appendix 3 for a more detailed description of the methodology). In this reportwe focus on four aspects of social behaviour – ‘Hyperactivity’, ‘Self-regulation’, ‘Pro-social’behaviour and ‘Anti-social’ behaviour. The specific questionnaire items found to be associatedwith each of the four social/behavioural dimensions are presented in Box 1, the full factor solutioncan be found in Appendix 3.
Box 1 The specific items associated with each social/behavioural dimension in Year 5 (age 10)
‘Hyperactivity’1. Restless, overactive, cannot stay still for long2. Constantly fidgeting or squirming3. Easily distracted, concentration wanders4. Thinks things out before acting5. Sees tasks through to the end, good attention span6. Quickly loses interest in what she/he is doing7. Gets over excited8. Easily frustrated9. Impulsive, acts without thinking10. Can behave appropriately during less structuredsessions11. Fails to pay attention12. Makes careless mistakes
‘Self-regulation’1. Likes to work things out for self; seeks help rarely2. Does not need much help with tasks3. Chooses activities on their own4. Persists in the face of difficult tasks5. Can move on to a new activity after finishing a task6. Open and direct about what she/he wants7. Confident with others8. Shows leadership in group work9. Can take responsibility for a task
‘Anti-social’1. Often fights with other children or bullies him2. Often lies or cheats3. Steals from home, school or elsewhere4. Vandalises property or destroys things5. Shows inappropriate sexual behaviour toward others6. Has been in trouble with the law
‘Pro-social’1. Considerate of other people's feelings2. Shares readily with other children (treats, toys, etc.)3. Helpful if someone is hurt, upset or feeling ill4. Kind to younger children5. Often volunteers to help others (teachers, otherchildren)6. Offers to help others having difficulties with a task7. Sympathetic to others if they are upset8. Apologises spontaneously
The factor scores from the principal component analysis were used in subsequent analyses. Forthe whole sample factor scores are normalised to an average of 100 with a standard deviation of1512.
Higher scores indicate better behaviour for the factors ‘Self-regulation’ and ‘Pro-social’ behaviour.By contrast, lower scores indicate better behaviour (in terms of lower incidence reported byteacher ratings) for ‘Hyperactivity’ and ‘Anti-social behaviour’. Note that scores on allsocial/behavioural measures are skewed towards the more desirable end of the scale. This isespecially important for the more negative aspects of social behaviour where raised scoresindicating potential maladaptive behaviour (using the cut-off point suggested by Goodman) areonly evident for a small minority of children (6.1%). This shows that most children are ratedpositively by their teachers in terms of these features of social behaviour and the results are in 11 A number of data reduction methods were applied to the data, and structural equation modelling was used tocompare the different models derived. The best fitting model was a 7 factor solution with Promax rotation (RMSEA=0.6;CMIN=14635.647 with 1463 df). The most important four factors were used in subsequent analyses.
12 We normalised the data for ease of interpretation, because the distribution of scores produced by the factor analyses
is standardised (with a mean of 0 and a standard deviation of 1) and involves negative values. See Appendix 4 fordetails of normalisation procedures.

9
line with other research on social behaviour and with the distribution of scores forsocial/behavioural measures for the EPPE sample at younger ages.
The following background measures have been used in the multilevel models as potentialpredictors of different aspects of social behaviour.
• Child factors (e.g. gender, birth weight, mother tongue and ethnicity).• Family factors (e.g. socio-economic status [SES], parent’s qualification level, family
earned income, marital status).• Early years Home Learning Environment (HLE) index during the pre-school years.• Pre-school experience and pre-school characteristics (e.g. type, duration, quality,
effectiveness).• Primary school academic effectiveness (derived independently from value added analyses
of pupil progress using National Assessment data sets for all primary schools over threeyears 2002-2004).
Contextualised multilevel analyses are used to investigate whether the patterns of associationbetween social/behavioural outcomes and these child, family and HLE factors remain statisticallysignificant when children reach the end of Year 5 of primary school. These analyses are used toidentify and quantify the unique (net) contribution of particular characteristics to variation inchildren’s social/behavioural outcomes, while other influences are controlled. For example, theimpact of gender was established while taking into account the influence of mother’s qualificationlevels, low income, ethnicity, birth weight, HLE etc. The nature and strength of such backgroundinfluences have been explored individually and in total, because they are relevant to issues ofequity and social inclusion. The influence of pre-school is likewise calculated net of the influenceof background factors and will be reported in Section 5. The overall analysis strategy forsocial/behavioural outcomes is similar to that adopted for the analysis of cognitive outcomes forthe same pupil sample (Reading and Mathematics see Sammons et al., 2007).
2.1 Associations between social/behavioural development and cognitive attainmentand between the different aspects of social behaviour over timeCorrelations were used to explore the relationships between children’s social/behavioural andcognitive outcomes at the end of Year 5 and between different aspects of social behaviour overtime13. Children’s self regulating behaviour was strongly and positively correlated with bothReading (r=0.50) and Mathematics (r=0.51), indicating those who show higher ‘Self-regulation’also do well in Reading and Mathematics at the end of Year 5. These correlations are strongerthan those found at younger ages. Other aspects of social behaviour were also correlated withcognitive attainment, but the correlations between these dimensions of social behaviour andattainment were of markedly smaller magnitude in comparison (See Table 2.1).
‘Self-regulation’ is a measure of pupil’s autonomy, confidence and self-sufficiency specificallyrelated to behaviour in a learning, rather than a broader social, context. The items that combineto produce this measure include such things as the ability to independently ‘move to a new task’,‘select and return equipment’, ‘take responsibility for a task’. It is not surprising therefore, thathigh self regulators are likely to be high attainers, however, the direction of influence is notpossible to ascertain on the basis of a correlation analysis. It may be that confidence and selfefficiency promote more successful learning or it may be that doing well academically producesmore confident and self efficient behaviour or, it may be that some underlying latent cognitiveability is responsible for both this aspect of behaviour and attainment. The high correlationsbetween cognitive attainment and this aspect of social behaviour relative to the rest may indicatea stronger cognitive component to ‘Self-regulation’ in comparison to ‘Pro-social’, ‘Anti-social’ oreven ‘Hyperactive’ behaviour, but this is an empirical question to which we will return in latersections.
13 A correlation is a measure of statistical association that ranges from + 1 to -1. Correlations that are lower than r=0.2are not reported.

10
Table 2.1Correlations between social behaviour and cognitive attainment in Year 5 (age 10)
Factor scores ‘Hyperactivity’ ‘Pro-social’ ‘Self-regulation’ ‘Anti-social’ Reading Maths
‘Hyperactivity’ (n=2520)
1
‘Pro-social’(n=2520)
-.55(**) 1
‘Self-regulation’(n=2520)
-.37(**) .50(**) 1
‘Anti-social’(n=2520)
.53(**) -.42(**) 1
Reading(n=2344)
-.29(**) .24 (**) .50(**) 1
Maths(n=2222)
-.28(**) .21 (**) .51(**) .68(**) 1
The social/behavioural scales are moderately to strongly associated with each other. Thepresence of correlations between the social behaviour measures is to be expected since thefactor solution that provided the best fit to the data was based on a non-orthogonal solution.However, this method of analysis was used for the simple theoretical reason that different aspectsof social behaviour are likely to be associated with each other by virtue of being underpinned byat least one ‘latent variable’, which is the individual her/himself. The point of interest here is thespecific associations and their magnitude. The highest association is a negative associationbetween ‘Hyperactivity’ and ‘Pro-social’ behaviour (r= -0.55), indicating that children who arehyperactive are likely to show reduced ‘Pro-social’ behaviour. This is then followed by a positivecorrelation between ‘Hyperactivity’ and ‘Anti-social’ behaviour (r=0.53) and between ‘Self-regulation’ and ‘Pro-social’ behaviour (r=0.50). Thus, children who exhibit ‘Anti-social’ behaviourare more likely to show increased ‘Hyperactivity’, and children who are high self regulators arelikely to show more positive social behaviour. Note that ‘Self-regulation’ is not correlated with‘Anti-social’ behaviour; similarly Reading and Mathematics are not correlated with ‘Anti-social’behaviour. This may provide some evidence to support the view that ‘Self-regulation’ andcognitive attainment may be supported by the same underlying cognitive ability.
Table 2.2 presents correlations between different aspects of social behaviour over time. Thediagonal (shaded) represents the correlations between the same social construct at differentpoints in time. High correlations on this diagonal relative to the rest would indicate that a givenconstruct is measuring the same aspect of social behaviour over time.
Table 2.2Correlations between social behaviour in Year 1 (age 6) and in Year 5 (age 10)
Factors scores Year 5
Factors scores Year 1
Year 5:‘Hyperactivity’
Year 5:‘Pro-social’
Year 5:‘Self-
regulation’
Year 5:‘Anti-social’
Year 1: ‘Hyperactivity’ (n=2257) .55(**) -.31(**) .33(**)
Year 1: ‘Pro-social’ (n=2257) -.32(**) .37(**) .25(**) -.23(**)
Year 1: ‘Self- regulation’ (n=2257) -.29(**) .31(**) .49(**)
Year 1: ‘Anti-social’ (n=2257) .26(**) -.24(**) .25(**)
Fairly strong to moderate relationships are found for ‘Hyperactivity’ (r=0.55), ‘Self-regulation’(r=0.49) and, to a lesser extent, ‘Pro-social’ behaviour (r=0.37) in Year 1 and Year 5. Theseaspects of social behaviour show stronger correlations with themselves overtime than with the

11
other aspects of social behaviour. ‘Anti-social’ behaviour, however, shows a different pattern ofassociation. ‘Anti-social’ behaviour in Year 5 is more strongly correlated with ‘Hyperactivity’ inYear 1 (r=0.33) than with ‘Anti-social’ behaviour in Year 1 (r=0.25), and the correlations between‘Anti-social’ behaviour in Year 1 and ‘Anti-social’ behaviour and ‘Hyperactivity’ in Year 5 are of asimilar magnitude (r=0.25 and r=0.26 respectively).
‘Hyperactivity’ and ‘Anti-social’ behaviour are fairly highly correlated at age 10 (see Table 2.1) andtherefore we would expect these measures to be correlated across time as well. However, it isimportant to note that the ‘Anti-social’ behaviour profile had to be adjusted at Year 5 to reflectdevelopmental changes in the expression of this social attribute. At a younger age theboundaries between hyperactive/boisterous behaviour and ‘Anti-social’ behaviour are fuzzier andwere more difficult to differentiate with the type of questions that were appropriate for that agegroup (e.g. ‘bullies other children’). At age 10 however, the teacher completed social/behaviouralchild profile included a number of additional and more age appropriate items (e.g. ‘been in troublewith law’) that could more successfully discriminate between these measures. Thus, in Year 1the probability of false positives (a child identified as more ‘Anti-social’ instead of morehyperactive) or false negatives (a child identified as more hyperactive instead of more ‘Anti-social’) would be higher.
2.2 Multilevel model estimates of prior social/behaviour measures on Year 5social/behavioural outcomesTable 2.3 shows which measures of prior social/behavioural development, at the end of Year 1,are significant predictors of the four main measures of social/behavioural development identifiedfrom teachers’ ratings at the end of Year 5.
Table 2.3Multilevel model estimates of prior social/behavioural development measures on Year 5 (age 10)
social/behavioural outcomesYear 5:
‘Hyperactivity’Year 5:
‘Pro-social’Year 5:
‘Self- regulation’Year 5:
‘Anti-social’
Estimate (standarderror)
Estimate (standarderror)
Estimate (standarderror)
Estimate (standarderror)
Intercept Not significant Not significant 0.009 (0.024)*** Not significant
Year 1:‘Hyperactivity’ -0.510 (0.020)*** -0.049 (0.021)** -0.177 (0.022)*** -0.246 (0.023)***
Year 1: ‘Pro-social’ - 0.12 (0.020)*** 0.510 (0.022)*** 0.131 (0.023)*** Not significant
Year 1: ‘Self-regulation’ - 0.052 (0.023)* 0.069 (0.025)*** 0.221 (0.025)*** -0.059 (0.026)**
Year 1: ‘Anti-social’ Not significant -0.062 (0.022)*** -0.062 (0.023)*** -0.132 (0.022)***
*** p <0.001; ** p <0.025; * p <0.05
It can be seen that for ‘Hyperactivity’ the earlier measure of ‘Hyperactivity’ is the strongestpredictor but the earlier measure of ‘Self-regulation’ also shows a moderate negative associationwith ‘Hyperactivity’ in Year 5. Contrary to the strong correlation found between ‘Hyperactivity’ inYear 5 and ‘Anti-social’ behaviour in Year 1, when the other three social dimensions are takeninto account ‘Anti-social’ behaviour in Year 1 does not significantly predict ‘Hyperactivity’ in Year5. In contrast, ‘Hyperactivity’ in Year 1, which also showed a strong correlation with ‘Anti-social’behaviour in Year 5, was the strongest predictor of ‘Anti-social’ behaviour in Year 5, and strongerthan the Year 1 measure of ‘Anti-social’ behaviour.
For ‘Self-regulation’ the earlier measure of ‘Self-regulation’ is the strongest predictor, all othersocial/behavioural measures show weaker associations. Early ‘Pro-social’ behaviour was thestrongest predictor of ‘Pro-social’ behaviour in Year 5, but the earlier measures of ‘Hyperactivity’and ‘Self-regulation’ also show strong relationships with this outcome.

12
Section 3: Links between Child and Family Characteristics andChildren’s Social Behaviour in Year 5
This section explores associations between the measures of social behaviour in Year 5 andselected background characteristics. Differences in raw scores are examined alongsidedifferences in ‘net’ impact (effect sizes), showing the unique contribution of a given predictor to achild’s outcome once all other predictors are taken into account. The net effects of particularchild, family and Home Learning Environment (HLE) characteristics reported in this section werederived by contextualised multilevel analyses and therefore take into account any clusteringrelated to the primary school attended. As we shall see, due to the inter-relationship between thedifferent predictors some raw differences between sub-groups of children disappear and somebecome accentuated once the influences of other factors are partialled out. Presenting raw andnet differences side by side helps to show how demographic factors taken together affect therelative strength of estimates of the unique influence of particular factors.
The following measures were used in the analyses:• Child factors (e.g. gender, birth weight, ethnicity, mother tongue,)• Family factors (e.g. eligibility for free school meals [FSM], socio-economic status [SES],
parent’s qualification, family earned income),• Home Learning Environment (HLE) in the early years (how often parents read to the child,
teach the child the alphabet, play with letters and numbers, teach songs and nurseryrhymes, paint and draw etc.) before starting primary school,
• Parental activities during Key Stage 1 (KS1) such as the frequency of reading to the child,taking the child out on educational visits, computing activities, play, etc. (see Appendix 2for details of these measures).
3.1 Child Measures
GenderTable 3.1 provides descriptive statistics comparing boys and girls social/behaviouraldevelopment. There are marked gender differences on all measures of social/behaviouraldevelopment (Table 3.1).
Table 3.1Gender differences in social/behavioural development at the end of Year 5 (age 10)*
Male Female Total
Mean 104.7 95.1 100.00S.d. 16.5 11.3 15.00 ‘Hyperactivity’Net Effects 0.68 0
Mean 98.3 101.8 100.00S.d. 15.1 14.7 15.00‘Self-
regulation’Net Effects -0.19 0
Mean 95.6 104.6 100.00S.d. 16.1 12.3 15.00‘Pro-social’Net Effects -0.63 0
Mean 102.3 97.6 100.00S.d. 17.8 10.8 15.00‘Anti-social’Net Effects 0.32 0
Total N 1289 1231 2520
* ‘Female’ as the comparison category

13
On average teachers rated boys as displaying more hyperactive and ’Anti-social’ behaviour(104.7, 102.3 respectively) than girls (95.1, 97.6). Teachers on average rated girls more highlyfor ‘Self-regulation’ and ‘Pro-social’ behaviour (101.8, 104.6) than boys (98.3, 95.6). Differencesbetween the genders are greater on the ‘Hyperactivity’ and the ‘Pro-social’ scales.
Net differences between boys and girls reflect the same pattern as observed in the raw scoreswith differences between boys and girls being considerably large (ES=0.68) for ‘Hyperactivity’ and‘Pro-social’ behaviour (ES=-0.63) followed by ‘Anti-social behaviour’ (ES=0.32). The smallestdifferences for gender are on the ‘Self-regulation’ (ES=-0.19) scale. The overall pattern of genderdifferences is in line with that found at younger ages.
The moderate gender effect for ‘Self-regulation’ reflects the findings on gender differences forReading which were also of a moderate magnitude (ES=0.10 in favour of girls).
Birth weightA child’s weight at birth was found to be a significant predictor of both Reading and Mathematicsat the end of Year 5. Social/behavioural development, however, seems to be less associatedwith this factor. ‘Self-regulation’ was the only dimension on which variations in birth weight wereassociated with statistically significant differences in outcomes; children with low birth weight wererated by their teachers as showing reduced ‘Self-regulation’ relative to children of normal birthweight14 (ES=-0.21). However, the effects sizes for birth weight on this dimension were lower incomparison with the effect sizes for Reading (ES=0.40) and Mathematics (ES=0.42) in Year 5.‘Self-regulation’ is the aspect of social behaviour most closely associated with cognitiveattainment as reported earlier.
LanguageThe effects associated with gender (as well as most other background characteristics) tend to beconsistent across the social/behavioural dimensions in that children who have higher scores onone negative outcome (e.g. ‘Hyperactivity’) tend to have higher scores on the other negativeoutcome (i.e. ‘Anti-social’) and relatively lower scores on the two positive outcomes. However,differences in children’s social behaviour associated with mother tongue are inconsistent acrossthe social/behavioural dimensions (see Table 3.2).
Table 3.2Children with EAL and differences in social/behavioural development at the end of Year 5 (age 10)*
English as an AdditionalLanguage (EAL) Not EAL EAL Unknown Total
Mean 100.3 97.5 105.51 100
S.d. 15.1 13.9 5.73 15‘Hyperactivity’Net Effects ns nsMean 100.3 97.5 96.88 100
S.d. 15.0 14.3 .57 15‘Self-regulation’
Net Effects ns nsMean 100.3 97.1 102.56 100
S.d. 15.0 14.8 16.32 15‘Pro-social’Net Effects ns nsMean 100.0 100.3 92.05 100
S.d. 15.0 14.8 .08 15‘Anti-social’Net Effects ns ns
Total N 2279 239 2 2520
*Not EAL as the comparison category
14 Babies born weighing 2500 grams or less are defined as below normal birth weight: foetal infant classification isbelow 1000 grams, very low birth weight is classified as 1001-1500 grams and low birth weight is classified as 1501-2500 grams (Scott & Carran, 1989).

14
In the past EAL was found to be a predictor of both cognitive and social/behavioural outcomes atage 3 and 5, but this is no longer the case at age 10. At this age, many of these children werefluent in English. Indeed, only forty per cent of the children in the original EAL sample wereidentified as needing EAL support by Year 5 (see section 1). Therefore, further analysis wasconducted using ‘Need of EAL support’ as an indicator of poor English. Need of EAL support wasalso found to be an important predictor of cognitive outcomes at age 10 (see Sammons et al.,2007).
Table 3.3 presents differences in average social/behavioural development between children whoare in need of EAL support and children who are not. The raw mean differences between thegroups appear to be the largest for ‘Self-regulation’ and ‘Pro-social’ behaviour while differencesfor ‘Hyperactivity’ and ‘Anti-social’ behaviour appear to be relatively small. Nevertheless, when allother factors are taken into account, differences between the groups were only statisticallysignificant (and large) for ‘Self-regulation’ (ES=-0.53); and despite the apparent small differencesbetween the groups on the ‘Hyperactivity’ scale, ‘need of EAL support’ was significantlyassociated with increased ‘Hyperactivity’ (ES=0.26). In addition, and also in contrast to the EALcomparisons, the differences on the two social dimensions are now in the same direction; need ofEAL support is associated with negative social behaviour, increased ‘Hyperactivity’ and reduced‘Self-regulation’. The findings suggest that children still in need of EAL support at age 10 are ‘atrisk’ not only of poorer cognitive outcomes in Reading and Mathematics but may also have moredifficulties in some aspects of social behaviour.
Table 3.3Children needing EAL support and differences in social/behavioural development at the end of Year 5
Need of EAL support No Yes Unknown Total
Mean 99.7 103.6 101.0 100S.d. 15.0 16.3 14.4 15‘Hyperactivity’Net Effects 0 0.26 0.19
Mean 100.7 89.6 97.1 100S.d. 14.7 14.4 15.8 15‘Self-
regulation’Net Effects 0 -0.53 -0.30
Mean 100.2 95.7 99.5 100S.d. 15.1 14.6 14.4 15‘Pro-social’Net Effects 0 ns ns
Mean 99.9 102.0 99.7 100S.d. 15.0 17.3 13.7 15‘Anti-social’Net Effects 0 ns ns
Total N 95 2204 221 2520
* No need of EAL support’ as the comparison category
Ethnic GroupsWe analysed differences associated with ethnic groups. However, several ethnic groups aresmall in size and therefore their results should be treated with caution. Ethnic differences inteachers’ ratings of social/behavioural development varied greatly for ‘Hyperactivity’ and ‘Anti-social’ behaviour, but variations for ‘Self-regulation’ were less pronounced (see Table 3.4).
Bangladeshi (93.0) and Indian children (94.8) showed the lowest levels of ‘Hyperactivity’. Indianchildren also had lower scores for ‘Anti-social’ behaviour (96.1) relative to the other ethnic groups.Black Caribbean children (104.6), Mixed Race (103.5) and Black African (103.2) showedrelatively higher scores for ‘Hyperactivity’. Black African children also had higher ‘Anti-social’scores (106.8) but they were rated more positively in terms of Self-regulating behaviour (102.1),followed by Bangladeshi (101.3), White UK (100.5) and Black Caribbean children (100.3). Theaverage score for ‘Self-regulation’ was lowest for Pakistani children (94.5).

15
Table 3.4Ethnic groups and differences in social/behavioural development at the end of Year 5 (age 10)*
Ethnic groups WhiteUK
WhiteEuro-pean
BlackCari-
bbean
BlackAfrican
OtherEthnic
IndianPakist-
aniBangla-deshi
MixedRace
Mean 99.8 100.1 104.6 103.2 100.4 94.8 98.7 93.0 103.5S.d. 15.0 13.9 15.8 15.5 14.2 11.9 13.9 11.9 16.3‘Hyperactivity’Net Effects 0 -0.08 0.19 0.13 0.02 -0.34 -0.35 -0.73 0.19
Mean 100.5 97.3 100.3 102.1 99.0 99.8 94.5 101.3 99.3S.d. 14.9 15.3 14.5 14.4 13.8 14.7 14.9 13.9 16.0‘Self-
regulation’Net Effects 0 ns ns ns ns ns ns ns ns
Mean 100.5 98.8 97.4 100.0 98.2 101.0 94.8 100.5 100.8S.d. 15.0 14.1 16.6 13.3 16.8 13.4 14.4 15.6 14.7‘Pro-social’Net Effects 0 ns ns ns ns ns ns ns ns
Mean 99.8 98.1 101.7 106.8 99.9 96.1 101.0 99.3 100.4S.d. 14.9 12.7 15.4 24.7 14.7 7.0 15.9 11.1 14.1‘Anti-social’Net Effects 0 -0.14 0.05 0.39 -0.02 -0.27 -0.14 -0.12 0.02
Total N 1887 79 91 50 53 52 136 28 141
* White UK as the comparison category15
We found that ethnic group differences for two social dimensions were in the opposite direction(i.e. raised ‘Hyperactivity’ but higher ‘Self-regulation’) for some ethnic groups (e.g. Black Africanand Black Caribbean both of whom show better average scores for ‘Self-regulation’ but poorerscores for ‘Hyperactivity’).
Differences between ethnic groups were not statistically significant in the final contextual modelsfor ‘Self-regulation’ and ‘Pro-social’ behaviour. This indicates that observed differences in theseaspects of social/behavioural development are likely to be attributable to the influence of otherdemographic factors (such as low income, parents’ qualifications and occupations or HLE) ratherthan to ethnic background per se.
Table 3.4 shows the effect sizes for ‘Hyperactive’ and ‘Anti-social’ behaviour by different ethnicgroups (note that negative scores here indicate reduced ‘Hyperactivity’ and reduced ‘Anti-social’behaviour). Differences in net effect sizes by ethnic group remain the same for most groups.Overall, Bangladeshi (ES=-0.73), Pakistani (ES=-0.35), and Indian (ES=-0.34) pupils showsignificantly better behaviour (reduced ‘Hyperactivity’) at age 10 than other groups. Differencesare weaker for other ethnic groups but net effects are somewhat higher for the Black Caribbean(ES=0.19) and children of Mixed race (ES=0.19) groups. Differences between groups in ‘Anti-social’ behaviour are generally small with the exception of Indian children (ES=-0.27) who showsignificantly reduced levels of ‘Anti-social’ behaviour, and Black African children (ES=0.39) whoshow a significantly higher level of ‘Anti-social’ behaviour. Note however, that the standarddeviation for this group is extremely high (24.7) in comparison with the full sample (Sd = 15), thusindicating large variations in this group. An association between Black African children and ‘Anti-social’ behaviour therefore cannot be fully substantiated by the data. Later in this section we will
15 Any category of a predictor variable can be used as a reference group. The overall calculations (e.g. model’svariance, BIC, etc.) are not affected by the choice of reference group; the absolute differences (in terms of effect size)between the different categories of the predictor variable also remain the same. The statistical models show therelative differences between categories in relation to the outcome measure. We select the category as a referencegroup that would show the pattern of association between the predictor variable and the outcome measure in theclearest possible way, the only restriction that the reference category is of a reasonable size. When the relationship islinear we would typically choose the lowest or the highest performing group as a reference category (e.g. highestqualification or none). If the relationship is non-linear we would select the largest category (e.g. ethnicity: white UK asthe reference group). Occasionally we would select the category that is of most interest (e.g. pre-school quality: lowquality) regardless of the type of association.

16
return to this point and examine the effects of other family characteristics and the associationsbetween ‘Anti-social’ behaviour, absent fathers and gender16.
To summarise, differences in social/behavioural development between ethnic groups are largelyrelated to differences in demographic factors, although there are still some ethnicity effects for‘Hyperactivity’. These differences should be interpreted with caution due to small numbers. Theyare reported here because they are in line with other research. There may be interplay betweencultural influences outside school (family, community and peer) and teacher expectations. Therealso seem to be links with gender and other predictors such as ‘father absent’.
Health, behavioural and developmental problems and Special Education NeedsEPPE collected details for each child in the sample on whether their class teacher reported thatthey had been identified as having any form of special educational need (SEN) at each datacollection point during Key Stage 1. There were large differences in the social/behaviouralcharacteristics of children identified by teachers as having had any form of SEN in Year 5 orearlier. Overall, the SEN group had significantly lower scores in terms of ‘Self-regulation’ and‘Pro-social’ behaviour and higher mean scores for ‘Hyperactivity’ and ‘Anti-social’ behaviourcompared with children reported as never having any form of SEN (see Table 3.5).
Children may be identified as having SEN for a variety of reasons. Children may have healthproblems that prevent them from attending school regularly or they may have physicalimpairments (e.g. hearing or sight) that could affect/impede their ability to learn, they may havebehavioural problems that disrupt their concentration and learning, or they may bedevelopmentally delayed. Specific information about health, behavioural, and developmentalproblems was obtained from the parents at the start of the study, and it is these data that aretypically used in the contextualised models rather than the overall measure of SEN.
Table 3.5Children identified as SEN and differences in social/behavioural development at the end of Year 5*
SEN Unknown Yes No Total
Mean 102.2 108.9 96.5 100.0S.d. 13.3 17.2 12.5 15.0‘Hyperactivity’Net Effects 0.46 0.76 0
Mean 96.6 89.0 104.3 100.0S.d. 12.3 14.8 12.7 15.0‘Self-
regulation’Net Effects -0.45 -1.07 0
Mean 99.1 94.0 102.4 100.0S.d. 13.4 16.0 13.9 15.0‘Pro-social’Net Effects -0.08 -0.48 0
Mean 94.4 104.7 98.2 100.0S.d. 5.7 19.2 12.6 15.0‘Anti-social’Net Effects -0.27 0.31 0
Total N 21 699 1800 2520
* ‘No SEN as the comparison category
As would be expected, there is a large overlap between SEN and this information. Around sixtyper cent (n=395) of children recorded as having any type of special need at age 10, had alsopreviously been identified by their parents as having either health or behaviour problems, ordevelopmentally related learning difficulties at a younger age. This however, constitutes onlythirty-four per cent of all EPPE children (1,160) who were reported by their parents as having
16 Note: findings regarding ethnicity should be interpreted with caution, as the numbers of children in some of the ethnicgroups are relatively small.
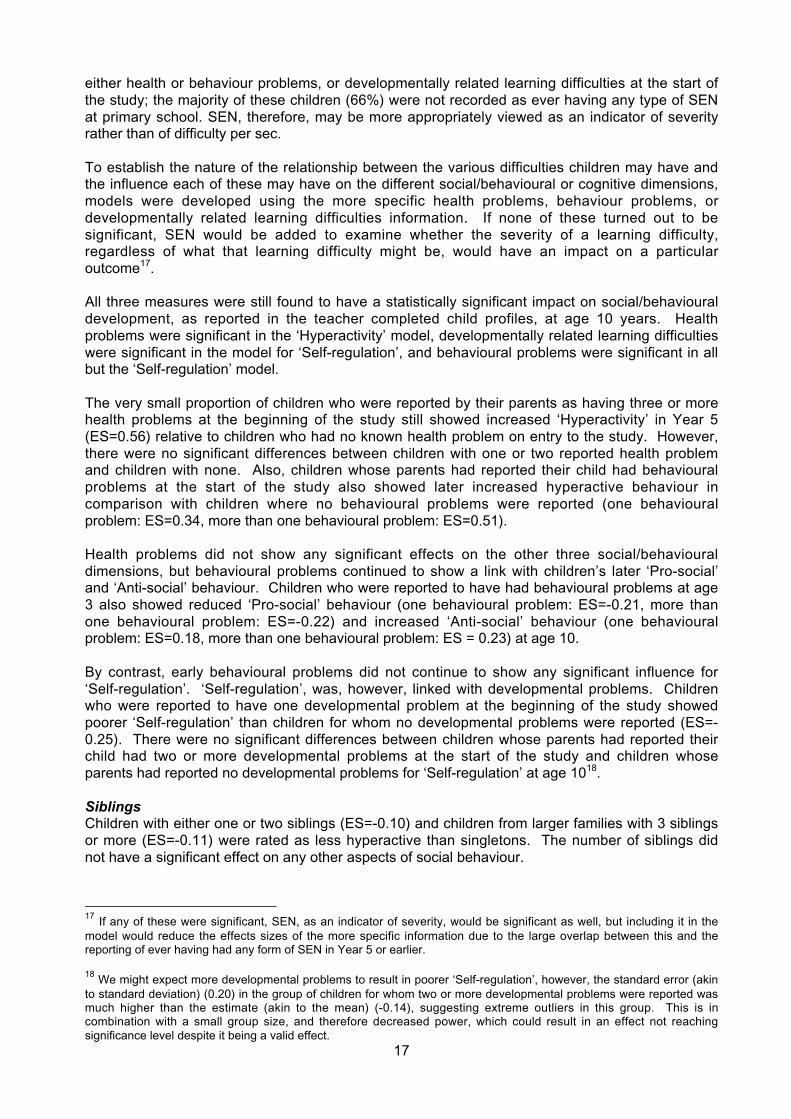
17
either health or behaviour problems, or developmentally related learning difficulties at the start ofthe study; the majority of these children (66%) were not recorded as ever having any type of SENat primary school. SEN, therefore, may be more appropriately viewed as an indicator of severityrather than of difficulty per sec.
To establish the nature of the relationship between the various difficulties children may have andthe influence each of these may have on the different social/behavioural or cognitive dimensions,models were developed using the more specific health problems, behaviour problems, ordevelopmentally related learning difficulties information. If none of these turned out to besignificant, SEN would be added to examine whether the severity of a learning difficulty,regardless of what that learning difficulty might be, would have an impact on a particularoutcome17.
All three measures were still found to have a statistically significant impact on social/behaviouraldevelopment, as reported in the teacher completed child profiles, at age 10 years. Healthproblems were significant in the ‘Hyperactivity’ model, developmentally related learning difficultieswere significant in the model for ‘Self-regulation’, and behavioural problems were significant in allbut the ‘Self-regulation’ model.
The very small proportion of children who were reported by their parents as having three or morehealth problems at the beginning of the study still showed increased ‘Hyperactivity’ in Year 5(ES=0.56) relative to children who had no known health problem on entry to the study. However,there were no significant differences between children with one or two reported health problemand children with none. Also, children whose parents had reported their child had behaviouralproblems at the start of the study also showed later increased hyperactive behaviour incomparison with children where no behavioural problems were reported (one behaviouralproblem: ES=0.34, more than one behavioural problem: ES=0.51).
Health problems did not show any significant effects on the other three social/behaviouraldimensions, but behavioural problems continued to show a link with children’s later ‘Pro-social’and ‘Anti-social’ behaviour. Children who were reported to have had behavioural problems at age3 also showed reduced ‘Pro-social’ behaviour (one behavioural problem: ES=-0.21, more thanone behavioural problem: ES=-0.22) and increased ‘Anti-social’ behaviour (one behaviouralproblem: ES=0.18, more than one behavioural problem: ES = 0.23) at age 10.
By contrast, early behavioural problems did not continue to show any significant influence for‘Self-regulation’. ‘Self-regulation’, was, however, linked with developmental problems. Childrenwho were reported to have one developmental problem at the beginning of the study showedpoorer ‘Self-regulation’ than children for whom no developmental problems were reported (ES=-0.25). There were no significant differences between children whose parents had reported theirchild had two or more developmental problems at the start of the study and children whoseparents had reported no developmental problems for ‘Self-regulation’ at age 1018.
SiblingsChildren with either one or two siblings (ES=-0.10) and children from larger families with 3 siblingsor more (ES=-0.11) were rated as less hyperactive than singletons. The number of siblings didnot have a significant effect on any other aspects of social behaviour.
17 If any of these were significant, SEN, as an indicator of severity, would be significant as well, but including it in themodel would reduce the effects sizes of the more specific information due to the large overlap between this and thereporting of ever having had any form of SEN in Year 5 or earlier.
18 We might expect more developmental problems to result in poorer ‘Self-regulation’, however, the standard error (akinto standard deviation) (0.20) in the group of children for whom two or more developmental problems were reported wasmuch higher than the estimate (akin to the mean) (-0.14), suggesting extreme outliers in this group. This is incombination with a small group size, and therefore decreased power, which could result in an effect not reachingsignificance level despite it being a valid effect.

18
Summary of child measuresOverall, of the child measures gender, health problems and behavioural problems (reported byparents at the start of the study) had the strongest links as predictors of ‘Hyperactivity’ and needof EAL support had the strongest link with ‘Self-regulation’. The strongest predictor for ‘Pro-social’ and ‘Anti-social’ behaviour was gender. Interestingly, gender had the weakest impact on‘Self-regulation’ both relative to the other social/behavioural dimensions and relative to other childfactors in the ‘Self-regulation’ model. This pattern parallels findings from the analysis of cognitiveoutcomes and further reinforces evidence of an important association between ‘Self-regulation’and cognitive development.
3.2 Family measures
Mother’s qualificationMother’s highest qualification level shows an association with raw differences in teacher ratings ofchild behaviour in all four dimensions (see Table 3.6).
Hyperactive behaviour was found to be raised for children whose mothers have no qualificationsor only vocational level qualifications in comparison with other groups; differences between themedium and high qualification categories are less pronounced. The patterns observed in thedistribution of raw scores become even more evident after controlling for all other demographicfactors, in terms of child and family characteristics; children of mothers with low qualifications tendto be rated by their teachers as more hyperactive. Thus, ‘Hyperactivity’ decreases withincreasing maternal qualifications, with children of mothers with the highest qualifications scoringlowest on the hyperactive scale (ES=-0.36).
Table 3.6Mother’s qualifications and differences in social/behavioural development at the end of Year 5*
Mother’s HighestQualification level
None Vocational 16 Academic 18 AcademicDegree/higherdegree
Otherprofessional
Mean 102.5 103.2 99.1 98.4 96.4 96.9S.d. 16.1 16.8 14.2 13.5 12.8 10.5‘Hyperactivity’NetEffects 0 0.11 -0.15 -0.19 -0.36 -0.32
Mean 95.6 99.3 99.8 101.5 105.7 102.8S.d. 15.1 15.5 15.3 13.7 12.5 14.3‘Self-
regulation’ NetEffects 0 0.00 0.02 0.06 0.21 0.24
Mean 96.9 98.4 101.2 100.8 102.7 99.0S.d. 15.3 16.0 14.9 14.6 13.4 15.7‘Pro-social’NetEffects 0 -0.05 0.17 0.13 0.19 -0.03
Mean 102.8 102.0 99.0 98.7 97.0 98.2S.d. 18.0 17.7 14.1 12.3 9.6 17.4‘Anti-social’NetEffects 0 0.08 -0.11 -0.09 -0.16 -0.18
Total N 478 366 915 207 442 21
* ‘No qualifications’ as the comparison category
‘Self-regulation’ on the other hand shows a steady and positive increase as a function ofincreasing level of mother’s qualifications. Differences in ‘Self-regulation’ are most notable inchildren whose mothers have a degree/higher degree qualification (105.7) and children whosemothers have no qualifications (95.6). However, the net effect of mother’s qualification on ‘Self-regulation’ is not as strong as the raw data initially indicated; when other factors are taken intoaccount, Self-regulating behaviour seems similar across most qualification categories, the‘degree/higher degree’ category is the only group with significantly higher scores (ES=0.21)
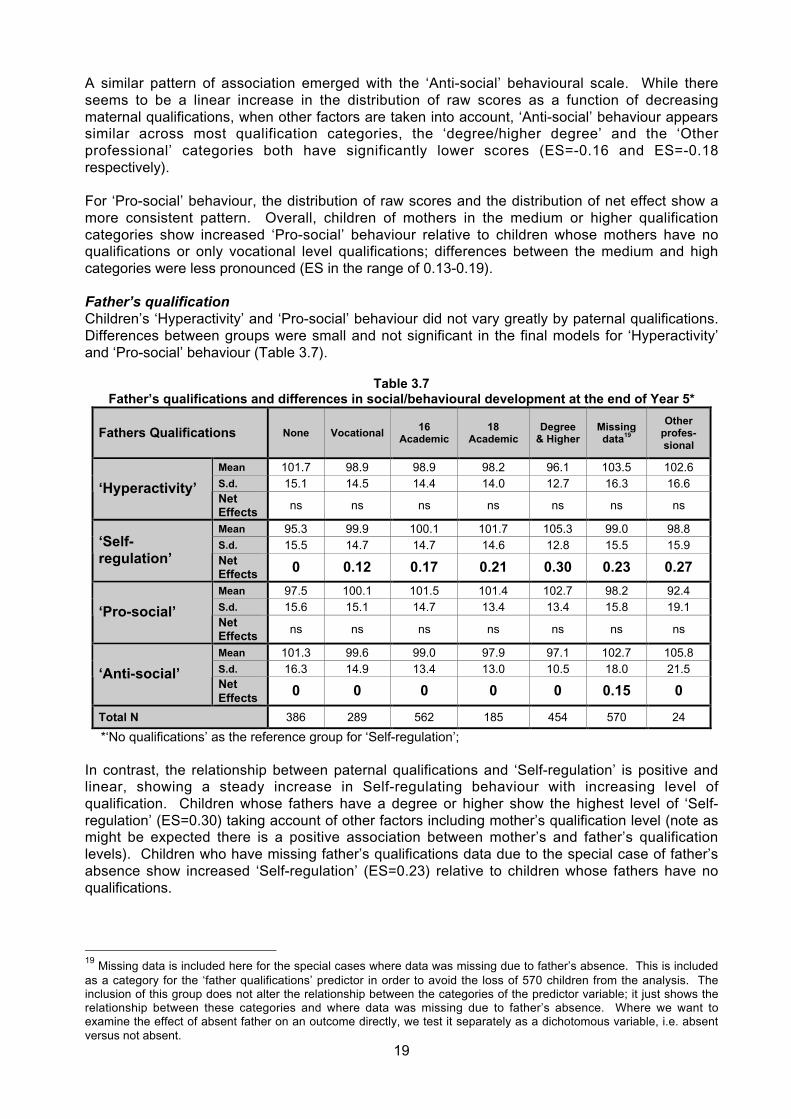
19
A similar pattern of association emerged with the ‘Anti-social’ behavioural scale. While thereseems to be a linear increase in the distribution of raw scores as a function of decreasingmaternal qualifications, when other factors are taken into account, ‘Anti-social’ behaviour appearssimilar across most qualification categories, the ‘degree/higher degree’ and the ‘Otherprofessional’ categories both have significantly lower scores (ES=-0.16 and ES=-0.18respectively).
For ‘Pro-social’ behaviour, the distribution of raw scores and the distribution of net effect show amore consistent pattern. Overall, children of mothers in the medium or higher qualificationcategories show increased ‘Pro-social’ behaviour relative to children whose mothers have noqualifications or only vocational level qualifications; differences between the medium and highcategories were less pronounced (ES in the range of 0.13-0.19).
Father’s qualificationChildren’s ‘Hyperactivity’ and ‘Pro-social’ behaviour did not vary greatly by paternal qualifications.Differences between groups were small and not significant in the final models for ‘Hyperactivity’and ‘Pro-social’ behaviour (Table 3.7).
Table 3.7Father’s qualifications and differences in social/behavioural development at the end of Year 5*
Fathers Qualifications None Vocational16
Academic18
AcademicDegree
& HigherMissingdata19
Otherprofes-sional
Mean 101.7 98.9 98.9 98.2 96.1 103.5 102.6S.d. 15.1 14.5 14.4 14.0 12.7 16.3 16.6‘Hyperactivity’NetEffects
ns ns ns ns ns ns ns
Mean 95.3 99.9 100.1 101.7 105.3 99.0 98.8S.d. 15.5 14.7 14.7 14.6 12.8 15.5 15.9‘Self-
regulation’ NetEffects 0 0.12 0.17 0.21 0.30 0.23 0.27
Mean 97.5 100.1 101.5 101.4 102.7 98.2 92.4S.d. 15.6 15.1 14.7 13.4 13.4 15.8 19.1‘Pro-social’NetEffects
ns ns ns ns ns ns ns
Mean 101.3 99.6 99.0 97.9 97.1 102.7 105.8S.d. 16.3 14.9 13.4 13.0 10.5 18.0 21.5‘Anti-social’NetEffects
0 0 0 0 0 0.15 0
Total N 386 289 562 185 454 570 24
*‘No qualifications’ as the reference group for ‘Self-regulation’;
In contrast, the relationship between paternal qualifications and ‘Self-regulation’ is positive andlinear, showing a steady increase in Self-regulating behaviour with increasing level ofqualification. Children whose fathers have a degree or higher show the highest level of ‘Self-regulation’ (ES=0.30) taking account of other factors including mother’s qualification level (note asmight be expected there is a positive association between mother’s and father’s qualificationlevels). Children who have missing father’s qualifications data due to the special case of father’sabsence show increased ‘Self-regulation’ (ES=0.23) relative to children whose fathers have noqualifications.
19 Missing data is included here for the special cases where data was missing due to father’s absence. This is includedas a category for the ‘father qualifications’ predictor in order to avoid the loss of 570 children from the analysis. Theinclusion of this group does not alter the relationship between the categories of the predictor variable; it just shows therelationship between these categories and where data was missing due to father’s absence. Where we want toexamine the effect of absent father on an outcome directly, we test it separately as a dichotomous variable, i.e. absentversus not absent.
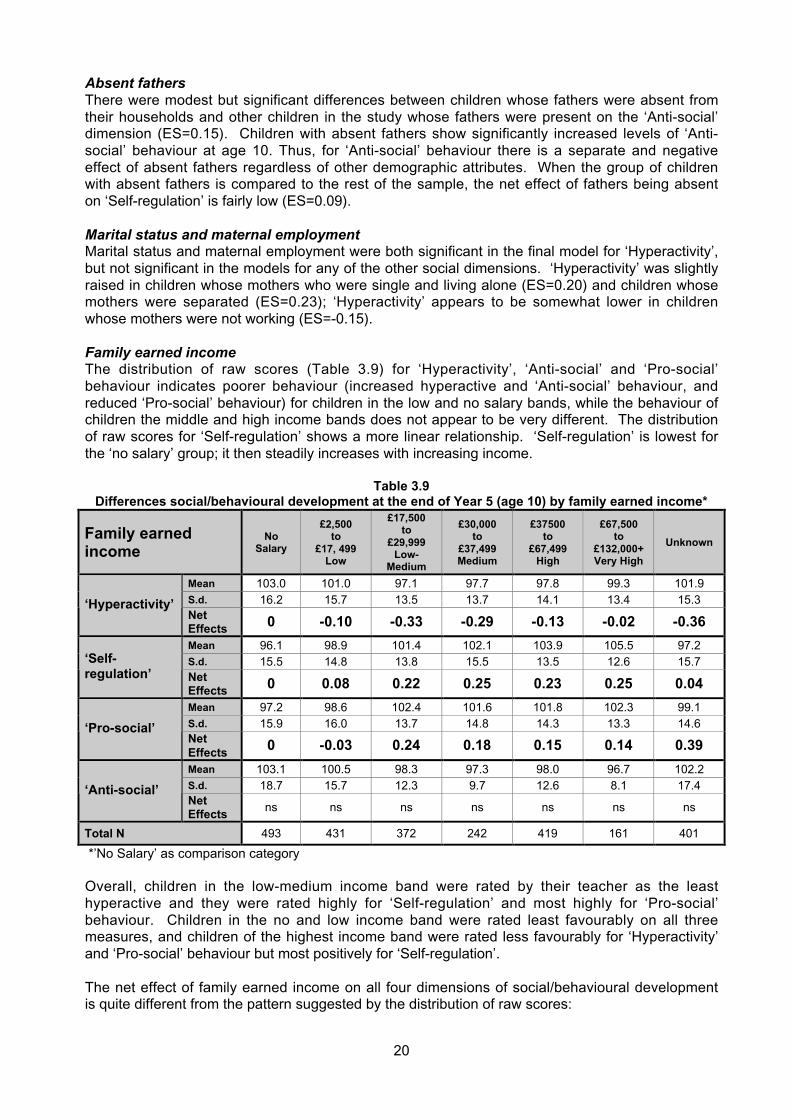
20
Absent fathersThere were modest but significant differences between children whose fathers were absent fromtheir households and other children in the study whose fathers were present on the ‘Anti-social’dimension (ES=0.15). Children with absent fathers show significantly increased levels of ‘Anti-social’ behaviour at age 10. Thus, for ‘Anti-social’ behaviour there is a separate and negativeeffect of absent fathers regardless of other demographic attributes. When the group of childrenwith absent fathers is compared to the rest of the sample, the net effect of fathers being absenton ‘Self-regulation’ is fairly low (ES=0.09).
Marital status and maternal employmentMarital status and maternal employment were both significant in the final model for ‘Hyperactivity’,but not significant in the models for any of the other social dimensions. ‘Hyperactivity’ was slightlyraised in children whose mothers who were single and living alone (ES=0.20) and children whosemothers were separated (ES=0.23); ‘Hyperactivity’ appears to be somewhat lower in childrenwhose mothers were not working (ES=-0.15).
Family earned incomeThe distribution of raw scores (Table 3.9) for ‘Hyperactivity’, ‘Anti-social’ and ‘Pro-social’behaviour indicates poorer behaviour (increased hyperactive and ‘Anti-social’ behaviour, andreduced ‘Pro-social’ behaviour) for children in the low and no salary bands, while the behaviour ofchildren the middle and high income bands does not appear to be very different. The distributionof raw scores for ‘Self-regulation’ shows a more linear relationship. ‘Self-regulation’ is lowest forthe ‘no salary’ group; it then steadily increases with increasing income.
Table 3.9Differences social/behavioural development at the end of Year 5 (age 10) by family earned income*
Family earnedincome
NoSalary
£2,500to
£17, 499Low
£17,500to
£29,999Low-
Medium
£30,000to
£37,499Medium
£37500to
£67,499High
£67,500to
£132,000+Very High
Unknown
Mean 103.0 101.0 97.1 97.7 97.8 99.3 101.9S.d. 16.2 15.7 13.5 13.7 14.1 13.4 15.3‘Hyperactivity’NetEffects 0 -0.10 -0.33 -0.29 -0.13 -0.02 -0.36
Mean 96.1 98.9 101.4 102.1 103.9 105.5 97.2S.d. 15.5 14.8 13.8 15.5 13.5 12.6 15.7‘Self-
regulation’ NetEffects 0 0.08 0.22 0.25 0.23 0.25 0.04
Mean 97.2 98.6 102.4 101.6 101.8 102.3 99.1S.d. 15.9 16.0 13.7 14.8 14.3 13.3 14.6‘Pro-social’NetEffects
0 -0.03 0.24 0.18 0.15 0.14 0.39
Mean 103.1 100.5 98.3 97.3 98.0 96.7 102.2S.d. 18.7 15.7 12.3 9.7 12.6 8.1 17.4‘Anti-social’NetEffects
ns ns ns ns ns ns ns
Total N 493 431 372 242 419 161 401
*’No Salary’ as comparison category
Overall, children in the low-medium income band were rated by their teacher as the leasthyperactive and they were rated highly for ‘Self-regulation’ and most highly for ‘Pro-social’behaviour. Children in the no and low income band were rated least favourably on all threemeasures, and children of the highest income band were rated less favourably for ‘Hyperactivity’and ‘Pro-social’ behaviour but most positively for ‘Self-regulation’.
The net effect of family earned income on all four dimensions of social/behavioural developmentis quite different from the pattern suggested by the distribution of raw scores:

21
- ‘Hyperactive’ behaviour is higher in children of either low (ES=-0.10), or high (ES=-0.13) earnedincome band, and it is lowest in the low-medium (ES=-0.33) and medium income bands (ES=-0.29).- The linear pattern of association observed with the distribution of raw scores for ‘Self-regulation’disappears; ‘Self-regulation’ is low only in children of low family income (ES=0.08) but there areno statistically significant differences between the middle and upper income bands.- ‘Pro-social’ behaviour is highest for children in the low-med band (ES=0.24) and lowest in thelow band (ES=-0.03), ‘Pro-social’ behaviour in the medium to very high income bands is of asimilar magnitude and lower than the low-medium band.- Family income was not a significant net predictor of ‘Anti-social’ behaviour, after account wastaken of other influences.
It should be noted that the inclusion of the FSM measure is likely to pick up some of thedifferences relating to low income groups.
Free school meals (FSM)The eligibility for free school meals (FSM) indicator of poverty shows an association with allaspects of social/behavioural development.
Table 3.8Differences in social/behavioural development at the end of Year 5 (age 10) by FSM eligibility*
FSM eligibility No Yes Unknown Total
Mean 99.0 104.0 103.6 100.0S.d. 14.4 16.6 15.9 15.0‘Hyperactivity’Net Effects 0 0.18
Mean 100.7 96.9 102.9 100.0S.d. 14.8 15.4 9.2 15.0‘Self-
regulation’Net Effects 0 -0.17
Mean 101.1 95.6 100.9 100.0S.d. 14.7 15.5 12.6 15.0‘Pro-social’Net Effects 0 -0.15
Mean 99.0 104.1 96.8 100.0S.d. 13.9 18.4 11.7 15.0‘Anti-social’Net Effects 0 0.23
Total N 2011 496 13 2520
* ‘Not FSM’ as the comparison category
For each dimension, as a group children recorded as eligible for free meals (FSM) have poorerbehaviour ratings compared to other children. On average FSM children show increased‘Hyperactivity’ (104.0) relative to non FSM children (99.0) and increased ‘Anti-social’ behaviour(104.1) relative to non FSM children (99.0); they also show poorer Self-regulating behaviour(96.9) compared to non FSM children (100.7) and decreased ‘Pro-social’ behaviour (95.6). Thenet impact of FSM is weaker but remains statistically significant for all four social dimensions(‘Hyperactivity’: ES=0.18; ‘Self-regulation’: ES=-0.17; ‘Pro-social’ behaviour: ES=-0.15; and ‘Anti-social’ behaviour: ES=0.23), and in all cases it is of weak to moderate magnitude.
Socio-Economic Status (SES)SES was not significant in the final models for ‘Hyperactivity’ and ‘Self-regulation’. The overalleffect of SES in the final models for ‘Pro-social’ and ‘Anti-social’ behaviour was significant butdifferences between the SES categories were not. Thus, while there were no significantvariations in ‘Pro-social’ or ‘Anti-social’ behaviour that were directly related to socio-economicclassification, it seems there may be indirect influences on these aspects of behaviour that weremediated by SES through other variables in the model (e.g. parental qualifications).

22
Multiple DisadvantagePoor social behaviour is associated with higher levels of disadvantage. Table 3.10 shows themean scores for different levels of multiple disadvantage by ‘Hyperactivity’, ‘Pro-social’ behaviour,‘Self-regulation’ and ‘Anti-social’ behaviour. ‘Self-regulation’ and ‘Pro-social’ behaviour steadilydecreases with increasing disadvantage. The relationship between ‘Hyperactivity’ and multipledisadvantage, on the other hand, appears to be distinguish primarily between two main groupsrelatively low and relatively high; the low disadvantage groups (0-2 factors) show similar levels of‘Hyperactivity’, which are lower than the high disadvantage groups (3-5+ factors); the highdisadvantage groups do not differ greatly from each other either. ‘Anti-social’ behaviour steadilyincreases with increasing disadvantage and then levels out for the high disadvantage groups (4-5+ factors). However, when multiple disadvantage is entered in the final social/behaviouralmodels, the observed raw differences between the groups turn out to be non-significant. Thissuggests that once the influence of individual more specific predictors (child, family and HLE) aretaken into account there is no additional effect of multiplicity (of disadvantage) onsocial/behavioural outcomes. Overall, multiple disadvantage is a useful summary predictor, thatindicates an increased risk of both poor cognitive outcomes and less favourablesocial/behavioural development in pre-school and across the early years of primary school (forpre-school and KS 1 findings on multiple disadvantage see Sammons et al., 2002b; 2004c).However, it seems that it is the individual predictors that make up multiple disadvantage that havethe impact on child outcomes at Year 5 rather than an additional additive effect.
Table 3.10 Total Multiple Disadvantage and differences in social/behavioural development at the end of Year 5
Multiple disadvantage 0 2 3 4 5+ Unknown
Mean 98.4 98.3 99.3 103.5 102.8 101.8‘Hyperactivity’S.d. 13.9 14.1 13.9 16.8 16.5 16.4
Mean 103.6 102.2 99.7 97.1 94.3 94.4‘Self-regulation’ S.d. 13.7 14.0 15.7 15.3 15.3 14.6
Mean 102.5 101.0 100.6 98.2 96.5 95.0‘Pro-social’
S.d. 13.8 15.1 14.7 16.4 14.6 15.1
Mean 97.9 98.8 99.5 102.4 102.2 102.6‘Anti-social’S.d. 11.2 14.0 14.2 18.7 15.5 18.1
Total N 557 655 498 288 183 151
Summary of Family measuresOverall, of the family factors, mother’s qualification and family income had the strongest links asnet predictors of ‘Hyperactivity’; family income was also the strongest predictor of ‘Pro-social’behaviour and it also showed a strong association with ‘Self-regulation’, but the strongestpredictor of ‘Self-regulation’ was father’s qualification. FSM is an important predictor of ‘Anti-social’ behaviour.
3.3 Home Learning Environment (HLE)
Early years Home Learning Environment (HLE)A number of measures provide an indication of aspects of the Early years HLE. These are basedon the frequency of specific activities involving the child, as reported by parents when childrenwere recruited to the study (i.e. teaching the child the alphabet, playing with letters and numbers,library visits, reading to the child, teaching the child songs or nursery rhymes). These measureswere combined to create an overall Early years HLE index with scores between 0 (very low Earlyyears HLE) to 45 (very high Early years HLE) (see Melhuish et al., 2001; in press).

23
Table 3.11Early years HLE and differences in social/behavioural development at the end of Year 5*
Early years Home LearningEnvironment (HLE)
0-13 14-19 20-24 25-32 33-45
Mean 103.0 101.2 100.9 98.7 96.2‘Hyperactivity’S.d. 15.3 15.5 15.5 14.3 13.2
Mean 93.8 98.1 99.4 101.6 106.2S.d. 15.9 15.2 15.0 14.2 12.8‘Self-
regulation’ NetEffects 0 0.20 0.21 0.29 0.49
Mean 95.5 99.1 99.1 101.7 103.1‘Pro-social’S.d. 15.4 15.4 15.1 14.2 14.3
Mean 101.5 101.3 101.1 98.5 97.2‘Anti-social’S.d. 17.3 16.4 16.6 12.9 10.2
Total N 227 530 580 786 296
*Low Early years HLE score (0-13) as comparison group
When the Early years HLE index was tested, the overall quality of HLE remains a powerfulpredictor for ‘Self-regulation’ but not for the other social/behavioural dimensions.
While the raw scores for ‘Hyperactivity’ would suggest a possible association with Early yearsHLE (see Table 3.11), this indicator of the quality of the Home Learning Environment during thepre-school years is not significant in the final model. The relationships between the Early yearsHLE and ‘Pro-social’ and ‘Anti-social’ behaviour were weak and similarly not significant in themodels.
In contrast, the relationship between Early years HLE and ‘Self-regulation’ shows a strong linearpattern. For ‘Self-regulation’, the HLE continues to show strong positive association, with theeffect sizes of this predictor being the largest in the model. The ES of low versus high HLE (0.49)is much stronger than that found for FSM, for example.
Key Stage 1 (KS1) Home Learning Environment (HLE)As the learning environment at home during the pre-school period was shown to have a strongimpact on children’s academic attainments during the early years, parents were again surveyedabout their interactions with their EPPE child at home via a parent questionnaire during KS1.They reported on activities such as the frequency of reading to the child, taking the child out oneducational visits, computing activities, sport activities, dance, etc.
The individual measures have been aggregated to form four factors representing differentactivities during Key Stage 1 (KS1): ‘Home computing’, ‘One-to-one interaction’, ‘Enrichmentoutings’ and ‘Expressive Play’ (see Appendix 2). These factors were tested with respect to theirinfluence on social/behavioural development at the end of Year 5 (age 10)20.None of the four KS1 HLE factors showed a significant association with ‘Self-regulation’. For‘Self-regulation’, the Early years HLE remains the stronger predictor. Therefore, we can concludethat early years experiences are particularly important for cognitive outcomes (as reportedseparately Sammons et al., 2007) at age 10 and also for the dimension of social behaviour mostassociated with cognitive outcomes, ‘Self-regulation’.
20
KS1 HLE factors were not aggregated into a single HLE Index as was done with the Early years HLE since the typesof extra curricular activities children are engaged in at this age do not form a simple additive scale. This is for tworeasons: first, each of the HLE factors shows a unique pattern of association with different outcome measures, certainactivities show a linear relationship (e.g. ‘Enrichment outings’ during KS1) while others show an inverted U shapefunction (e.g. ‘Home computing’ during KS1, suggesting an optimum level of engagement that is neither high nor low).Second, they are differentially and strongly influenced by gender, for example boys are significantly more likely to bereported by their parents to play with computers whereas girls are significantly more likely to be reported as engaging inexpressive play. Combining these distinct types of activities into a single scale would cancel out contrasting ordisparate influences. Consequently, the resulting scale might show no statistically significant associations withoutcomes.

24
‘Home computing’‘Home computing’ during KS1 shows a significant linear and negative association with ‘Pro-social’behaviour; the more time children spend with their computer the lower their ‘Pro-social’ behaviourscores. Children who spend no or little time engaged with their computers show greater levels of‘Pro-social’ behaviour (ES=0.22) when compared to children who are engaged with theircomputers on a daily basis. ‘Pro-social’ behaviour then gradually decreases with increasingcomputer usage (ES=0.17 for the moderate category and ES=0.12 for the high category). It is notpossible to say whether this association is causal of course; those who play with the computer alot may already find it less easy to play with other children. There is also a gender link as moreboys scored highly on computer use, reported in the KS1 parent questionnaire, than girls.
‘Enrichment outings’‘Enrichment outings’ during KS1 shows a significant association with ‘Hyperactivity’ and in thiscase too, the association is negatively linear. Thus, more ‘Enrichment outings’ during KS1 areassociated with somewhat increased ‘Hyperactivity’ (ES=-0.25 for low, ES=-0.12 for moderateand ES=-0.17 for high compared to the very high scoring group ES=0). These findings mayappear to be counter intuitive at first, however, given the strong gender effect for ‘Hyperactivity’,the negative relationship this factor forms with ‘Enrichment outings’ during KS1 may not besurprising. One of the three items loading on this HLE factor is sporting activities, which is morestrongly associated with boys; who are also more hyperactive. Indeed when the multilevel modelis applied only on the sub-group of girls, the ‘Enrichment outings’ during KS1 factor fails to reachsignificance, thus indicating that the negative association between ‘Hyperactivity’ and ‘Enrichmentoutings’ during KS1 is gender driven and is likely to be a reflection of an interactive effectbetween the ‘sport’ part of the ‘Enrichment outings’ during KS1 factor, gender (boys) and‘Hyperactivity’. In other words, boys who are rated as being more hyperactive are more likely tobe taken out on sporting (or other outdoor) activities more often than less hyperactive children.This may possibly reflect parental strategies as a way of helping them to ‘work out’ theirhyperactivity.
‘One-to-one interaction’‘One-to-one interaction’ is a significant predictor of ‘Anti-social’ behaviour but the association inthis case is only significant for the low activity group. Low scores on ‘One-to-one interaction’ aresignificantly associated with increased ‘Anti-social’ behaviour (ES=0.18); moderate and highscores on this HLE factor are no different from each other or from the very high scoring referencegroup (ES around 0 for all).
‘Expressive play’‘Expressive play’ was a significant predictor for ‘Hyperactivity’, ‘Pro-social’ behaviour and ‘Anti-social’ behaviour. For ‘Hyperactivity’ and ‘Pro-social’ behaviour only the low activity group showsa significant association. Children who were not reported to engage in ‘Expressive play’ muchduring KS1 show increased ‘Hyperactivity’ (ES=0.20) and reduced ‘Pro-social’ behaviour (ES=-0.24). The moderate and high activity groups are no different from each other or from the veryhigh activity group (ES around 0 for all). Again this may reflect the association between genderand these dimensions of social behaviour, given the finding that girls score more highly on‘Expressive play’ during KS1 than boys.
The relationship between ‘Anti-social’ behaviour and ‘Expressive play’ during KS1 shows a Ushape pattern of association; those in the middle range group show reduced ‘Anti-social’behaviour (ES=-0.17 for the moderate group and ES=-0.13 for the high group) relative to the lowand very high activity groups. This may suggest that in some cases over engagement in‘Expressive play’ during KS1 (especially pretend play which is one of the three items contributingto this scale) may be an indication of a reduced ability to relate to other children. When the ‘Anti-social’ model is applied in a model just based on girls in the sample, ‘Expressive play’ during KS1continues to be significant. In addition to this, reports by parents at the start of the study ofdevelopmental problems, which was not significant in the model for the full sample, is nowsignificant and the effect size is stronger for this predictor (ES=0.36) than for ‘Expressive play’during KS1 (ES=-0.25 for the moderate group). Overall, these findings suggest there could be

25
some developmental component to ‘Anti-social’ behaviour in girls, which may be manifested asan over-engagement in ‘Expressive play’ during KS1. However, without further evidence suchpossible links must be interpreted with caution.
3.4 An overview of the social/behavioural dimensionsThe net influences of different child, family and HLE characteristics are illustrated in tables 3:12-3.15. The ES are presented without an algebraic sign, but the direction of change is explained inthe text21.
‘Hyperactivity’Gender, early health problems, early behaviour problems mother’s qualifications and familyincome have the strongest links with ‘Hyperactivity’ (Table 3.12). Ethnicity was also associatedwith ‘Hyperactivity’, however the group sizes are relatively small, and interpretation, therefore,should be treated with caution.
Table 3.12‘Hyperactivity’ – factors with significant Net effect at the end of Year 5 (age 10)
Factor Effectsize
Description
Gender 0.68 Boys higher than girls
Ethnicity-0.73 to
0.19White UK lower/higher than some minority groups. Asian groups lower
Siblings 0.11 Singletons are more hyperactive than children with siblings
Health problems 0.56 3+ Early health problems a predictor for increased ‘Hyperactivity’
Behavioural problems 0.51 1+ Early behavioural problems = predictor for increased ‘Hyperactivity’
Need of EAL support 0.26 Need of EAL support a predictor for increased ‘Hyperactivity’
Mother’s Qualifications 0.36 Linear: Higher qualifications reduced ‘Hyperactivity’
Marital status 0.23 Single or separated mother a predictor of increased ‘Hyperactivity’
Maternal employment 0.15 Mother not working a predictor of reduced ‘Hyperactivity’
FSM 0.18 FSM a predictor of increased ‘Hyperactivity’
Family income 0.33 Middle income band a predictor of reduced ‘Hyperactivity’
KS1 HLE: Enrichmentoutings
0.25 Linear: more Enrichment outings a predictor of increased ‘Hyperactivity’
KS1 HLE: Expressive play 0.20 Infrequent engagement in play a predictor of increased ‘Hyperactivity’
Teachers rated boys, and children with three or more health problems and one or morebehavioural problems (as reported by parents at the start of the study) more hyperactive.Increased ‘Hyperactivity’ was also associated with children of single or separated mothers,children in need of EAL support, those eligible for FSM and Black Caribbean children.
Children of mothers with a high level of qualification, and children in households belonging to themiddle band income categories, were reported by teachers as displaying reduced levels of‘Hyperactivity’ relative to children of mothers with a low qualification level and those children fromhouseholds associated with the low or the high income bands. Reduced ‘Hyperactivity’ was alsoassociated with children whose mothers are not working.
While FSM is a significant predictor of increased ‘Hyperactivity’, it is not as strong as some otherpredictors in the model. The effect size of FSM is relatively small in comparison with the familyincome factor or maternal qualification.
21 For factors where more than one category showed a significant effect (e.g. mother’s qualification or Early yearsHLE), the effect size of the most representative category is shown in tables 3.12-3.15. Details on effect sizes for othercategories can be found in previous tables.

26
‘Self-regulation’The highest levels of ‘Self-regulation’ were associated with high Early years HLE scores, higherlevels of father’s qualification and higher family income. The lowest levels of ‘Self-regulation’were associated with need of EAL support, developmental problems (as reported by parents atthe start of the study) and low birth weight (see Table 3.13).
Overall, the model for ‘Self-regulation’ shares more similarities with the cognitive models(especially Reading), described in a separate report of the Year 5 cognitive outcomes (seeSammons et al., 2007), than with the other social/behavioural measures. Similarities between‘Self-regulation’ and Reading were evident in terms of the combination of predictors that weresignificant in the final models and in the patterns of association between predictors and outcomesin the models.
Birth weight and developmental problems (as reported by parents at the start of the study) werenot significant in the final models of ‘Hyperactivity’, ‘Pro-social’ behaviour and ‘Anti-social’behaviour, but both were significant in the final models for ‘Self-regulation’ and for Reading.Similarly, Early years HLE was significant in the model of ‘Self-regulation’ and both Reading andMathematics, but it was not a significant predictor of the other social/behavioural dimensions; forthe other three aspects of social behaviour the KS1 HLE factors had a stronger impact.
In contrast, gender, which was the strongest predictor for ‘Hyperactivity’, ‘Pro-social’ and ‘Anti-social’ behaviour, had the weakest impact on ‘Self-regulation’, both relative to the othersocial/behavioural dimensions and relative to other child factors in the ‘Self-regulation’ model. Inthe cognitive models gender also had a relatively low impact on Reading (ES=10) and nostatistically significant impact on Mathematics at age 10.
Table 3.13‘Self-regulation’ – factors with significant Net effect at the end of Year 5 (age 10)
Factor Effectsize
Description
Gender 0.19 Girls higher than boys
Birth weight 0.21 Linear: Increasing ‘Self-regulation’ with increasing birth weight
Developmental problems 0.25 Developmental problems a predictor for lower ‘Self-regulation’
Need of EAL support 0.53 Need of EAL support a predictor for lower ‘Self-regulation’
Mother’s Qualifications 0.21 Linear: Increasing ‘Self-regulation’ with increasing qualifications
Father’s qualifications 0.30 Linear: Increasing ‘Self-regulation’ with increasing qualifications
FSM 0.17 FSM a predictor of lower ‘Self-regulation’
Family income 0.25 Salary > £30,000 a predictor of higher ‘Self-regulation’
Early years HLE 0.49 Linear: Increasing ‘Self-regulation’ with increasing HLE scores
The pattern of association with family income for ‘Self-regulation’ also reflects the patternobserved with the cognitive outcomes. The relationship between ‘Self-regulation’ and familyincome is a steady linear relationship; the higher the income the higher the ‘Self-regulation’ score.This is in contrast to the inverted U shaped pattern of association found between family incomeand the two of the other aspects of social behaviour, ‘Hyperactivity’ and ‘Pro-social’ behaviour,where the middle income band, rather than the high or low, show relatively higher scores forpositive social behaviour.
The only notable differences between the models for ‘Self-regulation’ and cognitive attainment arefirst, the absence of SES as a predictor for ‘Self-regulation’ and second, the impact of parentalqualifications. In the ‘Self-regulation’ model, father’s qualifications has a stronger impact overallthan mother’s qualifications; in contrast, in the cognitive models mother’s qualification is thestronger predictor. Nonetheless, father’s qualification, which did show fairly strong links withcognitive attainment, was not significantly associated with any of the social/behaviouraldimensions apart from ‘Self-regulation’, which is a further indication of the similarities betweenthis aspect of social behaviour and cognitive attainment.
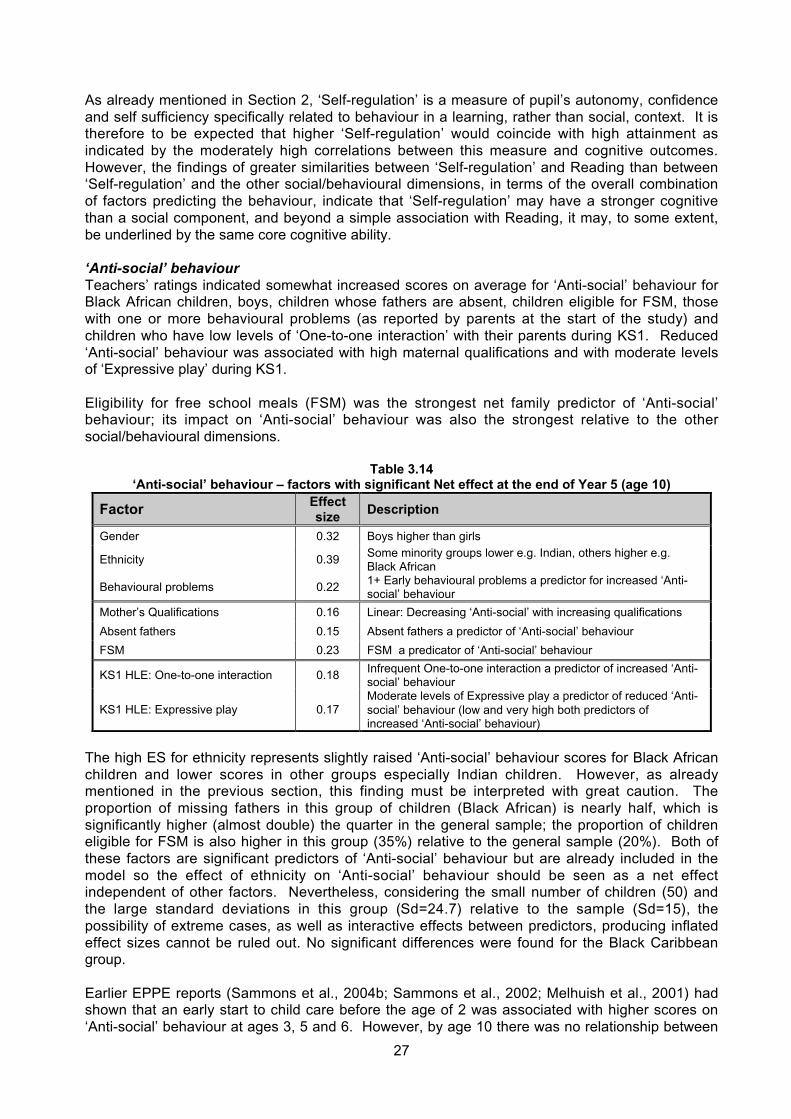
27
As already mentioned in Section 2, ‘Self-regulation’ is a measure of pupil’s autonomy, confidenceand self sufficiency specifically related to behaviour in a learning, rather than social, context. It istherefore to be expected that higher ‘Self-regulation’ would coincide with high attainment asindicated by the moderately high correlations between this measure and cognitive outcomes.However, the findings of greater similarities between ‘Self-regulation’ and Reading than between‘Self-regulation’ and the other social/behavioural dimensions, in terms of the overall combinationof factors predicting the behaviour, indicate that ‘Self-regulation’ may have a stronger cognitivethan a social component, and beyond a simple association with Reading, it may, to some extent,be underlined by the same core cognitive ability.
‘Anti-social’ behaviourTeachers’ ratings indicated somewhat increased scores on average for ‘Anti-social’ behaviour forBlack African children, boys, children whose fathers are absent, children eligible for FSM, thosewith one or more behavioural problems (as reported by parents at the start of the study) andchildren who have low levels of ‘One-to-one interaction’ with their parents during KS1. Reduced‘Anti-social’ behaviour was associated with high maternal qualifications and with moderate levelsof ‘Expressive play’ during KS1.
Eligibility for free school meals (FSM) was the strongest net family predictor of ‘Anti-social’behaviour; its impact on ‘Anti-social’ behaviour was also the strongest relative to the othersocial/behavioural dimensions.
Table 3.14‘Anti-social’ behaviour – factors with significant Net effect at the end of Year 5 (age 10)
Factor Effectsize
Description
Gender 0.32 Boys higher than girls
Ethnicity 0.39Some minority groups lower e.g. Indian, others higher e.g.Black African
Behavioural problems 0.221+ Early behavioural problems a predictor for increased ‘Anti-social’ behaviour
Mother’s Qualifications 0.16 Linear: Decreasing ‘Anti-social’ with increasing qualifications
Absent fathers 0.15 Absent fathers a predictor of ‘Anti-social’ behaviour
FSM 0.23 FSM a predicator of ‘Anti-social’ behaviour
KS1 HLE: One-to-one interaction 0.18Infrequent One-to-one interaction a predictor of increased ‘Anti-social’ behaviour
KS1 HLE: Expressive play 0.17Moderate levels of Expressive play a predictor of reduced ‘Anti-social’ behaviour (low and very high both predictors ofincreased ‘Anti-social’ behaviour)
The high ES for ethnicity represents slightly raised ‘Anti-social’ behaviour scores for Black Africanchildren and lower scores in other groups especially Indian children. However, as alreadymentioned in the previous section, this finding must be interpreted with great caution. Theproportion of missing fathers in this group of children (Black African) is nearly half, which issignificantly higher (almost double) the quarter in the general sample; the proportion of childreneligible for FSM is also higher in this group (35%) relative to the general sample (20%). Both ofthese factors are significant predictors of ‘Anti-social’ behaviour but are already included in themodel so the effect of ethnicity on ‘Anti-social’ behaviour should be seen as a net effectindependent of other factors. Nevertheless, considering the small number of children (50) andthe large standard deviations in this group (Sd=24.7) relative to the sample (Sd=15), thepossibility of extreme cases, as well as interactive effects between predictors, producing inflatedeffect sizes cannot be ruled out. No significant differences were found for the Black Caribbeangroup.
Earlier EPPE reports (Sammons et al., 2004b; Sammons et al., 2002; Melhuish et al., 2001) hadshown that an early start to child care before the age of 2 was associated with higher scores on‘Anti-social’ behaviour at ages 3, 5 and 6. However, by age 10 there was no relationship between

28
an early start in child care and higher rates of ‘Anti-social’ behaviour. It appears that the slightlyincreased risk of ’Anti-social’ behaviour in children with an early start in group child care hasfaded by age 10.
‘Pro-social’ behaviourGender was, by a very big margin, the strongest indicator of ‘Pro-social’ behaviour, with girlshaving more positive scores as a group. This was then followed by total family income,‘Expressive play’ during KS1, ‘Home computing’ during KS1, maternal qualifications and eligibilityfor free-school meals (FSM). Eligibility for free school meals (FSM) was the weakest predictor inthe model suggesting that disadvantage has a lesser role to play in ‘Pro-social’ behaviour than in‘Anti-social’ behaviour or in cognitive development.
Girls, children in the middle income bands (£17.5k-£37.5k annual family income) and children ofmothers with high qualification levels were rated by their teachers as showing more ‘Pro-social’behaviour. Children who use computers infrequently also show increased ‘Pro-social’ behaviour.In contrast, children who were reported to have had one or more behavioural problems at thestart of the study, children who engage infrequently in ‘Expressive play’ during KS1 and thoseeligible for FSM show decreased levels of ‘Pro-social’ behaviour.
Table 3.15‘Pro-social’ behaviour – factors with significant Net effect at the end of Year 5 (age 10)
Factor Effectsize
Description
Gender 0.63 Girls higher than boys
Behavioural problems 0.21 1+ behavioural problems = reduced ‘Pro-social’ behaviour
Mother’s Qualifications 0.19 Linear: Increasing ‘Pro-social’ behaviour with increasing qualifications
FSM 0.15 FSM = reduced ‘Pro-social’ behaviour
Family income 0.24 Middle income band = increased ‘Pro-social’ behaviour
KS1 HLE: Home computing 0.22 Infrequent usage = increased ‘Pro-social’ behaviour
KS1 HLE: Expressive play 0.24 Infrequent Expressive play = reduced ‘Pro-social’ behaviour
Further analyses were conducted to examine the influence of individual background factors inYear 1 compared to Year 5, and the results show that some background factors increased in theirimpact on social behaviour whereas others reduced. These results are reported in the nextsection and are important to show for which groups of pupils the gap in social/behaviouraldevelopment widened or alternatively reduced in KS2.

29
Section 4: Exploring the Impact of Background Factors on Children’sSocial/Behavioural developmental level and developmental progressover time
This section presents results from multilevel contextualised models and value added22
contextualised models to explore the impact of child and family characteristics on children’ssocial/behavioural developmental level and progress over time. In the first part of this section wefocus on children’s developmental level over time by comparing the net effects of backgroundfactors in Year 5 relative to Year 1 using results from contextualised multilevel models calculatedindependently for each year. In the second part we focus on children’s social/behaviouralprogress over time using value added models that include prior (Year 1) developmental level toexplore whether background factors, found to be significant predictors of developmental level atthe end of Year 5, were also associated with differential progress (value added) in socialbehaviour from Year 1 to Year 5. This is a new analysis of Year 1 data that extends earlieranalyses by focussing explicitly on developmental progress from Year 1 to Year 5.
4.1 Exploring the Impact of Background Factors on Children’s Social/Behaviouraldevelopmental level in Year 5 Compared to Year 1This section presents the main results of multilevel contextualised models that compare the neteffects of child and family characteristics as well as the net effects of the Early years HomeLearning Environment (HLE) on social/behavioural developmental level in Year 1 compared toYear 5. The change of net impact of different influencing factors reveals whether certain groupsof children that showed increased levels of negative social behaviour at the end of Year 1 havesustained this behaviour or have worsened by the end of Year 5. It also explores whether certaingroups of children have further improved or fallen behind compared to the average in terms oftheir social/behavioural development during Key Stage 2.
The same factors used in the contextualised models for Year 5 social/behavioural outcomes(presented in the previous section) were tested as potential predictors of Year 1social/behavioural outcomes so that direct comparisons at the two time points could be made.Comparisons were made on the basis of the effect sizes of the individual predictors in each set ofmodels. In the following description of the results, differences in effect sizes between Year 1 andYear 5 (_ES) are presented to indicate the extent of change in the impact of different backgroundfactors on social/behavioural development rather than using absolute effect sizes. The changesin effect sizes are presented without an algebraic sign, but the direction of change is explained inthe text. Table 4.1 summarizes the extent of change in effects.
Child MeasuresGender lost some of its impact on ‘Self-regulation’ (_ES=0.19) by Year 5. Girls are still doingbetter than boys but boys are catching up. Boys, however, are falling further behind whencompared to girls on the other three aspects of social/behavioural development. Differencesbetween the genders have increased over the years with boys showing higher levels of‘Hyperactivity’ (_ES=0.25) and ‘Anti-social’ behaviour (_ES=0.26) and lower levels of ‘Pro-social’behaviour (_ES=0.15) by Year 5.
In both years children with low birth weight showed lower ‘Self-regulation’ than children withnormal birth weight; the effect of low birth weight on ‘Self-regulation’ has become somewhatstronger (_ES=0.10) by Year 5.
With regard to mother tongue the effect of ‘needing EAL support’ has remained the same for‘Hyperactivity’ (_ES=0.01) with children who need EAL support still showing significantly higherlevels of hyperactive behaviour. In contrast, the impact of ‘needing EAL support’ has become
22
Including prior attainment.

30
stronger for ‘Self-regulation’ (_ES=0.29) showing children who need EAL support are fallingfurther behind in terms of self-regulating behaviour.
Table 4.1The impact of child, family and HLE on Social behaviour at Year 5 compared to Year 1
‘Hyperactivity’ Effect isnow
Description
Gender Stronger Boys show an increase in hyperactive scores at Year 5
Ethnicity StrongerHigher ‘Hyperactivity’ for children of Black Caribbean, Black African andMixed race ethnic origins and lower for children of Bangladeshi ethnic originsat Year 5
Siblings Weaker Effect of siblings decreased
Health problems Same Same for 1-2 Health problems; stronger for 3+ health problems at Year 5
Behavioural problems Same Early developmental problems still predictor for increased ‘Hyperactivity’
Need of EAL support Same Need of EAL support still a predictor for increased ‘Hyperactivity’
Mother’s QualificationsSlightly
StrongerChildren of more educated mothers show reduced ‘Hyperactivity’ in Year 5
Marital status Stronger Children of single or separated mothers show higher ‘Hyperactivity’ by Year 5
Maternal employment Same Mother not working still a predictor of reduced ‘Hyperactivity’
FSM Same FSM still a predictor of raised hyperactive scores in both years
Family earned income Stronger Middle income band are doing even better (less ‘Hyperactivity’) in Year 5
‘Self-regulation’ Effect isnow
Description
Gender Weaker Gap between girls and boys decreased; though girls still higher in Year 5
Birth weight Stronger Effect of low birth weight is stronger
Developmentalproblems
Same Same for 1 developmental problem; weaker for 2+
Need of EAL support Stronger The effect for ‘need of EAL support’ increased
Mother’s QualificationsSlightlyWeaker
The effect of mother’s qualification slightly decreased
Father’s qualifications Stronger Increasing ‘Self-regulation’ with increasing qualifications
FSM Same FSM still a predicator of reduced ‘Self-regulation’
Family earned incomeSlightly
StrongerSlight increases across all categories
Early years HLEMixedPattern
Effect remained the same for the top but was weaker for all others
‘Anti-social’ Effect isnow
Description
Gender Stronger Boys higher than girls
Ethnicity Weaker Effect is weaker for all groups apart from Black African
Behavioural problems Same Same for 1 behavioural problem; Weaker for 2+
Mother’s Qualifications Weaker The effect of mother’s qualification slightly decreased
Absent fathers Stronger The effect of absent father slightly increased
FSM Same FSM still a predicator of ‘Anti-social’ behaviour
‘Pro-social’ Effect isnow
Description
Gender Stronger The gap between girls and boys increased; girls are still higher in Year 5
Behavioural problems Same Same for 1 behavioural problem; Stronger for 2+
Mother’s QualificationsSlightly
StrongerIncreasing ‘Pro-social’ behaviour with increasing qualifications
FSM Same FSM still a predicator of reduced ‘Pro-social’ behaviour
Family earned income Stronger Decrease for lower band; small increases for all other categories

31
The effect of early health, developmental and behavioural problems has remained the same forall aspects of social/behavioural development (_ES< 0.05) for the ‘1 problem’ categories23.Children with siblings show reduced levels of ‘Hyperactivity’ relative to singletons in both years,but the effect has decreased (1-2 siblings: _ES=0.06; 3+ siblings _ES=0.14) by Year 5.
The impact of ethnicity has become stronger for ‘Hyperactivity’. Children of Black Caribbean(_ES=0.21), Black African (_ES=0.11) and Mixed race (_ES=0.24) ethnic origin showedincreased levels of ‘Hyperactivity’ by Year 5. In contrast, hyperactive behaviour in Bangladeshi(_ES=0.34) children has decreased. ‘Hyperactivity’ remained the same for all other ethnic groups(ES≤0.06).
In contrast, to findings for ‘Hyperactivity’, findings for ethnicity and ‘Anti-social’ behaviour suggestthat the influence has weakened between Year 1 and Year 5. The effects have reducedsignificantly for all ethnic groups especially for children of Indian (_ES=0.28), Pakistani(_ES=0.36) and Bangladeshi (_ ES=0.47) ethnic origin, for whom the pattern is reversed, fromshowing higher levels of ‘Anti-social’ behaviour relative to White UK children in Year 1, to showinglower levels of ‘Anti-social’ behaviour in Year 5. The only exception was the group of BlackAfrican children for whom the effect has become slightly stronger (_ES=0.14) by Year 5.However, as already noted, given the relatively small sizes of some ethnic groups in the EPPE 3-11 sample the results should be interpreted with caution. Nonetheless they suggest that changesin the relative strength of differences in social behaviour between pupil sub-groups are worthfurther exploration and may link with changes in the relationships between ethnicity and cognitiveattainment.
Family MeasuresIt was found that the highest qualification level of the mother was a somewhat stronger predictorof children’s social/behavioural development at Year 5 than at earlier time points. Investigatingthe change of strength of effect size between Year 1 and Year 5, the findings illustrate that theinfluence of mother’s qualification is slightly stronger for ‘Hyperactivity’ and ‘Pro-social’ behaviour,but has become weaker for ‘Anti-social’ behaviour and slightly weaker for ‘Self-regulation’. Forboth years the comparison group was ‘mothers with no qualification’. Differences in effect sizes(_ES) between Year 1 and Year 5 for ‘Anti-social’ behaviour lie in the range between _ES = 0.09(Higher degree) and _ES=0.22 (18 academic); differences between categories on ‘Self-regulation’are between _ES=0.02 and _ES=0.08 indicating a very small decrease in the strength of effect forboth these outcome measures. Differences between categories on ‘Hyperactivity’ and ‘Pro-social’behaviour lie in the range between _ES=0.02 and _ES=0.10; these _ES are relatively smallindicating a marginal increase in the strength of mother’s qualification on these aspects ofsocial/behavioural development.
The overall impact of father’s qualification on ‘Self-regulation’ is somewhat higher in Year 5compared to Year 1. The effect sizes for the higher qualification categories ‘18 academic’ andabove (_ES=0.10) have increased while the effect sizes for the lower qualification levels havedecreased (_ES≤0.05). Overall, this pattern of change indicates that differences in ‘Self-regulation’ between the children whose father’s have lower and higher qualification bands havebecome larger, and that the overall increase in developmental level of children whose fathers areof the lower qualification bands is poorer relative to children whose fathers have an 18 academiclevel of qualification and above.
The effect of maternal employment on ‘Hyperactivity’ remained the same over the years(_ES=0.02), but the net effect of marital status on this aspect of social/behavioural developmenthas become somewhat stronger with children of single (_ES=0.12) and separated (_ES=0.10)mothers showing increasing levels of ‘Hyperactivity’ by Year 5.The impact of family earned income has increased in strength for ‘Hyperactivity’. Differences ineffect sizes between Year 1 and Year 5 were in the range of _ES=0.04 and _ES=0.18. The
23
The number of children in the 2+ categories is too small for consistent patterns. In some cases the effects werestronger and in others the effect was weaker. Details are provided in Table 4.1.
32
largest increments were for the medium income categories (£17.5K-30K _ES=0.14; £30K-37.5K_ES=0.18), however the change relative to the initial Year 1 level was more or less constantacross income categories. Taken together these results suggest that while family earned incomehas become a stronger predictor of ‘Hyperactivity’ (relative to other predictors), and that therelative differences between income categories have remained constant.
Differences in effect sizes between Year 1 and Year 5 on ‘Self-regulation’ are in the range of_ES=0.04 to 0.09 indicating a slight increase in the overall predictive strength of family earnedincome. ‘Pro-social’ behaviour differences between Year 1 and Year 5 indicated small positivechanges (_ES≤0.05) for most income groups with the exception of the lowest earned incomeband (<£17.5K) for which a larger decrease (_ES=0.12) was evident. This suggests that childrenfrom the lowest income category are lagging further behind for ‘Pro-social’ behaviour relative to allother income groups.
Looking at eligibility for free school meals (FSM), the findings illustrate that the impact hasremained very stable for ‘Self-regulation’ (_ES=0.06), ‘Pro-social’ behaviour (_ES=0.04),‘Hyperactivity’ (_ES=0.02) and ‘Anti-social’ behaviour (_ES=0.02).
Early Years Home Learning Environment (HLE) MeasuresThe quality of the Early years HLE was found to be an important predictor for ‘Self-regulation’ atearlier time points. Early years HLE continues to be an important predictor of ‘Self-regulation’ butits impact has somewhat decreased for all categories (_ES=0.03 to 0.12) with the exception of thevery top scoring category for which it has not changed. This indicates that the gap betweenchildren who experienced a very good Early years HLE and those for whom the HLE was lessfavourable has increased somewhat24. However, as an overall predictor of ‘Self-regulation’, Earlyyears HLE has reduced its impact relative to other factors such as father’s qualifications. It is thevery high scoring Early years HLE group that shows the strongest and most stable long terminfluence.
4.2 Estimating social/behavioural developmental progress over timeSo far we have focused on changes in developmental level over time by examining changes inthe strength of background factors (e.g., gender) as predictors for Year 1 outcomes (e.g.,‘Hyperactivity’ in Year 1) relative to the equivalent models in Year 5 (e.g., ‘Hyperactivity’ in Year5). In this part we focus on developmental progress over time by using the relevant Year 1outcome as a predictor variable in the Year 5 models (see figure 4.1).
Complex value added25 analyses were conducted for the four social/behavioural outcomes toexplore changes in social/behavioural development from Year 1 to Year 5. For these analyseswe included in the contextualised multilevel models prior social/behavioural developmental level,using the relevant social/behavioural outcome collected at Year 1 in addition to the backgroundfactors presented in previous sections. These analyses were undertaken to explore whether thechild, family and HLE characteristics, found to be significant in predicting social behaviour at theend of Year 5 were also associated with differential progress or change in social behaviourbetween Year 1 and Year 5 of primary school education.
24 We did not use the KS1 HLE for the comparison analysis since these data were collected at a later time point.25 Complex value added models are contextualised models (controlling for background characteristics) that also includeprior social behaviour. Simple value added models include prior social behaviour only; they do not control forbackgrounds characteristics.

33
Figure 4.1: Modelling children’s developmental level and developmental progress overtime`
* bi is the model’s estimate of a predictor variable used to calculate the effect size (ES)
Using prior (Year 1) developmental level as a predictor in the contextualised models for Year 5would render some background factors in these models non significant since some (or all) of theirinfluence could be absorbed in the Year 1 outcome measure. Any effect left over after priordevelopmental level has been taken into account would therefore indicate that a given factor notonly predicts level of development at a given time point (developmental level) but also rate ofimprovement over time (progress). Thus, if in the previous analysis a given factor has becomestronger in Year 5 relative to Year 1 (e.g. gender for ‘Hyperactivity’) we would expect this factor toremain significant after prior developmental level has been taken into account. Factors for whichthere was no change in effects size or those which have become weaker from Year 1 to Year 5are likely to, but may not necessarily become non significant in the value added models since theeffects are not strictly additive. Results from the value added analyses are presented in Table 4.2.
For ‘Hyperactivity’ the findings indicate that girls (ES=0.46), Indian (ES=-0.27) Pakistani (ES=-0.23) and Bangladeshi children (ES=-0.51), children who have high qualified mothers (18academic’ and above ES=-0.14 to ES=-0.32) and who belong to families of medium income band(ES=-0.20) are showing significantly better progress in terms of reduced hyperactive behaviour.On the other hand, children whose parents reported (at the start of the project) that children hadbehavioural problems (ES=0.15 for 1-2 problems and ES=0.33 for 2+ problems) and children tosingle (ES=-0.17) or separated (ES=-0.16) mothers made significantly less progress betweentheir first and their fifth year of primary school education in terms of reduced ‘Hyperactivity’.Children who had very high scores on ‘Enrichment outings’ during KS1 (ES=0.14) and those whowere infrequently engaged in ‘Expressive play’ during KS1 (ES=0.21) also showed less progress.Gender and mother’s qualification have the stronger links with progress for ‘Hyperactivity’ relativeto other background measures.
Improved ‘Self-regulation’ was significant for children to fathers with the highest qualification level(degree or higher ES=0.27) children of families belonging to the medium income band and above(≥£17,500) (ES=0.19 to ES=0.27) children with the highest Early years HLE scores (ES=0.35)and children with absent fathers (ES=0.11). Children in the lower HLE categories did not showsignificant progress in ‘Self-regulation’ between Year 1 and Year 5. Progress in ‘Self-regulation’was poorer for children with one developmental problem (ES=-0.18) and those needing EALsupport (ES=-0.38). ‘Need of EAL support’ was the stronger predictor of the value added modelfor ‘Self-regulation’.
Developmental level
b1 (gender) - b5 (gender)
b1* Y1Hyperactivity
Gender
b5 Y5Hyperactivity
Gender
Developmental progress
b5 Y5Hyperactivity
Gender
Y1Hyperactivity Gender
b5 (gender) given b5 (prior attainment)
b5
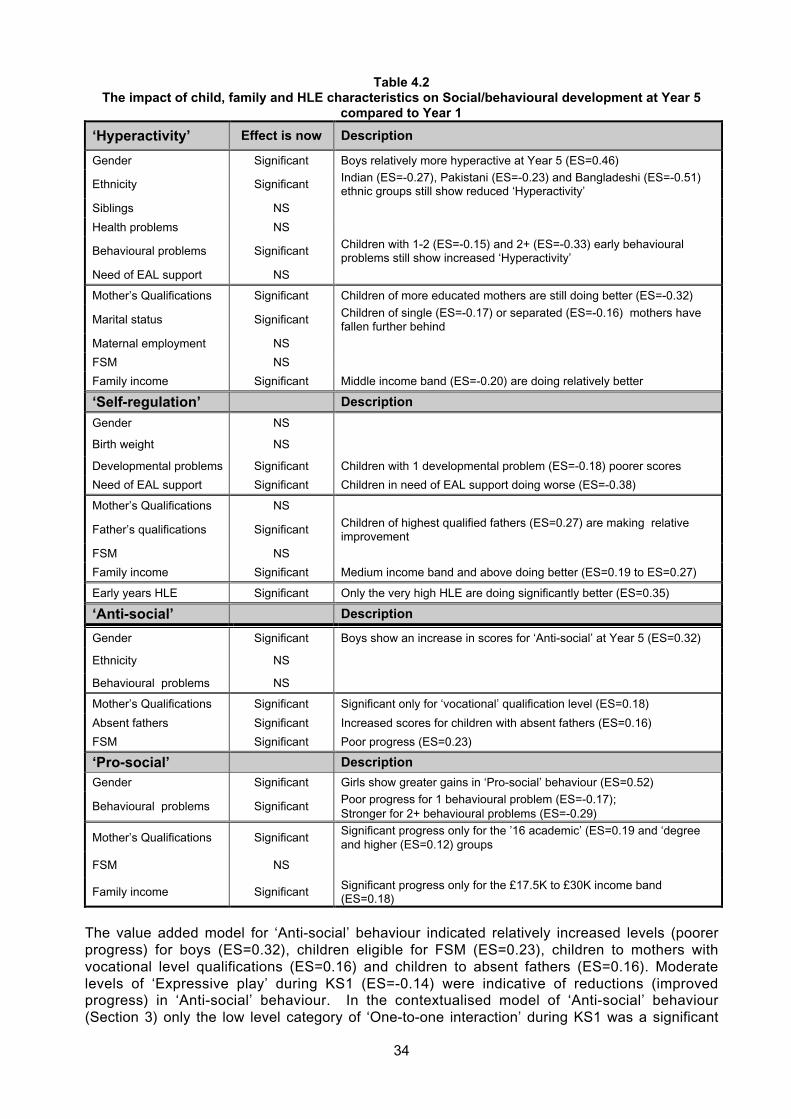
34
Table 4.2The impact of child, family and HLE characteristics on Social/behavioural development at Year 5
compared to Year 1
‘Hyperactivity’ Effect is now Description
Gender Significant Boys relatively more hyperactive at Year 5 (ES=0.46)
Ethnicity SignificantIndian (ES=-0.27), Pakistani (ES=-0.23) and Bangladeshi (ES=-0.51)ethnic groups still show reduced ‘Hyperactivity’
Siblings NS
Health problems NS
Behavioural problems SignificantChildren with 1-2 (ES=-0.15) and 2+ (ES=-0.33) early behaviouralproblems still show increased ‘Hyperactivity’
Need of EAL support NS
Mother’s Qualifications Significant Children of more educated mothers are still doing better (ES=-0.32)
Marital status SignificantChildren of single (ES=-0.17) or separated (ES=-0.16) mothers havefallen further behind
Maternal employment NS
FSM NS
Family income Significant Middle income band (ES=-0.20) are doing relatively better
‘Self-regulation’ Description
Gender NS
Birth weight NS
Developmental problems Significant Children with 1 developmental problem (ES=-0.18) poorer scores
Need of EAL support Significant Children in need of EAL support doing worse (ES=-0.38)
Mother’s Qualifications NS
Father’s qualifications SignificantChildren of highest qualified fathers (ES=0.27) are making relativeimprovement
FSM NS
Family income Significant Medium income band and above doing better (ES=0.19 to ES=0.27)
Early years HLE Significant Only the very high HLE are doing significantly better (ES=0.35)
‘Anti-social’ Description
Gender Significant Boys show an increase in scores for ‘Anti-social’ at Year 5 (ES=0.32)
Ethnicity NS
Behavioural problems NS
Mother’s Qualifications Significant Significant only for ‘vocational’ qualification level (ES=0.18)
Absent fathers Significant Increased scores for children with absent fathers (ES=0.16)
FSM Significant Poor progress (ES=0.23)
‘Pro-social’ Description
Gender Significant Girls show greater gains in ‘Pro-social’ behaviour (ES=0.52)
Behavioural problems SignificantPoor progress for 1 behavioural problem (ES=-0.17);Stronger for 2+ behavioural problems (ES=-0.29)
Mother’s Qualifications SignificantSignificant progress only for the ’16 academic’ (ES=0.19 and ‘degreeand higher (ES=0.12) groups
FSM NS
Family income SignificantSignificant progress only for the £17.5K to £30K income band(ES=0.18)
The value added model for ‘Anti-social’ behaviour indicated relatively increased levels (poorerprogress) for boys (ES=0.32), children eligible for FSM (ES=0.23), children to mothers withvocational level qualifications (ES=0.16) and children to absent fathers (ES=0.16). Moderatelevels of ‘Expressive play’ during KS1 (ES=-0.14) were indicative of reductions (improvedprogress) in ‘Anti-social’ behaviour. In the contextualised model of ‘Anti-social’ behaviour(Section 3) only the low level category of ‘One-to-one interaction’ during KS1 was a significant
35
predictor of ‘Anti-social’ behaviour. In the value added models all ‘One-to-one interaction’ duringKS1 categories were strongly associated with increased ‘Anti-social’ behaviour (ES=0.18 toES=0.15) in comparison with very high ‘One-to-one interaction’ during KS1 category. This pointsto the value of high levels of one-to-one parent child interaction during KS1 in reducing ‘Anti-social’ behaviour for this age group.
Apart from FSM no longer being significant, the combination of variables predicting progress in‘Pro-social’ behaviour did not change significantly from the contextualised models reported insection 3. Gender was still the strongest indicator of positive progress of ‘Pro-social’ behaviourfollowed by family income and maternal qualifications; however the only categories for whichprogress was significant were the low/medium (£17.5K to £30K) income band categories and the’16 academic’ (ES=0.17) and ‘degree and higher’ (ES=0.12) categories of maternal qualifications.
Girls (ES=0.52), children in the middle income bands (17.5k-30K annual family income)(ES=0.18) and children to mothers with the ’16 academic’ qualification level (ES=0.18) and‘degree and higher’ (ES=0.12) and children who use computers in moderation (ES=0.21) showedsignificant progress in ‘Pro-social’ behaviour. In contrast, children who were reported (by theirparents at the start of the study) to have behavioural problems (ES=-0.17 1 behavioural problem;2+ behavioural problems ES=-0.29) and children who engage infrequently in ‘Expressive play’during KS1 (ES=-0.22) show poorer progress in ‘Pro-social’ behaviour.

36
Section 5: The overall impact of background characteristics and priordevelopmental level on social/behavioural development
5.1 Null modelsTable 5.1 shows the null models with no explanatory variables included for the foursocial/behavioural outcomes. The intra-school correlation measures the extent to which thescores of children in the same primary school resemble each other as compared with those fromchildren at different schools. The intra-school correlation for the social/behavioural measuresindicate that approximately four to twelve per cent of the variation in children’s social behaviour isrelated to differences between individual primary schools; while the majority of the variationreflects differences between individual children. These proportions are of similar magnitude tothose identified for the social/behavioural outcomes at the end of Year 1. However, whencompared with the equivalent analysis of Reading and Mathematics attainment at Year 5, theproportion of school level variation in social/behavioural outcomes in Year 5 is significantly lowerthan the proportions reported for cognitive attainment (19%-21%). This is perhaps not surprisingas schools have explicit curriculum goals to promote academic outcomes such as progress inReading and Mathematics. The greatest variation between primary schools is for ‘Pro-social’(12%) behaviour and the least for ‘Self-regulation’ (4%), which, again, reflects the pattern ofresults reported for Year 1.
Table 5.1Null model showing primary school and child level variance of Year 5 Social/behavioural outcomes
‘Hyperactivity’ ‘Self-regulation’ ‘Pro-social’ ‘Anti-social’
Estimate(standard error26)
Estimate(standard error)
Estimate(standard error)
Estimate(standard error)
School level varianceestimate
0.072(0.02) 0.039(0.015) 0.121(0.023) 0.049(0.020)
Child level variance 0.930(0.03) 0.961(0.029) 0.879(0.029) 0.952(0.031)
Intra-school correlation 0.072 0.039 0.121 0.049
Number of children 2405 2410 2402 2396
Number of schools 924 926 923 922
Caution is needed in interpreting the intra-school correlations because approximately sixty percent of the primary schools in our analysis had only one EPPE child in attendance and theaverage number of EPPE children per school is 2.6 (maximum = 40). The observed intra-schoolcorrelations for this sample therefore, are likely to be a conservative estimate of differencesbetween schools.
5.2 Contextualised and Simple value added modelsThe effects of background characteristics, as well as prior developmental level, on the intra-school correlations are reported in Table 5.2. Results from contextualised multilevel models showthe proportion of variance in Year 5 social/behavioural outcomes accounted for by child, familyand Home Learning Environment (HLE) characteristics; while results from simple value addedanalyses show the proportion of variance in Year 5 social measures accounted for by priordevelopmental level. Thus, the simple value added models controlled only for priorsocial/behavioural developmental level using the relevant social/behavioural outcome collected atYear 1.
26
The standard error provides a measure of the confidence limits associated with each estimate and is used toestablish the statistical significance of the results.

37
Intra-school correlationsThe intra-school correlations for the contextualised models range from 0.03 to 0.14 indicating thatthere is still some variation between primary schools in pupils’ social/behavioural outcomes aftertaking into account the influence of background factors, most notably for ‘Pro-social’ behaviour. Itis interesting that when background is controlled for, the intra-school correlation for ‘Pro-social’behaviour increases, whereas intra-school correlations for the other aspects of social behaviourdecrease. This suggests that ‘Pro-social’ behaviour is more likely to be affected by differencesbetween schools (e.g. in classroom climate, behavioural expectations, peer influences etc).
The intra-school correlations for the value added models are in the same range (0.03-0.14) asthose for the contextualised models. The value added models however show an increase inschool variation not only for ‘Pro-social’ (0.14) behaviour but also for ‘Self-regulation’ (0.075) forwhich the intra-school correlation almost doubled in magnitude relative to the null model (0.039).This suggests that differences between individual schools in promoting self regulating behaviourin their pupils become more pronounced once earlier self regulating behaviour is taken intoaccount.
Table 5.2Contextualised models of social/behavioural measures at Year 5 showing primary school and
child level variance
‘Hyperactivity’ ‘Self-regulation’
‘Pro--social’ ‘Anti-social’
Estimate(standard error)
Estimate(standard error)
Estimate(standard error)
Estimate(standard error)
Contextualisedmodels
0.048(0.015) 0.027(0.013) 0.12(0.022) 0.039(0.017)School levelvarianceestimate (se) Value add
models0.040(0.013) 0.057(0.016) 0.12(0.022) 0.030(0.016)
Contextualisedmodels
0.75(0.024) 0.850(0.027) 0.747(0.025) 0.859(0.028)Child levelvariance (se) Value add
models0.64(0.021) 0.709(0.027) 0.754(0.026) 0.885(0.029)
Contextualisedmodels
0.06 0.031 0.143 0.044Intra-schoolcorrelation Value add
models0.059 0.075 0.137 0.033
Contextualisedmodels
33.1 29.9No reduction
varianceincreased 2.3
18.8% Reductionin schoollevel variance Value add
models43.6
No reductionVariance
increased -46.7
No reductionVariance
increased - 1.5
38.0
Contextualisedmodels
19.4 11.5 14.9 9.8% Reductionin child levelvariance Value add
models31.0 26.2 14.3 7.0
Contextualisedmodels
20.4 12.3 12.8 10.2% Reductiontotal variance Value add
models31.9 23.4 12.7 8.5
38
Child level variance - differences between individual childrenThe proportion of variance at the child level accounted for by child, family and the HLE factorsranges from 10 to 19 per cent, being higher for ‘Hyperactivity’ (19%) and ‘Pro-social’ (15%)behaviour and lower for ‘Self-regulation’ (12%) and ‘Anti-social’ (10%) behaviour. Whilst thisrepresents a significant proportion, the majority of the variation in individual children’s behaviourat the end of Year 5 (age 10) is attributable to other factors.
The proportion of child level variance accounted for by prior developmental level in Year 1 variesquite significantly for the four different aspects of social behaviour. The highest reduction in childlevel variance accounted for by prior developmental level is for ‘Hyperactivity’ (31%) indicatingthat a significant proportion of the variation in individual children’s hyperactive behaviour at age10 is attributable to their hyperactive behaviour at age 6. In contrast, a much lower reduction inchild level variance is associated with ‘Anti-social’ behaviour (7%) indicating that little variation inthis aspect of social behaviour can be attributed to behaviour at the earlier time point. Thecomparatively low correlation between Year 1 and Year 5 measures of ‘Anti-social’ behaviourreported in Section 2, and the age related differences in the expression of this social attribute(also discussed in Section 2) are in line with this finding. This suggests that ‘Anti-social’behaviour is more variable over Key Stage 2 than other social behaviours.
Overall, prior developmental level accounts for a greater reduction in child level variance in’Hyperactivity’ and especially ‘Self-regulation’ than background characteristics, suggesting that forthese two aspects of social behaviour, factors intrinsic to the child, but not included in theanalyses (e.g. general ability) have a greater role to play in shaping behaviour than factors suchas those included in the model (e.g. gender, ethnicity). Reductions in child level variance for ‘Pro-social’ and ‘Anti-social’ behaviour are of similar magnitude in the contextualised (backgroundcharacteristics) and value added (prior developmental level) models, suggesting that for theseaspects of social behaviour background characteristics and child specific factors (as manifestedin prior behaviour) are of similar importance.
School level variance - differences between schoolsReductions in school level variance reflect the importance of school composition and intakecharacteristics in accounting for differences in pupil outcomes between schools. Whenchild/family background factors such as ethnicity, FSM, family income etc. are taken into account,differences between schools decrease for ‘Hyperactivity’ (33%) ‘Self-regulation’ (30%) and ‘Anti-social’ (19%) behaviour indicating that for these social/behavioural outcomes a reasonably largeproportion of the variation between schools is attributable to differences in school composition.While these proportions of variance are high, they are notably lower than the proportions reportedfor Reading (94%) and Mathematics (64%) where the majority of the school level variance wasattributed to school intake composition.
By contrast, we find that school level variance in the contextualised models for ‘Pro-social’behaviour increases, indicating that differences between schools in terms of their impact on ‘Pro-social’ behaviour become more apparent when intake differences are taken into account.
The proportion of school level variance accounted for by prior developmental level is quite highfor ‘Hyperactivity’ (43%) and ‘Anti-social’ behaviour (38%). This suggests that a fairly largeproportion of the variation between schools on these two social/behavioural outcomes isexplained by their pupil’s developmental level at an earlier time point in Key Stage 1 (Year 1).Thus, schools that had a high proportion of pupils with raised ‘Hyperactivity’ and ‘Anti-social’scores at the end of Year 1 are likely to have a high overall score for ‘Hyperactivity’ and ‘Anti-social’ behaviour at the end of Year 5, and vice versa. That prior ‘Anti-social’ behaviour accountsfor around 40 per cent of the reduction in school level variance while accounting for only 7 percent reduction in child level variance indicates strong school context (e.g. peer) influences. Inother words, children in schools with high incidence of ‘Anti-social’ behaviour are likely to be more‘Anti-social’ even if they had relatively low ‘Anti-social’ scores at entry to school, whereas childrenwith high ‘Anti-social’ scores in low incidence schools may be less ‘Anti-social’ than otherwiseexpected. Given the small numbers of children per school any interpretations must remain

39
tentative. It is possible that school climate and processes affect, or are affected by, the ‘Anti-social’ behaviour of children in different ways. This and other findings will be further explored inthe Tier 3 report linking Year 5 outcomes to classroom observations.
In contrast, school variations in the value added models for ‘Self-regulation’ (46%) and ‘Pro-social’ behaviour (1.5%) increase, thus emphasising differences in the impact of prior socialbehaviour between schools. This suggests that differences between schools in promoting self-regulating and ‘Pro-social’ behaviour in their pupils become more pronounced once priordevelopmental level is taken into account. Thus, regardless of the proportion of pupils in a schoolwho showed increased positive ‘Self-regulation’ and ‘Pro-social’ behaviour at the end of Year 1,certain schools further developed these behaviours in their pupils, while other schools were muchless successful in promoting these attributes.
Overall, there are greater changes (increase or decreases) in school level variance accounted forby prior developmental level than by background factors. This is in contrast to the resultsreported for the cognitive outcomes where background accounted for much more of the schoollevel variance in Reading (94%) and Mathematics (64%) than prior attainment (35% and 50%respectively).
Total varianceOverall, background factors account for around a fifth of the total variance in ‘Hyperactivity’ inYear 5, with somewhat lower proportions for ‘Self-regulation’ (12%), ‘Pro-social’ behaviour (13%)and ‘Anti-social’ behaviour (10%). Prior developmental level accounts for around 32% of the totalvariance in ‘Hyperactivity’ and around 23% in ‘Self-regulation’. The proportion of total varianceaccounted for by prior developmental level in ‘Pro-social’ (13%) and ‘Anti-social’ behaviour (9%)is somewhat lower. More of the total variance in ‘Self-regulation’ and ‘Hyperactivity’ is accountedfor by prior developmental level than by background characteristics.
While a significant proportion of variance is attributable to differences in background and priordevelopmental level for all social/behavioural outcomes, taken together the predictive power ofbackground characteristics and prior developmental level is weaker for social behaviour(contextulaised-10%-20%; value added 9%-32% reduction in total variance) than for cognitiveoutcomes at age 10 (22%-28%; and 32%-42%). In contrast, variations in behaviour associatedwith child level variance are greater for the social behaviour measures (10%-19% reduction) thanfor cognitive attainment (11%-13%) in the contextualised model. In the simple value addedmodels, reductions in child level variance are greatest for Mathematics (40%), ‘Hyperactivity’(31%), and ‘Self-regulation’ (26%).
40
Section 6: Pre-school quality and effectiveness and primary schooleffectiveness
After taking account of the impact of child, family and Home Learning Environment (HLE)characteristics, pre- and primary school characteristics have been entered into the model asadditional potential influencing factors on subsequent social/behavioural development. Measuresof pre-school quality were collected using the ECERS-E and ECERS-R observational instruments(see Sylva et al., 1999a). Effectiveness indicators for individual pre-school settings werecalculated using value added multilevel models of EPPE children’s progress from age 3+ to entryto reception in primary school during the pre-school phase of the research. Effectiveness in thiscontext is measured in terms of pre- or primary school settings that promoted progress in positivesocial skills (e.g. ‘Self-regulation’), or help to reduce negative aspects of social behaviour (e.g.‘Hyperactivity’). In addition, independent academic effectiveness indicators for primary schoolwere calculated using National Assessment data sets for all primary schools in England linkingKS1 and KS2 results for successive cohorts over three school years 2002-2004 (see Melhuish etal., 2006a).
6.1 The effect of attending pre-school compared to noneAt age 10, there are no significant net effects of ‘just’ attending pre-school (compared to none) on‘Hyperactivity’, ‘Self-regulation’ and ‘Anti-social’ behaviour. This is in contrast to patterns found atyounger ages, particularly at entry to primary school. The comparison in this case is betweenchildren who have attended pre-school and ‘Home’ children (who did not), and the differences areno longer statistically significant. There is, however, a significant net effect of pre-school for ‘Pro-social’ behaviour. Children who attended pre-school were rated by their primary teachers asshowing significantly more ‘Pro-social’ behaviour than the ‘Home’ group (ES=0.16) in Year 5.There were no significant differences in relation to type of pre-school attended, number ofsessions attended, or the number of months (duration) spent in pre-school. Time spent in pre-school was only statistically significant and positive for ‘Pro-social’ behaviour and only for thosewho started under the age of 3 years (ES=0.28). This suggests some longer term benefits inadjustment to school at age 10 years. In contrast to findings at younger ages there are noindications that a longer duration has any continued impact on outcomes such as ‘Anti-social’behaviour in KS2.
6.2 The impact of pre-school effectiveness (as measured by value added analyses)Significant effects on social behaviour at age 10 years are still found for indicators ofeffectiveness (as measured by value added analysis) and quality of the individual pre-schoolsetting attended. Children who had attended a more effective pre-school setting (in terms of itsimpact on positive social/behavioural change during the pre-school period up to entry toreception) still show significantly better social/behavioural development five years later.
Separate pre-school indicators of effectiveness were calculated for the different social dimensionsat pre-school. These included ‘Independence and Concentration’, ‘Peer-sociability’ and ‘Co-operation and Conformity’; for these indicators positive values represent an increase in thataspect of positive behaviour. A pre-school indicator for ‘Anti-social’ behaviour was also createdbut in this case positive values represent an increase in ‘Anti-social’ behaviour; for this indicatortherefore, greater effectiveness is indicated by low or negative values.
All four indicators of pre-school (value added) effectiveness, in promoting bettersocial/behavioural development, were found to be statistically significant predictors for betterscores on later ‘Self-regulation’ and ‘Pro-social’ behaviour at age 10 (Figure 6.1 and Figure 6.2)although the effects for ‘Pro-social behaviour are somewhat higher. Overall, children who haveattended any pre-school regardless of effectiveness show better ‘Self-regulation’ and more ‘Pro-social’ behaviour than the ‘Home’ group. However, attending a highly effective pre-school has astronger impact on later ‘Self-regulation’ and ‘Pro-social’ behaviour.

41
Children who have attended highly effective pre-schools were rated by their teachers as showingbetter ‘Self-regulation’ (ES=0.18 to ES=0.23) and more ‘Pro-social’ behaviour (ES=0.25 toES=0.34) relative to the low and medium effectiveness pre-schools. Children in the low andmedium effectiveness groups are not significantly different from each other, with the exception of‘Peer- sociability’, for which low (ES=0.24) and high (ES=0.25) effectiveness pre-schools areassociated with similar levels of ‘Pro-social’ behaviour.
Figure 6.1The impact of pre-school effectiveness on ‘Self- regulation’ behaviour at Year 5
Figure 6.2The impact of pre-school effectiveness on ‘Pro-social’ behaviour at Year 5
Eff
ect
Siz
es:
Sel
f-re
gu
lati
on
Four pre-school indicators of social/behavioural effectiveness
Four pre-school indicators of social/behavioural effectiveness
AntisocialPeer SociablilityCo-operation &Conformity
Independence &Concentration
0.30
0.20
0.10
0.00
-0.10
Eff
ect
Siz
es:
Sel
f re
gu
lati
on
by
pre
-sch
oo
l eff
ecti
ven
ess
mea
sure
s
0.000.000.000.00
0.23
0.18
0.230.23
0.12
0.100.100.09
0.07
0.09
0.04
0.07
Home Children
High Effectiveness
Medium Effectiveness
Low Effectiveness
Reference group: Home children

42
Interestingly pre-school effectiveness for ‘Anti-social’ behaviour was significant in predictingreduced ‘Hyperactivity in the longer term. Children who had attended a better (high effective) pre-school setting (one that reduced ‘Anti-social’ behaviour) are still showing better outcomes at age10 relative to all other groups (ES=-0.11) (see Figure 6.3). This effect is most notable relative tochildren who have attended low effective pre-schools (in terms of the ‘Anti-social’ behaviourindicator), where the absolute differences are of the greatest magnitude (ES=0.27; 0.16-[-0.11]).‘Hyperactivity’ was also reduced in the ‘Home’ children relative to children who have attended alow (ES=0.16) or medium (ES=0.07) effectiveness pre-school, which may resonate with thefinding of decreased ‘Hyperactivity’ in children of non-working mothers.
Figure 6.3The impact of pre-school effectiveness (‘Anti-social’ indicator of effectiveness) on later ‘Hyperactivity’
6.3 The impact of pre-school qualityResults from earlier phases of the study indicate the positive impact of higher quality pre-schoolprovision. The sample was divided into groups of children whose pre-school experience could beclassified as ranging from no quality (i.e. the ‘Home’ group, approximately 9% of the sample)through low (14%), medium (54%) and high quality (22%), based on individual pre-school centres’quality scores. The results in Year 5 indicate that the quality of the pre-school attended continuesto have an impact on different aspects of social/behavioural development at the end of Year 5. Ofthe two pre-school measures of quality (ECERS-R and ECERS-E), ECERS-R, which is ameasure of quality related to the ‘caring’ aspects of the pre-school experience, had a strongerrelationship with reduced ‘Hyperactivity’ and better scores for ‘Pro-social’ behaviour at age 10. Incontrast, ECERS-E, which is a measure of quality related to the educational aspects of the pre-school experience, was significantly associated with better later outcomes in ‘Self-regulation’ atage 10, which is itself linked with attainment. There was no significant effect of the quality of thepre-school attended on ‘Anti-social’ behaviour at age 10.
The net effects of quality as measured by ECERS-R were statistically significant for ‘Hyperactivity’and ‘Pro-social’ behaviour (Figure 6.4). At age 10 ‘Home’ children are rated by teachers asdisplaying significantly lower levels of ‘Pro-social’ behaviour relative to children who had attendedany pre-school, although the difference is most marked for those who attended high quality(ES=0.30). This is in accord with the finding on duration (reported earlier in this section). ‘Home’children, however, are rated by teachers as displaying significantly lower levels of ‘Hyperactivity’relative to children who have attended low quality (ES=0.13) and medium quality pre-school(ES=0.08). Children who have attended high quality pre-schools are rated by teachers asdisplaying the highest levels of ‘Pro-social’ behaviour (ES=0.30) and the lowest levels of‘Hyperactivity’ (ES=-0.06).
High EffectivenessMedium EffectivenessLow EffectivenessHome Children
Levelmain
0.20
0.15
0.10
0.05
0.00
-0.05
-0.10
-0.15
Effe
ct s
izes
: Hyp
erac
tive
beha
vrio
ur
-0.11
0.070.16…
Reference group: Home children
Eff
ect
Siz
es:
‘An
ti-s
oci
al’ b
ehav
iou
r
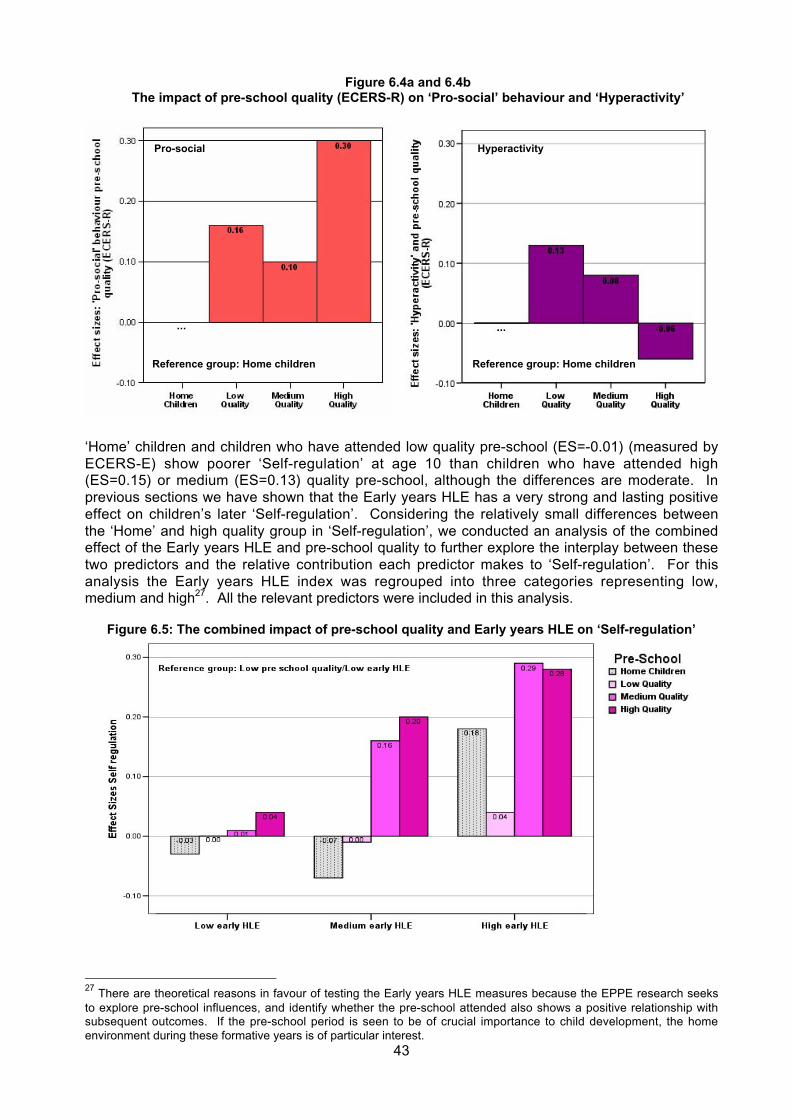
43
Figure 6.4a and 6.4bThe impact of pre-school quality (ECERS-R) on ‘Pro-social’ behaviour and ‘Hyperactivity’
‘Home’ children and children who have attended low quality pre-school (ES=-0.01) (measured byECERS-E) show poorer ‘Self-regulation’ at age 10 than children who have attended high(ES=0.15) or medium (ES=0.13) quality pre-school, although the differences are moderate. Inprevious sections we have shown that the Early years HLE has a very strong and lasting positiveeffect on children’s later ‘Self-regulation’. Considering the relatively small differences betweenthe ‘Home’ and high quality group in ‘Self-regulation’, we conducted an analysis of the combinedeffect of the Early years HLE and pre-school quality to further explore the interplay between thesetwo predictors and the relative contribution each predictor makes to ‘Self-regulation’. For thisanalysis the Early years HLE index was regrouped into three categories representing low,medium and high27. All the relevant predictors were included in this analysis.
Figure 6.5: The combined impact of pre-school quality and Early years HLE on ‘Self-regulation’
27 There are theoretical reasons in favour of testing the Early years HLE measures because the EPPE research seeksto explore pre-school influences, and identify whether the pre-school attended also shows a positive relationship withsubsequent outcomes. If the pre-school period is seen to be of crucial importance to child development, the homeenvironment during these formative years is of particular interest.
Reference group: Home children Reference group: Home children
HyperactivityPro-social

44
As can be seen in Figure 6.5, ‘Home’ children with high Early years HLE scores (ES=0.18) aredoing well relative to ‘Home’ children with low (ES=-0.03) and medium (ES=-0.07) HLE scores,but they are not doing as well as similar children who have attended medium (ES=0.29) and high(ES=0.28) quality pre-school. The greatest boost in ‘Self-regulation’ comes from the combinedeffect of medium or high pre-school quality and high Early years HLE (ES-0.20-0.28).
High Early years HLE alone is not enough; children who have high Early years HLE scores andattend low quality pre-schools still have poorer ‘Self-regulation’ at age 10 years than children withmedium Early years HLE scores who had attended high quality pre-school. Similarly, high qualitypre-schools improve ‘Self-regulation’ but it is not enough by itself; Self-regulating behaviour inchildren who go to high quality pre-schools still varies as a function of the HLE.
6.4 Primary school academic effectiveness (measured by value added analyses)Contextualised multilevel analyses presented in Section 3 of this report have shown that schoolvariation in social behaviour was strongly reduced after taking account of pupil intakecharacteristics. This result is not surprising given that a large number of schools in the EPPE 3-11 sample are only attended by one EPPE child (see Section 5) and it should not be concludedwrongly that the characteristics of an individual school do not make any difference in promotingthe certain aspects of social/behavioural development.
Analyses were conducted on the EPPE 3-11 data to establish the net impact of primary schoolsacademic effectiveness in terms of social/behavioural development without taking into accountany characteristics of pre-school experience in the first instance (but all the other relevantbackground, HLE and child characteristics). The value added effectiveness indicators for primaryschools were calculated using National Assessment data for all primary schools in Englandlinking KS1 and KS2 results; separate indicators were calculated for the different core curriculumsubjects English, Mathematics and Science (see Melhuish et al., 2006a; 2006b). Thesemeasures are thus independently derived and provide a measure of the academic success of theprimary school in promoting its pupils’ academic progress over several years. The academiceffectiveness of the primary school has already been shown to benefit children’s cognitiveoutcomes at age 10 years (See Sammons et al., 2007). It is also of interest to see whetheracademic effectiveness has an impact (positive or negative) on social behaviour.
The primary school’s academic effectiveness is found to be a significant predictor of the ‘Anti-social’ behaviour aspect of social/behaviour development (Figure 6.6), however, it is not asignificant predictor of the other aspects of social/behaviour development.
Figure 6.6: The impact of primary school academic effectiveness on ‘Anti-social’ behaviour
Three indicators of primary school academic effectiveness (value added)
Reference group: Low effectiveness

45
High academically effective schools appear to reduce ‘Anti-social’ behaviour. ‘Anti-social’behaviour in children who attend medium and high effectiveness primary schools is significantlylower than it is in children who attend high effectiveness primary schools.
From these findings we conclude that the academic effectiveness of the primary school attendedmatters for longer term development of ‘Anti-social’ behaviour. It makes an identifiable andseparate contribution to children’s later ‘Anti-social’ behaviour at Year 5, after controlling for child,family and HLE influences. This suggests that school factors are associated with better academicoutcomes and these may influence the behavioural climate of the school. School effectivenessresearch has previously suggested that an important feature of academically effective schools isthe creation of a positive and orderly school and classroom climate and these EPPE results are inaccord with such research (Teddlie & Reynolds, 2000).
In addition, it is possible that effective primary schools that are able to improve attainmentshowed an impact on reducing ‘Anti-social’ behaviour via the creation of such positive school andclassroom climates. Also, the associations between school academic effectiveness and ‘Anti-social’ behaviour may be bi-directional. Prior ‘Anti-social’ behaviour accounted for twice as muchof the reduction in school level variance in ‘Anti-social’ behaviour at the end of Year 5 (38%)relative to background characteristics (19%). It also accounted for a much greater reduction inschool level variance (38%) than in child level variance (7%) (see Section 5 for discussion).Overall, this supports the suggestion that raised overall levels of ‘Anti-social’ behaviour in aschool may result in low effectiveness and that school differences in effectiveness at the end ofYear 5 are likely to reflect differences in the distribution of ‘Anti-social’ behaviour within a schoolat Year 1. Indeed when the school effectiveness indicators are entered in the complex valueadded models, which account for prior developmental level as well as background factors, theimpact of school effectiveness is diminished.
6.5 An overview of pre- and primary school effectsAs children move through primary school, we would expect pre-school influences to lose some oftheir potency, or to be masked by the more positive or negative effects of the primary schoolsattended. Nevertheless, pre-school effects are still evident in children’s social behaviour fiveyears into primary education.
Simply attending pre-school still makes a difference to children’s ‘Pro-social’ behaviour at the endof Year 5; those children who attended pre-school are rated by their teachers as showingsignificantly increased levels of ‘Pro-social’ behaviour relative to children who stayed at home.For other dimensions of social behaviour, the effect of simply attending pre-school has washedout. However, the quality and effectiveness of the pre-school attended still makes a significantdifference.
All four indicators of pre-school effectiveness were found to be significant predictors of later ‘Self-regulation’ and ‘Pro-social’ behaviour, although the impact on ‘Pro’-social’ behaviour wassomewhat stronger (see Table 6.1). Children’s ‘Hyperactive’ behaviour was linked only with the‘Anti-social’ indicator of pre-school effectiveness, indicating that children who have attendedcentres that were effective in reducing ‘Anti-social’ behaviour show reduced levels of‘Hyperactive’ behaviour at age 10.
Pre-school quality also continues to show significant associations with later social behaviour, butdifferent aspects of quality were found to be associated with different aspects of behaviour. Themeasures of quality associated with the academic aspects of pre-school education (ECERS-E)was associated with ‘Self-regulation’, while the measure of quality associated with the ‘caring’aspects of pre-school (ECERS-E) was associated with ‘Hyperactivity’ and ‘Pro-social’ behaviour.
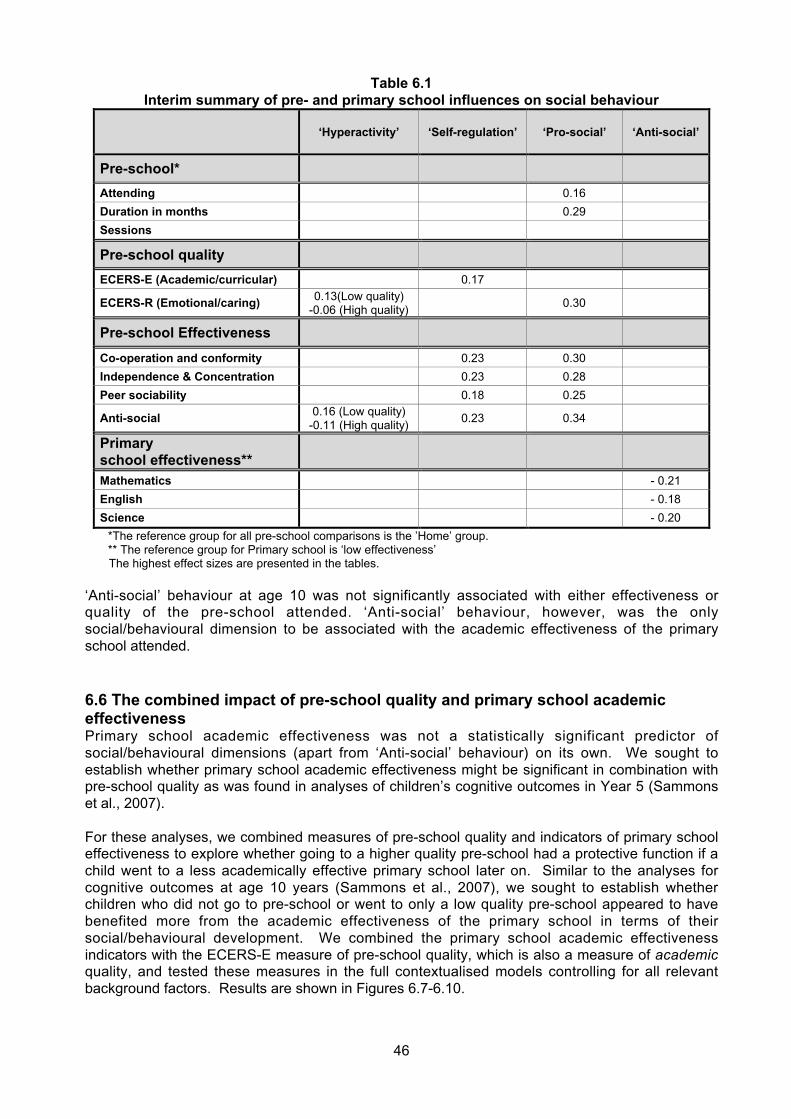
46
Table 6.1Interim summary of pre- and primary school influences on social behaviour
‘Hyperactivity’ ‘Self-regulation’ ‘Pro-social’ ‘Anti-social’
Pre-school*
Attending 0.16
Duration in months 0.29
Sessions
Pre-school quality
ECERS-E (Academic/curricular) 0.17
ECERS-R (Emotional/caring)0.13(Low quality)
-0.06 (High quality)0.30
Pre-school Effectiveness
Co-operation and conformity 0.23 0.30
Independence & Concentration 0.23 0.28
Peer sociability 0.18 0.25
Anti-social0.16 (Low quality)
-0.11 (High quality)0.23 0.34
Primaryschool effectiveness**Mathematics - 0.21
English - 0.18
Science - 0.20
*The reference group for all pre-school comparisons is the ’Home’ group. ** The reference group for Primary school is ‘low effectiveness’
The highest effect sizes are presented in the tables.
‘Anti-social’ behaviour at age 10 was not significantly associated with either effectiveness orquality of the pre-school attended. ‘Anti-social’ behaviour, however, was the onlysocial/behavioural dimension to be associated with the academic effectiveness of the primaryschool attended.
6.6 The combined impact of pre-school quality and primary school academiceffectivenessPrimary school academic effectiveness was not a statistically significant predictor ofsocial/behavioural dimensions (apart from ‘Anti-social’ behaviour) on its own. We sought toestablish whether primary school academic effectiveness might be significant in combination withpre-school quality as was found in analyses of children’s cognitive outcomes in Year 5 (Sammonset al., 2007).
For these analyses, we combined measures of pre-school quality and indicators of primary schooleffectiveness to explore whether going to a higher quality pre-school had a protective function if achild went to a less academically effective primary school later on. Similar to the analyses forcognitive outcomes at age 10 years (Sammons et al., 2007), we sought to establish whetherchildren who did not go to pre-school or went to only a low quality pre-school appeared to havebenefited more from the academic effectiveness of the primary school in terms of theirsocial/behavioural development. We combined the primary school academic effectivenessindicators with the ECERS-E measure of pre-school quality, which is also a measure of academicquality, and tested these measures in the full contextualised models controlling for all relevantbackground factors. Results are shown in Figures 6.7-6.10.
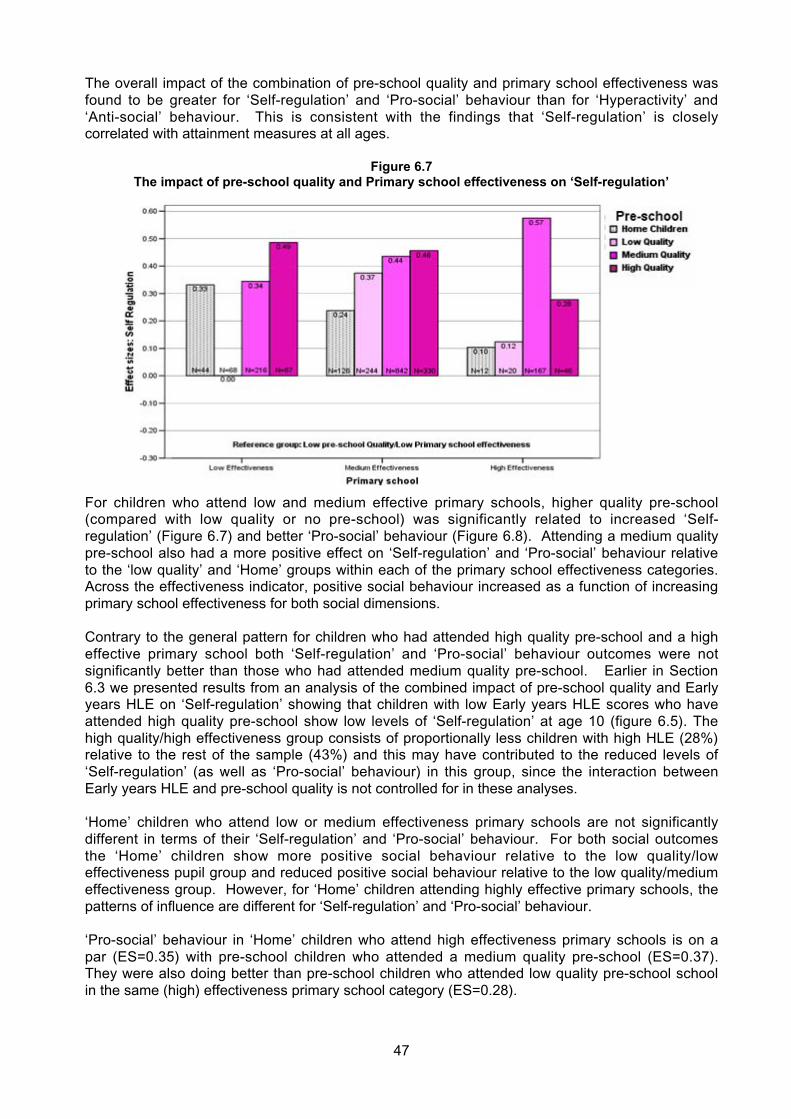
47
The overall impact of the combination of pre-school quality and primary school effectiveness wasfound to be greater for ‘Self-regulation’ and ‘Pro-social’ behaviour than for ‘Hyperactivity’ and‘Anti-social’ behaviour. This is consistent with the findings that ‘Self-regulation’ is closelycorrelated with attainment measures at all ages.
Figure 6.7The impact of pre-school quality and Primary school effectiveness on ‘Self-regulation’
For children who attend low and medium effective primary schools, higher quality pre-school(compared with low quality or no pre-school) was significantly related to increased ‘Self-regulation’ (Figure 6.7) and better ‘Pro-social’ behaviour (Figure 6.8). Attending a medium qualitypre-school also had a more positive effect on ‘Self-regulation’ and ‘Pro-social’ behaviour relativeto the ‘low quality’ and ‘Home’ groups within each of the primary school effectiveness categories.Across the effectiveness indicator, positive social behaviour increased as a function of increasingprimary school effectiveness for both social dimensions.
Contrary to the general pattern for children who had attended high quality pre-school and a higheffective primary school both ‘Self-regulation’ and ‘Pro-social’ behaviour outcomes were notsignificantly better than those who had attended medium quality pre-school. Earlier in Section6.3 we presented results from an analysis of the combined impact of pre-school quality and Earlyyears HLE on ‘Self-regulation’ showing that children with low Early years HLE scores who haveattended high quality pre-school show low levels of ‘Self-regulation’ at age 10 (figure 6.5). Thehigh quality/high effectiveness group consists of proportionally less children with high HLE (28%)relative to the rest of the sample (43%) and this may have contributed to the reduced levels of‘Self-regulation’ (as well as ‘Pro-social’ behaviour) in this group, since the interaction betweenEarly years HLE and pre-school quality is not controlled for in these analyses.
‘Home’ children who attend low or medium effectiveness primary schools are not significantlydifferent in terms of their ‘Self-regulation’ and ‘Pro-social’ behaviour. For both social outcomesthe ‘Home’ children show more positive social behaviour relative to the low quality/loweffectiveness pupil group and reduced positive social behaviour relative to the low quality/mediumeffectiveness group. However, for ‘Home’ children attending highly effective primary schools, thepatterns of influence are different for ‘Self-regulation’ and ‘Pro-social’ behaviour.
‘Pro-social’ behaviour in ‘Home’ children who attend high effectiveness primary schools is on apar (ES=0.35) with pre-school children who attended a medium quality pre-school (ES=0.37).They were also doing better than pre-school children who attended low quality pre-school schoolin the same (high) effectiveness primary school category (ES=0.28).

48
‘Pro-social’ behaviour in ‘Home’ children who attend high effectiveness primary schools is alsobetter than ‘Pro-social’ behaviour in ‘Home’ children who attend low (ES=0.14) or medium(ES=0.10) effectiveness primary schools. In contrast, ‘Self-regulation’ in the same group ofchildren (i.e. ‘Home’/high effectiveness) (ES=0.10) is the same as ‘Self-regulation’ in pre-schoolchildren who attended a low quality pre-school and high effectiveness primary (ES=0.10).
Figure 6.8The impact of pre-school quality and Primary school effectiveness on ‘Pro-social’ behaviour
‘Self-regulation’ in the ‘Home’/high effectiveness group was notably lower than for pre-schoolchildren who attended medium quality pre-school and high effectiveness primaries (ES=0.57). Itis also lower than ‘Self-regulation’ in ‘Home’ children who attended low (ES=0.33) or medium(ES=0.24) effectiveness primary school. Overall, this pattern indicates that ‘Self-regulation’ in‘Home’ children tends to be reduced if they attend highly effective primary schools. This finding ispuzzling and will be explored later in this section.
The impact of Primary school effectiveness on ‘Home’ children is of a significantly greatermagnitude for ‘Hyperactivity’ (Figure 6.9) and ‘Anti-social’ behaviour (Figure 6.10). ‘Home’children who go to low academically effective primary schools have significantly higher‘Hyperactivity’ and ‘Anti-social’ scores at age 10 relative to nearly all other children. ‘Home’children who go to high academically effective primary schools by contrast have the lowest‘Hyperactivity’ (ES=-0.65) and ‘Anti-social’ scores (ES=-0.37) of all other categories showing themto be the least hyperactive and the least ‘Anti-social’ of all other children.
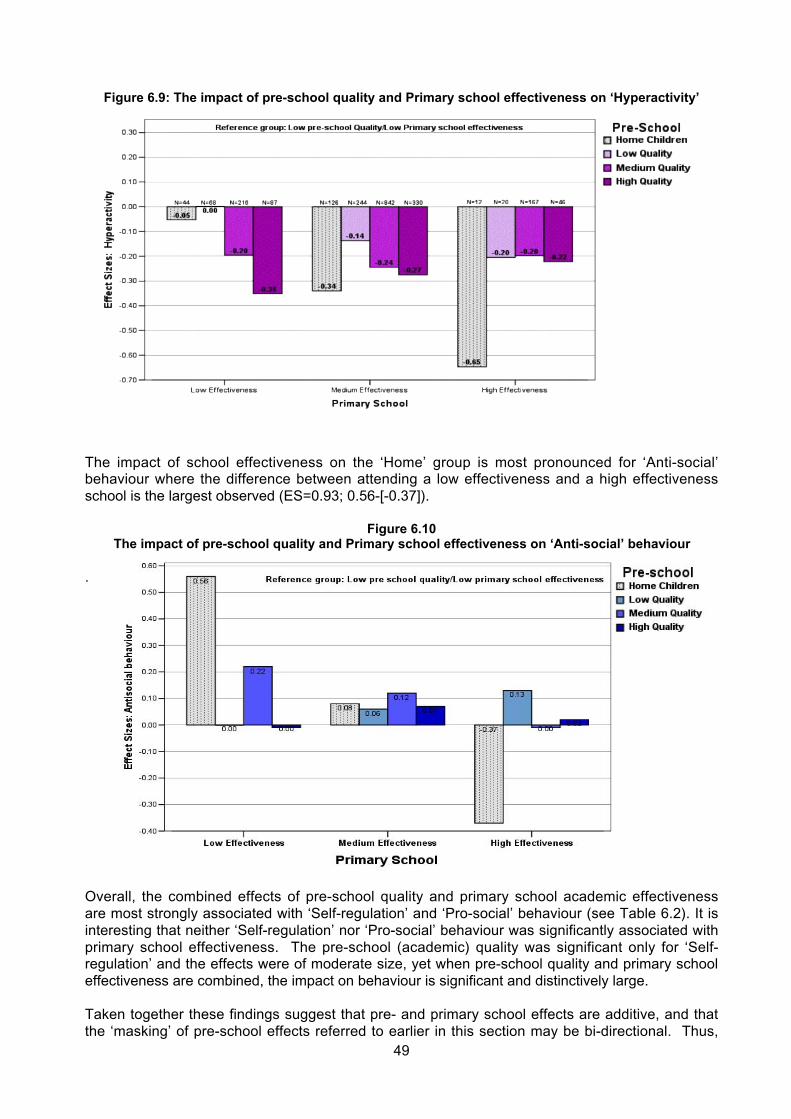
49
Figure 6.9: The impact of pre-school quality and Primary school effectiveness on ‘Hyperactivity’
The impact of school effectiveness on the ‘Home’ group is most pronounced for ‘Anti-social’behaviour where the difference between attending a low effectiveness and a high effectivenessschool is the largest observed (ES=0.93; 0.56-[-0.37]).
Figure 6.10The impact of pre-school quality and Primary school effectiveness on ‘Anti-social’ behaviour
.
Overall, the combined effects of pre-school quality and primary school academic effectivenessare most strongly associated with ‘Self-regulation’ and ‘Pro-social’ behaviour (see Table 6.2). It isinteresting that neither ‘Self-regulation’ nor ‘Pro-social’ behaviour was significantly associated withprimary school effectiveness. The pre-school (academic) quality was significant only for ‘Self-regulation’ and the effects were of moderate size, yet when pre-school quality and primary schooleffectiveness are combined, the impact on behaviour is significant and distinctively large.
Taken together these findings suggest that pre- and primary school effects are additive, and thatthe ‘masking’ of pre-school effects referred to earlier in this section may be bi-directional. Thus,
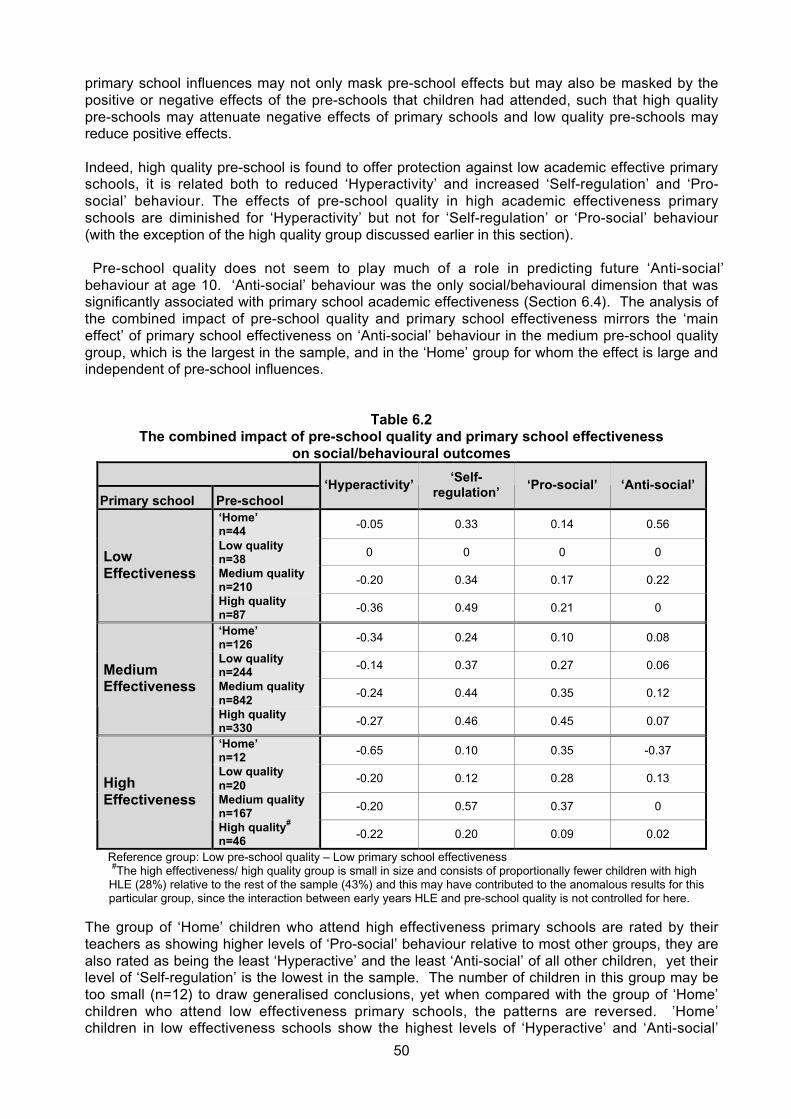
50
primary school influences may not only mask pre-school effects but may also be masked by thepositive or negative effects of the pre-schools that children had attended, such that high qualitypre-schools may attenuate negative effects of primary schools and low quality pre-schools mayreduce positive effects.
Indeed, high quality pre-school is found to offer protection against low academic effective primaryschools, it is related both to reduced ‘Hyperactivity’ and increased ‘Self-regulation’ and ‘Pro-social’ behaviour. The effects of pre-school quality in high academic effectiveness primaryschools are diminished for ‘Hyperactivity’ but not for ‘Self-regulation’ or ‘Pro-social’ behaviour(with the exception of the high quality group discussed earlier in this section).
Pre-school quality does not seem to play much of a role in predicting future ‘Anti-social’behaviour at age 10. ‘Anti-social’ behaviour was the only social/behavioural dimension that wassignificantly associated with primary school academic effectiveness (Section 6.4). The analysis ofthe combined impact of pre-school quality and primary school effectiveness mirrors the ‘maineffect’ of primary school effectiveness on ‘Anti-social’ behaviour in the medium pre-school qualitygroup, which is the largest in the sample, and in the ‘Home’ group for whom the effect is large andindependent of pre-school influences.
Table 6.2The combined impact of pre-school quality and primary school effectiveness
on social/behavioural outcomes
Primary school Pre-school‘Hyperactivity’
‘Self-regulation’
‘Pro-social’ ‘Anti-social’
‘Home’n=44
-0.05 0.33 0.14 0.56
Low qualityn=38
0 0 0 0
Medium qualityn=210
-0.20 0.34 0.17 0.22
LowEffectiveness
High qualityn=87
-0.36 0.49 0.21 0
‘Home’n=126
-0.34 0.24 0.10 0.08
Low qualityn=244
-0.14 0.37 0.27 0.06
Medium qualityn=842
-0.24 0.44 0.35 0.12
MediumEffectiveness
High qualityn=330
-0.27 0.46 0.45 0.07
‘Home’n=12
-0.65 0.10 0.35 -0.37
Low qualityn=20
-0.20 0.12 0.28 0.13
Medium qualityn=167
-0.20 0.57 0.37 0
HighEffectiveness
High quality#
n=46-0.22 0.20 0.09 0.02
Reference group: Low pre-school quality – Low primary school effectiveness #The high effectiveness/ high quality group is small in size and consists of proportionally fewer children with highHLE (28%) relative to the rest of the sample (43%) and this may have contributed to the anomalous results for thisparticular group, since the interaction between early years HLE and pre-school quality is not controlled for here.
The group of ‘Home’ children who attend high effectiveness primary schools are rated by theirteachers as showing higher levels of ‘Pro-social’ behaviour relative to most other groups, they arealso rated as being the least ‘Hyperactive’ and the least ‘Anti-social’ of all other children, yet theirlevel of ‘Self-regulation’ is the lowest in the sample. The number of children in this group may betoo small (n=12) to draw generalised conclusions, yet when compared with the group of ‘Home’children who attend low effectiveness primary schools, the patterns are reversed. ’Home’children in low effectiveness schools show the highest levels of ‘Hyperactive’ and ‘Anti-social’

51
behaviour. They also show poorer ‘Pro-social’ behaviour when compared to most other groups,but in terms of ‘Self-regulation’, they do not do as poorly as might have been expected. Thisindicates once again that ‘Self-regulation’ varies independently to the other threesocial/behavioural dimensions.
The ‘Home’ group is different from all the rest because in this group the primary school effects areuntainted by pre-school influences. For this group we found (as expected) a linear reduction innegative social behaviour (reduced ‘Hyperactivity’ and ‘Anti-social’ scores) as a function ofincreasing primary school effectiveness, but also an unexpected linear reduction in ‘Self-regulation’ as a function of increasing effectiveness and a non linear relationship with ‘Pro-social’behaviour. Recall from Section 5 that prior developmental level reduced school level variance for‘Hyperactive’ and ‘Anti-social’ behaviour, but increased school level variance for ‘Pro-social’behaviour and especially for ‘Self-regulation’, indicating that for these aspects of behaviour,differences between school increase when children’s developmental level on entry to school istaken into account.
When we examine primary school academic effectiveness in relation to social/behaviouraldevelopment it would seem that the relationship between negative social behaviour and level ofeffectiveness is reciprocal (mutual influence). As long as there aren’t too many interruptions toprevent schools from implementing well established strategies, children in their school will do wellacademically. The relationship between positive social behaviour and primary school academiceffectiveness is more complex. The patterns associated with the ’Home’ group appear to suggestthat pre-schools have a greater role to play in promoting ‘Self-regulation’ and ‘Pro-social’behaviour than primary schools. On the other hand, the increase in school level variance whenprior developmental level is taken into account indicates that some primary schools have quite asignificant impact on children’s positive social behaviour, and especially ‘Self-regulation’, whilesome do not. However, the extent to which this is associated with primary school academiceffectiveness remains an open question. The findings indicate that overall strong links between‘Self-regulation’ and cognitive attainment on the child level, and it would, therefore, be reasonableto assume that such associations exist on a school level too, but further analyses would berequired to explore such links.
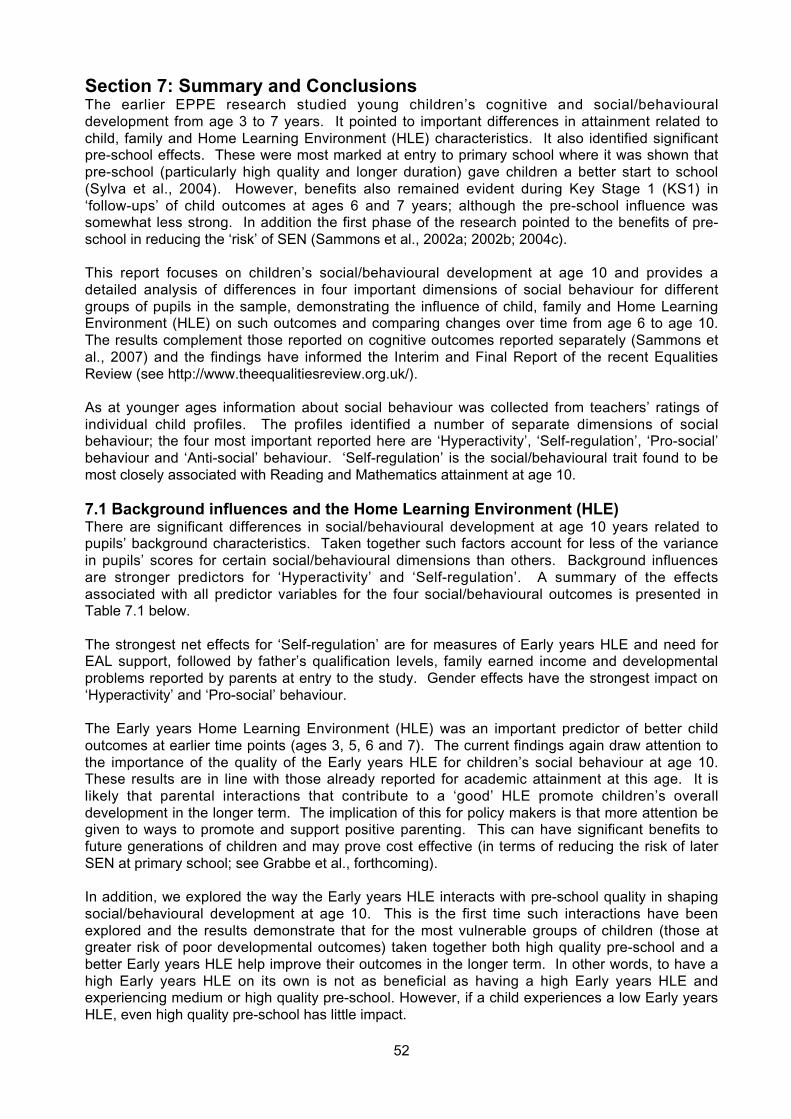
52
Section 7: Summary and ConclusionsThe earlier EPPE research studied young children’s cognitive and social/behaviouraldevelopment from age 3 to 7 years. It pointed to important differences in attainment related tochild, family and Home Learning Environment (HLE) characteristics. It also identified significantpre-school effects. These were most marked at entry to primary school where it was shown thatpre-school (particularly high quality and longer duration) gave children a better start to school(Sylva et al., 2004). However, benefits also remained evident during Key Stage 1 (KS1) in‘follow-ups’ of child outcomes at ages 6 and 7 years; although the pre-school influence wassomewhat less strong. In addition the first phase of the research pointed to the benefits of pre-school in reducing the ‘risk’ of SEN (Sammons et al., 2002a; 2002b; 2004c).
This report focuses on children’s social/behavioural development at age 10 and provides adetailed analysis of differences in four important dimensions of social behaviour for differentgroups of pupils in the sample, demonstrating the influence of child, family and Home LearningEnvironment (HLE) on such outcomes and comparing changes over time from age 6 to age 10.The results complement those reported on cognitive outcomes reported separately (Sammons etal., 2007) and the findings have informed the Interim and Final Report of the recent EqualitiesReview (see http://www.theequalitiesreview.org.uk/).
As at younger ages information about social behaviour was collected from teachers’ ratings ofindividual child profiles. The profiles identified a number of separate dimensions of socialbehaviour; the four most important reported here are ‘Hyperactivity’, ‘Self-regulation’, ‘Pro-social’behaviour and ‘Anti-social’ behaviour. ‘Self-regulation’ is the social/behavioural trait found to bemost closely associated with Reading and Mathematics attainment at age 10.
7.1 Background influences and the Home Learning Environment (HLE)There are significant differences in social/behavioural development at age 10 years related topupils’ background characteristics. Taken together such factors account for less of the variancein pupils’ scores for certain social/behavioural dimensions than others. Background influencesare stronger predictors for ‘Hyperactivity’ and ‘Self-regulation’. A summary of the effectsassociated with all predictor variables for the four social/behavioural outcomes is presented inTable 7.1 below.
The strongest net effects for ‘Self-regulation’ are for measures of Early years HLE and need forEAL support, followed by father’s qualification levels, family earned income and developmentalproblems reported by parents at entry to the study. Gender effects have the strongest impact on‘Hyperactivity’ and ‘Pro-social’ behaviour.
The Early years Home Learning Environment (HLE) was an important predictor of better childoutcomes at earlier time points (ages 3, 5, 6 and 7). The current findings again draw attention tothe importance of the quality of the Early years HLE for children’s social behaviour at age 10.These results are in line with those already reported for academic attainment at this age. It islikely that parental interactions that contribute to a ‘good’ HLE promote children’s overalldevelopment in the longer term. The implication of this for policy makers is that more attention begiven to ways to promote and support positive parenting. This can have significant benefits tofuture generations of children and may prove cost effective (in terms of reducing the risk of laterSEN at primary school; see Grabbe et al., forthcoming).
In addition, we explored the way the Early years HLE interacts with pre-school quality in shapingsocial/behavioural development at age 10. This is the first time such interactions have beenexplored and the results demonstrate that for the most vulnerable groups of children (those atgreater risk of poor developmental outcomes) taken together both high quality pre-school and abetter Early years HLE help improve their outcomes in the longer term. In other words, to have ahigh Early years HLE on its own is not as beneficial as having a high Early years HLE andexperiencing medium or high quality pre-school. However, if a child experiences a low Early yearsHLE, even high quality pre-school has little impact.

53
Table 7.1Summary of background factors and pre- and primary school influences on social behaviour
(Only the largest effect sizes are reported; for details see earlier tables – comparison group in brackets)
‘Hyperactivity’‘Self-
regulation’‘Pro-social’ ‘Anti-social’
Child Factors
Gender (girls) 0.68 - 0.19 -0.63 0.32
Birth weight (very low) - 0.22
Siblings (singletons) -0.11
Ethnicity (white UK) 0.35 0.39
Developmental problems (none) - 0.25
Behavioural problems (none) 0.51 - 0.21 0.22
Health problems (none) 0.56
Need of EAL support 0.26 - 0.53
Family factors
Mother’s qualifications (none) - 0.36 0.21 0.19 - 0.16
Father’s Qualifications (none) 0.30
Father absent 0.09 0.15
Marital Status (married) 0.23
Maternal employment (employed) - 0.15
Family earned income (none) - 0.33 0.25 0.24
FSM 0.18 - 0.17 - 0.15 0.23
Home Learning Environment
Early years HLE (low) 0.49
Home computing (high) 0.22
Enrichment outings (high) - 0.25
One to one interactions (high) 0.18
Expressive play (high) 0.20 - 0.24 - 0.17
Pre –school*
Attending
Duration in months 0.29
Sessions
Pre-school quality
ECER-E 0.17
ECER-R0.13(Low quality)-0.06 (High quality
0.30
Pre School Effectiveness
Co-operation and conformity 0.23 0.30
Independence & Concentration 0.23 0.28
Peer sociability 0.18 0.25
Anti-social0.16 (low quality)
-0.11 (High quality)0.23 0.34
Primary school effectiveness**
Mathematics - 0.21
English - 0.18
Science - 0.20
*The reference group for all pre-school comparisons is the ’Home’ group. ** The reference group for Primary school is ‘low effectiveness’
54
7.2 Educational experiencesThe importance of educational experiences in shaping social/behavioural development at age 10years has been highlighted in Sections 6. We have shown that some pre-school influences,identified as important for child outcomes at earlier time points (ages 5, 6 and 7) still remainevident after five years in primary school. However, at this stage just having attended a pre-school is not sufficient to ensure better social/behavioural development in the longer term, exceptfor ‘Pro-social’ behaviour. Interestingly, for ‘Pro-social’ behaviour an earlier start at pre-school (2years or under) continues to show positive benefits on ‘Pro-social’ behaviour at age 10 yearswhile ‘Home’ children remain at a disadvantage. However, further analyses indicate that it is thequality and effectiveness of the pre-school attended that generally predict bettersocial/behavioural development. Poor quality pre-school, however, does not improvesocial/behavioural development at age 10 years, whereas medium and especially high qualityprovides benefits for most outcomes. Children who attend high quality pre-school show thestrongest advantage. However, there are some indications that attending poor quality pre-schoolmay adversely affect certain aspects of social/behavioural development.
In addition, the effectiveness of the pre-school centre attended, in terms of promoting better socialbehaviour at entry to primary school, shows a positive impact on later social/behaviouraldevelopment at age 10 years for children who attended pre-school in comparison with the ‘Home’group. It is particularly striking that attending a pre-school identified as reducing ‘Anti-social’behaviour at a younger age (between 3 and 5 years) still shows a benefit in terms of reducedhyperactive behaviour at age 10.
The findings on both quality and effectiveness of pre-schools and their longer term benefits onsocial/behavioural development at age 10 complement and extend the findings already reportedon cognitive outcomes in Reading and Mathematics for this sample. It appears therefore thathigh quality, effective pre-school offers benefits to all round development during Key Stage 2.
Table 7.2 The combined impact of pre-school quality and primary school effectivenesson social/behavioural outcomes*
Primary school Pre-school‘Hyperactivity’
‘Self-regulation’
‘Pro-social’ ‘Anti-social’
‘Home’n=44
-0.05 0.33 0.14 0.56
Low qualityn=38
0 0 0 0
Medium qualityn=210
-0.20 0.34 0.17 0.22
LowEffectiveness
High qualityn=87
-0.36 0.49 0.21 0
‘Home’n=126
-0.34 0.24 0.10 0.08
Low qualityn=244
-0.14 0.37 0.27 0.06
Medium qualityn=842
-0.24 0.44 0.35 0.12
MediumEffectiveness
High qualityn=330
-0.27 0.46 0.45 0.07
‘Home’n=12
-0.65 0.10 0.35 -0.37
Low qualityn=20
-0.20 0.12 0.28 0.13
Medium qualityn=167
-0.20 0.57 0.37 0
HighEffectiveness
High quality#
n=46-0.22 0.20 0.09 0.02
*Reference group: Low pre-school quality – Low primary school effectiveness#The high effectiveness/ high quality group is small in size and consists of proportionally fewer children with highHLE (28%) relative to the rest of the sample (43%) and this may have contributed to the anomalous results for thisparticular group, since the interaction between early years HLE and pre-school quality is not controlled for here.

55
The academic effectiveness of the primary school attended (calculated independently using valueadded analysis) promoted better child outcomes in terms of ‘Anti-social’ behaviour for those whoattended the more academically effective primary schools. In addition, the academiceffectiveness of the primary school attended also had a significant impact on social/behaviouraldevelopment at age 10 years, when studied in interaction with pre-school quality. For ‘Home’children (who did not attend pre-school), the academic effectiveness of the primary schoolattended helped to promote better social/behavioural development in Year 5 for two outcomes(reduced ‘Hyperactivity’ and ‘Anti-social’ behaviour); for those who attend a high academiceffectiveness primary school there is a particular boost. Moreover, attending high quality pre-school seems to act as a protective factor for children who went on to attend a less academicallyeffective primary school.
Overall it seems that primary school academic effectiveness is particularly associated withreductions in negative social behaviour (‘Hyperactive’ and ‘Anti-social’) while pre-schoolinfluences are more strongly related to improvements in positive social behaviour (‘Self regulation’and ‘Pro-social’).
7.3 ImplicationsIn line with findings for cognitive outcomes at age 10 (reported separately in Sammons et al.,2007) the present findings further support the conclusion that good (high quality and effective)pre-school still matters. There is new evidence of continuing pre-school effects in terms of bettersocial/behavioural development. Taken together the results indicate that attending pre-schoolhas long term benefits on ‘Pro-social’ behaviour, in contrast to other outcomes it appears that anearlier start (2 or under) is linked with better outcomes in terms of ‘Pro-social’ behaviour at age10. There are no longer any significant differences related to an earlier start in terms of raisedscores for ‘Hyperactivity’ or ‘Anti-social’ behaviour for this sample. However, for other aspects ofchildren’s behaviour at age 10, differences in the effectiveness of pre-school attended contributeto better outcomes in the longer term rather than just attending or not attending a pre-schoolsetting. Children who attended pre-schools that had the most positive impact onsocial/behavioural development before starting primary school show better behavioural profilesacross the board at age 10. By contrast, turning to quality we find that those children whoattended low quality pre-school no longer show benefits and poor quality pre-school is associatedwith poorer social/behavioural development in some areas. Thus, quality and effectiveness ofpre-school are especially relevant for later benefit.
The implications of this are clear; improving the access to high quality and more effective pre-school is likely to benefit children in the longer term by improving social adjustment to school andpromoting cognitive development. These benefits will contribute to both raising standards andinclusion agendas.
Primary school academic effectiveness (calculated independently by value added analyses ofNational Assessment data for matched pupil cohorts KS1 to KS2 across three years) is also asignificant influence, in combination with pre-school quality. Those who attended moreacademically effective primary schools tend to show better cognitive attainment and bettersocial/behavioural development at age 10.
The findings suggest that the academic effectiveness of the primary school is important inreducing ‘Anti-social’ behaviour, and that this may be especially relevant for the ‘Home’ group ofchildren at age 10. It appears that the processes and organisational features of moreacademically effective schools may be also associated with reducing ‘Anti-social’ behaviour,perhaps by influencing school/classroom climate and culture. There is no evidence of anynegative impact of academic effectiveness on social/behavioural development, and this isimportant because some have claimed that a focus on academic progress may lead to pooreroutcomes in other aspects of development. The EPPE research evidence at age 10 does notsupport such claims. There may well be reciprocal effects between primary school academiceffectiveness and ‘Anti-social’ behaviour.
56
The present research provides new evidence concerning the combined effects of pre-school andprimary school in shaping children’s later educational outcomes at age 10 years. Raising theeffectiveness and quality of both will help to improve children’s all round development
We can conclude that no one factor is the key to enhancing educational outcomes in the longerterm across Key Stage 2. It is the combination of experiences over time that matters. The childwho has a better Early years HLE, goes to a high quality, effective pre-school setting and whothen goes on to attend a more academically effective primary school appears to have acombination of ‘protective’ experiences that tend to reduce the risk of low attainment and alsosimilarly tend to benefit social/behavioural development. High quality and more effective pre-schools seem to support better outcomes in longer term cognitive and social/behaviouraldomains. Likewise, we also find that a higher quality Early years HLE benefits both cognitive andsocial/behavioural development throughout pre-school and primary school.
The implication of these findings is that policy should promote strategies to support improvementsin Early years HLE, especially for vulnerable groups, and also work to improve the quality andeffectiveness of pre-school provision. Such pre-schools are well placed to identify children whomay need extra support if they do not experience a high quality HLE and could be guided to workwith parents to improve HLE. Ways to improve the provision in poorer quality pre-schools need tobe given a high priority, since poor quality provision does not appear to offer long term benefits inimproved child outcomes.
The finding that both social/behavioural development and Reading and Mathematics attainmentcan be boosted by attending an academically more effective primary school has importantmessages for the achievement of the Every Child Matters agenda, because it shows that thepromotion of better academic outcomes is not at odds with the development of bettersocial/behavioural development. The focus on supporting the improvement of primary schoolsidentified as less effective and of lower quality remains important given other findings fromclassroom observations that quality tends to vary widely and may be lower in some schoolsserving more disadvantaged communities (Sammons et al., 2006).
As with conclusions related to cognitive outcomes the findings again suggest that, in order to helpreduce the achievement gap for multiply disadvantaged groups, actions to improve their HLE,pre-school and primary school experiences will be needed in concert, since improvements to anyone in isolation would be insufficient to boost outcomes on its own. In addition, it is likely thatspecially targeted interventions for children who are identified as well behind their peers incognitive or social/behavioural profiles at the start of primary school will also be necessary toprevent a widening of the gap during KS1 and KS2. This has implications for baselineassessment and SEN identification and the development of well founded, evidence basedinterventions.
57
ReferencesBelsky, J., Lowe Vandell, D., Burchinal, M., Clarke-Stewart, K. A., McCartney, K., Tresch Owen,M., & The NICHD Early Child Care Research (2007). Are there long-term effects of early childcare? Child Development, 78, 681-701.
Effective Pre-school and Primary Education 3-11 (EPPE 3-11) Team. (2007), Promoting Equalityin the Early Years: Report to The Equalities Review. London: http://www.equalitiesreview.org.uk.
Goodman, R. (1997), 'The Strengths & Difficulties Questionnaire: A Research Note'. Journal ofChild Psychology & Psychiatry, 38, 581-586.
Grabbe, Y., P. Sammons, et al. (Forthcoming). Special Educational Needs at Age 10: ProtectiveEffects of Good Pre-school Experience.
Harms, T., Cryer, D., & Clifford, R. (2003). Infant/Toddler Environment Rating Scale, RevisedEdition (ITERS-R). New York: Teachers College Press.
Melhuish, E. C., Sylva, K., Sammons, P., Siraj-Blatchford, I. and Taggart, B. (2001), The EffectiveProvision of Pre-School Education (EPPE) Project: Technical Paper 7 - Social/behavioural andcognitive development at 3-4 years in relation to family background. London: DfEE / Institute ofEducation, University of London.
Melhuish, E., Romaniuk, H., Sammons, P., Sylva, K., Siraj-Blatchford, I. and Taggart, B. (2006a),Effective Pre-school and Primary Education 3-11 Project (EPPE 3-11): The Effectiveness ofPrimary Schools in England in Key Stage 2 for 2002, 2003 and 2004. Full Report. London:Institute of Education, University of London. http://www.ioe.ac.uk/schools/ecpe/eppe/eppe3-11/eppe3-11pubs.htm
Melhuish, E., Romaniuk, H., Sammons, P., Sylva, K., Siraj-Blatchford, I. and Taggart, B. (2006b),Effective Pre-school and Primary Education 3-11 (EPPE 3-11): The Effectiveness of PrimarySchools in England in Key Stage 2 for 2002, 2003 and 2004, Research Brief No. RBX06-06.Nottingham: DfES Publications.
Melhuish, E.C., Sylva, K., Sammons, P., Siraj-Blatchford, I., Taggart, B., & Phan, M. (in press)Effects of the Home Learning Environment and pre-school center experience upon literacy andnumeracy development in early primary school. Journal of Social Issues.
NNI Research Team (2007). National Evaluation of the Neighbourhood Nurseries Initiative:Integrated Report. London: DfES.
Sammons, P., Nuttall, D. and Cuttance, P. (1993), 'Differential School Effectiveness: Results froma reanalysis of the Inner London Education Authority's Junior School Project data'. BritishEducational Research Journal, 19, 381-405.
Sammons, P., Sylva, K., Melhuish, E. C., Siraj-Blatchford, I., Taggart, B., Smees, R., Dobson, A.,Jeavons, M., Lewis, K., Morahan, M. and Sadler, S. (1999), The Effective Provision of Pre-SchoolEducation (EPPE) Project: Technical Paper 2 - Characteristics of the Effective Provision of Pre-School Education (EPPE) Project sample at entry to the study. London: DfEE / Institute ofEducation, University of London.
Sammons, P., Sylva, K., Melhuish, E. C., Siraj-Blatchford, I., Taggart, B. and Elliot, K. (2002a),The Effective Provision of Pre-School Education (EPPE) Project: Technical Paper 8a - Measuringthe Impact of Pre-School on Children's Cognitive Progress over the Pre-School Period. London:DfES / Institute of Education, University of London.

58
Sammons, P., Smees, R., Taggart, B., Sylva, K., Melhuish, E. C., Siraj-Blatchford, I. and Elliot, K.(2002b), The Early Years Transition and Special Educational Needs (EYTSEN) Project: TechnicalPaper 1 - Special Needs Across the Pre-School Period. London: DfES / Institute of Education,University of London
Sammons, P., Sylva, K., Melhuish, E. C., Siraj-Blatchford, I., Taggart, B. and Elliot, K. (2003), TheEffective Provision of Pre-School Education (EPPE) Project: Technical Paper 8b - Measuring theImpact of Pre-School on Children's Social/Behavioural Development over the Pre-School Period.London: DfES / Institute of Education, University of London.
Sammons, P., Sylva, K., Melhuish, E. C., Siraj-Blatchford, I., Taggart, B., Elliot, K. and Marsh, A.(2004a), The Effective Provision of Pre-School Education (EPPE) Project: Technical Paper 11 -Report on the continuing effects of pre-school education at age 7. London: DfES / Institute ofEducation, University of London.
Sammons, P., Sylva, K., Melhuish, E. C., Siraj-Blatchford, I., Taggart, B., Elliot, K. and Marsh, A.(2004b), The Effective Provision of Pre-School Education (EPPE) Project: Technical Paper 9 -Report on age 6 assessments. London: DfES / Institute of Education, University of London.
Sammons, P., Smees, R., Taggart, B., Sylva, K., Melhuish, E. C., Siraj-Blatchford, I. and Elliot, K.(2004c), The Early Years Transitions and Special Educational Needs (EYTSEN) Project:Technical Paper 2 - Special Educational Needs in the Early Primary Years: Primary school entryup to the end of Year 1. London: DfES / Institute of Education, University of London
Sammons, P., Siraj-Blatchford, I., Sylva, K., Melhuish, E., Taggart, B. and Elliot, K. (2005),'Investigating the Effects of Pre-school Provision: Using mixed methods in the EPPE research'.International Journal of Social Research Methodology special issue on Mixed Methods inEducational Research, 8 (3), 207-224.
Sammons, P., Taggart, B., Sylva, K., Melhuish, E. C., Siraj-Blatchford, I., Barreau, S. and Manni,L. (2006), Effective Pre-school and Primary Education 3-11 Project (EPPE 3-11): Variations inTeacher and Pupil Behaviours in Year 5 Classrooms and Associations with SchoolCharacteristics. Full Report. London: Institute of Education, University of London.http://www.ioe.ac.uk/schools/ecpe/eppe/eppe3-11/eppe3-11pubs.htm
Sammons, P., Sylva, K., Melhuish, E. C., Siraj-Blatchford, I., Taggart, B. and Grabbe, Y. (2007).Effective Pre-school and Primary Education 3-11 Project (EPPE 3-11): Influences on Children’sAttainment and Progress in Key Stage 2: Cognitive Outcomes in Year 5. Full Report. London:Institute of Education, University of London.http://www.ioe.ac.uk/schools/ecpe/eppe/eppe3-11/eppe3-11pubs.htm
Scott, K. and Carran, D. (1989), 'Identification and referral of handicapped infants'. In M. C.Wang, M. C. Reynolds and H. J. Walberg (eds), Handbook of Special Education Research andPractice: Low Incidence Conditions (Vol.3) (pp. 227-241). Oxford, England: Pergamon Press.
Siraj-Blatchford, I., Sammons, P., Taggart, B., Sylva, K. and Melhuish, E. (2006), 'EducationalResearch and Evidence-Based Policy: The Mixed-method Approach of the EPPE Project'.Evaluation of Research in Education, 19 (2), 63-82.
Sylva, K., Sammons, P., Melhuish, E. C., Siraj-Blatchford, I. and Taggart, B. (1999a), TheEffective Provision of Pre-School Education (EPPE) Project: Technical Paper 1 - An Introductionto The Effective Provision of Pre-School Education (EPPE) Project. London: DfEE / Institute ofEducation, University of London.
Sylva, K., Siraj-Blatchford, I., Melhuish, E. C., Sammons, P., Taggart, B., Evans, E., Dobson, A.,Jeavons, M., Lewis, K., Morahan, M. and Sadler, S. (1999b), The Effective Provision of Pre-

59
School Education (EPPE) Project: Technical Paper 6 – Characteristics of the Centres in theEPPE Sample: Observation Profiles. London: DfEE / Institute of Education, University of London.
Sylva, K., Melhuish, E., Sammons, P., Siraj-Blatchford, I. and Taggart, B. (2004), The EffectiveProvision of Pre-School Education (EPPE) Project: Technical Paper 12 - The final report. London:DfES / Institute of Education, University of London.
Teddlie, C. and Reynolds, D. (2000), The International Handbook of School EffectivenessResearch. London: RouteledgeFalmer.
The Equalities Review. (2007), Fairness and Freedom: The Final Report of the Equalities Review.http://www.theequalitiesreview.org.uk/upload/assets/www.theequalitiesreview.org.uk/equality_review.pdf.

60
Appendix 1: EPPE Technical Papers in the series
Technical Paper 1 - An Introduction to the Effective Provision of Pre-school Education (EPPE) ProjectISBN: 085473 591 Published: Autumn 1999 Price £8.50
Technical Paper 2 - Characteristics of the Effective Provision of Pre-School Education (EPPE) Project sample at entryto the studyISBN: 085473 592 5 Published: Autumn 1999 Price £4.00
Technical Paper 3 - Contextualising EPPE: Interviews with Local Authority co-ordinators and centre managersISBN: 085473 593 3 Published: Autumn 1999 Price £3.50
Technical Paper 4 - Parent, family and child characteristics in relation to type of pre-school and socio-economicdifferences. ISBN: 085473 594 1 Published: Autumn 1999 Price £4.00
Technical Paper 5 – Characteristics of the Centre in the EPPE Study: (Interviews)ISBN: 085473 595 X Published: Autumn 2000 Price £5.00
Technical Paper 6 - Characteristics of the Centres in the EPPE Sample: Observational ProfilesISBN: 085473 596 8 Published: Autumn 1999 Price £8.50
Technical Paper 6A - Characteristics of Pre-School EnvironmentsISBN: 085473 597 6 Published: Autumn 1999 Price £8.50
Technical Paper 7 - Social/behavioural and cognitive development at 3-4 years in relation to family backgroundISBN: 085473 598 4 Published: Spring 2001 Price £5.00
Technical Paper 8a – Measuring the Impact of Pre-School on Children’s Cognitive Progress over thePre-School Period. ISBN: 085473 599 2 Published: Autumn 2002 Price £8.50
Technical Paper 8b – Measuring the Impact of Pre-School on Children’s Social/behavioural Developmentover the Pre-School Period. ISBN: 085473 683 2 Published: March 2003 Price £8.50
Technical Paper 9 - Report on age 6 assessmentISBN: 085473 600 X Published: November 2004 Price £5.50
Technical Paper 10 - Intensive study of selected centresISBN: 085473 601 8 Published: Autumn 2003 Price £11.00
Technical Paper 11 - Report on the continuing effects of pre-school education at age 7ISBN: 085473 602 6 Published: November 2004 Price £5.50
Technical Paper 12 - The final report: Effective Pre-school EducationISBN: 085473 603 4 Published: November 2004 Price £5.50
Effective Pre-school and Primary Education 3-11 Project (EPPE 3-11): The Effectiveness of Primary Schools inEngland in Key Stage 2 for 2002, 2003 and 2004. Full Report. London: Institute of Education, University of London.http://www.ioe.ac.uk/schools/ecpe/eppe/eppe3-11/eppe3-11pubs.htm Published: 2006
Effective Pre-school and Primary Education 3-11 (EPPE 3-11): The Effectiveness of Primary Schools in England in KeyStage 2 for 2002, 2003 and 2004, Research Brief No. RBX06-06. Nottingham: DfES Publications. Published: 2006
Effective Pre-school and Primary Education 3-11 Project (EPPE 3-11): Influences on Children’s Attainment andProgress in Key Stage 2: Cognitive Outcomes in Year 5. Full Report. London: Institute of Education, University ofLondon. http://www.ioe.ac.uk/schools/ecpe/eppe/eppe3-11/eppe3-11pubs.htm Published: 2007
Effective Pre-school and Primary Education 3-11 Project (EPPE 3-11) Summary Report: Influences on Children’sAttainment and Progress in Key Stage 2: Cognitive Outcomes in Year 5. Research Report No. RR828. Nottingham:DfES Publications. Published: 2007
Effective Pre-school and Primary Education 3-11 Project (EPPE 3-11): Influences on Children’s Attainment andProgress in Key Stage 2: Cognitive Outcomes in Year 5. Research Brief No. RB828. Nottingham: DfES Publications. Published: 2007
Effective Pre-school and Primary Education 3-11 Project (EPPE 3-11): Variations in Teacher and Pupil Behaviours inYear 5 Classrooms and Associations with School Characteristics. Full Report. London: Institute of Education,University of London. http://www.ioe.ac.uk/schools/ecpe/eppe/eppe3-11/eppe3-11pubs.htm Published: 2006

61
Effective Pre-school and Primary Education 3-11 (EPPE 3-11) Summary Report: Variations in Teacher and PupilBehaviours in Year 5 Classes. Research Report No. 817. Nottingham: DfES Publications. Published: 2006
Effective Pre-school and Primary Education 3-11 (EPPE 3-11): Variations in Teacher and Pupil Behaviours in Year 5Classes, Research Brief No. RB817. Nottingham: DfES Publications. Published: 2006
Related Publications
The Early Childhood Environment Rating Scale: Revised Edition (1998). Harms, Clifford and Cryer. ISBN: 08077 37518 Available from Teachers College Press. Columbia University. 1234 Amsterdam Avenue. New York. NY10027
Assessing Quality in the Early Years, Early Childhood Environment Rating Scale Extension (ECERS-E): FourCurricular Subscales (2003) Sylva, Siraj-Blatchford and Taggart (2003) Trentham Books ISBN Number: 1 85856 3151
Price £8.99
Early Years Transition and Special Educational Needs (EYTSEN) Technical Paper 1: Special Educational Needsacross the Pre-school Period. ISBN: 085473 680 8 Published Autumn 2002 Price £8.00
EYTSEN Technical Paper 2: Special Educational Needs in the Early Primary Years: Primary school entry up to the endof Year One. ISBN: 085473 681 Published Summer 2004 Price £8.00
EYTSEN Technical Paper 3: Special Educational Needs: The Parents’ PerspectiveISBN: 085473 682 4 Published Summer 2004 Price £8.00
Ordering information – For EPPE PublicationsThe Bookshop at the Institute of Education. 20, Bedford Way. London WC1H OAL. Tele: 00 44 (0) 207 6126050 Fax: 0207 612 6407 e-mail: [email protected], website: www.johnsmith.co.uk/ioe or The EPPEOffice. The University of London, Institute of Education. 20 Bedford Way, London. WC1H OAL. U.K.Telephone 00 44 (0) 207 612 6219 / Fax. 00 44 (0) 207 612 6230 / e-mail [email protected]. PleaseNote: Prices will vary according to size of publication and quantities ordered. Visit the EPPE Website on:http://www.ioe.ac.uk/projects/eppe.
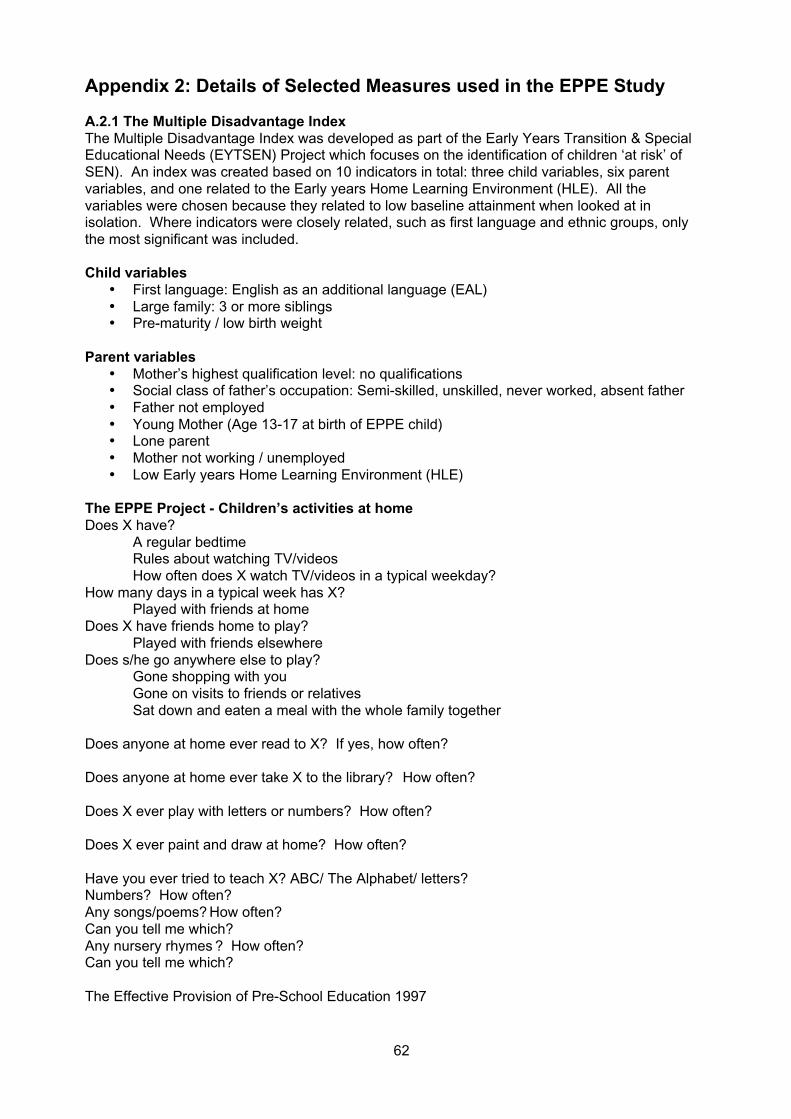
62
Appendix 2: Details of Selected Measures used in the EPPE Study
A.2.1 The Multiple Disadvantage IndexThe Multiple Disadvantage Index was developed as part of the Early Years Transition & SpecialEducational Needs (EYTSEN) Project which focuses on the identification of children ‘at risk’ ofSEN). An index was created based on 10 indicators in total: three child variables, six parentvariables, and one related to the Early years Home Learning Environment (HLE). All thevariables were chosen because they related to low baseline attainment when looked at inisolation. Where indicators were closely related, such as first language and ethnic groups, onlythe most significant was included.
Child variables• First language: English as an additional language (EAL)• Large family: 3 or more siblings• Pre-maturity / low birth weight
Parent variables• Mother’s highest qualification level: no qualifications• Social class of father’s occupation: Semi-skilled, unskilled, never worked, absent father• Father not employed• Young Mother (Age 13-17 at birth of EPPE child)• Lone parent• Mother not working / unemployed• Low Early years Home Learning Environment (HLE)
The EPPE Project - Children’s activities at homeDoes X have?
A regular bedtimeRules about watching TV/videosHow often does X watch TV/videos in a typical weekday?
How many days in a typical week has X?Played with friends at home
Does X have friends home to play?Played with friends elsewhere
Does s/he go anywhere else to play?Gone shopping with youGone on visits to friends or relativesSat down and eaten a meal with the whole family together
Does anyone at home ever read to X? If yes, how often?
Does anyone at home ever take X to the library? How often?
Does X ever play with letters or numbers? How often?
Does X ever paint and draw at home? How often?
Have you ever tried to teach X? ABC/ The Alphabet/ letters?Numbers? How often?Any songs/poems? How often?Can you tell me which?Any nursery rhymes ? How often?Can you tell me which?
The Effective Provision of Pre-School Education 1997

63
A.2.2 The Key Stage 1 Home Learning Environment (HLE)
HLE Factors and the items loading on these factor:
• Home Computing• The Child plays on computer by themself.• Respondent plays computer games with the child.• Respondent uses computer with the child in educational ways.
• Parent-Child Enrichment outings/activity outside home.• Respondent visits library with the child.• Respondent does sport/physical activity with the child.• Respondent goes on educational visits with the child.
• Parent-child one-to-one interactions at home• Respondent plays with the child using toys/games/puzzles.• Respondent reads to the child.• Respondent listens to the child read.
• Expressive play• The Child plays ‘make believe’ or pretend games.• The Child paints/draws/makes models.• The Child enjoys dance music and movement.

64
Appendix 3: Methodology for the social/behavioural analysis
Overall, questionnaires were not returned for 651 children. Of those children for whom thequestionnaire was returned, 2079 had a complete set of scores for the social/behavioural items,i.e., a valid value for all 56 items. The remaining children (441) had one or more missing valuesin the 56-item set. For these 441 cases missing values were substituted with the child’s ownmean.
The social/behavioural instrument consists of a wide range of items (56) rated on a 3-point scale,(1 = not true; 2 = somewhat true; 3 = certainly true) some of which are measuring more adaptivesocial behaviour, e.g., ‘considerate of other peoples feelings’, and some measuring maladaptivebehaviour e.g., ‘has many fears, easily scared’. For the purpose of the missing substitutionanalysis, the items were divided into two sub-groups; of1. Adaptive (29) and2 Maladaptive behaviour (26items) and questions were substituted with the child’s mean of itemsbelonging to the same sub-group. One item was substituted with the overall mean as it wasconsidered neutral ‘gets on better with adults than with children’. The items with the missingsubstitution were then used for all subsequent factor analysis.
A number of data reduction methods were applied to the data, these included PrincipalComponents Analysis (PCA) with varimax (orthogonal) rotation and PCA with promac (opaque)rotation. The exploratory analysis yielded 8 factors explaining 54.9% of the variance with bothtypes of rotation. However, the last factor was relatively weak, i.e., with very few items loadings,consequently two further analyses were conducted forcing a 7 factor solution on the data. Theresulting analysis accounted for 53.2% of the variance. Structural equation modelling was usedto compare between the different models derived. The best fitting model was the 7 factor solutionwith promac rotation (RMSEA=0.6; CMIN=14635.647 with 1463 df). The factor scores producedby this analysis were normalized and used in further analyses. For the whole sample the averagefactor score is 100 with a standard deviation of 15. (see Appendix 3 for details on normalizationprocedures).
Component
F1 – Hyperactivity scale 1 2 3 4 5 6 7 2:restless, overactive, cannot stay still for long 997
10:constantly fidgeting or squirming .995
15:easily distracted, concentration wanders .844
21:thinks things out before acting -.474
25:sees tasks through to the end, good attention span -.557 .498
27:quickly loses interest in what she/he is doing .671
36:gets over excited .817
39:is easily frustrated .496 .312
45:is impulsive, acts without thinking .78750:can behave appropriately during less structuredsessions
-.468
54:fails to pay attention .751
56:makes careless mistakes .572 -.324
F2 – ‘Pro-social’ behaviour scale 1:considerate of other people's feelings .493
4:shares readily with other children (treats, toyspencils, etc.)
.445
9:helpful if someone is hurt, upset or feeling ill .817
17:kind to younger children .743
20:often volunteers to help others (teachers, otherchildren)
.927

65
children)
51:offers to help others having difficulties with a task .730
52:is sympathetic to others if they are upset .848
29:apologises spontaneously .448 .361
F3 – ‘Self-regulation’32:likes to work things out for self; seeks help rarely -.372 .791 .317
35:does not need much help with tasks .800
38:chooses activities on their own .715 .427
41:persists in the face of difficult tasks -.306 .575
44:can move on to a new activity after finishing a task .579
46:is open and direct about what she/he wants .414 .430
47:is confident with others .365 .503
53:shows leadership in group work .552
55:can take responsibility for a task .622
F4 –Emotional symptoms scale/Anxious 3:often complains of headaches, stomach-aches andor sickness
.504
8:many worries, often seems worried .703
13:often unhappy, down-hearted or tearful .470 .34516:nervous or clingy in new situations, easily losesconfidence
.667
24:many fears, easily scared .726
F5 – Peer problems scale (Goodman)/Social isolation
6:rather solitary, tends to play alone .677
11:has at least one good friend -.795
14:generally liked by other children -.619
19:picked on or bullied by other children .613
23:gets on better with adults than with other children .812
34:can play or work easily with others -.429
F6 – Positive social 5:often has temper tantrums or hot tempers
(Goodman’s conduct problems scale).337 -.403
31:is calm and easygoing .445
33:shows wide mood swings .310 -.466
37:says 'please' and 'thank you' when reminded .603
40:gets over being upset easily .708
42:waits his/her turn in games and activities .358
43:co-orperates with requests .341
F7 – Conduct problems scale (Goodman)/‘Anti-social’ behaviour12:often fights with other children or bullies him .320
18:often lies or cheats .477
22:steals from home, school or elsewhere .729
26:vandalises property or destroys things .676
28:shows inappropriate sexual behaviour toward others .642
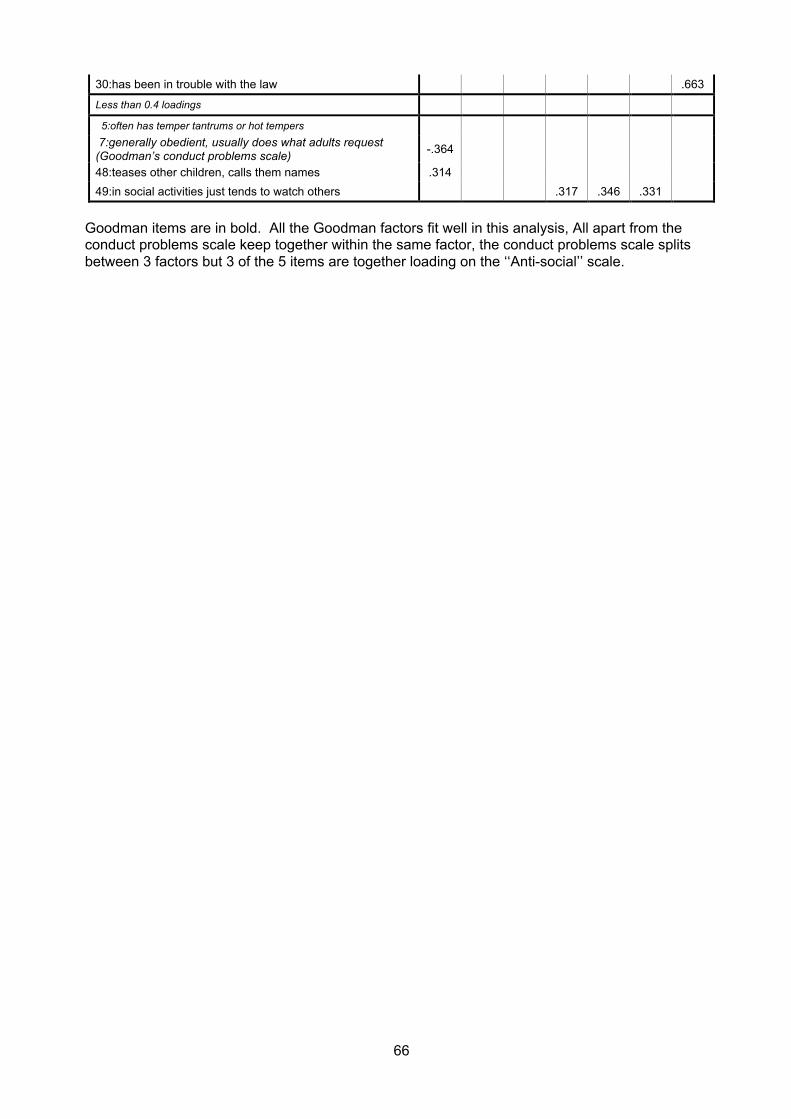
66
30:has been in trouble with the law .663
Less than 0.4 loadings
5:often has temper tantrums or hot tempers
7:generally obedient, usually does what adults request(Goodman’s conduct problems scale)
-.364
48:teases other children, calls them names .314
49:in social activities just tends to watch others .317 .346 .331
Goodman items are in bold. All the Goodman factors fit well in this analysis, All apart from theconduct problems scale keep together within the same factor, the conduct problems scale splitsbetween 3 factors but 3 of the 5 items are together loading on the ‘‘Anti-social’’ scale.

67
Appendix 4: Details of normalisation procedures
We normalised the data since the distribution of scores produced by the factor analyses isstandardised (with a mean of 0 and a standard deviation of 1) and involves negative values. Acommon normalisation is the use of IQ format scores, where the mean is 100 and the standarddeviation is 15:
Normalised score=original score*15+100
The advantage in using these scores is that they are easily interpretable and comparable. Thismeans that a child who has a score of 115 is one standard deviation above the average in thisspecific sample at this specific point whilst taking age effects into account. A child that achieves ascore of 85 points is one standard deviation below average.

68
Appendix 5: EPPE 3-11 imputation of missing data
In order to conduct analysis on as large a sample as possible from the EPPE 3-11 data, a selectnumber of variables were subject to ‘imputation’ of values where item level data were missing,either due to item or wave non-response. The imputation methods employed as was ‘lastobservation carried forward’. Specifically, the ‘last observation’ was data from the initial EPPEparent interview, conducted when the children were in Key Stage 1, aged about three years old orin the case of most ‘Home’ children four years old.
The variables subject to imputation used in the analyses for this report were: Sibling count; Socio-economic status (SES) of mother / father.
Such data, where appropriate, was used to complete missing items from the ParentQuestionnaire conducted at Key Stage 1, when the children were age 6 to 7 years old. In eachcase the variables in the source were comparable, in terms of scale or possible item responsecategories, with those in the target. This was not the case for parents’ qualifications, and henceas yet this measure has not been subject to such imputation.

69
Appendix 6: Results of contextualised multilevel analyses
Table A.6.1 ‘Hyperactivity’ Contextualised Model (impact of child, parent, home environment and
other measures on Year 5 standardised Mathematics attainment)
*Statistically significant at 0.05 level# Just failed to reach statistical significance at 0.05 level
‘Hyperactivity’Estimate SE
EffectSize
Age -0.0093 0.0051 -0.01Gender (Compared to girls) 0.5889* 0.0399 0.68
Ethnic group (compared to White UK Heritage)
White European Heritage -0.0687 0.1106 -0.08
Black Caribbean Heritage 0.1634 0.1073 0.19
Black African Heritage 0.1142# 0.1383 0.13
Indian Heritage 0.0187* 0.1285 0.02
Pakistani Heritage -0.2994*8 0.1448 -0.34
Bangladeshi Heritage -0.3017* 0.1154 -0.35
Mixed Race Heritage -0.6306* 0.1897 -0.73
Any other ethnic minority Heritage 0.1659 0.0845 0.19
No. of siblings (compared to singleton)
1-2 -0.0888* 0.0490 -0.10
3+ -0.0924 0.0668 -0.11
Health problems (compared to none)
1 -0.0155 0.0436 -0.02
2 -0.0550 0.0739 -0.06
3+ 0.4881* 0.1664 0.56
Behavioural problems (compared to none)
1 0.3237* 0.0637 0.37
2+ 0.4266* 0.1275 0.49
Need of EAL support in Year 5 (compared to no need of EAL support)
Missing data 0.1632* 0.0676 0.19
EAL support needed 0.2288* 0.1107 0.26
Free School Meal Eligibility (FSM) (compared to not eligible)Eligible for FSM 0.1555* 0.0580 0.18
Mother’s highest level of qualification (compared to no qualifications)
Vocational 0.0914 0.0697 0.11
Academic age 16 -0.1314* 0.0577 -0.15
Academic age 18 -0.1675* 0.0846 -0.19
Degree and Higher degree -0.3167* 0.0770 -0.36
Other -0.2777 0.2034 -0.32
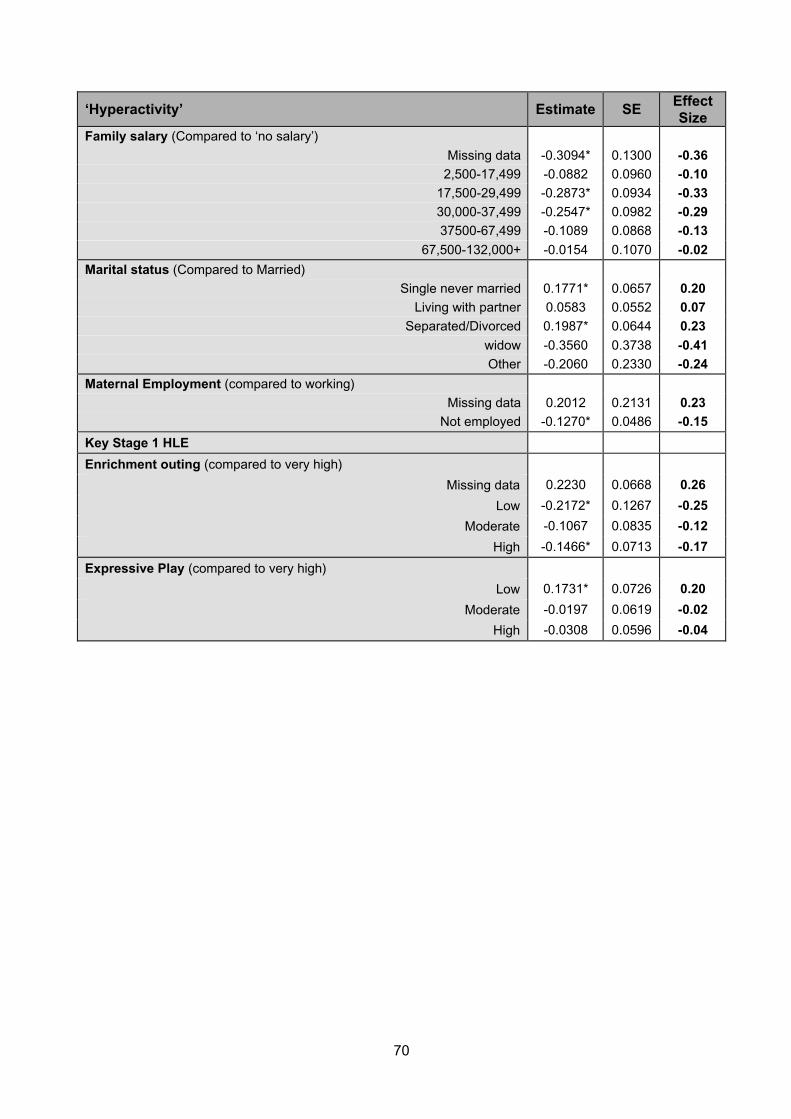
70
‘Hyperactivity’ Estimate SEEffectSize
Family salary (Compared to ‘no salary’)
Missing data -0.3094* 0.1300 -0.36
2,500-17,499 -0.0882 0.0960 -0.10
17,500-29,499 -0.2873* 0.0934 -0.33
30,000-37,499 -0.2547* 0.0982 -0.29
37500-67,499 -0.1089 0.0868 -0.13
67,500-132,000+ -0.0154 0.1070 -0.02
Marital status (Compared to Married)
Single never married 0.1771* 0.0657 0.20
Living with partner 0.0583 0.0552 0.07
Separated/Divorced 0.1987* 0.0644 0.23
widow -0.3560 0.3738 -0.41
Other -0.2060 0.2330 -0.24
Maternal Employment (compared to working)
Missing data 0.2012 0.2131 0.23
Not employed -0.1270* 0.0486 -0.15
Key Stage 1 HLE
Enrichment outing (compared to very high)
Missing data 0.2230 0.0668 0.26
Low -0.2172* 0.1267 -0.25
Moderate -0.1067 0.0835 -0.12
High -0.1466* 0.0713 -0.17
Expressive Play (compared to very high)
Low 0.1731* 0.0726 0.20
Moderate -0.0197 0.0619 -0.02
High -0.0308 0.0596 -0.04

71
Table A.6.2 ‘Self-regulation’ Contextualised Model (impact of child, parent, home environment and
other measures on Year 5 standardised Mathematics attainment)*Statistically significant at 0.05 level# Just failed to reach statistical significance at 0.05 level
‘Self-regulation’ Estimate SE EffectSize
Age -0.0093 0.0051 -0.01
Gender (Compared to girls) 0.1897* 0.0392 0.19
Birth weight (compared to normal birth weight)
Missing data -0.0346 0.1509 -0.04
Very low birth weight (<= 1500g) -0.1235 0.1710 -0.13
Low birth weight (1501g – 2500g) -0.1887 0.0765 -0.21
Behavioural problems (compared to none)
1 -0.2302* 0.0621 -0.25
2+ -0.1385 0.1876 -0.15
Need of EAL support in year 5 (compared to no need of EAL support)
Missing data -0.2750 0.0690 -0.30
EAL support needed -0.4834 0.1085 -0.53
Free School Meal Eligibility (FSM) (compared to not eligible)Eligible for FSM -0.1521* 0.0582 -0.17
Mother’s highest level of qualification (compared to no qualifications)
Vocational 0.0002 0.0722 0.00
Academic age 16 0.0189 0.0603 0.02
Academic age 18 0.0509 0.0882 0.06
Degree and Higher degree 0.1929* 0.2170 0.21
Other 0.2379 0.0863 0.24
Father’s highest level of qualification (compared to no qualifications)
Vocational 0.1106 0.0675 0.12
Academic age 16 0.1561* 0.0899 0.17
Academic age 18 0.1902* 0.0873 0.21
Degree and Higher degree 0.2511 0.1148 0.27
Other 0.2742* 0.2049 0.30
Missing (father absent) 0.2054* 0.0646 0.22
Family salary (Compared to ‘no salary’)
Missing data 0.0355 0.0681 0.04
2,500-17,499 0.0751 0.0675 0.08
17,500-29,499 0.2038* 0.0724 0.22
30,000-37,499 0.2282* 0.0830 0.25
37500-67,499 0.2142* 0.0762 0.23
67,500-132000+ 0.2290* 0.1033 0.25
Early years HLE (compared to 0 - 13) 14-19 0.1796* 0.0772 0.20
20-24 0.1887* 0.0775 0.21
25-32 0.2680* 0.0772 0.29
33-45 0.4500* 0.0915 0.49

72
Table A.6.3 ‘Pro-social’ Contextualised Model (impact of child, parent, home environment and other
measures on Year 5 standardised Mathematics attainment)*Statistically significant at 0.05 level# Just failed to reach statistical significance at 0.05 level
‘Pro-social' Estimate SE EffectSize
Age 0.0129 0.0052 0.01
Gender (Compared to girls) 0.5428* 0.0395 0.63
Behavioural problems (compared to none)
1 -0.1823* 0.0648 -0.21
2+ -0.1877 0.1285 -0.22
Free School Meal Eligibility (FSM) (compared to not eligible)Eligible for FSM -0.1270* 0.0574 -0.15
Mother’s highest level of qualification (compared to no qualifications)
Vocational -0.0398 0.0688 -0.05
Academic age 16 0.1484* 0.0571 0.17
Academic age 18 0.1124 0.0842 0.13
Degree and Higher degree 0.1616* 0.0793 0.19
Other -0.0224 0.2053 -0.03
Social Class (Compared to Low)Medium 0.0874 0.0681 0.10
High 0.0704 0.0556 0.08
Family salary (Compared to ‘no salary’)
Missing data 0.3405* 0.1097 0.39
2,500-17,499 -0.0243 0.0656 -0.03
17,500-29,499 0.2051* 0.0699 0.24
30,000-37,499 0.1564* 0.0798 0.18
37500-67,499 0.1274 0.0738 0.15
67,500-132000+ 0.1206 0.1007 0.14
Key Stage 1 HLE
Home computing (compared to very high)
Missing data -0.2732* 0.1249 -0.32
Low 0.1906* 0.0726 0.22
Moderate 0.1441* 0.0663 0.17
High 0.1048# 0.0622 0.12
Expressive Play (compared to very high)
Low -0.2109* 0.0741 -0.24
Moderate -0.0344 0.0632 -0.04
High 0.0075 0.0609 0.01

73
Table A.6.4 ‘Anti-social’ Contextualised Model (impact of child, parent, Home Learning Environment
(HLE) and other measures on Year 5 standardised Mathematics attainment)*Statistically significant at 0.05 level# Just failed to reach statistical significance at 0.05 level
‘Antisocial’ Estimate SE EffectSize
Age 0.0058 0.0054 0.01Gender (Compared to girls) -0.2946* 0.0408 -0.32
Ethnic group (compared to White UK Heritage)
White European Heritage -0.1207 0.1133 -0.13
Black Caribbean Heritage 0.0455 0.1085 0.05
Black African Heritage 0.3555* 0.1450 0.38
Indian Heritage -0.0024 0.1362 0.00
Pakistani Heritage -0.2423 0.1480 -0.26
Bangladeshi Heritage -0.1313 0.1069 -0.14
Mixed Race Heritage -0.1104 0.1924 -0.12
Any other ethnic minority Heritage -0.0094 0.0880 -0.01
Behavioural problems (compared to none) 1 0.1717* 0.0676 0.19
2+ 0.2079 0.1350 0.22
Free School Meal Eligibility (FSM) (compared to not eligible)Eligible for FSM 0.2168* 0.0553 0.23
Mother’s highest level of qualification (compared to no qualifications)
Vocational 0.0766 0.0728 0.08
Academic age 16 -0.0981 0.0605 -0.11
Academic age 18 -0.0851 0.0884 -0.09
Degree and Higher degree -0.1499* 0.0827 -0.16
Other -0.1684 0.2146 -0.18
Family SES (compared to professional non-manual)
Other professional non-manual -0.0043 0.0552 0.00
Skilled non manual 0.1864 0.0701 0.20
Skilled manual -0.0161 0.0763 -0.02
Semi-skilled manual 0.1929# 0.1423 0.21
Unskilled manual 0.1865 0.1401 0.20
Unemployed / Never worked 0.0217 0.0784 0.02
Absent father (Compared to non absent fathers) 0.1423* 0.0508 0.15
Key Stage 1 HLE
One to one Interactions (compared to very high) Missing data 0.1446 0.0916 0.16
Low 0.1678* 0.0797 0.18
Moderate 0.0738 0.0681 0.08
High 0.0764 0.0641 0.08
Expressive Play (compared to very high)
Low 0.0203 0.0773 0.02
Moderate -0.1557* 0.0655 -0.17
High -0.11778 0.0632 -0.13

74
Appendix 7: Effect Sizes
To illustrate the impact of different factors on attainment or social behaviour in Year 1 effect sizes(ES) were calculated. Effect sizes are most commonly used in experimental studies andessentially measure the strength of mean differences. Glass et al., (1981) define ES as:
ES = (mean of experimental group)-(mean of control group)/pooled standard deviation
Or ∆∆= XExp - XCont
_______ _______ SDpooled
Effect sizes were calculated for different child outcomes, using both the child level variance andcoefficients for predictors included in the multilevel statistical models adopting the formulaeoutlined by Tymms et al., (1997).
For categorical predictors (e.g. gender or ethnicity) the effect size was calculated as:
ES = categorical predictor variable coefficient / √child level variance
OrΔ = β1
σe
For continuous predictor variables (e.g. child age in months), the effect size describes the changeon the outcome measure produced by a change of +/-one standard deviation on the continuouspredictor variable, standardised by the within school SD, adjusted for covariates in the model –the level 1 SD:
Δ = 2 β1*SDx1 where x1=continuous predictor variable σe
Effect sizes can be useful for comparisons between different studies but interpretations must bemade with caution and with reference to the outcomes concerned and controls used in models(Elliot & Sammons, 2004). For further discussion of effect sizes see Coe (2002). Effect sizes forsome categorical measures in the EPPE research are large but apply to small numbers ofchildren (e.g. the very low birth weight group or specific ethnic groups).

75
Appendix 8: Glossary of terms
Activity Level (Child code definition from the Classroom Observation System for Fifth Grade -COS-5, Pianta) The extent to which the observed child is physically active, restless, or fidgetyduring the observation.
Age standardised scores Assessment scores that have been adjusted to take account of thechild’s age at testing. This enables a comparison to be made between the performance of anindividual pupil, and the relative achievement of a representative sample of children in the sameage group throughout the country or, in this case, the relative achievement of the EPPE sample.
‘Anti-social’ behaviour At the end of Year 5 teachers rated the social behaviour of EPPEchildren using an extended version of the strength and difficulties questionnaire. A factor analysisof the 56 items resulted in the extraction of 7 underlying factors. Year 5 factor 7 measures thechild’s tendency to show behaviour that is aggressive, destructive or deviant.
‘at risk’ The ETYSEN report acknowledges that the term ‘at risk’ is a complex one which willdiffer depending on the particular criteria used. In the ETYSEN study cognitive risk is defined as1 sd below national average and strong cognitive risk as 1 sd below sample average. Theseprovide definitions of children who may be seen to be ‘at risk’ on the basis of their cognitiveattainment at entry to pre-school.
Attendance The number of sessions attended at the target centre by an EPPE child from entryto study (BAS assessment) to leaving the target pre-school (based on pre-school centreregisters). This measure provides a crude indicator of amount of target pre-school experience.
Attention (Child code definition from the Classroom Observation System for Fifth Grade - COS-5,Pianta) The observed child’s level of sustained focused or direct attention to ongoing classroomactivities.
Baseline measures Assessments taken by the EPPE child at entry to the study. Theseassessment scores are subsequently employed as prior attainment measures in a value addedanalysis of pupils’ cognitive progress.
Basic skill development in the context of problem solving (Mathematical Instructional Scalesdefinition from the Instructional Environment Observation Scale - IEO, Stipek) The extent towhich students learn basic skills in the context of problem solving.
Basic skill development in the context of reading (Reading Instructional Scales definition fromthe Instructional Environment Observation Scale - IEO, Stipek) The extent to which studentslearn basic reading skills within the context of reading for meaning.
Birth weight Babies born weighing 2500 grams (5lbs 8oz) or less are defined as below normalbirth weight, foetal infant classification is below 1000 grams, very low birth weight is classified as1001-1005 grams and low birth weight is classified as 1501-2500 grams (Scott and Carran,1989).
British Ability Scales (BAS) This is a battery of assessments specially developed by NFER-Nelson to assess very young children’s abilities. The assessments used at entry to the EPPEstudy and entry to reception were:Block building - Visual-perceptual matching, especially in spatial orientation (only entry to EPPEstudy)Naming Vocabulary - Expressive language and knowledge of namesPattern construction - Non-verbal reasoning and spatial visualisation (only entry to reception)Picture Similarities - Non-verbal reasoningEarly number concepts - Knowledge of, and problem solving using pre-numerical and numericalconcepts (only entry to reception)

76
Copying - Visual-perceptual matching and fine-motor co-ordination. Used specifically for childrenwithout EnglishVerbal comprehension - Receptive language, understanding of oral instructions involving basiclanguage concepts.
Centre/School level variance The proportion of variance in a particular child outcome measure(i.e. Pre-reading scores at start of primary school) attributable to differences between individualcentres/schools rather than differences between individual children.
Chaos (Classroom code definition from the Classroom Observation System for Fifth Grade -COS-5, Pianta) The extent to which the children in the class are ineffectively controlled orchaotic.
Child background factors Child background characteristics such as age, gender, and ethnicity.
Child-Teacher Relationship (Child code definition from the Classroom Observation System forFifth Grade - COS-5, Pianta) The extent to which the child is positively socially connected to theirprimary teacher.
Classroom Climate (General Classroom Management and Climate Scales definition from theInstructional Environment Observation Scale - IEO, Stipek) The extent classroom is a placepupil’s feel safe and respected.
Classroom Routines (General Classroom Management and Climate Scales definition from theInstructional Environment Observation Scale - IEO, Stipek) The use of instructional time, howtransitions are managed both within and between lessons, structure/organisation of the day, paceof the lessons, level of preparation of materials, how children are involved in the routine businessof the day (including start of day, taking register, collecting money), do children manage materialsetc.
Compositional effects The impact of peer group measures on a child’s individual outcomes.For example, when the characteristics of children in a centre (measured as a centre levelaggregated variable) show a significant relationship with outcomes at the individual child level,after controlling for the same variable at the individual level. For further details see Harker(2001).
Confidence intervals at the 95% level A range of values which can be expected to include the‘true’ value in 95 out of 100 samples (i.e. if the calculation was repeated using 100 randomsamples).
Contextualised models Cross-sectional multilevel models exploring children’s cognitiveattainment at entry to primary school, controlling for child, parent and Home LearningEnvironment (HLE) characteristics (but not prior attainment).
Controlling for Several variables may influence an outcome and these variables maythemselves be associated. Multilevel statistical analyses can calculate the influence of onevariable upon an outcome having allowed for the effects of other variables. When this is done thenet effect of a variable upon an outcome controlling for other variables can be established.
Correlation A correlation is a measure of statistical association that ranges form + 1 to -1.
Cross-Disciplinary Connections (General Instruction Scales definition from the InstructionalEnvironment Observation Scale - IEO, Stipek) The extent to which lesson/activity is connected tomultiple subject areas.

77
Detachment/Teacher (Classroom code definition from the Classroom Observation System forFifth Grade - COS-5, Pianta) The extent to which the teachers (all adults in classroom) aredetached from the children’s activities, understanding or level of interest.
Depth of knowledge and student understanding (Mathematical Instructional Scales definitionfrom the Instructional Environment Observation Scale - IEO, Stipek) The Extent to which Mathsknowledge is treated deeply in class.
Disruptive (Child code definition from the Classroom Observation System for Fifth Grade - COS-5, Pianta) The extent to which the observed child’s behaviour has disrupted others (both childrenand adults).
Duration In terms of the value added models, the duration of pre-school covers the time periodbetween date of BAS assessment at entry to the EPPE study until entry to primary school. Notethat the number of months of pre-school attended before the child entered the EPPE study is notincluded in this duration measure. A separate ‘duration’ measure of amount of time in pre-schoolprior to entering the study was tested but was not found to be significant (note that this ‘duration’measure is confounded with prior attainment). In the contextualised models, duration of pre-school refers to the time period between entry to the target pre-school until entry to primaryschool. These duration measures provide a crude indication of length of pre-school experience.
ECERS-R and ECERS-E The American Early Childhood Environment Rating Scale (ECERS-R)(Harms et al., 1998) is based on child centred pedagogy and also assesses resources for indoorand outdoor play. The English rating scale (ECERS-E) (Sylva et al., 2003) was intended as asupplement to the ECERS-R and was developed specially for the EPPE study to reflect theDesirable Learning Outcomes (which have since been replaced by the Early Learning Goals), andmore importantly the Curriculum Guidance for the Foundation Stage which at the time was in trialstage.
Educational effectiveness Research design which seeks to explore the effectiveness ofeducational institutions in promoting a range of child/student outcomes (often academicmeasures) while controlling for the influence of intake differences in child/student characteristics.
Effect sizes (ES) Effect sizes (ES) provide a measure of the strength of the relationshipsbetween different predictors and the child outcomes under study. For further discussion seeAppendix 5 and Elliot & Sammons (2004).
Evaluative Feedback (Classroom code definition from the Classroom Observation System forFifth Grade - COS-5, Pianta) The extent to which the teacher provides children with informationon their performance that is intended to improve that performance.
Family factors Examples of family factors are mother’s qualifications, father’s employment andfamily SES.
General Cognitive Ability (GCA) A measure of children’s overall cognitive ability, incorporatingnon-verbal and verbal BAS sub-scales.
Hierarchical nature of the data Data that clusters into pre-defined sub-groups or levels within asystem (i.e. young children, pre-school centres, LAs).
Home Learning Environment (HLE) factors Measures derived from reports from parents (atinterview) about what children do at home, for example, playing with numbers and letters, singingsongs and nursery rhymes.

78
‘Hyperactivity’ At the end of Year 5 teachers rated the social behaviour of EPPE children usingan extended version of the strength and difficulties questionnaire. A factor analysis of the 56items resulted in the extraction of 7 underlying factors. Year 5 factor 1 measures the child’stendency to show inattentive and distracted behaviour.
Intervention study A study in which researchers ‘intervene’ in the sample to control variablesi.e. control by setting, the adult:child ratios in order to compare different specific ratios in differentsettings. EPPE is not an intervention study in that it investigates naturally occurring variation inpre-school settings.
Intra-centre/school correlation The intra-centre/school correlation measures the extent towhich the scores of children in the same centre/school resemble each other as compared withthose from children at different centres/schools. The intra-centre/school correlation provides anindication of the extent to which unexplained variance in children’s progress (i.e. that notaccounted for by prior attainment) may be attributed to differences between centres/schools. Thisgives an indication of possible variation in pre-school centre/school effectiveness.
Linkage to life beyond the classroom (General Instruction Scales definition from theInstructional Environment Observation Scale - IEO, Stipek) The extent to which lesson/activity isconnected to competencies or concerns beyond the classroom.
Locus of Maths authority (Mathematical Instructional Scales definition from the InstructionalEnvironment Observation Scale - IEO, Stipek) The extent to which the lesson supports a sharedsense of authority and responsibility for validating students’ Maths reasoning.
Maths discourse and communication (Mathematical Instructional Scales definition from theInstructional Environment Observation Scale - IEO, Stipek) The extent to which classroomdiscourse in Maths is devoted to creating or negotiating shared understandings of Maths.
Multiple Disadvantage Based on three child variables, six parent variables, and one related tothe Home Learning Environment (HLE) which were considered ‘risk’ indicators when looked at inisolation. A child’s ‘multiple disadvantage’ was calculated by summing the number of indicatorsthe child was at risk on.
Multilevel modelling A methodology that allows data to be examined simultaneously at differentlevels within a system (i.e. young children, pre-school centres, LAs), essentially a generalisationof multiple regression.
Multiple regression A method of predicting outcome scores on the basis of the statisticalrelationship between observed outcome scores and one or more predictor variables.
Negative Classroom Climate (Classroom code definition from the Classroom ObservationSystem for Fifth Grade - COS-5, Pianta) The extent the overall emotional and social tone of theclassroom is hostile, angry and punitive.
Net effect The unique contribution of a particular variable upon an outcome while other variablesare controlled.
Outliers Pre-school centres where children made significantly greater/less progress thanpredicted on the basis of prior attainment and other significant child, parent and Home LearningEnvironment (HLE) characteristics.
Over-Control (Classroom code definition from the Classroom Observation System for FifthGrade - COS-5, Pianta) The extent to which the classroom is rigidly structured or regimented andappears to be driven by the teacher’s agenda regardless of the students needs and interests.

79
Pedagogical strategies Strategies used by the educator to support learning. These include theface to face interactions with children, the organisation of the resources and the assessmentpractices and procedures.
Positive Affect (Child code definition from the Classroom Observation System for Fifth Grade -COS-5, Pianta) The extent to which the observed child appears in a happy mood and pleasantstate during interactions-personal contentment.
Positive Classroom Climate (Classroom code definition from the Classroom ObservationSystem for Fifth Grade - COS-5, Pianta) The extent the overall emotional and social tone of theclassroom is respectful, safe, welcoming, friendships, happy place.
Pre-reading attainment Composite formed by adding together the scores for phonologicalawareness (rhyme and alliteration) and letter recognition.
Prior attainment factors Measures which describe pupils’ achievement at the beginning of thephase or period under investigation (i.e. taken on entry to primary or secondary school or, in thiscase, on entry to the EPPE study).
Productive Use of Instructional Time (Classroom code definition from the ClassroomObservation System for Fifth Grade - COS-5, Pianta) How well the classroom manages time andactivities to insure productivity, engagement and efficient use of instructional time.
‘Pro-social’ behaviour At the end of Year 5 teachers rated the social behaviour of EPPEchildren using an extended version of the strength and difficulties questionnaire. A factor analysisof the 56 items resulted in the extraction of 7 underlying factors. Year 5 factor 2 measures thechild’s ability to work well with as well as show empathy to other children.
Quality Measures of pre-school centre quality collected through observational assessments(ECERS-R, ECERS-E and CIS) made by trained researchers.
Reading as meaning making (Reading Instructional Scales definition from the InstructionalEnvironment Observation Scale - IEO, Stipek) The extent to which students try to derive meaningfrom the texts they read.
Richness of Instructional Methods (Classroom code definition from the Classroom ObservationSystem for Fifth Grade - COS-5, Pianta) The variety and depth of strategies the teacher employsto present a particular lesson and to promote the children’s thinking and understanding at higherlevels of complexity, integration or meaning.
Residuals Residuals associated with a particular pre-school centre or school derive from thedifferences between the expected and observed levels of development for children. Theexpected level of development would be an estimate of developmental level based upon existingchild, family and other characteristics. The difference between the expected developmental leveland the observed (or actual) level for children at a centre or school is the ‘residual’ and ismeasure of the contribution of centre or school characteristics to children’s development. If theresidual is based on the predicted level after controlling for assessments earlier in time, this is aresidual measure for progress. Where the average of all pupils in a centre or school is betterthan expected, residuals are positive and if worse than expected residuals are negative.
Resilience The capacity of individuals to develop and thrive despite risks to their optimaldevelopment.

80
Sampling profile/procedures The EPPE sample was constructed by:− Five regions (six LAs) randomly selected around the country, but being representative of urban,rural, inner city areas.− Pre-schools from each of the 6 types of target provision (nursery classes, nursery schools, localauthority day nurseries, private day nurseries, play groups and integrated centres) randomlyselected across the region.
‘Self-regulation’ At the end of Year 5 teachers rated the social behaviour of EPPE children usingan extended version of the strength and difficulties questionnaire. A factor analysis of the 56items resulted in the extraction of 7 underlying factors. . Year 5 factor 2 is a measure of pupil’sautonomy, confidence and self-sufficiency specifically related to behaviour in a learning, ratherthan a social, context.
Self-Reliance (Child code definition from the Classroom Observation System for Fifth Grade -COS-5, Pianta) The extent to which the observed child displays autonomy, responsibility andpersonal initiative in the classroom.
Significance level Criteria for judging whether differences in scores between groups of childrenor centres might have arisen by chance. The most common criteria is the 95% level (p<0.05)which can be expected to include the ‘true’ value in 95 out of 100 samples (i.e. the probabilitybeing one in twenty that a difference might have arisen by chance).
Sociable/Co-operative with Peers (Child code definition from the Classroom ObservationSystem for Fifth Grade - COS-5, Pianta) The extent to which the observed child displays positiveengagement with and interest in peers as well as willingness/ability to get along with others inplay and work situations.
Social/behavioural development A child’s ability to ‘socialise’ with other adults and childrenand their general behaviour to others.
Social support for student learning (General Instruction Scales definition from the InstructionalEnvironment Observation Scale - IEO, Stipek) The extent classroom learning environment ischaracterised by an atmosphere of high academic expectations for all students coupled withmutual respect and support among teacher and pupils.
Socio Economic Status (SES) Occupational information was collected by means of a parentalinterview when children were recruited to the study. The Office of Population Census andSurveys OPCS (1995) Classification of Occupations was used to classify mothers and fatherscurrent employment into one of 8 groups: professional I, other professional non manual II, skillednon manual III, skilled manual III, semi-skilled manual IV, unskilled manual V, never worked andno response. Family SES was obtained by assigning the SES classification based on the parentwith the highest occupational status.
Standard deviation (sd) A measure of the spread around the mean in a distribution of numericalscores. In a normal distribution, 68% of cases fall within one standard deviation of the mean and95% of cases fall within two standard deviations.
Student engagement (General Instruction Scales definition from the Instructional EnvironmentObservation Scale - IEO, Stipek) The extent students are engaged in lessons.
Target centre A total of 141 pre-school centres were recruited to the EPPE research covering 6types of provision. The sample of children were drawn from these target centres.
Teacher Sensitivity (Classroom code definition from the Classroom Observation System for FifthGrade - COS-5, Pianta) The extent that child-centred behaviour is demonstrated by the teacherdesignated as the primary teacher for the observation cycle.

81
Total BAS score By combining 4 of the BAS sub-scales (2 verbal and 2 non-verbal) a GeneralCognitive Ability score or Total BAS score at entry to the study can be computed. This is ameasure of overall cognitive ability.
Use of Maths analysis (Mathematical Instructional Scales definition from the InstructionalEnvironment Observation Scale - IEO, Stipek) The extent children use Maths analysis.
Value added models Longitudinal multilevel models exploring children’s cognitive progress overthe pre-school period, controlling for prior attainment and significant child, parent and HomeLearning Environment (HLE) characteristics.
Vulnerability The level of risk to optimal development that is present for any individual as aresult of their individual, family and social situation.

Copies of this publication can be obtained from:
DfES PublicationsPO Box 5050Sherwood ParkAnnesleyNottingham NG15 ODJ
Tel 0845 6022260Fax 0845 6033360Email [email protected] quote ref: DCSF-RR007
ISBN: 978 1 84775 024 2
© Institute of Education, University of London 2007
www.dcsf.gov.uk/research
Published by the Department forChildren, Schools and Families
£4.95