Embed Size (px)
Citation preview
www.surv.esr.cri.nz
SURVEILLANCE REPORT
Influenza surveillance in New Zealand
2011
Prepared as part of a Ministry of Health contract for scientific services by the Health Intelligence Team, Institute of Environmental Science and Research Limited
April 2012
Client Report: FW12012

INFLUENZA SURVEILLANCE
IN NEW ZEALAND
2011
Prepared as part of the Ministry of Health Contract
(2010/11 Service Description: Health Intelligence Services)
by
Liza Lopez, Senior Analyst
Dr Q Sue Huang, Senior Science Leader - Virology
April 2012

This report is available at www.surv.esr.cri.nz
First published: 5 April 2012
Suggested citation: Lopez, L. and Q.S. Huang, Influenza Surveillance in New Zealand 2011, 2012, Institute of Environmental Science and Research Ltd (ESR): Wellington, New Zealand
Client Report FW12012
Reproduction is authorised provided the source is acknowledged.
Institute of Environmental Science and Research Limited i
Acknowledgements
We would like to thank the general practitioners and their staff, the local surveillance coordinators, regional virology laboratories (Auckland, Waikato, Wellington and Christchurch), and medical officers of health involved in influenza surveillance for their time and cooperation. We would also like to acknowledge the WHO National Influenza Centre at ESR for the provision of laboratory data, ESR Information Management group for assisting in the running of the electronic flu database, and Drs Graham Mackereth and Don Bandaranayake for peer review. A special thanks to the WHO Collaborating Centre in Melbourne for providing further characterisations on the influenza isolates. A special thanks to Chris Lewis for providing influenza hospitalisation and Dr Lance Jennings for providing influenza immunisation coverage data.
Disclaimer
This report or document (“the Report”) is given by the Institute of Environmental Science and Research Limited (“ESR”) solely for the benefit of the Ministry of Health, Public Health Services Providers and other Third Party Beneficiaries as defined in the Contract between ESR and the Ministry of Health, and is strictly subject to the conditions laid out in that Contract.
Neither ESR nor any of its employees makes any warranty, express or implied, or assumes any legal liability or responsibility for use of the Report or its contents by any other person or organisation.

ii Institute of Environmental Science and Research Limited
Institute of Environmental Science and Research Limited iii
TABLE OF CONTENTS
List of figures .................................................................................................................................................. iv
List of tables ................................................................................................................................................... iv
Summary .......................................................................................................................................................... 1
1. Introduction .............................................................................................................................................. 5
2. Methods .................................................................................................................................................... 9
2.1 General practice sentinel surveillance – epidemiology and virology data ..................................... 11 2.2 Non-sentinel surveillance – virological surveillance for outpatients and hospital inpatients ......... 12 2.3 Hospitalisations .............................................................................................................................. 12 2.4 Data used to calculate rates ............................................................................................................ 12 2.5 Ethnicity ......................................................................................................................................... 13 2.6 Immunisation coverage ................................................................................................................... 13 2.7 HealthStat ....................................................................................................................................... 13 2.8 Healthline........................................................................................................................................ 14
3. Sentinel and non-sentinel surveillance ............................................................................................... 15
3.1 Disease burden ................................................................................................................................ 17 3.2 Geographic distribution .................................................................................................................. 18 3.3 Age distribution .............................................................................................................................. 21
4. HealthStat GP-based surveillance ........................................................................................................ 23
5. Morbidity ................................................................................................................................................ 27
6. Healthline ............................................................................................................................................... 31
7. Immunisation coverage ......................................................................................................................... 35
8. Virus strain characterisation ................................................................................................................ 39
8.1 Circulating viral strains in 2011 ..................................................................................................... 41 8.2 Influenza A(H1N1)pdm09 .............................................................................................................. 45 8.3 Seasonal A(H1N1) .......................................................................................................................... 45 8.4 Influenza A(H3N2) ......................................................................................................................... 45 8.5 Influenza B ..................................................................................................................................... 45 8.6 Oseltamivir resistance monitoring .................................................................................................. 45
9. Southern hemisphere vaccine strain recommendations ................................................................... 47
9.1 Influenza A(H1N1) ......................................................................................................................... 49 9.2 Influenza A(H3N2) ......................................................................................................................... 49 9.3 Influenza B ..................................................................................................................................... 49
10. Discussion ............................................................................................................................................. 51
References ..................................................................................................................................................... 57
Appendix ........................................................................................................................................................ 61
iv Institute of Environmental Science and Research Limited
LIST OF FIGURES
Figure 1. Weekly consultation rates for ILI in New Zealand, 2009, 2010 and 2011 .................................. 17 Figure 2. Total number of influenza viruses detected by surveillance type and week specimen taken, 2011 ............................................................................................................................................................. 18 Figure 3. Sentinel average weekly consultation rates for influenza by DHB, 2011 ................................... 19 Figure 4. Numbers of laboratory-confirmed influenza viruses from sentinel surveillance by DHB, May to October 2011 ........................................................................................................................................... 20 Figure 5. Sentinel swabs received and tested positive for influenza virus by DHB, 2011 ......................... 20 Figure 6. Sentinel average weekly consultation rates for ILI by age group, 2011 ...................................... 21 Figure 7. Percentage of sentinel and non-sentinel influenza viruses by age group, 2011 ........................... 21 Figure 8. HealthStat ILI consultation rates by week from 2009–2011 ....................................................... 25 Figure 9. ESR and HealthStat sentinel ILI rates, 2011................................................................................ 25 Figure 10. Influenza hospitalisations by week discharged, 2011 ................................................................ 29 Figure 11. Influenza hospitalisations, 2000–2011 ....................................................................................... 29 Figure 12. Influenza hospitalisation rates by age group, 2011 .................................................................... 30 Figure 13. Hospitalisation rates by prioritised ethnic group in 2011 .......................................................... 30 Figure 14. Weekly numbers of ILI-related calls to Healthline in 2009, 2010 and 2011 ............................. 33 Figure 15. Influenza vaccine uptake, 1990–2011 ........................................................................................ 37 Figure 16. Total influenza viruses by type and week specimen taken, 2011 .............................................. 41 Figure 17. Total influenza A and B viruses by week specimen taken, 2011 .............................................. 42 Figure 18. Influenza viruses from sentinel surveillance by type and week reported, 2011 ........................ 42 Figure 19. Influenza viruses from non-sentinel surveillance by type and week reported, 2011 ................. 43 Figure 20. Influenza viruses by type, 1990–2011 ....................................................................................... 44 Figure 21. Influenza B antigenic types, 1990–2011 .................................................................................... 44
LIST OF TABLES
Table 1. DHB codes and descriptions ......................................................................................................... 19 Table 2. Influenza virus identifications by type and subtype, 2011 ............................................................ 41 Table 3. Antiviral susceptibility to oseltamivir for influenza viruses in New Zealand, 2006–2011 ........... 46

SUMMARY

Influenza surveillance in New Zealand 2011 Summary
Institute of Environmental Science and Research Limited 3
SUMMARY
Influenza viruses frequently undergo antigenic changes and can cause substantial morbidity and mortality in a short space of time. National influenza surveillance in New Zealand is an essential public health component for assessing and implementing strategies to control influenza. Influenza surveillance in New Zealand monitors the incidence and distribution of influenza in the community, it assists with the early detection of influenza epidemics and identifies the predominant circulating strains. This report summarises the burden of disease in the community due to influenza, the circulating influenza virus strains, hospitalisations and immunisation coverage for 2011.
During the 2011 winter season, 3596 consultations for influenza-like illness (ILI) were reported from a national sentinel network of 88 general practices. It is estimated that ILI resulting in a visit to a general practitioner affected over 41,133 New Zealanders (0.9% of total population) during the season, compared with an estimated 50,561 people in 2010 (1.2% of total population).
Influenza activity peaked in July. Overall, ILI activity in 2011 was at a low level compared with the 1997–2010 period. ILI consultation rates varied greatly among District Health Boards (DHBs), with the highest rates reported from the Waitemata and Whanganui DHBs.
In 2011, a total of 1268 influenza viruses were detected. Of these, 53.3% were influenza A and 46.7% were influenza B. Of all the viruses typed and sub-typed (1176) during the season, the predominant strain was influenza B at 50.3%, 39.6% were A(H3N2) and 10% were influenza A(H1N1)pdm09 strains. Antiviral susceptibility monitoring indicated that all influenza viruses (261) tested were sensitive to oseltamivir.
No significant antigenic drift for influenza A(H1N1)pdm09, A(H3N2) and B viruses was observed among circulating influenza viruses and no updates were required for the three components of the influenza vaccine for 2012.


1. INTRODUCTION

Influenza surveillance in New Zealand 2011 1. Introduction
Institute of Environmental Science and Research Limited 7
1. INTRODUCTION
Influenza viruses frequently undergo antigenic changes, enabling them to evade the host immune response. This poses a real challenge for the prevention and control of influenza. The overarching goal of influenza surveillance is to provide information to public health authorities to facilitate appropriate control and intervention measures, health resource allocation and case management, thereby minimising the impact of influenza on people.
Specifically, New Zealand’s influenza surveillance activities aim to:
understand the incidence and distribution of influenza in the community
assist with the early detection of influenza epidemics within the community and guide the development and implementation of public health measures
identify the predominant circulating strains in the community and guide the composition of the influenza vaccine for the subsequent year [1].
This report summarises the results obtained from influenza surveillance in New Zealand for 2011, and includes some comparisons with previous years. It also includes information on influenza morbidity (obtained from the Ministry of Health’s National Minimum Dataset), and influenza immunisation coverage data (obtained from Health Benefits Limited).


2. METHODS

Influenza surveillance in New Zealand 2011 2. Methods
Institute of Environmental Science and Research Limited 11
2. METHODS
2.1 General practice sentinel surveillance – epidemiology and virology data
The sentinel surveillance system, in its current form, began in 1991 as part of the World Health Organization’s (WHO) Global Programme for Influenza Surveillance. It is operated nationally by the Institute of Environmental Science and Research (ESR) and locally by influenza surveillance co-ordinators in the public health services (PHSs). Sentinel surveillance usually operates in the winter, from May to September; however, the sentinel time period was extended from May to October 2011 (week 18 to week 43, inclusive) due to the Rugby World Cup. Local surveillance co-ordinators recruited general practices within their region to participate on a voluntary basis. Where possible, the number of practices recruited was proportional to the size of the population in each District Health Board (DHB) covered by the PHS (approximately 1 general practitioner (GP) per 50,000 population).
GPs were required to record the number of consultations for influenza-like illness (ILI) each week and the age group in years (<1, 1–4, 5–19, 20–34, 35–49, 50–64, 65+) of each of these suspected cases on a standardised form.
ILI was defined by a standardised case definition, which is, ‘acute upper respiratory tract infection characterised by abrupt onset and two of the following: fever, chills, headache, and myalgia.’ [2]
Each participating GP collected three respiratory samples weekly (ie, a nasopharyngeal or throat swab), one each from the first ILI patient examined on Monday, Tuesday and Wednesday of the week. Further refinement of the sampling scheme has been implemented since 2010. For a general practice with a registered patient population of more than 10,000, a total of six nasopharyngeal or throat swabs were collected, two each from the first two ILI patients examined on Monday, Tuesday and Wednesday of the week. The GPs forwarded these samples to the WHO National Influenza Centre (NIC) at ESR or to hospital virology laboratories in Auckland, Waikato or Christchurch for virus characterisation. Laboratory identification included molecular detection using the polymerase chain reaction (PCR), isolation of the virus or direct detection of viral antigens. Influenza viruses were typed and subtyped as A, B, A(H3N2) or influenza A(H1N1)pdm09.
Information on the number of ILI consultations and swabs sent from each DHB was forwarded to ESR each week (Monday to Sunday) by local co-ordinators. ILI consultation data were received by Wednesday of the following week. Likewise, virology laboratories reported to ESR weekly with the total number of swabs received from each DHB, the influenza viruses identified and updated details on types and strains. ESR reports national information on epidemiological and virological surveillance of influenza weekly, monthly and annually to relevant national and international organisations, including the WHO, and it publishes the results on the website: http://www.surv.esr.cri.nz/virology/influenza_weekly_update.php
Consultation rates were calculated using the registered patient populations of the participating practices as denominators. From 1992 to 2009, the denominator for the age-specific ILI rate calculation was based on New Zealand census data with the assumption that the age distribution of the GP patient population was the same as the New Zealand population, because age-specific patient population data were not provided by the participating practices. From 2010 to 2011, age-specific ILI consultation rate calculations have used the age-specific patient populations as denominators for all but three general practices where the former calculation method was applied.
Influenza surveillance in New Zealand 2011 2. Methods
12 Institute of Environmental Science and Research Limited
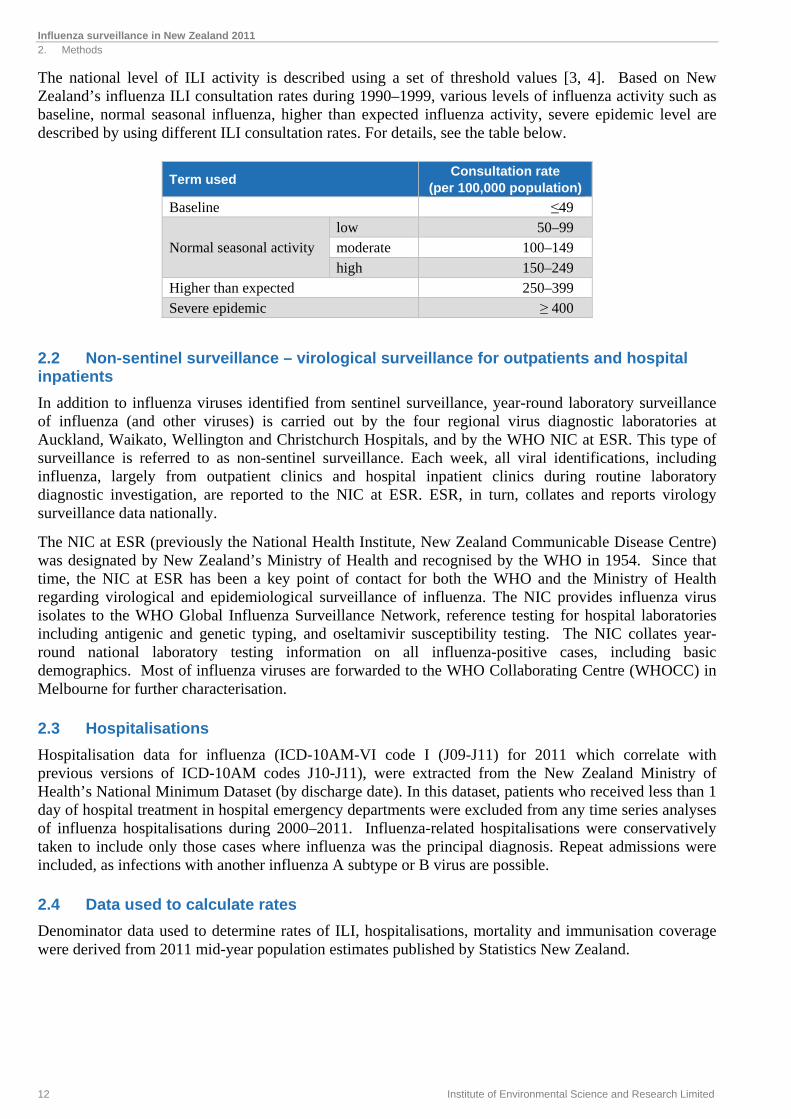
The national level of ILI activity is described using a set of threshold values [3, 4]. Based on New Zealand’s influenza ILI consultation rates during 1990–1999, various levels of influenza activity such as baseline, normal seasonal influenza, higher than expected influenza activity, severe epidemic level are described by using different ILI consultation rates. For details, see the table below.
Term used Consultation rate
(per 100,000 population)
Baseline ≤49
Normal seasonal activity low 50–99 moderate 100–149 high 150–249
Higher than expected 250–399 Severe epidemic ≥ 400
2.2 Non-sentinel surveillance – virological surveillance for outpatients and hospital inpatients
In addition to influenza viruses identified from sentinel surveillance, year-round laboratory surveillance of influenza (and other viruses) is carried out by the four regional virus diagnostic laboratories at Auckland, Waikato, Wellington and Christchurch Hospitals, and by the WHO NIC at ESR. This type of surveillance is referred to as non-sentinel surveillance. Each week, all viral identifications, including influenza, largely from outpatient clinics and hospital inpatient clinics during routine laboratory diagnostic investigation, are reported to the NIC at ESR. ESR, in turn, collates and reports virology surveillance data nationally.
The NIC at ESR (previously the National Health Institute, New Zealand Communicable Disease Centre) was designated by New Zealand’s Ministry of Health and recognised by the WHO in 1954. Since that time, the NIC at ESR has been a key point of contact for both the WHO and the Ministry of Health regarding virological and epidemiological surveillance of influenza. The NIC provides influenza virus isolates to the WHO Global Influenza Surveillance Network, reference testing for hospital laboratories including antigenic and genetic typing, and oseltamivir susceptibility testing. The NIC collates year-round national laboratory testing information on all influenza-positive cases, including basic demographics. Most of influenza viruses are forwarded to the WHO Collaborating Centre (WHOCC) in Melbourne for further characterisation.
2.3 Hospitalisations
Hospitalisation data for influenza (ICD-10AM-VI code I (J09-J11) for 2011 which correlate with previous versions of ICD-10AM codes J10-J11), were extracted from the New Zealand Ministry of Health’s National Minimum Dataset (by discharge date). In this dataset, patients who received less than 1 day of hospital treatment in hospital emergency departments were excluded from any time series analyses of influenza hospitalisations during 2000–2011. Influenza-related hospitalisations were conservatively taken to include only those cases where influenza was the principal diagnosis. Repeat admissions were included, as infections with another influenza A subtype or B virus are possible.
2.4 Data used to calculate rates
Denominator data used to determine rates of ILI, hospitalisations, mortality and immunisation coverage were derived from 2011 mid-year population estimates published by Statistics New Zealand.
Influenza surveillance in New Zealand 2011 2. Methods
Institute of Environmental Science and Research Limited 13
2.5 Ethnicity
For different ethnic groups, numbers hospitalised and rates are based on a prioritised classification of ethnicity, with the Māori ethnic group at the top of the hierarchy, followed by Pacific Peoples, Asian, Middle Eastern/Latin American/African (MELAA) and European or Other Ethnicity (including New Zealander) ethnic groups.
2.6 Immunisation coverage
In 1997, the influenza vaccination was made available free to those aged 65 years and older, and in 1999, free vaccinations were extended to all pregnant women and those people who are younger than 65 years and are at high risk of complications from influenza [5, 6].
People younger than 65 years are eligible for free influenza vaccinations if they have any of the following medical conditions:
cardiovascular disease (ischaemic heart disease, congestive heart failure, rheumatic heart disease, congenital heart disease, cerebrovascular disease)
chronic respiratory disease (asthma if on regular preventive therapy, other respiratory disease with impaired lung function)
diabetes
chronic renal disease
cancer (current), excluding basal and squamous skin cancers, if not invasive
other conditions (autoimmune disease, immunosuppression, human immunodeficiency virus, transplant recipients, neuromuscular and central nervous system diseases, haemoglobinopathies, children on long-term aspirin therapy).
The data that medical practitioners provide to Health Benefits Limited to claim reimbursement were used to estimate immunisation coverage in 2011 among persons eligible for free influenza vaccinations.
2.7 HealthStat
HealthStat is a computer-based routine surveillance system of a nationally representative random sample of approximately 100 general practices that code for ILI. The case definition used for ILI by HealthStat is: ‘acute upper respiratory tract infection, with abrupt onset of 2+ symptoms from chills, fever, headache and myalgia’. This surveillance system monitors the number of people who consult GPs with their influenza like illness. HealthStat is based on the automated downloads from GP practice management computer systems. These data are provided to ESR by CBG Health Research Ltd. HealthStat GP-based surveillance does not include virological surveillance.
Analysis is frequency based with alarms raised by identifying statistical deviations (aberrations) from previous ILI counts. The analysis of the ILI count is based on the cumulative summation algorithm implemented in the Early Aberration Reporting System (EARS) application developed by the Centres for Disease Control and Prevention (CDC), Atlanta, United States. EARS has three sensitivity thresholds (high, medium and low). If the daily call count exceeds a threshold, a flag is signalled.
Influenza surveillance in New Zealand 2011 2. Methods
14 Institute of Environmental Science and Research Limited
2.8 Healthline
Healthline is the free national 0800 24-hour telephone health advice service funded by the Ministry of Health. Calls made to Healthline are triaged using electronic clinical decision support software. Data collected are daily counts of all symptomatic calls made to Healthline and those triaged for ILI. Around 70% of all calls to Healthline are symptom-related (other calls that are not part of this analysis include queries for information).
Analysis is frequency based with alerts raised by identifying statistical deviations (aberrations) from previous calls. Data are reported for all ages and in five age bands (0–4, 5–14, 15–44, 45–64, 65+ years). The analysis of the call frequency is based on the cumulative summation (CUSUM) algorithm implemented in EARS. EARS has three sensitivity thresholds (high, medium and low). If the daily call count exceeds a threshold a flag is signalled.
Cases of ILI are defined as those that are recorded in the Healthline database as having one of the following 18 guidelines: fever (adult); breathing problems; breathing difficulty – severe (paediatric); colds (paediatric); cough (paediatric); cough (adult); fever (paediatric); flu-like symptoms or known/suspected influenza; flu-like symptoms (pregnant); influenza (paediatric); headache; headache (paediatric); muscle ache/pain; sore throat (paediatric); sore throat/hoarseness; sore throat/hoarseness (pregnant); upper respiratory tract infections/colds; upper respiratory tract infections/colds (pregnant).
From the end of April 2009 until 9 June 2009, ILI also included the following guidelines: influenza (swine) and influenza (swine) paediatric (for influenza swine, only cases referred to activate 111 or go to a GP/ED immediately are included). From 9 June 2009, ILI included all callers with the guideline influenza (swine) or influenza (swine) paediatric. From 14 June 2009, there were no guidelines for influenza (swine) or influenza (swine) paediatric.
3. SENTINEL AND NON-SENTINEL SURVEILLANCE

Influenza surveillance in New Zealand 2011 3. Sentinel and non-sentinel surveillance
Institute of Environmental Science and Research Limited 17
3. SENTINEL AND NON-SENTINEL SURVEILLANCE
3.1 Disease burden
In 2011, 88 sentinel practices were recruited from all 20 DHBs under ESR’s sentinel GP-based surveillance. All PHSs began reporting by the fifth week (5 June 2011). Some sentinel practices did not report every week. The average number of practices participating per week was 81, with an average patient population roll of 385,108 – approximately 8.7% of the New Zealand population.
During the 2011 influenza season (May to October), a total of 3596 sentinel consultations for ILI were reported. Based on this, the cumulative incidence rate of ILI consultations was 933.8 per 100,000 patient population. This rate is lower than the cumulative incidence rate for 2010 (1157.6 per 100,000) and 2009 (2695.6 per 100,000). The average national weekly consultation rate in 2011 was 37.1 per 100,000 patient population. This rate is lower than the average weekly rates for 2010 (49.3 per 100,000) and 2009 (106.1 per 100,000).
Extrapolating ILI consultations obtained from the general practice patient population to the New Zealand population, it is estimated that ILI resulting in a visit to a GP affected 41,133 New Zealanders during the 2011 influenza season (0.9% of total population). This is lower than the estimated 50,561 (8.1% of total population) people affected in 2010 and 116,335 (9.3% of total population) people affected in 2009.
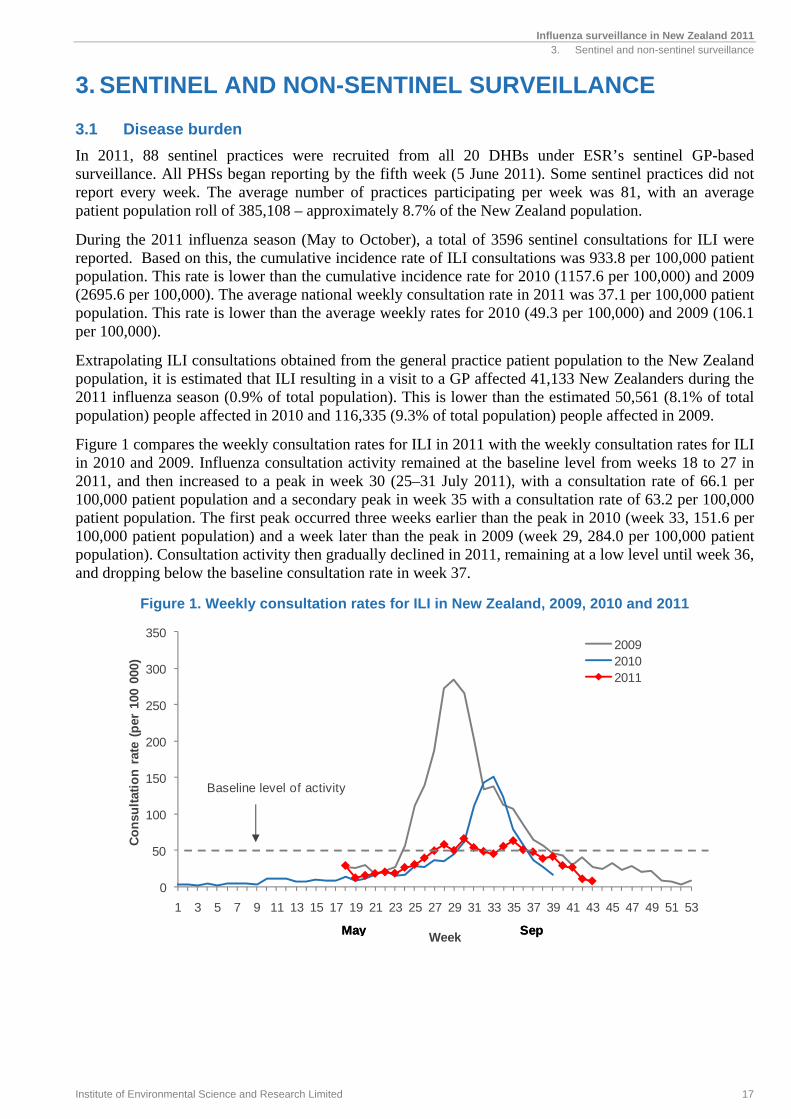
Figure 1 compares the weekly consultation rates for ILI in 2011 with the weekly consultation rates for ILI in 2010 and 2009. Influenza consultation activity remained at the baseline level from weeks 18 to 27 in 2011, and then increased to a peak in week 30 (25–31 July 2011), with a consultation rate of 66.1 per 100,000 patient population and a secondary peak in week 35 with a consultation rate of 63.2 per 100,000 patient population. The first peak occurred three weeks earlier than the peak in 2010 (week 33, 151.6 per 100,000 patient population) and a week later than the peak in 2009 (week 29, 284.0 per 100,000 patient population). Consultation activity then gradually declined in 2011, remaining at a low level until week 36, and dropping below the baseline consultation rate in week 37.
Figure 1. Weekly consultation rates for ILI in New Zealand, 2009, 2010 and 2011
0
50
100
150
200
250
300
350
1 3 5 7 9 11 13 15 17 19 21 23 25 27 29 31 33 35 37 39 41 43 45 47 49 51 53
Co
nsu
ltat
ion
rat
e (p
er 1
00 0
00)
Week
200920102011
SepMay
Baseline level of activity
SepMay
Influenza surveillance in New Zealand 2011 3. Sentinel and non-sentinel surveillance
18 Institute of Environmental Science and Research Limited
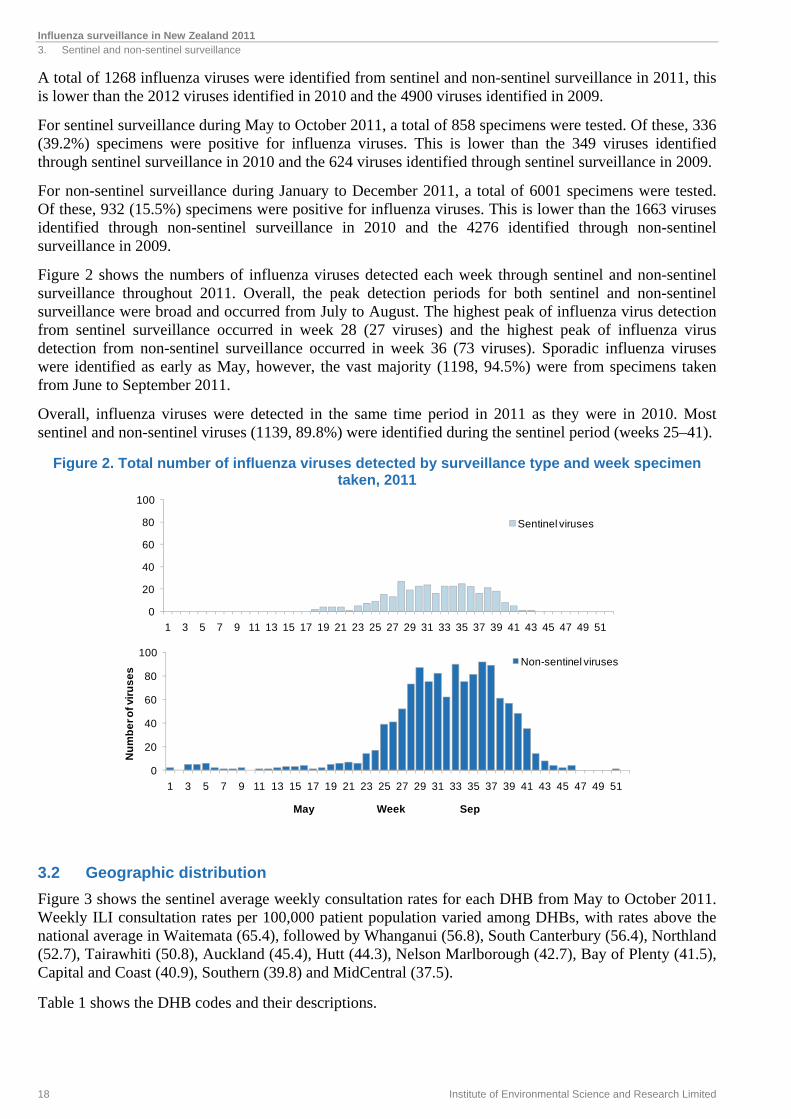
A total of 1268 influenza viruses were identified from sentinel and non-sentinel surveillance in 2011, this is lower than the 2012 viruses identified in 2010 and the 4900 viruses identified in 2009.
For sentinel surveillance during May to October 2011, a total of 858 specimens were tested. Of these, 336 (39.2%) specimens were positive for influenza viruses. This is lower than the 349 viruses identified through sentinel surveillance in 2010 and the 624 viruses identified through sentinel surveillance in 2009.
For non-sentinel surveillance during January to December 2011, a total of 6001 specimens were tested. Of these, 932 (15.5%) specimens were positive for influenza viruses. This is lower than the 1663 viruses identified through non-sentinel surveillance in 2010 and the 4276 identified through non-sentinel surveillance in 2009.
Figure 2 shows the numbers of influenza viruses detected each week through sentinel and non-sentinel surveillance throughout 2011. Overall, the peak detection periods for both sentinel and non-sentinel surveillance were broad and occurred from July to August. The highest peak of influenza virus detection from sentinel surveillance occurred in week 28 (27 viruses) and the highest peak of influenza virus detection from non-sentinel surveillance occurred in week 36 (73 viruses). Sporadic influenza viruses were identified as early as May, however, the vast majority (1198, 94.5%) were from specimens taken from June to September 2011.
Overall, influenza viruses were detected in the same time period in 2011 as they were in 2010. Most sentinel and non-sentinel viruses (1139, 89.8%) were identified during the sentinel period (weeks 25–41).
Figure 2. Total number of influenza viruses detected by surveillance type and week specimen taken, 2011
3.2 Geographic distribution
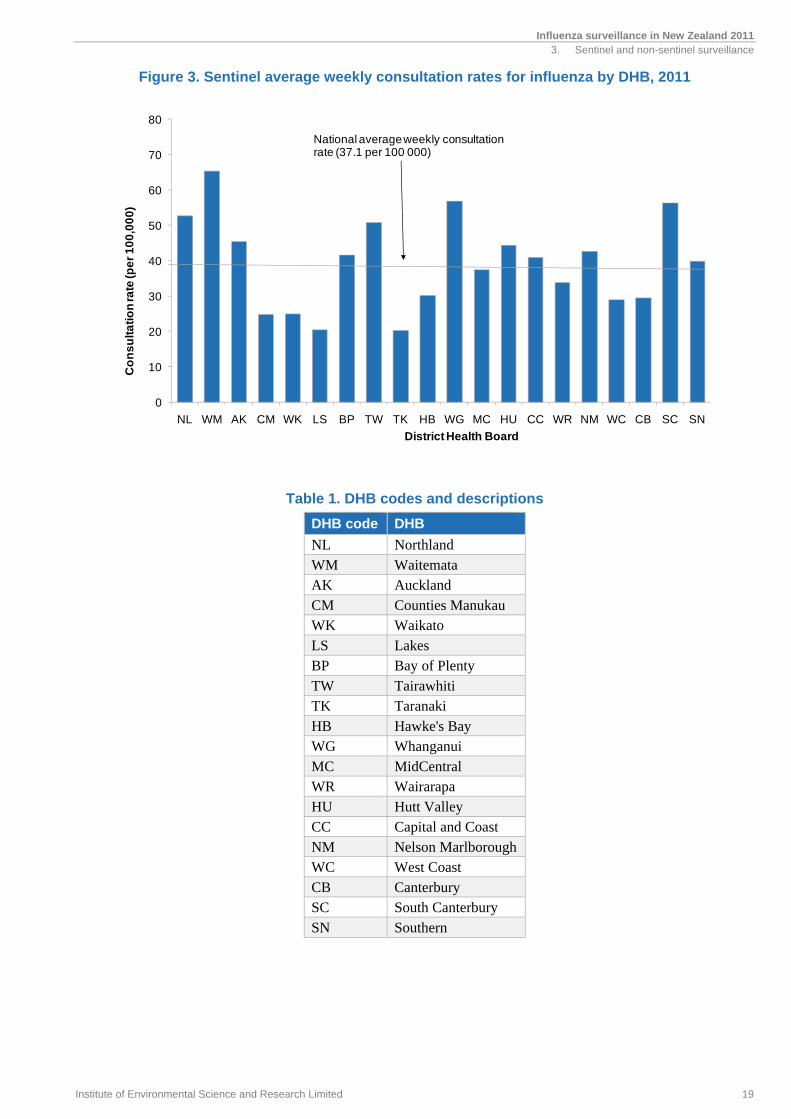
Figure 3 shows the sentinel average weekly consultation rates for each DHB from May to October 2011. Weekly ILI consultation rates per 100,000 patient population varied among DHBs, with rates above the national average in Waitemata (65.4), followed by Whanganui (56.8), South Canterbury (56.4), Northland (52.7), Tairawhiti (50.8), Auckland (45.4), Hutt (44.3), Nelson Marlborough (42.7), Bay of Plenty (41.5), Capital and Coast (40.9), Southern (39.8) and MidCentral (37.5).
Table 1 shows the DHB codes and their descriptions.
0
20
40
60
80
100
1 3 5 7 9 11 13 15 17 19 21 23 25 27 29 31 33 35 37 39 41 43 45 47 49 51
Nu
mb
er o
f vir
us
es
Week
Non-sentinel viruses
0
20
40
60
80
100
1 3 5 7 9 11 13 15 17 19 21 23 25 27 29 31 33 35 37 39 41 43 45 47 49 51
Sentinel viruses
May Sep
Influenza surveillance in New Zealand 2011 3. Sentinel and non-sentinel surveillance
Institute of Environmental Science and Research Limited 19
Figure 3. Sentinel average weekly consultation rates for influenza by DHB, 2011
Table 1. DHB codes and descriptions
DHB code DHB
NL Northland WM Waitemata AK Auckland CM Counties Manukau WK Waikato LS Lakes BP Bay of Plenty TW Tairawhiti TK Taranaki HB Hawke's Bay WG Whanganui MC MidCentral WR Wairarapa HU Hutt Valley CC Capital and Coast NM Nelson Marlborough WC West Coast CB Canterbury SC South Canterbury SN Southern
0
10
20
30
40
50
60
70
80
NL WM AK CM WK LS BP TW TK HB WG MC HU CC WR NM WC CB SC SN
Co
ns
ult
ati
on
rate
(pe
r 1
00
,00
0)
District Health Board
National average weekly consultation rate (37.1 per 100 000)
Influenza surveillance in New Zealand 2011 3. Sentinel and non-sentinel surveillance
20 Institute of Environmental Science and Research Limited
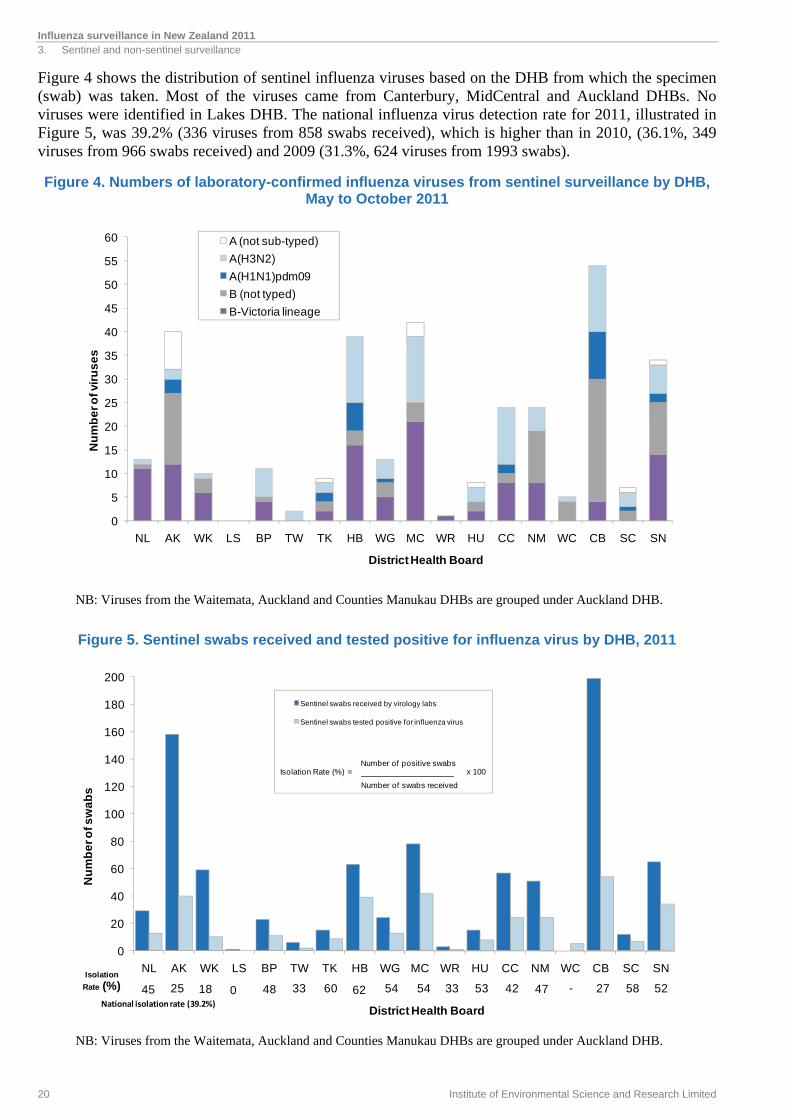
Figure 4 shows the distribution of sentinel influenza viruses based on the DHB from which the specimen (swab) was taken. Most of the viruses came from Canterbury, MidCentral and Auckland DHBs. No viruses were identified in Lakes DHB. The national influenza virus detection rate for 2011, illustrated in Figure 5, was 39.2% (336 viruses from 858 swabs received), which is higher than in 2010, (36.1%, 349 viruses from 966 swabs received) and 2009 (31.3%, 624 viruses from 1993 swabs).
Figure 4. Numbers of laboratory-confirmed influenza viruses from sentinel surveillance by DHB, May to October 2011
NB: Viruses from the Waitemata, Auckland and Counties Manukau DHBs are grouped under Auckland DHB.
Figure 5. Sentinel swabs received and tested positive for influenza virus by DHB, 2011
NB: Viruses from the Waitemata, Auckland and Counties Manukau DHBs are grouped under Auckland DHB.
0
5
10
15
20
25
30
35
40
45
50
55
60
NL AK WK LS BP TW TK HB WG MC WR HU CC NM WC CB SC SN
Nu
mb
er o
f vir
us
es
District Health Board
A (not sub-typed)
A(H3N2)
A(H1N1)pdm09
B (not typed)
B-Victoria lineage
0
20
40
60
80
100
120
140
160
180
200
NL AK WK LS BP TW TK HB WG MC WR HU CC NM WC CB SC SN
Nu
mb
er o
f sw
ab
s
District Health Board
Sentinel swabs received by virology labs
Sentinel swabs tested positive for influenza virus
25Isolation
Rate (%) 5827-47425333545462603348018
Number of positive swabs
Number of swabs received
x 100Isolation Rate (%) =
45 52National isolation rate (39.2%)
Influenza surveillance in New Zealand 2011 3. Sentinel and non-sentinel surveillance
Institute of Environmental Science and Research Limited 21
3.3 Age distribution
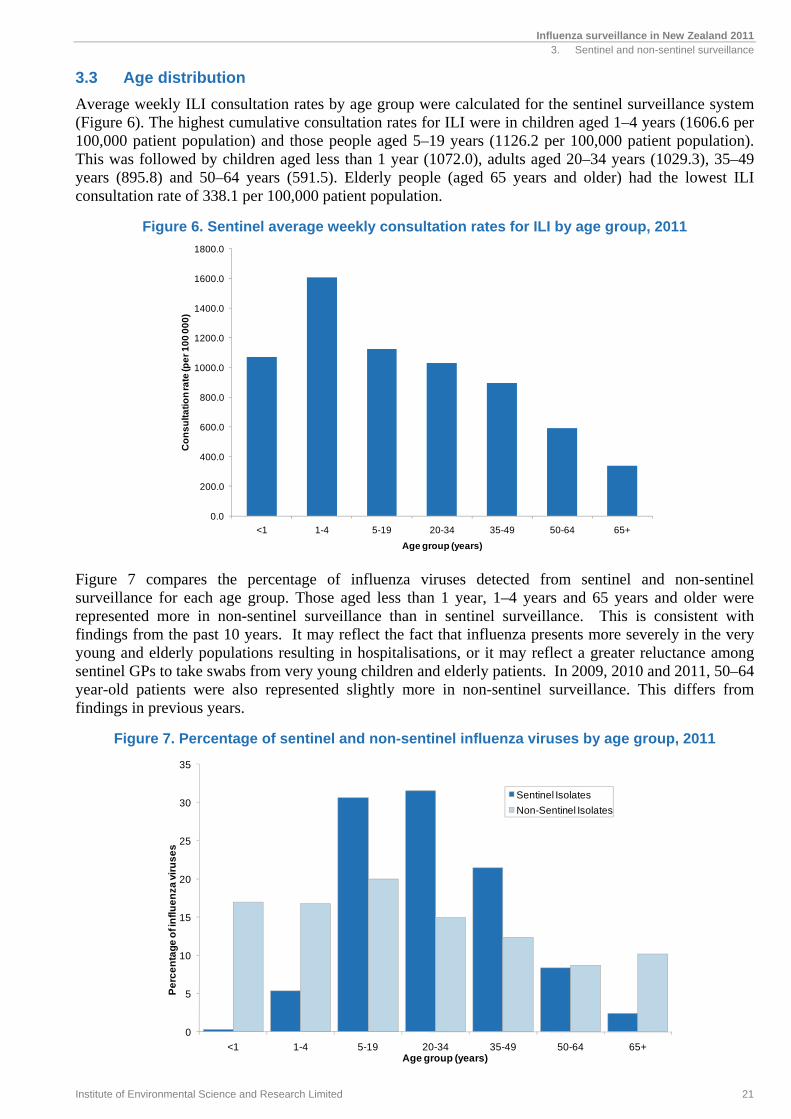
Average weekly ILI consultation rates by age group were calculated for the sentinel surveillance system (Figure 6). The highest cumulative consultation rates for ILI were in children aged 1–4 years (1606.6 per 100,000 patient population) and those people aged 5–19 years (1126.2 per 100,000 patient population). This was followed by children aged less than 1 year (1072.0), adults aged 20–34 years (1029.3), 35–49 years (895.8) and 50–64 years (591.5). Elderly people (aged 65 years and older) had the lowest ILI consultation rate of 338.1 per 100,000 patient population.
Figure 6. Sentinel average weekly consultation rates for ILI by age group, 2011
Figure 7 compares the percentage of influenza viruses detected from sentinel and non-sentinel surveillance for each age group. Those aged less than 1 year, 1–4 years and 65 years and older were represented more in non-sentinel surveillance than in sentinel surveillance. This is consistent with findings from the past 10 years. It may reflect the fact that influenza presents more severely in the very young and elderly populations resulting in hospitalisations, or it may reflect a greater reluctance among sentinel GPs to take swabs from very young children and elderly patients. In 2009, 2010 and 2011, 50–64 year-old patients were also represented slightly more in non-sentinel surveillance. This differs from findings in previous years.
Figure 7. Percentage of sentinel and non-sentinel influenza viruses by age group, 2011
0
5
10
15
20
25
30
35
<1 1-4 5-19 20-34 35-49 50-64 65+
Pe
rce
nta
ge
of i
nfl
ue
nza
vir
us
es
Age group (years)
Sentinel Isolates
Non-Sentinel Isolates
0.0
200.0
400.0
600.0
800.0
1000.0
1200.0
1400.0
1600.0
1800.0
<1 1-4 5-19 20-34 35-49 50-64 65+
Co
ns
ult
ati
on
rate
(pe
r 1
00
00
0)
Age group (years)

4. HEALTHSTAT GP-BASED SURVEILLANCE

Influenza surveillance in New Zealand 2011 4. HealthStat GP-based surveillance
Institute of Environmental Science and Research Limited 25
4. HEALTHSTAT GP-BASED SURVEILLANCE
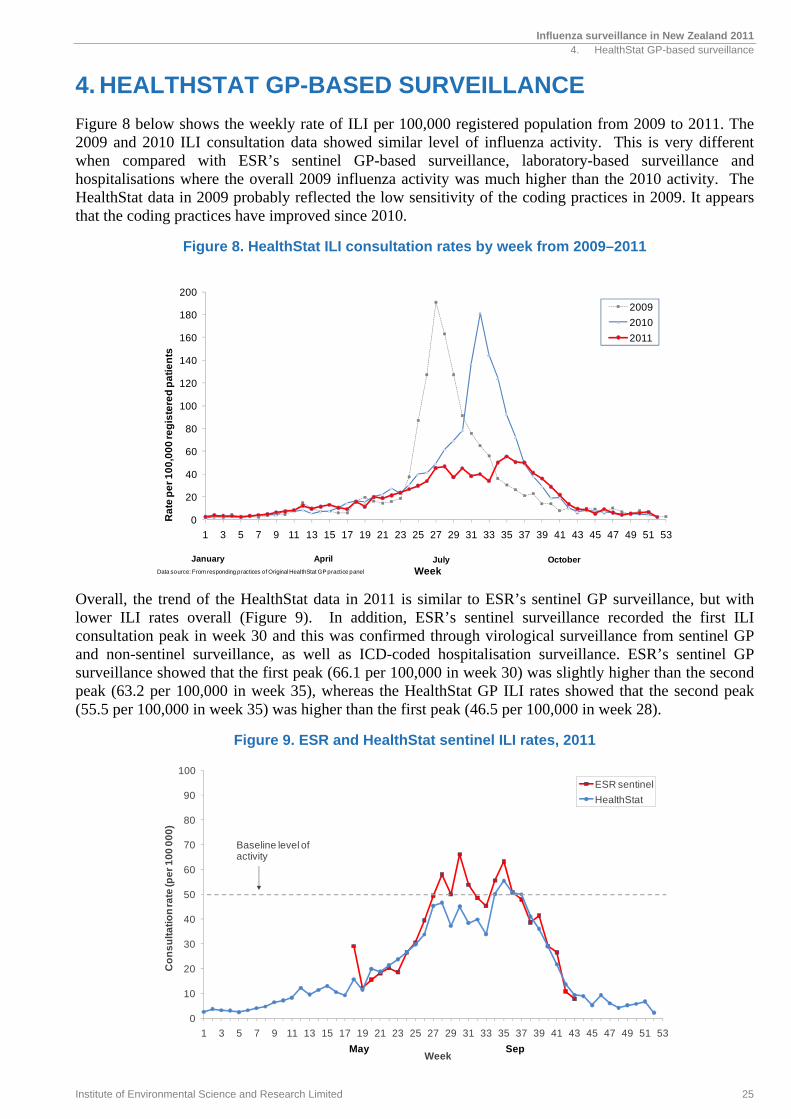
Figure 8 below shows the weekly rate of ILI per 100,000 registered population from 2009 to 2011. The 2009 and 2010 ILI consultation data showed similar level of influenza activity. This is very different when compared with ESR’s sentinel GP-based surveillance, laboratory-based surveillance and hospitalisations where the overall 2009 influenza activity was much higher than the 2010 activity. The HealthStat data in 2009 probably reflected the low sensitivity of the coding practices in 2009. It appears that the coding practices have improved since 2010.
Figure 8. HealthStat ILI consultation rates by week from 2009–2011
Overall, the trend of the HealthStat data in 2011 is similar to ESR’s sentinel GP surveillance, but with lower ILI rates overall (Figure 9). In addition, ESR’s sentinel surveillance recorded the first ILI consultation peak in week 30 and this was confirmed through virological surveillance from sentinel GP and non-sentinel surveillance, as well as ICD-coded hospitalisation surveillance. ESR’s sentinel GP surveillance showed that the first peak (66.1 per 100,000 in week 30) was slightly higher than the second peak (63.2 per 100,000 in week 35), whereas the HealthStat GP ILI rates showed that the second peak (55.5 per 100,000 in week 35) was higher than the first peak (46.5 per 100,000 in week 28).
Figure 9. ESR and HealthStat sentinel ILI rates, 2011
0
20
40
60
80
100
120
140
160
180
200
1 3 5 7 9 11 13 15 17 19 21 23 25 27 29 31 33 35 37 39 41 43 45 47 49 51 53
Ra
te p
er
10
0,0
00
reg
iste
red
pa
tie
nts
Week
2009
2010
2011
January April July OctoberData source: From responding practices of Original HealthStat GP practice panel
0
10
20
30
40
50
60
70
80
90
100
1 3 5 7 9 11 13 15 17 19 21 23 25 27 29 31 33 35 37 39 41 43 45 47 49 51 53
Co
ns
ult
ati
on
rate
(pe
r 1
00
00
0)
Week
ESR sentinel
HealthStat
SepMay
Baseline level of activity


5. MORBIDITY

Influenza surveillance in New Zealand 2011 5. Morbidity
Institute of Environmental Science and Research Limited 29
5. MORBIDITY
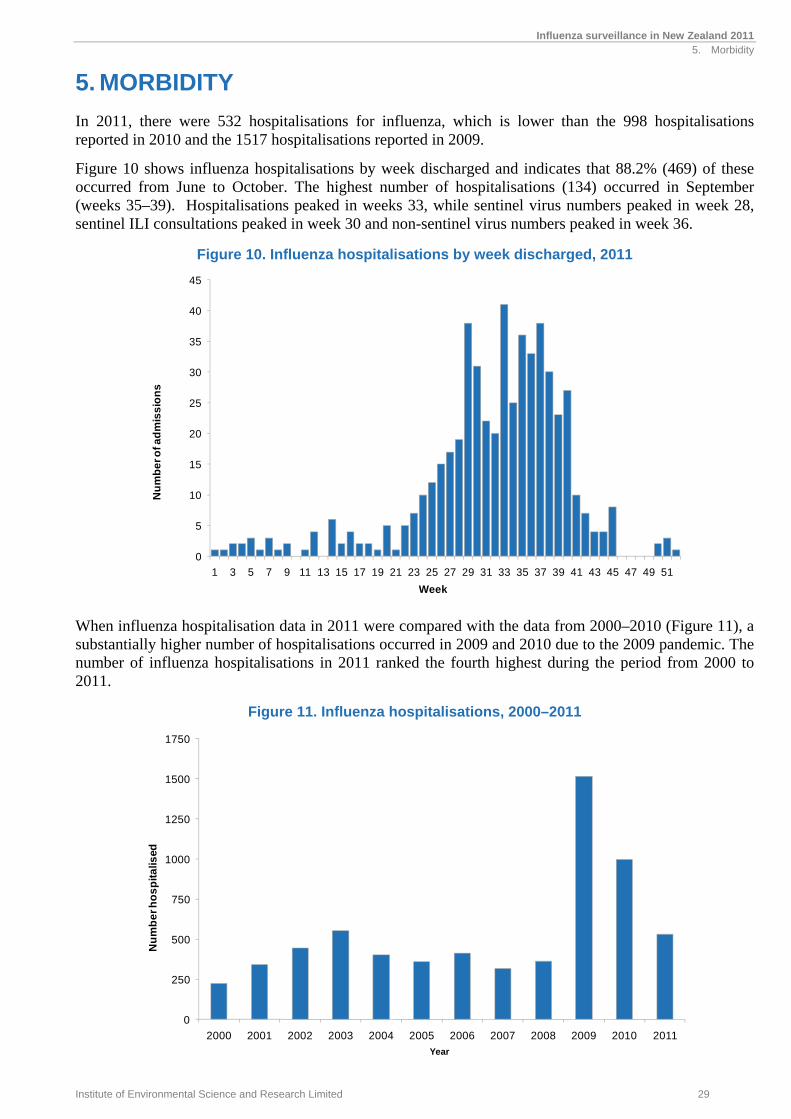
In 2011, there were 532 hospitalisations for influenza, which is lower than the 998 hospitalisations reported in 2010 and the 1517 hospitalisations reported in 2009.
Figure 10 shows influenza hospitalisations by week discharged and indicates that 88.2% (469) of these occurred from June to October. The highest number of hospitalisations (134) occurred in September (weeks 35–39). Hospitalisations peaked in weeks 33, while sentinel virus numbers peaked in week 28, sentinel ILI consultations peaked in week 30 and non-sentinel virus numbers peaked in week 36.
Figure 10. Influenza hospitalisations by week discharged, 2011
When influenza hospitalisation data in 2011 were compared with the data from 2000–2010 (Figure 11), a substantially higher number of hospitalisations occurred in 2009 and 2010 due to the 2009 pandemic. The number of influenza hospitalisations in 2011 ranked the fourth highest during the period from 2000 to 2011.
Figure 11. Influenza hospitalisations, 2000–2011
0
5
10
15
20
25
30
35
40
45
1 3 5 7 9 11 13 15 17 19 21 23 25 27 29 31 33 35 37 39 41 43 45 47 49 51
Nu
mb
er o
f ad
mis
sio
ns
Week
0
250
500
750
1000
1250
1500
1750
2000 2001 2002 2003 2004 2005 2006 2007 2008 2009 2010 2011
Nu
mb
er h
os
pit
alis
ed
Year
Influenza surveillance in New Zealand 2011 5. Morbidity
30 Institute of Environmental Science and Research Limited
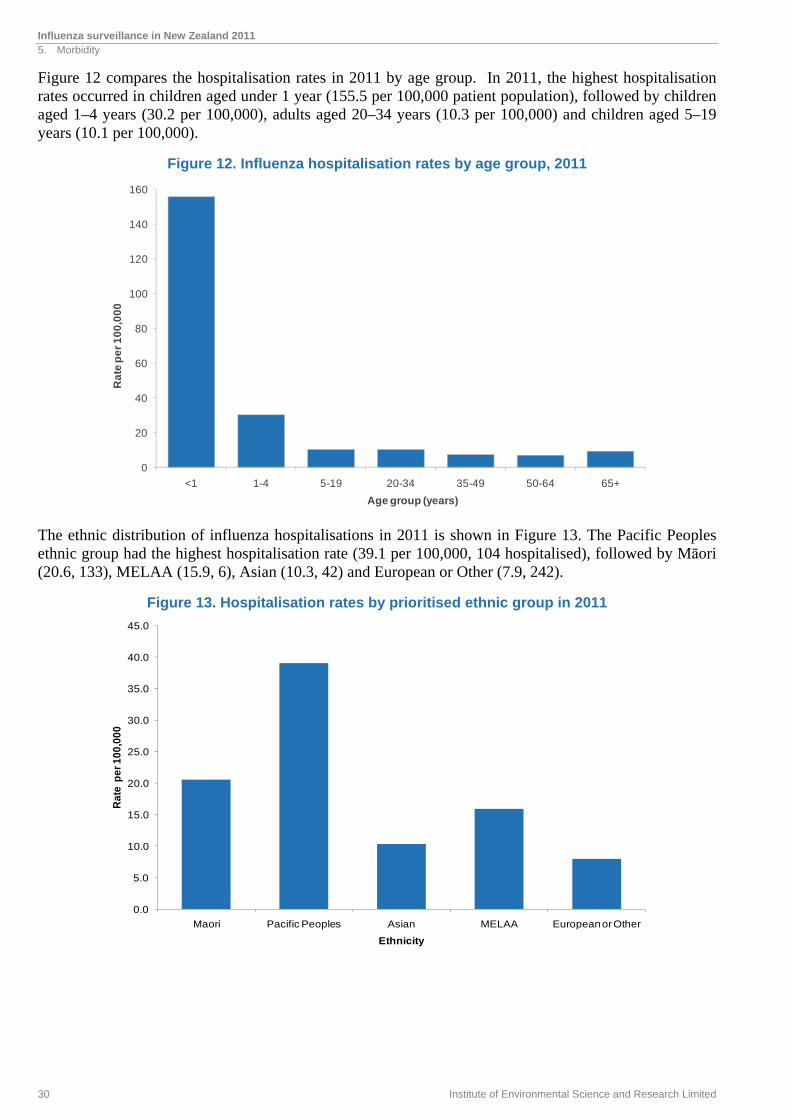
Figure 12 compares the hospitalisation rates in 2011 by age group. In 2011, the highest hospitalisation rates occurred in children aged under 1 year (155.5 per 100,000 patient population), followed by children aged 1–4 years (30.2 per 100,000), adults aged 20–34 years (10.3 per 100,000) and children aged 5–19 years (10.1 per 100,000).
Figure 12. Influenza hospitalisation rates by age group, 2011
The ethnic distribution of influenza hospitalisations in 2011 is shown in Figure 13. The Pacific Peoples ethnic group had the highest hospitalisation rate (39.1 per 100,000, 104 hospitalised), followed by Māori (20.6, 133), MELAA (15.9, 6), Asian (10.3, 42) and European or Other (7.9, 242).
Figure 13. Hospitalisation rates by prioritised ethnic group in 2011
0
20
40
60
80
100
120
140
160
<1 1-4 5-19 20-34 35-49 50-64 65+
Ra
te p
er
10
0,0
00
Age group (years)
0.0
5.0
10.0
15.0
20.0
25.0
30.0
35.0
40.0
45.0
Maori Pacific Peoples Asian MELAA European or Other
Rat
e p
er 1
00,0
00
Ethnicity

6. HEALTHLINE

Influenza surveillance in New Zealand 2011 6. Healthline
Institute of Environmental Science and Research Limited 33
6. HEALTHLINE
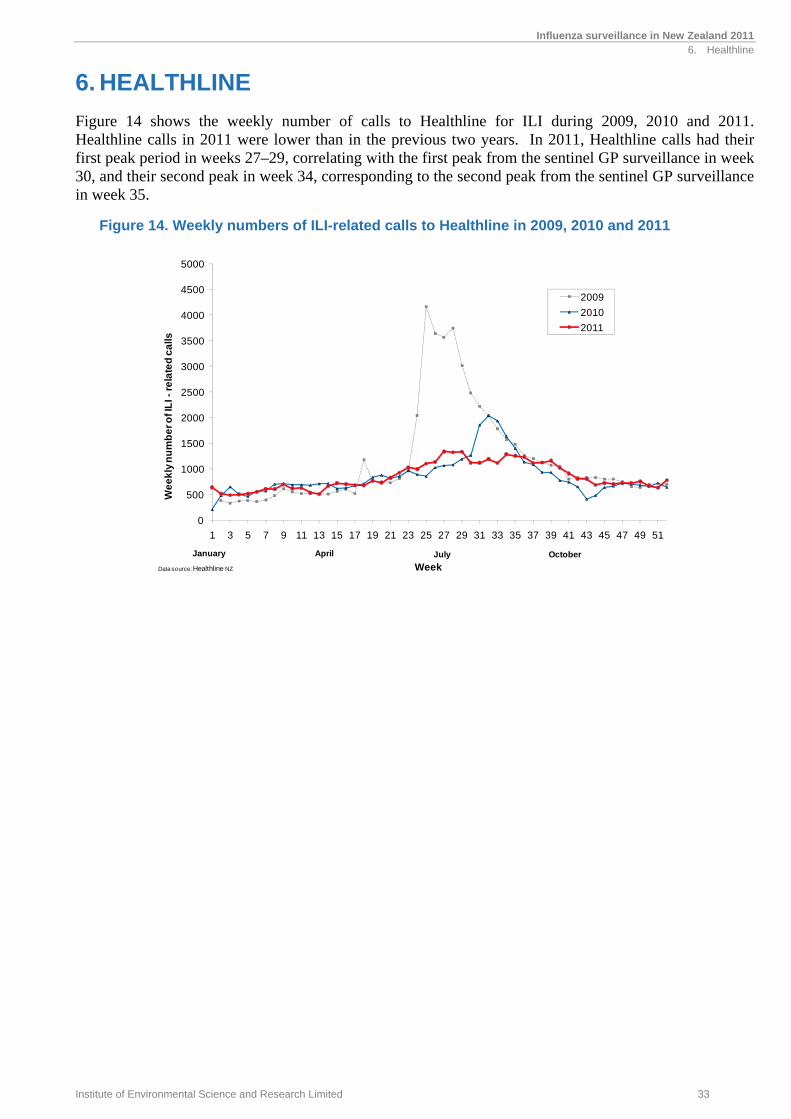
Figure 14 shows the weekly number of calls to Healthline for ILI during 2009, 2010 and 2011. Healthline calls in 2011 were lower than in the previous two years. In 2011, Healthline calls had their first peak period in weeks 27–29, correlating with the first peak from the sentinel GP surveillance in week 30, and their second peak in week 34, corresponding to the second peak from the sentinel GP surveillance in week 35.
Figure 14. Weekly numbers of ILI-related calls to Healthline in 2009, 2010 and 2011
0
500
1000
1500
2000
2500
3000
3500
4000
4500
5000
1 3 5 7 9 11 13 15 17 19 21 23 25 27 29 31 33 35 37 39 41 43 45 47 49 51
We
ek
ly n
um
be
r of I
LI -
rela
ted
ca
lls
Week
2009
2010
2011
January April July October
Data source: Healthline NZ

7. IMMUNISATION COVERAGE

Influenza surveillance in New Zealand 2011 7. Immunisation coverage
Institute of Environmental Science and Research Limited 37
7. IMMUNISATION COVERAGE
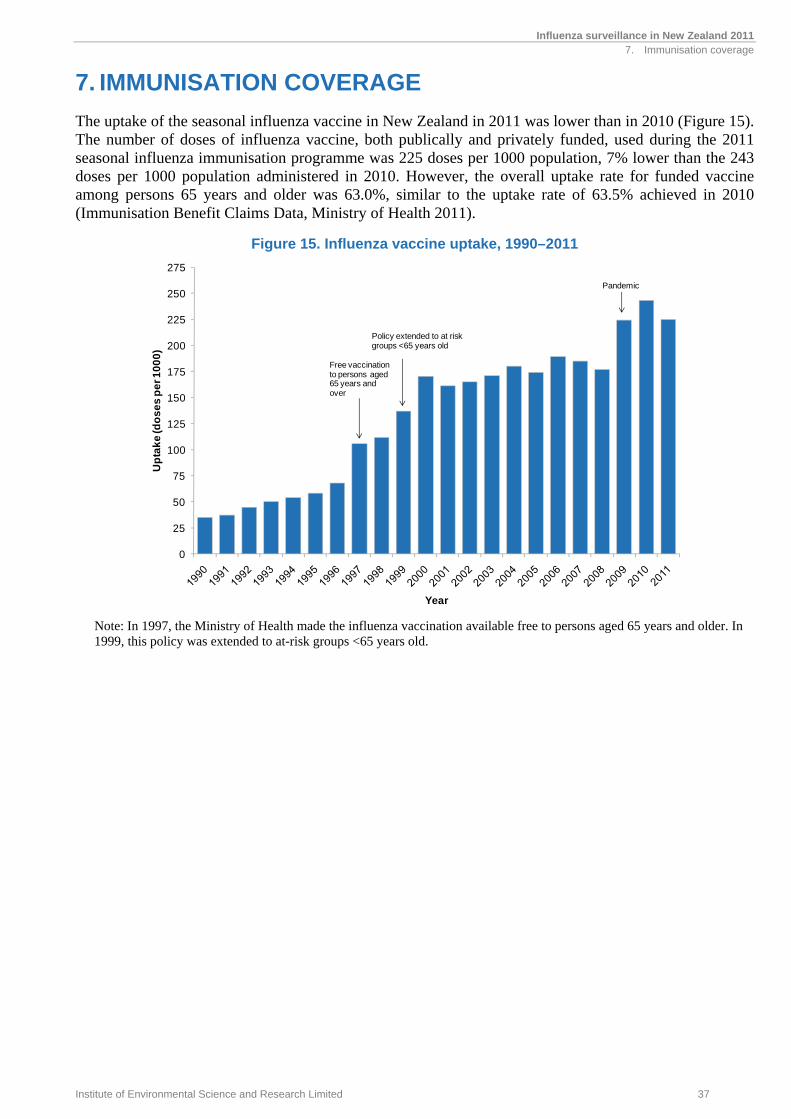
The uptake of the seasonal influenza vaccine in New Zealand in 2011 was lower than in 2010 (Figure 15). The number of doses of influenza vaccine, both publically and privately funded, used during the 2011 seasonal influenza immunisation programme was 225 doses per 1000 population, 7% lower than the 243 doses per 1000 population administered in 2010. However, the overall uptake rate for funded vaccine among persons 65 years and older was 63.0%, similar to the uptake rate of 63.5% achieved in 2010 (Immunisation Benefit Claims Data, Ministry of Health 2011).
Figure 15. Influenza vaccine uptake, 1990–2011
Note: In 1997, the Ministry of Health made the influenza vaccination available free to persons aged 65 years and older. In 1999, this policy was extended to at-risk groups <65 years old.
0
25
50
75
100
125
150
175
200
225
250
275
Up
tak
e (d
os
es
pe
r 10
00
)
Year
Free vaccination to persons aged 65 years and over
Policy extended to at risk groups <65 years old
Pandemic

8. VIRUS STRAIN CHARACTERISATION

Influenza surveillance in New Zealand 2011 8. Virus strain characterisation
Institute of Environmental Science and Research Limited 41
8. VIRUS STRAIN CHARACTERISATION
8.1 Circulating viral strains in 2011
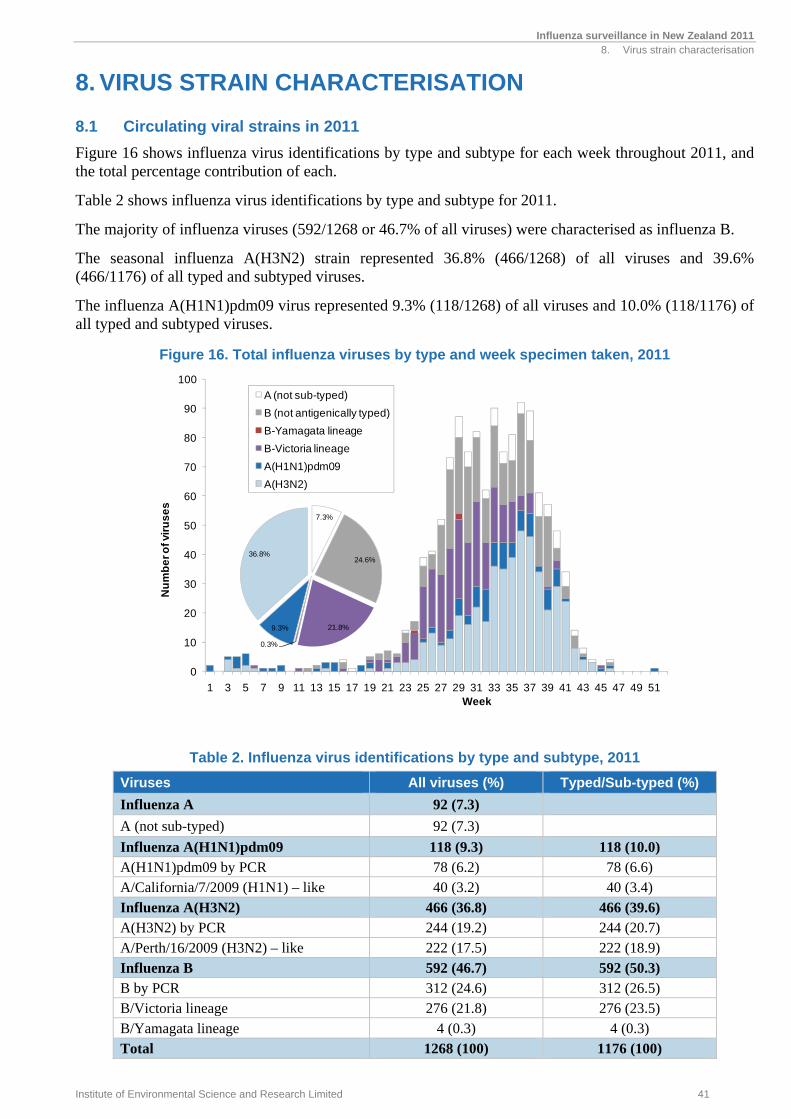
Figure 16 shows influenza virus identifications by type and subtype for each week throughout 2011, and the total percentage contribution of each.
Table 2 shows influenza virus identifications by type and subtype for 2011.
The majority of influenza viruses (592/1268 or 46.7% of all viruses) were characterised as influenza B.
The seasonal influenza A(H3N2) strain represented 36.8% (466/1268) of all viruses and 39.6% (466/1176) of all typed and subtyped viruses.
The influenza A(H1N1)pdm09 virus represented 9.3% (118/1268) of all viruses and 10.0% (118/1176) of all typed and subtyped viruses.
Figure 16. Total influenza viruses by type and week specimen taken, 2011
Table 2. Influenza virus identifications by type and subtype, 2011
Viruses All viruses (%) Typed/Sub-typed (%)
Influenza A 92 (7.3) A (not sub-typed) 92 (7.3) Influenza A(H1N1)pdm09 118 (9.3) 118 (10.0) A(H1N1)pdm09 by PCR 78 (6.2) 78 (6.6) A/California/7/2009 (H1N1) – like 40 (3.2) 40 (3.4) Influenza A(H3N2) 466 (36.8) 466 (39.6) A(H3N2) by PCR 244 (19.2) 244 (20.7) A/Perth/16/2009 (H3N2) – like 222 (17.5) 222 (18.9) Influenza B 592 (46.7) 592 (50.3) B by PCR 312 (24.6) 312 (26.5) B/Victoria lineage 276 (21.8) 276 (23.5) B/Yamagata lineage 4 (0.3) 4 (0.3) Total 1268 (100) 1176 (100)
0
10
20
30
40
50
60
70
80
90
100
1 3 5 7 9 11 13 15 17 19 21 23 25 27 29 31 33 35 37 39 41 43 45 47 49 51
Nu
mb
er o
f vir
us
es
Week
A (not sub-typed)
B (not antigenically typed)
B-Yamagata lineage
B-Victoria lineage
A(H1N1)pdm09
A(H3N2)
7.3%
24.6%
21.8%
0.3%
9.3%
36.8%
Influenza surveillance in New Zealand 2011 8. Virus strain characterisation
42 Institute of Environmental Science and Research Limited
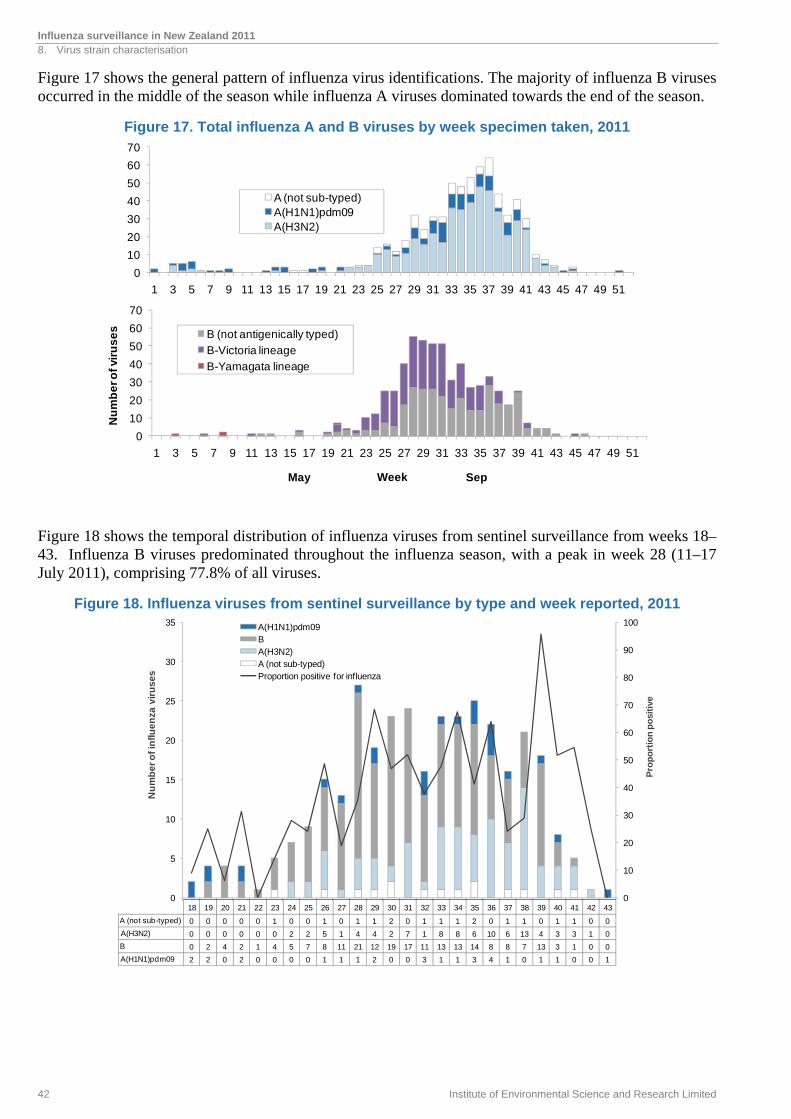
Figure 17 shows the general pattern of influenza virus identifications. The majority of influenza B viruses occurred in the middle of the season while influenza A viruses dominated towards the end of the season.
Figure 17. Total influenza A and B viruses by week specimen taken, 2011
Figure 18 shows the temporal distribution of influenza viruses from sentinel surveillance from weeks 18–43. Influenza B viruses predominated throughout the influenza season, with a peak in week 28 (11–17 July 2011), comprising 77.8% of all viruses.
Figure 18. Influenza viruses from sentinel surveillance by type and week reported, 2011
0
10
20
30
40
50
60
70
1 3 5 7 9 11 13 15 17 19 21 23 25 27 29 31 33 35 37 39 41 43 45 47 49 51
Nu
mb
er o
f vir
us
es
Week
B (not antigenically typed)
B-Victoria lineage
B-Yamagata lineage
0
10
20
30
40
50
60
70
1 3 5 7 9 11 13 15 17 19 21 23 25 27 29 31 33 35 37 39 41 43 45 47 49 51
A (not sub-typed)A(H1N1)pdm09A(H3N2)
May Sep
0
10
20
30
40
50
60
70
80
90
100
0
5
10
15
20
25
30
35
Pro
po
rtio
n p
osi
tive
Nu
mb
er
of
infl
ue
nza
vir
us
es
A(H1N1)pdm09 B A(H3N2)A (not sub-typed)Proportion positive for influenza
18 19 20 21 22 23 24 25 26 27 28 29 30 31 32 33 34 35 36 37 38 39 40 41 42 43
A (not sub-typed) 0 0 0 0 0 1 0 0 1 0 1 1 2 0 1 1 1 2 0 1 1 0 1 1 0 0
A(H3N2) 0 0 0 0 0 0 2 2 5 1 4 4 2 7 1 8 8 6 10 6 13 4 3 3 1 0
B 0 2 4 2 1 4 5 7 8 11 21 12 19 17 11 13 13 14 8 8 7 13 3 1 0 0
A(H1N1)pdm09 2 2 0 2 0 0 0 0 1 1 1 2 0 0 3 1 1 3 4 1 0 1 1 0 0 1
Influenza surveillance in New Zealand 2011 8. Virus strain characterisation
Institute of Environmental Science and Research Limited 43
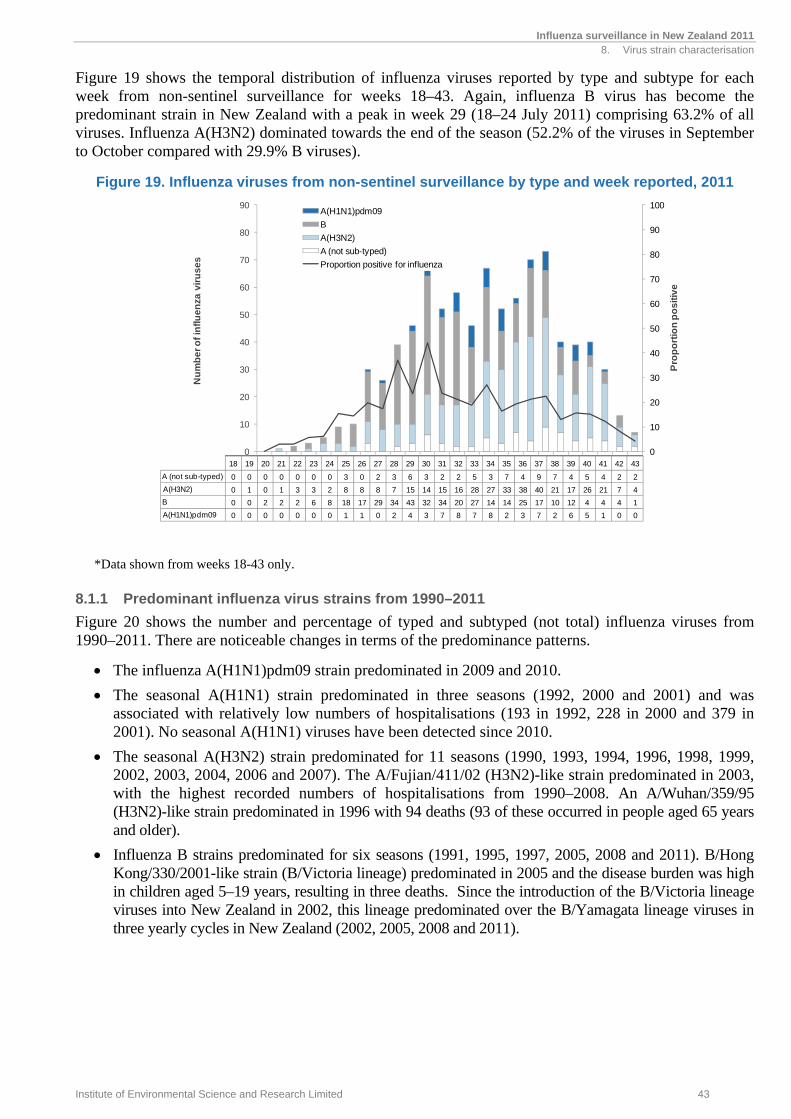
Figure 19 shows the temporal distribution of influenza viruses reported by type and subtype for each week from non-sentinel surveillance for weeks 18–43. Again, influenza B virus has become the predominant strain in New Zealand with a peak in week 29 (18–24 July 2011) comprising 63.2% of all viruses. Influenza A(H3N2) dominated towards the end of the season (52.2% of the viruses in September to October compared with 29.9% B viruses).
Figure 19. Influenza viruses from non-sentinel surveillance by type and week reported, 2011
*Data shown from weeks 18-43 only.
8.1.1 Predominant influenza virus strains from 1990–2011
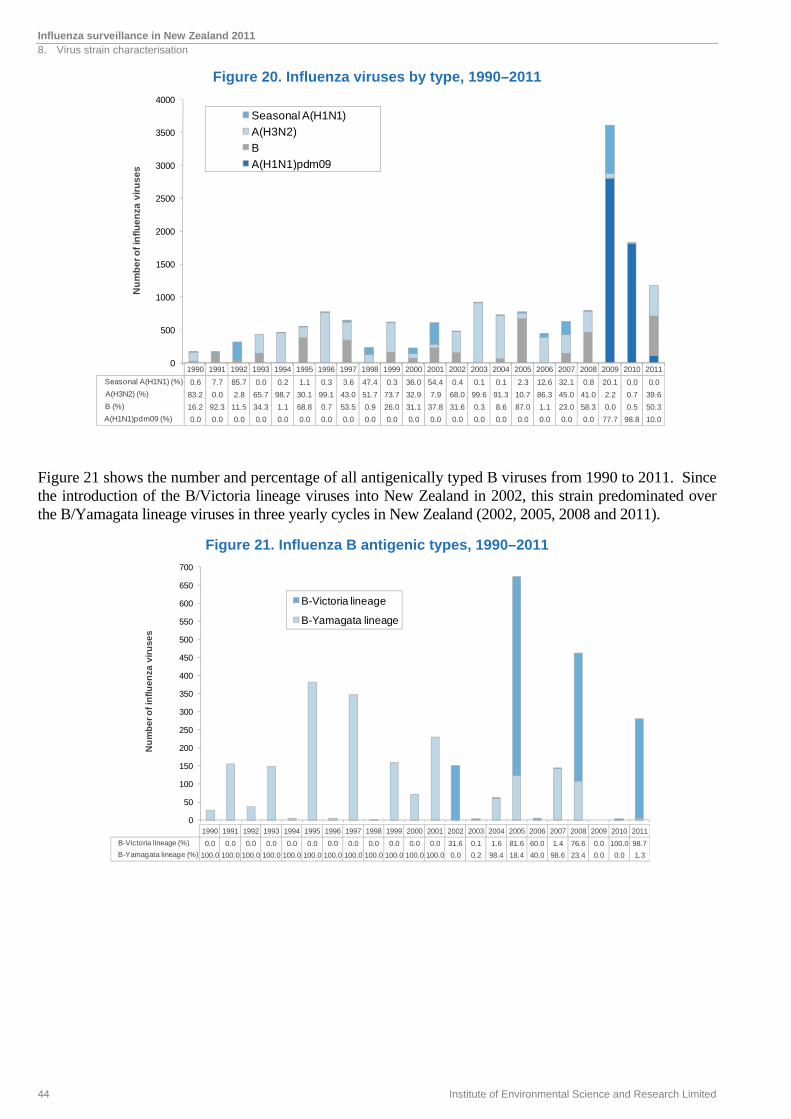
Figure 20 shows the number and percentage of typed and subtyped (not total) influenza viruses from 1990–2011. There are noticeable changes in terms of the predominance patterns.
The influenza A(H1N1)pdm09 strain predominated in 2009 and 2010.
The seasonal A(H1N1) strain predominated in three seasons (1992, 2000 and 2001) and was associated with relatively low numbers of hospitalisations (193 in 1992, 228 in 2000 and 379 in 2001). No seasonal A(H1N1) viruses have been detected since 2010.
The seasonal A(H3N2) strain predominated for 11 seasons (1990, 1993, 1994, 1996, 1998, 1999, 2002, 2003, 2004, 2006 and 2007). The A/Fujian/411/02 (H3N2)-like strain predominated in 2003, with the highest recorded numbers of hospitalisations from 1990–2008. An A/Wuhan/359/95 (H3N2)-like strain predominated in 1996 with 94 deaths (93 of these occurred in people aged 65 years and older).
Influenza B strains predominated for six seasons (1991, 1995, 1997, 2005, 2008 and 2011). B/Hong Kong/330/2001-like strain (B/Victoria lineage) predominated in 2005 and the disease burden was high in children aged 5–19 years, resulting in three deaths. Since the introduction of the B/Victoria lineage viruses into New Zealand in 2002, this lineage predominated over the B/Yamagata lineage viruses in three yearly cycles in New Zealand (2002, 2005, 2008 and 2011).
0
10
20
30
40
50
60
70
80
90
100
0
10
20
30
40
50
60
70
80
90
Pro
po
rtio
n p
os
itiv
e
Nu
mb
er
of
infl
ue
nza
vir
us
es
A(H1N1)pdm09
B
A(H3N2)
A (not sub-typed)
Proportion positive for influenza
18 19 20 21 22 23 24 25 26 27 28 29 30 31 32 33 34 35 36 37 38 39 40 41 42 43
A (not sub-typed) 0 0 0 0 0 0 0 3 0 2 3 6 3 2 2 5 3 7 4 9 7 4 5 4 2 2
A(H3N2) 0 1 0 1 3 3 2 8 8 8 7 15 14 15 16 28 27 33 38 40 21 17 26 21 7 4
B 0 0 2 2 2 6 8 18 17 29 34 43 32 34 20 27 14 14 25 17 10 12 4 4 4 1
A(H1N1)pdm09 0 0 0 0 0 0 0 1 1 0 2 4 3 7 8 7 8 2 3 7 2 6 5 1 0 0
Influenza surveillance in New Zealand 2011 8. Virus strain characterisation
44 Institute of Environmental Science and Research Limited
Figure 20. Influenza viruses by type, 1990–2011
Figure 21 shows the number and percentage of all antigenically typed B viruses from 1990 to 2011. Since the introduction of the B/Victoria lineage viruses into New Zealand in 2002, this strain predominated over the B/Yamagata lineage viruses in three yearly cycles in New Zealand (2002, 2005, 2008 and 2011).
Figure 21. Influenza B antigenic types, 1990–2011
0
500
1000
1500
2000
2500
3000
3500
4000
Nu
mb
er
of
infl
ue
nza
vir
us
es
Seasonal A(H1N1)
A(H3N2)
B
A(H1N1)pdm09
1990 1991 1992 1993 1994 1995 1996 1997 1998 1999 2000 2001 2002 2003 2004 2005 2006 2007 2008 2009 2010 2011
Seasonal A(H1N1) (%) 0.6 7.7 85.7 0.0 0.2 1.1 0.3 3.6 47.4 0.3 36.0 54.4 0.4 0.1 0.1 2.3 12.6 32.1 0.8 20.1 0.0 0.0
A(H3N2) (%) 83.2 0.0 2.8 65.7 98.7 30.1 99.1 43.0 51.7 73.7 32.9 7.9 68.0 99.6 91.3 10.7 86.3 45.0 41.0 2.2 0.7 39.6
B (%) 16.2 92.3 11.5 34.3 1.1 68.8 0.7 53.5 0.9 26.0 31.1 37.8 31.6 0.3 8.6 87.0 1.1 23.0 58.3 0.0 0.5 50.3
A(H1N1)pdm09 (%) 0.0 0.0 0.0 0.0 0.0 0.0 0.0 0.0 0.0 0.0 0.0 0.0 0.0 0.0 0.0 0.0 0.0 0.0 0.0 77.7 98.8 10.0
0
50
100
150
200
250
300
350
400
450
500
550
600
650
700
Nu
mb
er
of
infl
ue
nza
vir
us
es
B-Victoria lineage
B-Yamagata lineage
1990 1991 1992 1993 1994 1995 1996 1997 1998 1999 2000 2001 2002 2003 2004 2005 2006 2007 2008 2009 2010 2011
B-Victoria lineage (%) 0.0 0.0 0.0 0.0 0.0 0.0 0.0 0.0 0.0 0.0 0.0 0.0 31.6 0.1 1.6 81.6 60.0 1.4 76.6 0.0 100.0 98.7
B-Yamagata lineage (%) 100.0 100.0 100.0 100.0 100.0 100.0 100.0 100.0 100.0 100.0 100.0 100.0 0.0 0.2 98.4 18.4 40.0 98.6 23.4 0.0 0.0 1.3
Influenza surveillance in New Zealand 2011 8. Virus strain characterisation
Institute of Environmental Science and Research Limited 45
8.2 Influenza A(H1N1)pdm09
In 2011, forty representative influenza A(H1N1)pdm09 isolates were antigenically subtyped. Some of these isolates were also sent to WHOCC-Melbourne. Results from WHOCC indicate that most of the currently circulating influenza A(H1N1)pdm09 viruses are closely related to the vaccine candidate strain A/California/7/2009 (H1N1) [7].
Genetic analysis at WHOCC-Melbourne of the hemagglutinatin (HA) gene of representative influenza A(H1N1)pdm09 viruses showed that the isolates from New Zealand, as well as isolates from Australia and other countries, exhibited increasing genetic diversity with two major subclades designated as groups 7 and 6 (CDC designation, Appendix A). However, it appears that these genetic changes have not resulted in significant antigenic changes [8]. No H275Y mutations were detected, suggesting they were sensitive to oseltamivir.
8.3 Seasonal A(H1N1)
No seasonal A(H1N1) viruses were detected in 2011.
8.4 Influenza A(H3N2)
In 2011, representative seasonal influenza A(H3N2) isolates (222) were antigenically subtyped at the NIC at ESR using the Haemagglutination Inhibition typing kit supplied by the WHOCC-Melbourne. Some of these isolates were also sent to WHOCC-Melbourne. The results indicated that the New Zealand isolates, as well as isolates from Australia and other countries, were antigenically related to the reference strain A/Perth/16/2009 (H3N2). The results of the genetic analysis of the HA gene of the representative viruses indicated that most of viruses fell into three main groups designated as groups 3, 5 and 6 (CDC designations, Appendix B).
8.5 Influenza B
In 2011, representative seasonal influenza B/Victoria lineage isolates (B/Brisbane/60/2008-like) (276) and B/Yamagata lineage isolates (B/Florida/4/2006-like) (4) were antigenically typed at the NIC at ESR using the HAI typing kit supplied by the WHOCC-Melbourne. Some of these isolates were also sent to WHOCC-Melbourne. The results indicated that the New Zealand isolates, as well as isolates from Australia and other countries, were antigenically related to the reference strains B/Brisbane/60/2008 and B/Florida/4/2006-like viruses. The results of the genetic analysis of the HA gene of the B/Victoria lineage viruses indicated that most of viruses fell into group 1 (CDC designations, Appendix C).
8.6 Oseltamivir resistance monitoring
The NIC at ESR employed a phenotypic method (fluorometric neuraminidase inhibition assay) for the surveillance of anti-viral drug resistance in influenza viruses. In addition, the NIC employed a molecular method (PCR and sequencing) to monitor the H275Y mutation (histidine-to-tyrosine mutation at the codon of 275 in N1 numbering) which confers resistance to oseltamivir.
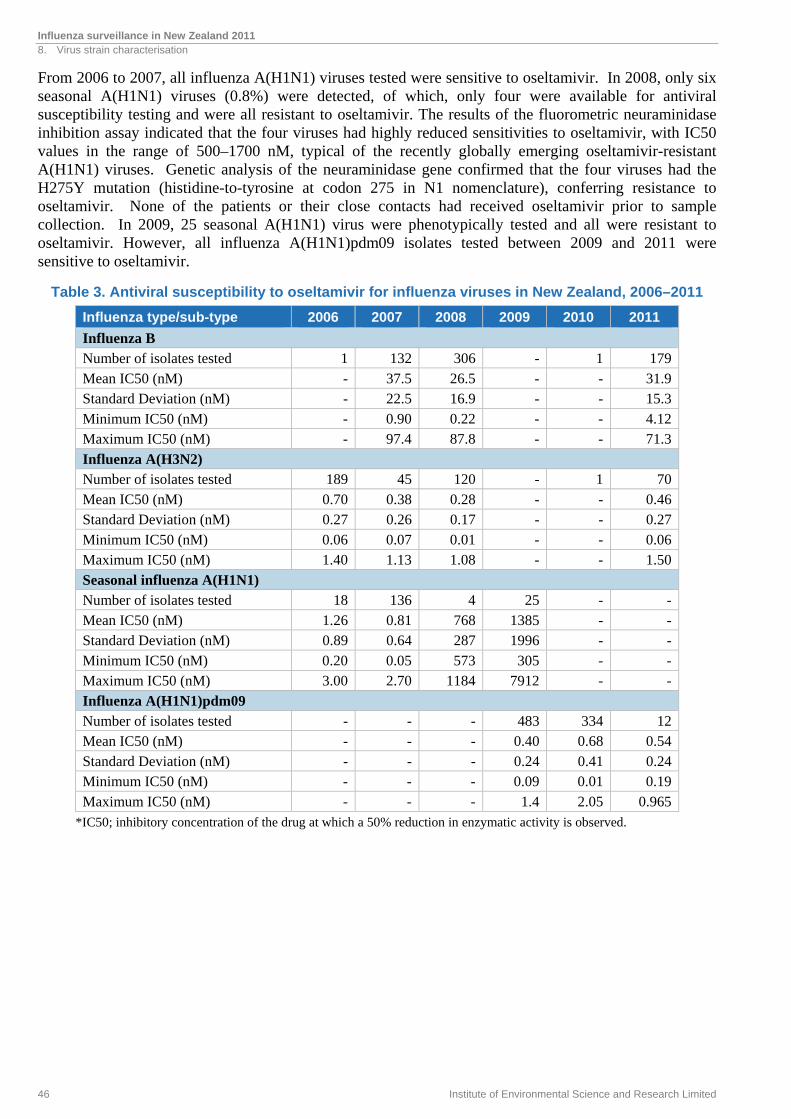
In 2011, the fluorometric neuraminidase inhibition assay tested a total of 261 influenza viruses. All viruses were sensitive to oseltamivir with mean IC50 values for influenza A(H1N1)pdm09 at 0.54 nM, influenza A(H3N2) at 0.46 nM and influenza B at 31.9 nM (Table 3).
Influenza surveillance in New Zealand 2011 8. Virus strain characterisation
46 Institute of Environmental Science and Research Limited
From 2006 to 2007, all influenza A(H1N1) viruses tested were sensitive to oseltamivir. In 2008, only six seasonal A(H1N1) viruses (0.8%) were detected, of which, only four were available for antiviral susceptibility testing and were all resistant to oseltamivir. The results of the fluorometric neuraminidase inhibition assay indicated that the four viruses had highly reduced sensitivities to oseltamivir, with IC50 values in the range of 500–1700 nM, typical of the recently globally emerging oseltamivir-resistant A(H1N1) viruses. Genetic analysis of the neuraminidase gene confirmed that the four viruses had the H275Y mutation (histidine-to-tyrosine at codon 275 in N1 nomenclature), conferring resistance to oseltamivir. None of the patients or their close contacts had received oseltamivir prior to sample collection. In 2009, 25 seasonal A(H1N1) virus were phenotypically tested and all were resistant to oseltamivir. However, all influenza A(H1N1)pdm09 isolates tested between 2009 and 2011 were sensitive to oseltamivir.
Table 3. Antiviral susceptibility to oseltamivir for influenza viruses in New Zealand, 2006–2011
Influenza type/sub-type 2006 2007 2008 2009 2010 2011
Influenza B Number of isolates tested 1 132 306 - 1 179Mean IC50 (nM) - 37.5 26.5 - - 31.9Standard Deviation (nM) - 22.5 16.9 - - 15.3Minimum IC50 (nM) - 0.90 0.22 - - 4.12Maximum IC50 (nM) - 97.4 87.8 - - 71.3
Influenza A(H3N2) Number of isolates tested 189 45 120 - 1 70Mean IC50 (nM) 0.70 0.38 0.28 - - 0.46Standard Deviation (nM) 0.27 0.26 0.17 - - 0.27Minimum IC50 (nM) 0.06 0.07 0.01 - - 0.06Maximum IC50 (nM) 1.40 1.13 1.08 - - 1.50
Seasonal influenza A(H1N1) Number of isolates tested 18 136 4 25 - -Mean IC50 (nM) 1.26 0.81 768 1385 - -Standard Deviation (nM) 0.89 0.64 287 1996 - -Minimum IC50 (nM) 0.20 0.05 573 305 - -Maximum IC50 (nM) 3.00 2.70 1184 7912 - -Influenza A(H1N1)pdm09 Number of isolates tested - - - 483 334 12Mean IC50 (nM) - - - 0.40 0.68 0.54Standard Deviation (nM) - - - 0.24 0.41 0.24Minimum IC50 (nM) - - - 0.09 0.01 0.19Maximum IC50 (nM) - - - 1.4 2.05 0.965
*IC50; inhibitory concentration of the drug at which a 50% reduction in enzymatic activity is observed.
9. SOUTHERN HEMISPHERE VACCINE STRAIN RECOMMENDATIONS

Influenza surveillance in New Zealand 2011 9. Southern hemisphere vaccine strain recommendations
Institute of Environmental Science and Research Limited 49
9. SOUTHERN HEMISPHERE VACCINE STRAIN RECOMMENDATIONS
In October 2011, the Australian Influenza Vaccine Committee (AIVC), with a New Zealand representative, met to decide on the composition of the influenza vaccine for the 2012 winter season for New Zealand, Australia and South Africa. During these discussions, the following trends were noted.
9.1 Influenza A(H1N1)
The epidemiological data from the New Zealand 2011 influenza season and most other southern hemisphere countries indicated that of the influenza A viruses, A(H1N1)pdm09 virus was the predominant circulating strain. The WHOCC-Melbourne has analysed 1161 influenza A(H1N1)pdm09 isolates from 13 countries, including New Zealand, since January 2011. The antigenic data from these isolates indicate that the current circulating influenza A(H1N1)pdm09 viruses are antigenically similar to the vaccine candidate strain A/California/7/2009 (H1N1). Current vaccines containing A/California/7/2009 antigen stimulated anti-HA antibodies of similar geometric mean haemagglutination inhibition (HI) titres to the vaccine virus and recent influenza A(H1N1)pdm09 isolates.
Based on southern hemisphere and global data, the WHO Consultative Group and the AIVC recommended the 2012 vaccines contain a pandemic influenza A/California/7/2009 (H1N1)-like strain as the H1 component.
9.2 Influenza A(H3N2)
Influenza A(H3N2) has been frequently associated with severe disease and excess mortality in high-risk groups. This subtype has also shown the greatest tendency for antigenic drift as illustrated by the frequency of vaccine formulation changes recommended by the WHO and the AIVC.
The WHOCC-Melbourne has analysed 423 A(H3N2) isolates from eight countries since January 2011. Most recent isolates were antigenically closely related to the A/Perth/16/2009-like strain. Current vaccines containing the A/Perth/16/2009 antigen stimulated anti-HA antibodies of similar geometric mean HI titres to the vaccine virus and to recent A(H3N2) isolates. As a result, an A/Perth/16/2009-like strain was recommended by the WHO Consultative Group and the AIVC to be the H3 component of the influenza vaccine for the southern hemisphere for 2012.
9.3 Influenza B
Two distinct lines of influenza B have co-circulated in many countries during recent years. This dates from the late 1980s when the B/Panama/45/90 variant of influenza B was first observed. This strain and its further variants of the B/Yamagata/16/88 lineage (the most recent representative strain being B/Florida/4/2006) spread worldwide, whereas strains of the previous B/Victoria/2/87 lineage viruses continued to circulate in Asia and subsequently underwent independent evolution as an antigenically distinct lineage (the most recent representative strain being B/Brisbane/60/2008). For reasons not wholly understood, these remained geographically restricted to Asia until 2001. In 2002, the B/Victoria-lineage strains spread to the rest of the world.
Influenza surveillance in New Zealand 2011 9. Southern hemisphere vaccine strain recommendations
50 Institute of Environmental Science and Research Limited
Both recent B/Victoria-like strains (B/Brisbane/60/2008 is the current reference strain) and B/Yamagata-like strains (B/Florida/4/2006 is the current reference strain) continued to be isolated worldwide in 2011. Varying proportions of the two lineages were seen in many countries with mainly B/Victoria-like lineage strains circulating in southern hemisphere countries. The majority of isolates were antigenically closely related to the B/Brisbane/60/2008-like strain. Current vaccines containing the B/Brisbane/60/2008 antigen stimulated HA antibodies that were similar in titre to the vaccine virus and to recently isolated B/Brisbane/60/2008-like viruses. Based on the southern hemisphere and global data, the WHO Consultative Group and the AIVC recommended vaccines containing a B/Brisbane/60/2008-like strain to be the B component of the influenza vaccine for the southern hemisphere for 2012.
In summary, the AIVC agreed to adopt the recommendations made by the WHO consultation group as shown next.
The recommended influenza vaccine formulation for New Zealand in 2012 is:
A(H1N1) an A/California/7/2009 (H1N1)-like strain*
A(H3N2) an A/Perth/16/2009 (H3N2)-like strain
B a B/Brisbane/60/2008-like strain
*Note: A/California/7/2009 is an influenza A(H1N1)pdm09 strain

10. DISCUSSION

Influenza surveillance in New Zealand 2011 10. Discussion
Institute of Environmental Science and Research Limited 53
10. DISCUSSION
Sentinel influenza surveillance, as a syndromic surveillance system in New Zealand, is effective in monitoring the burden of disease in the community during an epidemic. It has operated continuously in New Zealand since its establishment in 1991 [3]. Sentinel influenza surveillance is a relatively stable system that monitors year-to-year disease trends in the community. Active syndromic surveillance systems are increasingly being used to detect emerging and re-emerging pathogens [9, 10]. Enhanced influenza surveillance is also a key strategy for improving New Zealand’s preparedness for pandemic influenza [11]. The usefulness of sentinel surveillance during a pandemic was tested in 2009 and the system has been adapted to monitor the early and late stages of a pandemic.
Based on sentinel consultation data, the overall influenza activity in 2011 is described as being at a low level. Comparing data for the past 15 years (from 1997–2010), the weekly consultation rate peak for ILI in 2011 was the second lowest and the cumulative incidence rate peak was the fourth lowest.
It is estimated that ILI resulting in a visit to a GP affected over 41,133 New Zealanders in 2011 or about 0.9% of the population. The number of cases reported through the sentinel network is likely to considerably underestimate the true number, as many people do not consult a GP when they have an ILI.
Consultation rates varied greatly among DHBs. The use of a common case definition for the purposes of surveillance should minimise regional differences in the criteria for influenza diagnosis. However, in DHBs where only a single practice participates or a small number of practices participate, consultation rates are more likely to be subject to variations in individual diagnostic practices. Sentinel practices with small registered populations can also result in much greater fluctuations in ILI consultation rates.
The age distribution of influenza hospitalisations and GP consultations in 2011 was broadly similar to previous years, with the highest rates in children under the age of 5 years. This probably reflects features of this age group – a higher proportion of immunologically naïve people or a higher proportion of the population that is more susceptible to influenza infections compared with other age groups. School age children (aged 5–19 years) had the second highest GP consultation rate. This probably reflects the nature of influenza B infection in that it has greater antigenic stability than influenza A. This means that adults may maintain some immunity due to past exposure to influenza B, while children may not have had any such exposure and be more susceptible to infection. This could be particularly true for the B/Victoria lineage virus since it disappeared from New Zealand after the late 1980s and then re-emerged in 2002. The B/Victoria lineage has shown a distinct pattern of circulation in New Zealand where it predominated over the B/Yamagata lineage virus every three years in 2002, 2005, 2008 and 2011. In addition, influenza B produces attack rates that are notably higher among children compared with adults [12]. These factors may explain why children (people aged 1–19 years) had a high percentage of influenza consultations and isolations in 2011.
The distribution of influenza hospitalisations among ethnic groups in 2011 showed that the rates for Pacific Peoples and Māori populations remained higher than those for MELAA, Asian and European or Other ethnic groups. The differences in the distribution of the disease among ethnic groups may reflect immunity from a combination of sources, including immunisation and natural infection. Reasons for ethnic differences in hospitalisation rates may include a higher incidence of infection among Pacific and Māori people, a higher prevalence of co-morbidities (such as asthma and diabetes), unfavourable environmental factors (such as household crowding and poor quality housing), behavioural differences in responding to influenza, differences in socio-cultural-economic status, differences in health service utilisation and increased genetic susceptibility [13]. Further studies on the contributing factors to ethnic differences in the risk of contracting severe influenza are needed in New Zealand.
Influenza surveillance in New Zealand 2011 10. Discussion
54 Institute of Environmental Science and Research Limited
One of the strengths of the ILI sentinel surveillance system in New Zealand is the combination of disease surveillance with virus strain surveillance (virological identification). A definitive diagnosis of influenza requires laboratory confirmation, because clinical diagnosis on the basis of clinical symptoms is not highly specific. In fact, sentinel surveillance is the only syndromic surveillance system that obtains good quality respiratory swabs for verification of clinical diagnosis. Consequently, an important part of the sentinel system is for GPs to take nasopharyngeal and/or throat swabs from patients presenting with an ILI. During sentinel surveillance from May to October 2011, four virology laboratories tested 858 respiratory specimens for influenza viruses and 336 (39.2%) specimens were positive. However, the influenza isolation rate varied among the different DHBs. Some DHBs had an influenza virus isolation rate that was lower than the national average of 39.2%. Many factors contribute to low isolation rates, including sampling techniques. Sampling of the respiratory tract for clinical viral isolation should maximise the harvest of virally-infected columnar epithelial cells. Ideally, nasopharyngeal washes or aspirates are the best specimens as they contain a higher cellular content than nasopharyngeal swabs [14]. By comparison, throat swabs or throat washings are of limited use in the diagnosis of influenza because the majority of cells captured by this technique are squamous epithelial cells. However, a combined nose (ie, nasopharyngeal) and throat swab can be a useful specimen for influenza virus isolation and it is selected for influenza surveillance because of its convenience. It is recommended that nasopharyngeal swabs should be cotton-, rayon- or dacron-tipped, plastic-coated swabs. The swab should be inserted deeply into the nasopharynx, rotated vigorously to collect columnar epithelia cells, removed, placed into viral transport medium, chilled and couriered to the virology laboratory without delay.
Since 2001, the four virology laboratories have been using the ESR-designed electronic influenza virus input form for data entry. This process requires the retrieval of the necessary demographic data from the hospital information system and re-keying this information onto the ESR virus input form. This is a time-consuming process and it inevitably creates data entry errors. Timely reporting for the virology weekly report was one of the biggest challenges during the pandemic response. Advances in information transfer using electronic systems such as Healthlink would greatly streamline this process.
The global emergence and rapid spread of oseltamivir-resistant influenza A(H1N1) viruses carrying an NA gene with an H274Y (histidine to tyrosine mutation at the codon of 274 by N2 numbering) amino acid substitution has been observed in New Zealand since January 2008. All seasonal influenza A(H1N1) viruses (25) tested in 2009 were resistant to oseltamivir. In contrast, all influenza A(H1N1)pdm09 viruses tested in 2009, 2010 and 2011 were sensitive to oseltamivir. Oseltamivir-resistant viruses pose challenges for the selection of antiviral medications for the treatment and chemoprophylaxis of influenza. They also pose potential risks in terms of the generation of new variants of the influenza A(H1N1)pdm09 virus that carry the oseltamivir-resistant gene via co-infection and reassortment. It has become increasingly important to establish and sustain a national antiviral monitoring programme in New Zealand that provides timely surveillance information to assist clinicians in choosing appropriate antiviral agents for their patients, and assist public health officials making evidence-based decisions on stockpiling of antiviral agents and their usage during a pandemic or epidemic. Timely surveillance information also provides compelling reasons for clinicians to test patients for influenza virus infection to select appropriate antiviral medications.
Virological surveillance for outpatients and hospital inpatients (also referred to as non-sentinel surveillance) complements sentinel surveillance. Non-sentinel surveillance provides useful information on the characterisation of circulating influenza viruses and monitors the emergence of novel strains with pandemic potential. However, current non-sentinel surveillance does not provide robust epidemiologic data with good denominator information. The recent emergence of the influenza A(H1N1)pdm09 virus highlights the need for surveillance to better define people most at risk for severe acute respiratory illness (SARI) resulting from influenza [15]. Expansion of the existing non-sentinel surveillance to include the systematic collection of epidemiological data on hospitalised SARI cases would enable the factors that place the most vulnerable people at risk to be described and targeted intervention to be facilitated. This would also establish a platform for respiratory disease surveillance for other respiratory pathogens. It would be beneficial to evaluate the current status of non-sentinel surveillance in New Zealand and consider an expansion of the system to establish SARI surveillance for hospital inpatients.
Influenza surveillance in New Zealand 2011 10. Discussion
Institute of Environmental Science and Research Limited 55
In October 2011, the CDC in the United States commissioned ESR to conduct a five-year study on influenza in the southern hemisphere and vaccine effectiveness. This study has been referred as SHIVERS (Southern Hemisphere Influenza and Vaccine Effectiveness Research and Surveillance). It is a multi-disciplinary and multi-centre collaboration among ESR, Auckland and Counties Manukau DHBs, Universities of Otago and Auckland, WHOCC at St Jude Children Hospital in Memphis and CDC in Atlanta. The SHIVERS project will establish SARI surveillance in Auckland and Counties Manukau DHBs and enhanced ILI surveillance in Auckland and Counties Manukau districts. This study will be used as a pilot project to explore the feasibility of establishing a national hospitalised SARI surveillance and comprehensive community ILI surveillance in the future.
As the impact of influenza on people and health systems can be reduced by annual immunisation, the information on influenza vaccination coverage is particularly important in raising awareness of the disease amongst health professionals and the public, and for planning the vaccine’s formulation and delivery. The National Influenza Immunisation Strategy Group was established in 2000 with the purpose of improving coverage through public and healthcare provider education. A national approach to promotion, coupled with local initiatives, is key to lifting vaccination coverage to 65% amongst those at greatest risk, including people aged 65 years and older.
Influenza vaccines are recommended for people at risk of developing complications following infection because of their age or because of underlying chronic conditions, and are available free each year [16]. In 1997, New Zealand introduced a programme of free influenza vaccinations to all New Zealanders aged 65 years and older, and set a target of 75% coverage for the year 2000. In 1999, the free vaccination programme was extended to include those under 65 years with certain chronic medical conditions [16, 17]. Quality coverage data are essential for the further development of this programme while continuing surveillance ensures the provision of effective vaccines to reduce the burden of influenza in New Zealand. In addition, to assess the effectiveness of influenza vaccines, it is crucial that influenza vaccinees for all ages be included on the national immunisation register.


REFERENCES

Influenza surveillance in New Zealand 2011 References
Institute of Environmental Science and Research Limited 59
REFERENCES
1. Report of the WHO/GEIG Informal Consultation on the Standardization and Improvement of Influenza Surveillance, Monaco. 1991.
2. Huang, Q.S., Lopez, L.D., McCallum, L., Adlam B., Influenza surveillance and immunisation in New Zealand, 1997-2006. Influenza and Other Respiratory Viruses, 2008. 2(4): p. 139-145.
3. Dedman DJ, et al., Influenza surveillance in England and Wales: October 1996 to June 1997. CDR Rev 1997. 13: p. R212-219.
4. Jennings L, et al., Influenza surveillance and immunisation in New Zealand, 1990-1999. NZPHR, 2001. 8: p. 9-12.
5. Ministry of Health, Influenza vaccine. [Circular letter] to health professionals. 1996. 6. Jennings LC and Baker S. Government policy change in 1997 was essential for the
implementation of an influenza vaccination strategy for New Zealand, ed. Osterhaus ADME, et al, and editors. 2001: Elsevier.
7. Huang, Q. Recommendation for seasonal influenza vaccine composition for New Zealand 2011. A report for the Ministry of Health (Client report FW10088) 2010 [cited 2011 1 Febuary]; Available from: http://www.surv.esr.cri.nz/PDF_surveillance/Virology/FluVac/FluVac2011.pdf.
8. Barr IG, C.L., Komadina N, Lee RT, Lin RT, Deng Y, Caldwell N, Shaw R, Maurer-Stroh S. , A new pandemic influenza A(H1N1) genetic variant predominated in the winter 2010 influenza season in Australia, New Zealand and Singapore. . Euro Surveill. , 2010. 15(42):pii=19692. Available online: http://www.eurosurveillance.org/ViewArticle.aspx?ArticleId=19692
9. Rana A, et al., Surveillance for unexplained deaths and critical illnesses due to possibly infectious causes, United States, 1995–1998. EID, 2002. 8: p. 145-153.
10. Outbreaks of avian influenza A (H5N1) in Asia and interim recommendations for evaluation and reporting of suspected cases—United States, 2004. MMWR, 2004. 53: p. 97-100.
11. WHO. Influenza Pandemic Preparedness Plan: The role of WHO and guidelines for national and regional planning. WHO/CDS/CSR/EDC/99.1. in Geneva: WHO, April 1999.
12. Baine, W.B., Luby, JP and Martin, SM Severe illness with influenza B. American Journal of Medicine 1980. 68: p. 181-189.
13. La Ruche, G., et al., The 2009 pandemic H1N1 influenza and indigenous populations of the Americas and the Pacific. Euro Surveill, 2009. 14(42).
14. Monte AS and Kioumehr F, The Tecumseh study of respiratory illness. IX Occurrence of influenza in the community. AMJE, 1975. 102: p. 553-563.
15. WHO-Europe. WHO Regional Office for Europe guidance for influenza surveillance in humans. 2009 [cited 2011 16 March ]; Available from: http://www.euro.who.int/__data/assets/pdf_file/0020/90443/E92738.pdf.
16. Centers for Disease Control, Update: influenza-associated deaths reported among children aged <18 years - United States, 2003-4 influenza season. MMWR, 2003. 52: p. 1286-1288.
17. Zambon M, Textbook of Influenza. Laboratory Diagnosis of Influenza, ed. W.R. Nicholson KG, Hay AJ, eds. 1998: London: Blackwell Science Ltd.


APPENDIX

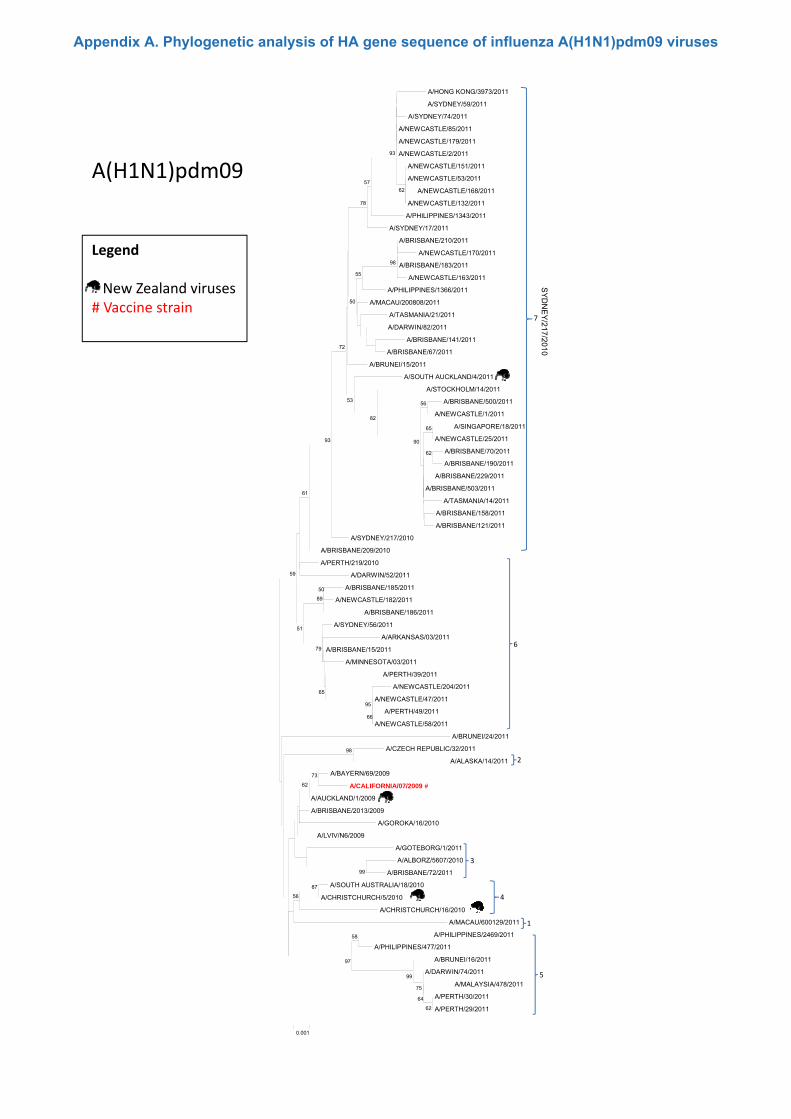
A(H1N1)pdm09
A/HONG KONG/3973/2011
A/SYDNEY/59/2011
A/SYDNEY/74/2011
A/NEWCASTLE/85/2011
A/NEWCASTLE/179/2011
A/NEWCASTLE/2/2011
A/NEWCASTLE/151/2011
A/NEWCASTLE/53/2011
A/NEWCASTLE/168/2011
A/NEWCASTLE/132/2011
A/PHILIPPINES/1343/2011
62
93
57
78
Legend
New Zealand viruses# Vaccine strain
A/PHILIPPINES/1343/2011
A/SYDNEY/17/2011
A/BRISBANE/210/2011
A/NEWCASTLE/170/2011
A/BRISBANE/183/2011
A/NEWCASTLE/163/2011
A/PHILIPPINES/1366/2011
A/MACAU/200808/2011
A/TASMANIA/21/2011
A/DARWIN/82/2011
A/BRISBANE/141/2011
A/BRISBANE/67/2011
98
55
50
72
7
SYD
NE
Y/217/2010A/BRISBANE/67/2011
A/BRUNEI/15/2011
A/SOUTH AUCKLAND/4/2011
A/STOCKHOLM/14/2011
A/BRISBANE/500/2011
A/NEWCASTLE/1/2011
A/SINGAPORE/18/2011
A/NEWCASTLE/25/2011
A/BRISBANE/70/2011
A/BRISBANE/190/2011
A/BRISBANE/229/2011
A/BRISBANE/503/2011
65
62
56
90
82
53
93
0
A/BRISBANE/503/2011
A/TASMANIA/14/2011
A/BRISBANE/158/2011
A/BRISBANE/121/2011
A/SYDNEY/217/2010
A/BRISBANE/209/2010
A/PERTH/219/2010
A/DARWIN/52/2011
A/BRISBANE/185/2011
A/NEWCASTLE/182/2011
A/BRISBANE/186/2011
A/SYDNEY/56/2011
50
89
61
59
51
A/ARKANSAS/03/2011
A/BRISBANE/15/2011
A/MINNESOTA/03/2011
A/PERTH/39/2011
A/NEWCASTLE/204/2011
A/NEWCASTLE/47/2011
A/PERTH/49/2011
A/NEWCASTLE/58/2011
A/BRUNEI/24/2011
A/CZECH REPUBLIC/32/2011
A/ALASKA/14/2011
98
51
79
65
95
66
2
6
A/BAYERN/69/2009
A/CALIFORNIA/07/2009 #
A/AUCKLAND/1/2009
A/BRISBANE/2013/2009
A/GOROKA/16/2010
A/LVIV/N6/2009
A/GOTEBORG/1/2011
A/ALBORZ/5607/2010
A/BRISBANE/72/2011
A/SOUTH AUSTRALIA/18/2010
A/CHRISTCHURCH/5/2010
99
87
73
62
56
3
4
0.001
A/CHRISTCHURCH/16/2010
A/MACAU/600129/2011
A/PHILIPPINES/2469/2011
A/PHILIPPINES/477/2011
A/BRUNEI/16/2011
A/DARWIN/74/2011
A/MALAYSIA/478/2011
A/PERTH/30/2011
A/PERTH/29/201162
64
75
99
58
97
1
5
Appendix A. Phylogenetic analysis of HA gene sequence of influenza A(H1N1)pdm09 viruses
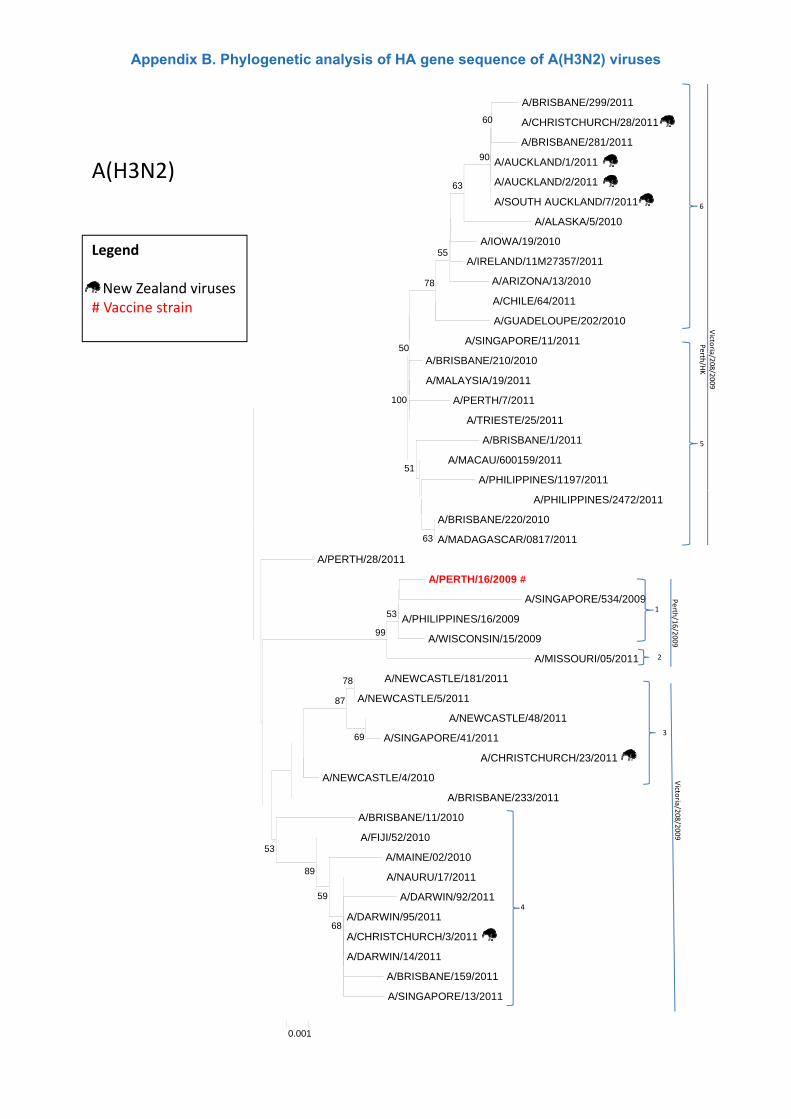
A(H3N2)
A/BRISBANE/299/2011
A/CHRISTCHURCH/28/2011
A/BRISBANE/281/2011
A/AUCKLAND/1/2011
A/AUCKLAND/2/2011
A/SOUTH AUCKLAND/7/2011
60
90
63
6
Legend
New Zealand viruses# Vaccine strain
A/ALASKA/5/2010
A/IOWA/19/2010
A/IRELAND/11M27357/2011
A/ARIZONA/13/2010
A/CHILE/64/2011
A/GUADELOUPE/202/2010
A/SINGAPORE/11/2011
55
78
50
Victo
riaPer
A/BRISBANE/210/2010
A/MALAYSIA/19/2011
A/PERTH/7/2011
A/TRIESTE/25/2011
A/BRISBANE/1/2011
A/MACAU/600159/2011
A/PHILIPPINES/1197/201151
100
5
a/208/2009
rth/HK
A/PHILIPPINES/2472/2011
A/BRISBANE/220/2010
A/MADAGASCAR/0817/2011
A/PERTH/28/2011
A/PERTH/16/2009 #
A/SINGAPORE/534/2009
A/PHILIPPINES/16/2009
63
531
Perth
/16
A/WISCONSIN/15/2009
A/MISSOURI/05/2011
A/NEWCASTLE/181/2011
A/NEWCASTLE/5/2011
A/NEWCASTLE/48/2011
A/SINGAPORE/41/2011
A/CHRISTCHURCH/23/2011
78
69
87
99
3
2
6/2009
A/NEWCASTLE/4/2010
A/BRISBANE/233/2011
A/BRISBANE/11/2010
A/FIJI/52/2010
A/MAINE/02/2010
A/NAURU/17/2011
A/DARWIN/92/201159
89
53
Victo
ria/208/2009
A/DARWIN/95/2011
A/CHRISTCHURCH/3/2011
A/DARWIN/14/2011
A/BRISBANE/159/2011
A/SINGAPORE/13/2011
68
0.001
4
Appendix B. Phylogenetic analysis of HA gene sequence of A(H3N2) viruses
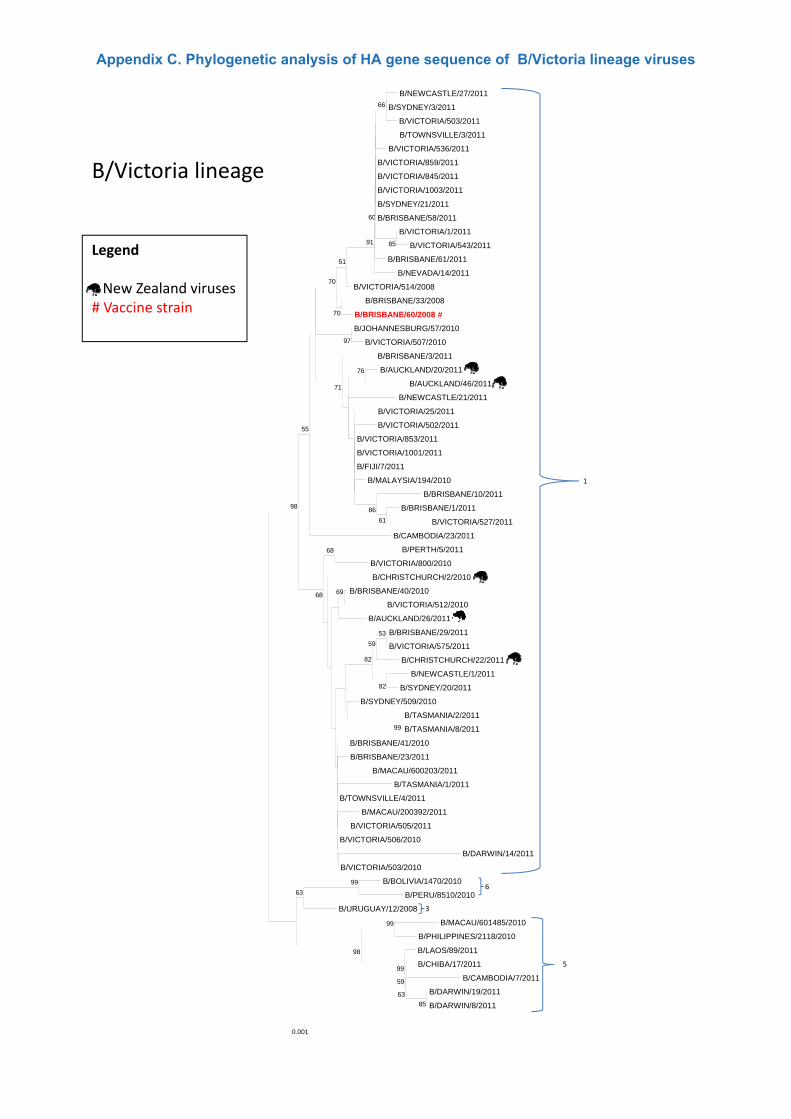
B/Victoria lineage
B/NEWCASTLE/27/2011
B/SYDNEY/3/2011
B/VICTORIA/503/2011
B/TOWNSVILLE/3/2011
B/VICTORIA/536/2011
B/VICTORIA/859/2011
B/VICTORIA/845/2011
B/VICTORIA/1003/2011
B/SYDNEY/21/2011
B/BRISBANE/58/2011
66
60
Legend
New Zealand viruses# Vaccine strain
B/BRISBANE/58/2011
B/VICTORIA/1/2011
B/VICTORIA/543/2011
B/BRISBANE/61/2011
B/NEVADA/14/2011
B/VICTORIA/514/2008
B/BRISBANE/33/2008
B/BRISBANE/60/2008 #
B/JOHANNESBURG/57/2010
B/VICTORIA/507/2010
B/BRISBANE/3/2011
97
70
70
51
8591
60
B/BRISBANE/3/2011
B/AUCKLAND/20/2011
B/AUCKLAND/46/2011
B/NEWCASTLE/21/2011
B/VICTORIA/25/2011
B/VICTORIA/502/2011
B/VICTORIA/853/2011
B/VICTORIA/1001/2011
B/FIJI/7/2011
B/MALAYSIA/194/2010
76
71
55
1
B/BRISBANE/10/2011
B/BRISBANE/1/2011
B/VICTORIA/527/2011
B/CAMBODIA/23/2011
B/PERTH/5/2011
B/VICTORIA/800/2010
B/CHRISTCHURCH/2/2010
B/BRISBANE/40/2010
B/VICTORIA/512/2010
B/AUCKLAND/26/2011
61
86
69
68
68
98
B/BRISBANE/29/2011
B/VICTORIA/575/2011
B/CHRISTCHURCH/22/2011
B/NEWCASTLE/1/2011
B/SYDNEY/20/2011
B/SYDNEY/509/2010
B/TASMANIA/2/2011
B/TASMANIA/8/2011
B/BRISBANE/41/2010
B/BRISBANE/23/2011
99
82
53
59
82
B/MACAU/600203/2011
B/TASMANIA/1/2011
B/TOWNSVILLE/4/2011
B/MACAU/200392/2011
B/VICTORIA/505/2011
B/VICTORIA/506/2010
B/DARWIN/14/2011
B/VICTORIA/503/2010
B/BOLIVIA/1470/2010
B/PERU/8510/2010
99
636
B/URUGUAY/12/2008
B/MACAU/601485/2010
B/PHILIPPINES/2118/2010
B/LAOS/89/2011
B/CHIBA/17/2011
B/CAMBODIA/7/2011
B/DARWIN/19/2011
B/DARWIN/8/201185
63
59
99
99
98
0.001
5
3
Appendix C. Phylogenetic analysis of HA gene sequence of B/Victoria lineage viruses