Embed Size (px)
Citation preview
SHPN: (HP NSW) 190001 Page | 1 Back to top
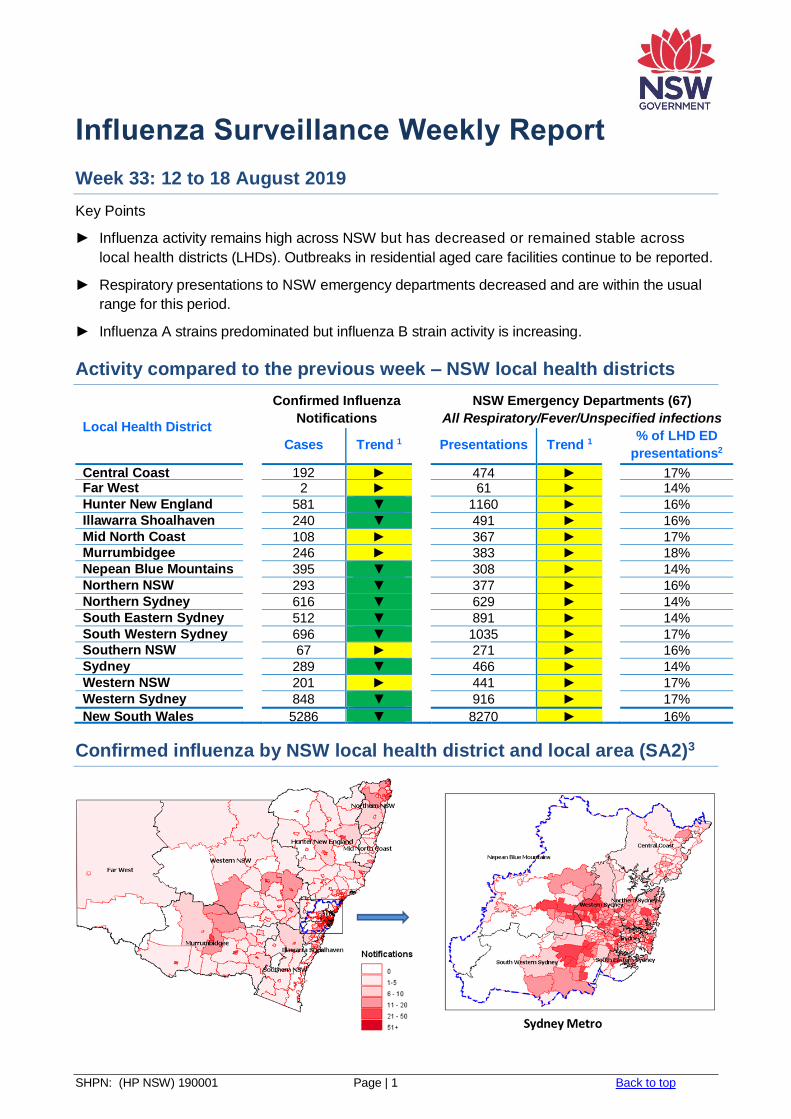
Influenza Surveillance Weekly Report
Week 33: 12 to 18 August 2019
Key Points
► Influenza activity remains high across NSW but has decreased or remained stable across
local health districts (LHDs). Outbreaks in residential aged care facilities continue to be reported.
► Respiratory presentations to NSW emergency departments decreased and are within the usual
range for this period.
► Influenza A strains predominated but influenza B strain activity is increasing.
Activity compared to the previous week – NSW local health districts
Local Health District
Confirmed Influenza
Notifications
NSW Emergency Departments (67)
All Respiratory/Fever/Unspecified infections
Cases Trend 1 Presentations Trend 1
% of LHD ED
presentations2
Central Coast 192 ► 474 ► 17%
Far West 2 ► 61 ► 14%
Hunter New England 581 ▼ 1160 ► 16%
Illawarra Shoalhaven 240 ▼ 491 ► 16%
Mid North Coast 108 ► 367 ► 17% Murrumbidgee 246 ► 383 ► 18%
Nepean Blue Mountains 395 ▼ 308 ► 14%
Northern NSW 293 ▼ 377 ► 16%
Northern Sydney 616 ▼ 629 ► 14%
South Eastern Sydney 512 ▼ 891 ► 14%
South Western Sydney 696 ▼ 1035 ► 17% Southern NSW 67 ► 271 ► 16%
Sydney 289 ▼ 466 ► 14%
Western NSW 201 ► 441 ► 17%
Western Sydney 848 ▼ 916 ► 17%
New South Wales 5286 ▼ 8270 ► 16%
Confirmed influenza by NSW local health district and local area (SA2)3
SHPN: (HP NSW) 190001 Page | 2 Back to top
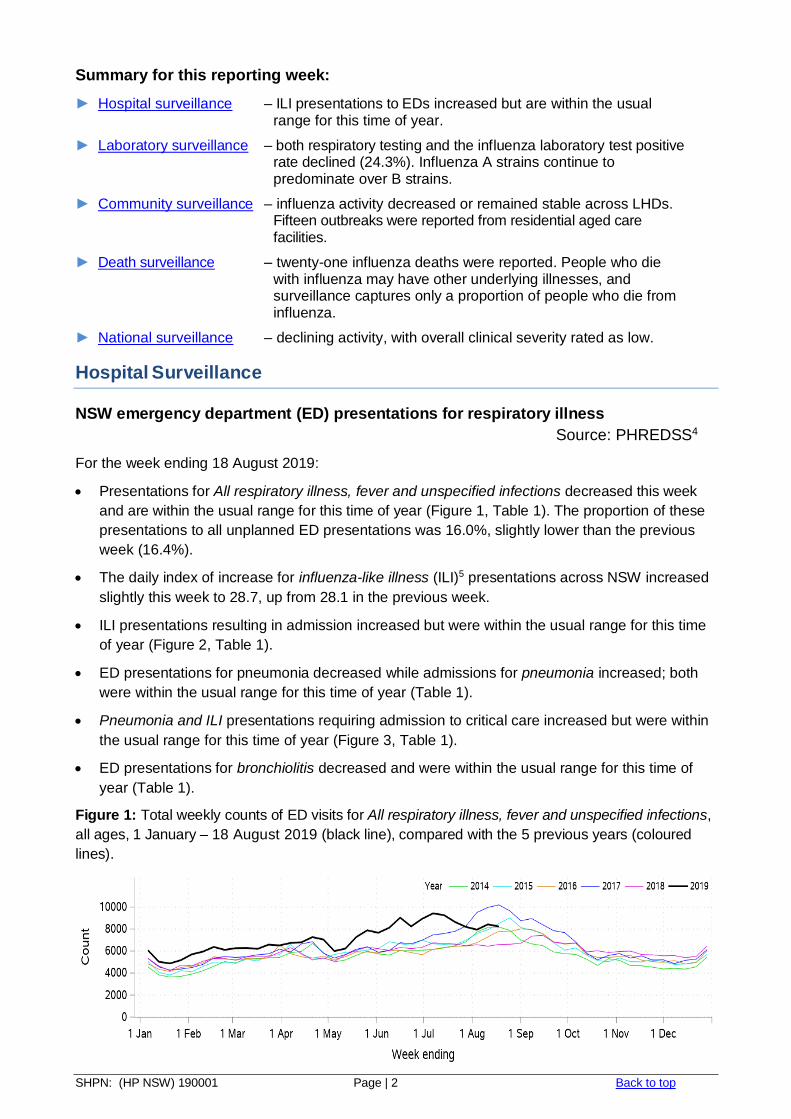
Summary for this reporting week:
► Hospital surveillance – ILI presentations to EDs increased but are within the usual range for this time of year.
► Laboratory surveillance – both respiratory testing and the influenza laboratory test positive rate declined (24.3%). Influenza A strains continue to predominate over B strains.
► Community surveillance – influenza activity decreased or remained stable across LHDs. Fifteen outbreaks were reported from residential aged care facilities.
► Death surveillance – twenty-one influenza deaths were reported. People who die with influenza may have other underlying illnesses, and surveillance captures only a proportion of people who die from influenza.
► National surveillance – declining activity, with overall clinical severity rated as low.
Hospital Surveillance
NSW emergency department (ED) presentations for respiratory illness
Source: PHREDSS4
For the week ending 18 August 2019:
Presentations for All respiratory illness, fever and unspecified infections decreased this week
and are within the usual range for this time of year (Figure 1, Table 1). The proportion of these
presentations to all unplanned ED presentations was 16.0%, slightly lower than the previous
week (16.4%).
The daily index of increase for influenza-like illness (ILI)5 presentations across NSW increased
slightly this week to 28.7, up from 28.1 in the previous week.
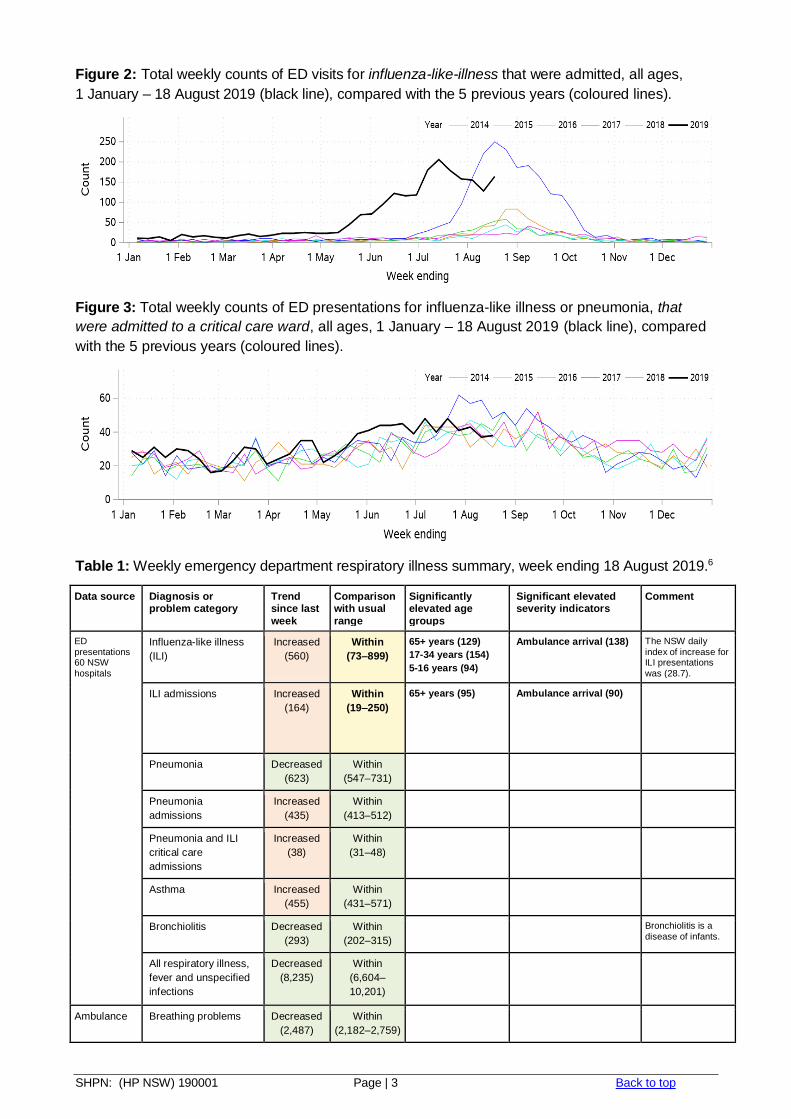
ILI presentations resulting in admission increased but were within the usual range for this time
of year (Figure 2, Table 1).
ED presentations for pneumonia decreased while admissions for pneumonia increased; both
were within the usual range for this time of year (Table 1).
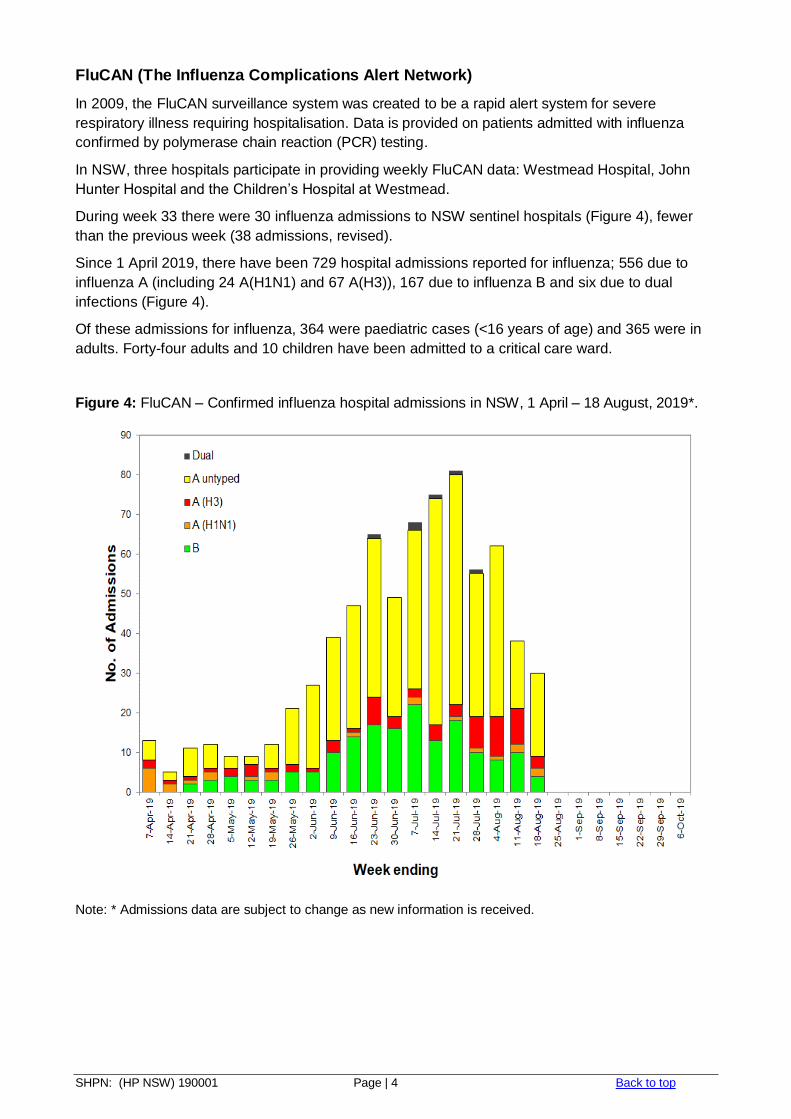
Pneumonia and ILI presentations requiring admission to critical care increased but were within
the usual range for this time of year (Figure 3, Table 1).
ED presentations for bronchiolitis decreased and were within the usual range for this time of
year (Table 1).
Figure 1: Total weekly counts of ED visits for All respiratory illness, fever and unspecified infections,
all ages, 1 January – 18 August 2019 (black line), compared with the 5 previous years (coloured
lines).
SHPN: (HP NSW) 190001 Page | 3 Back to top
Figure 2: Total weekly counts of ED visits for influenza-like-illness that were admitted, all ages,
1 January – 18 August 2019 (black line), compared with the 5 previous years (coloured lines).
Figure 3: Total weekly counts of ED presentations for influenza-like illness or pneumonia, that
were admitted to a critical care ward, all ages, 1 January – 18 August 2019 (black line), compared
with the 5 previous years (coloured lines).
Table 1: Weekly emergency department respiratory illness summary, week ending 18 August 2019.6
Data source Diagnosis or problem category
Trend since last
week
Comparison with usual
range
Significantly elevated age
groups
Significant elevated severity indicators
Comment
ED presentations 60 NSW hospitals
Influenza-like illness
(ILI)
Increased
(560)
Within
(73–899)
65+ years (129)
17-34 years (154)
5-16 years (94)
Ambulance arrival (138) The NSW daily index of increase for ILI presentations was (28.7).
ILI admissions Increased
(164)
Within
(19–250)
65+ years (95)
Ambulance arrival (90)
Pneumonia Decreased
(623)
Within
(547–731)
Pneumonia
admissions
Increased
(435)
Within
(413–512)
Pneumonia and ILI
critical care
admissions
Increased
(38)
Within
(31–48)
Asthma Increased
(455)
Within
(431–571)
Bronchiolitis Decreased
(293)
Within
(202–315)
Bronchiolitis is a disease of infants.
All respiratory illness,
fever and unspecified
infections
Decreased
(8,235)
Within
(6,604–
10,201)
Ambulance Breathing problems Decreased
(2,487)
Within
(2,182–2,759)
SHPN: (HP NSW) 190001 Page | 4 Back to top
FluCAN (The Influenza Complications Alert Network)
In 2009, the FluCAN surveillance system was created to be a rapid alert system for severe
respiratory illness requiring hospitalisation. Data is provided on patients admitted with influenza
confirmed by polymerase chain reaction (PCR) testing.
In NSW, three hospitals participate in providing weekly FluCAN data: Westmead Hospital, John
Hunter Hospital and the Children’s Hospital at Westmead.
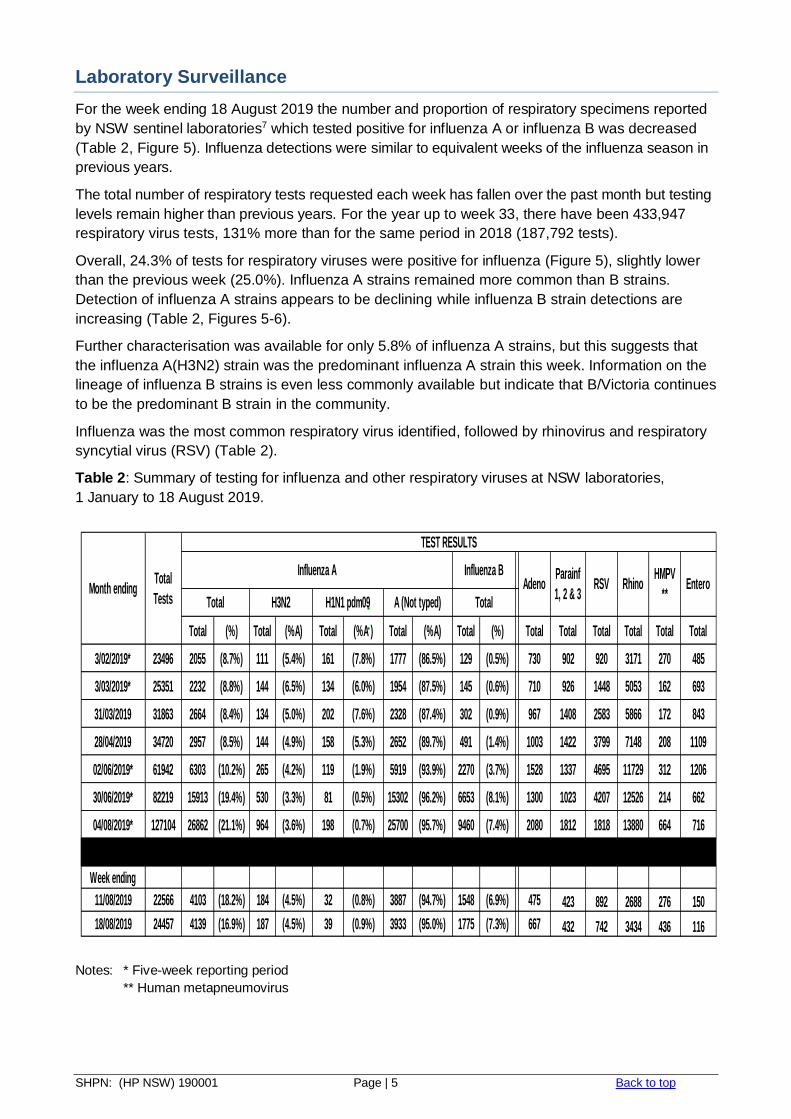
During week 33 there were 30 influenza admissions to NSW sentinel hospitals (Figure 4), fewer
than the previous week (38 admissions, revised).
Since 1 April 2019, there have been 729 hospital admissions reported for influenza; 556 due to
influenza A (including 24 A(H1N1) and 67 A(H3)), 167 due to influenza B and six due to dual
infections (Figure 4).
Of these admissions for influenza, 364 were paediatric cases (<16 years of age) and 365 were in
adults. Forty-four adults and 10 children have been admitted to a critical care ward.
Figure 4: FluCAN – Confirmed influenza hospital admissions in NSW, 1 April – 18 August, 2019*.
Note: * Admissions data are subject to change as new information is received.
SHPN: (HP NSW) 190001 Page | 5 Back to top
Laboratory Surveillance
For the week ending 18 August 2019 the number and proportion of respiratory specimens reported
by NSW sentinel laboratories7 which tested positive for influenza A or influenza B was decreased
(Table 2, Figure 5). Influenza detections were similar to equivalent weeks of the influenza season in
previous years.
The total number of respiratory tests requested each week has fallen over the past month but testing
levels remain higher than previous years. For the year up to week 33, there have been 433,947
respiratory virus tests, 131% more than for the same period in 2018 (187,792 tests).
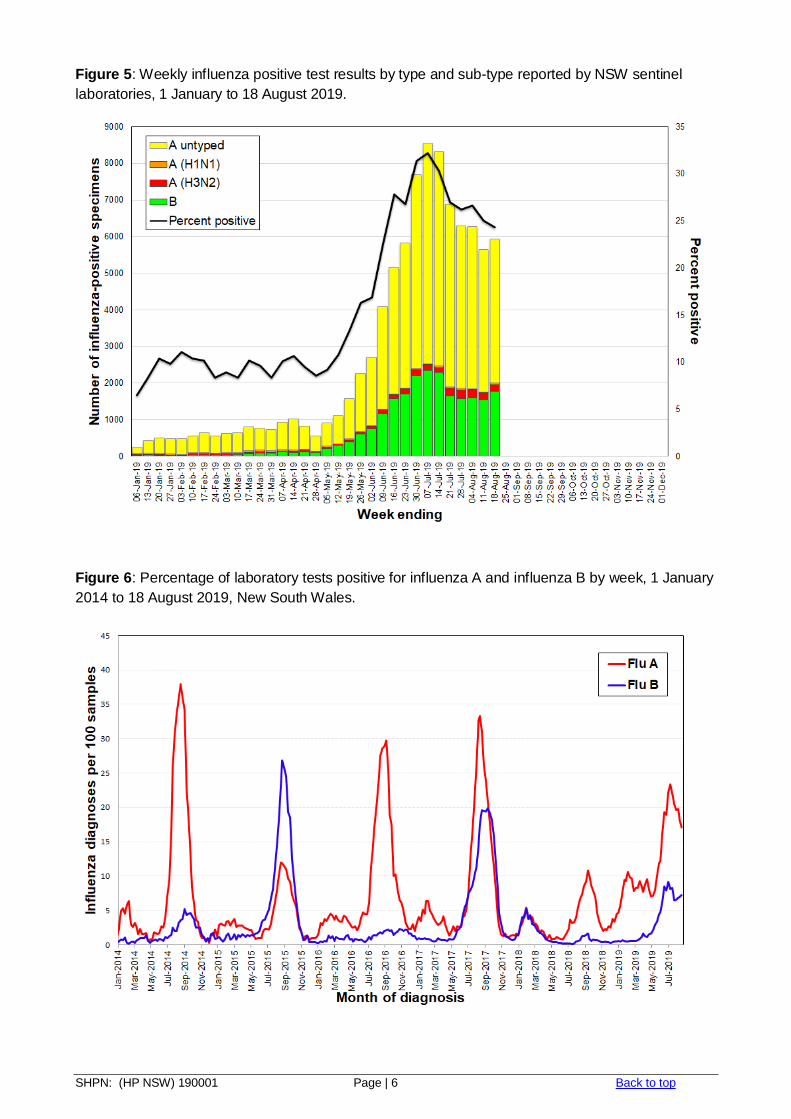
Overall, 24.3% of tests for respiratory viruses were positive for influenza (Figure 5), slightly lower
than the previous week (25.0%). Influenza A strains remained more common than B strains.
Detection of influenza A strains appears to be declining while influenza B strain detections are
increasing (Table 2, Figures 5-6).
Further characterisation was available for only 5.8% of influenza A strains, but this suggests that
the influenza A(H3N2) strain was the predominant influenza A strain this week. Information on the
lineage of influenza B strains is even less commonly available but indicate that B/Victoria continues
to be the predominant B strain in the community.
Influenza was the most common respiratory virus identified, followed by rhinovirus and respiratory
syncytial virus (RSV) (Table 2).
Table 2: Summary of testing for influenza and other respiratory viruses at NSW laboratories,
1 January to 18 August 2019.
Notes: * Five-week reporting period
** Human metapneumovirus
Total (%) Total (%A) Total (%A ) Total (%A) Total (%) Total Total Total Total Total Total
3/02/2019* 23496 2055 (8.7%) 111 (5.4%) 161 (7.8%) 1777 (86.5%) 129 (0.5%) 730 902 920 3171 270 485
3/03/2019* 25351 2232 (8.8%) 144 (6.5%) 134 (6.0%) 1954 (87.5%) 145 (0.6%) 710 926 1448 5053 162 693
31/03/2019 31863 2664 (8.4%) 134 (5.0%) 202 (7.6%) 2328 (87.4%) 302 (0.9%) 967 1408 2583 5866 172 843
28/04/2019 34720 2957 (8.5%) 144 (4.9%) 158 (5.3%) 2652 (89.7%) 491 (1.4%) 1003 1422 3799 7148 208 1109
02/06/2019* 61942 6303 (10.2%) 265 (4.2%) 119 (1.9%) 5919 (93.9%) 2270 (3.7%) 1528 1337 4695 11729 312 1206
30/06/2019* 82219 15913 (19.4%) 530 (3.3%) 81 (0.5%) 15302 (96.2%) 6653 (8.1%) 1300 1023 4207 12526 214 662
04/08/2019* 127104 26862 (21.1%) 964 (3.6%) 198 (0.7%) 25700 (95.7%) 9460 (7.4%) 2080 1812 1818 13880 664 716
Week ending
11/08/2019 22566 4103 (18.2%) 184 (4.5%) 32 (0.8%) 3887 (94.7%) 1548 (6.9%) 475 423 892 2688 276 150
18/08/2019 24457 4139 (16.9%) 187 (4.5%) 39 (0.9%) 3933 (95.0%) 1775 (7.3%) 667 432 742 3434 436 116
Total
TestsMonth ending
Total
Influenza A RSV
TEST RESULTS
AdenoParainf
1, 2 & 3H3N2
Influenza B
TotalA (Not typed)
HMPV
**Rhino Entero
H1N1 pdm09
SHPN: (HP NSW) 190001 Page | 6 Back to top
Figure 5: Weekly influenza positive test results by type and sub-type reported by NSW sentinel
laboratories, 1 January to 18 August 2019.
Figure 6: Percentage of laboratory tests positive for influenza A and influenza B by week, 1 January
2014 to 18 August 2019, New South Wales.
SHPN: (HP NSW) 190001 Page | 7 Back to top
Community Surveillance
In the week ending 18 August there were 5,286 notifications of influenza, lower than the previous
week (6,536, revised). There have been 84,557 influenza notifications so far this year.*
Influenza notifications by Local Health District (LHD)
Influenza notifications and notification rates were decreased or stable across all districts.
Notification rates remain highest in the Nepean Blue Mountains and Northern NSW LHDs
(Table 3).
Table 3: Weekly notifications of laboratory-confirmed influenza by local health district.*
Notes: * All data are preliminary and subject to change. Significant delays in the registration of notifications
may occur during the winter months. For further information see the influenza notifications data page.
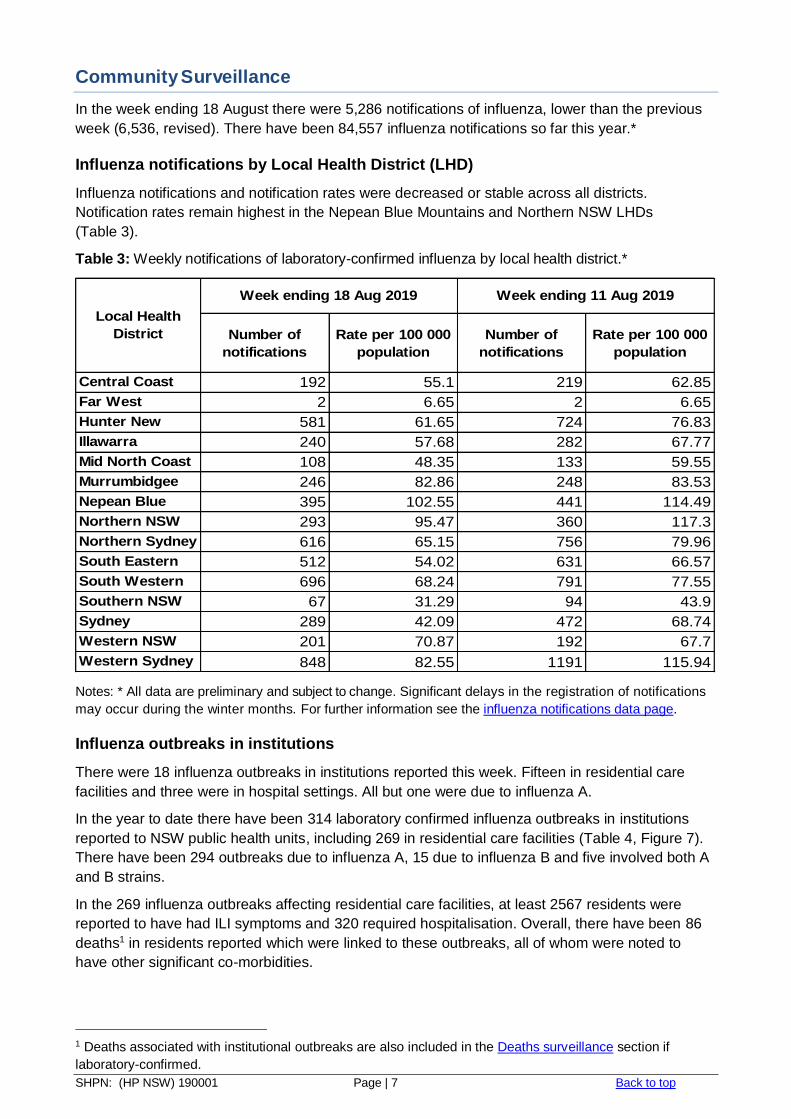
Influenza outbreaks in institutions
There were 18 influenza outbreaks in institutions reported this week. Fifteen in residential care
facilities and three were in hospital settings. All but one were due to influenza A.
In the year to date there have been 314 laboratory confirmed influenza outbreaks in institutions
reported to NSW public health units, including 269 in residential care facilities (Table 4, Figure 7).
There have been 294 outbreaks due to influenza A, 15 due to influenza B and five involved both A
and B strains.
In the 269 influenza outbreaks affecting residential care facilities, at least 2567 residents were
reported to have had ILI symptoms and 320 required hospitalisation. Overall, there have been 86
deaths1 in residents reported which were linked to these outbreaks, all of whom were noted to
have other significant co-morbidities.
1 Deaths associated with institutional outbreaks are also included in the Deaths surveillance section if
laboratory-confirmed.
Number of
notifications
Rate per 100 000
population
Number of
notifications
Rate per 100 000
population
Central Coast 192 55.1 219 62.85
Far West 2 6.65 2 6.65
Hunter New
England
581 61.65 724 76.83
Illawarra
Shoalhaven
240 57.68 282 67.77
Mid North Coast 108 48.35 133 59.55
Murrumbidgee 246 82.86 248 83.53
Nepean Blue
Mountains
395 102.55 441 114.49
Northern NSW 293 95.47 360 117.3
Northern Sydney 616 65.15 756 79.96
South Eastern
Sydney
512 54.02 631 66.57
South Western
Sydney
696 68.24 791 77.55
Southern NSW 67 31.29 94 43.9
Sydney 289 42.09 472 68.74
Western NSW 201 70.87 192 67.7
Western Sydney 848 82.55 1191 115.94
Local Health
District
Week ending 18 Aug 2019 Week ending 11 Aug 2019
SHPN: (HP NSW) 190001 Page | 8 Back to top
NSW public health units advise institutions on how to manage their influenza outbreaks. NSW
Health also provides influenza antiviral treatment to help control outbreaks when requested and
appropriate. This week NSW Health provided 363 courses of oseltamivir to eight residential care
facilities experiencing outbreaks, and have provided 6420 courses so far this year.
Table 4: Reported influenza outbreaks in NSW residential care facilities, January 2014 to 18 August
2019.
Year 2014 2015 2016 2017 2018 2019*
Number of outbreaks 121 103 252 543 42 269
Note: * Year to date.
Figure 7: Reported influenza outbreaks in NSW residential care facilities by month, 2016 to
18 August 2019.
The Australian Sentinel Practices Research Network (ASPREN)
ASPREN is a network of sentinel general practitioners (GPs) run through the Royal Australian
College of General Practitioners and the University of Adelaide which has collected de-identified
information on influenza-like illness (ILI) and other conditions seen in general practice since 1991.
Participating GPs in the program report on the proportion of patients presenting with an ILI. The
number of GPs participating on a weekly basis may vary.
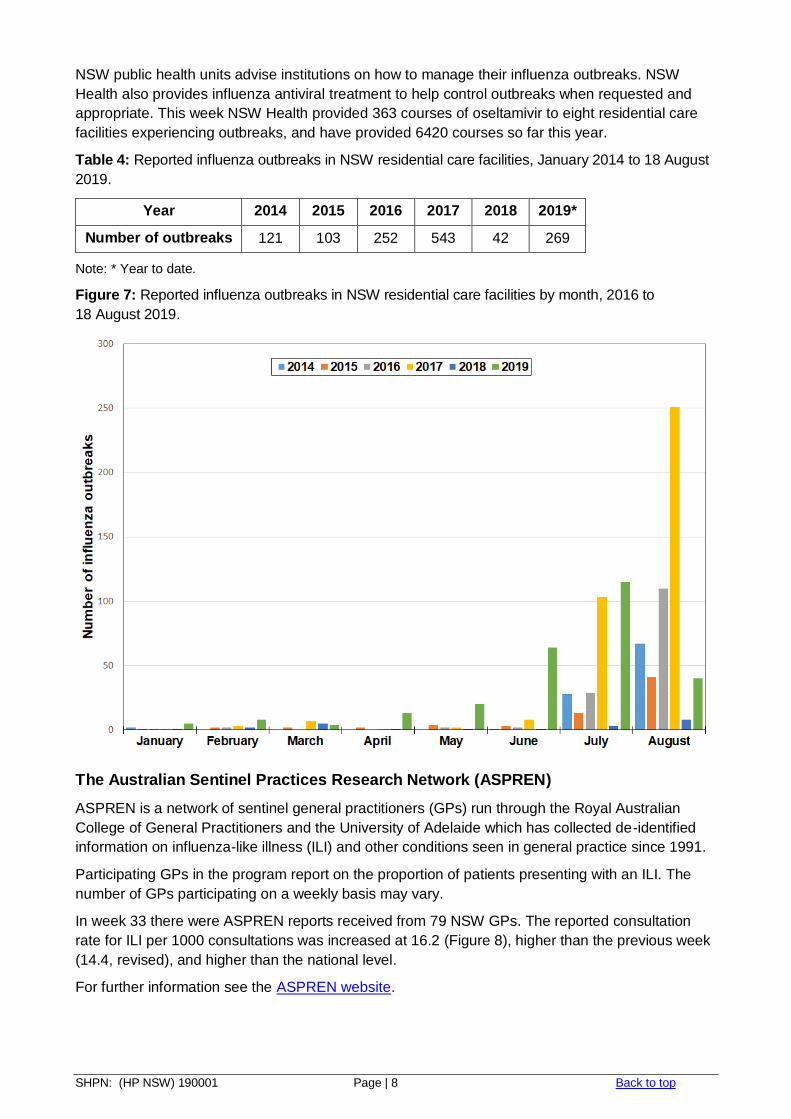
In week 33 there were ASPREN reports received from 79 NSW GPs. The reported consultation
rate for ILI per 1000 consultations was increased at 16.2 (Figure 8), higher than the previous week
(14.4, revised), and higher than the national level.
For further information see the ASPREN website.
SHPN: (HP NSW) 190001 Page | 9 Back to top
Figure 8: ASPREN – NSW and National GP ILI rates per 1000 consultations – 2019 to the week
ending 18 August.
FluTracking.net
FluTracking.net is an online health surveillance system to detect epidemics of influenza. It is a
project of the University of Newcastle, the Hunter New England Local Health District and the Hunter
Medical Research Institute.
FluTracking participants complete a simple online weekly survey which is used to generate data on
the rate of ILI symptoms in communities.
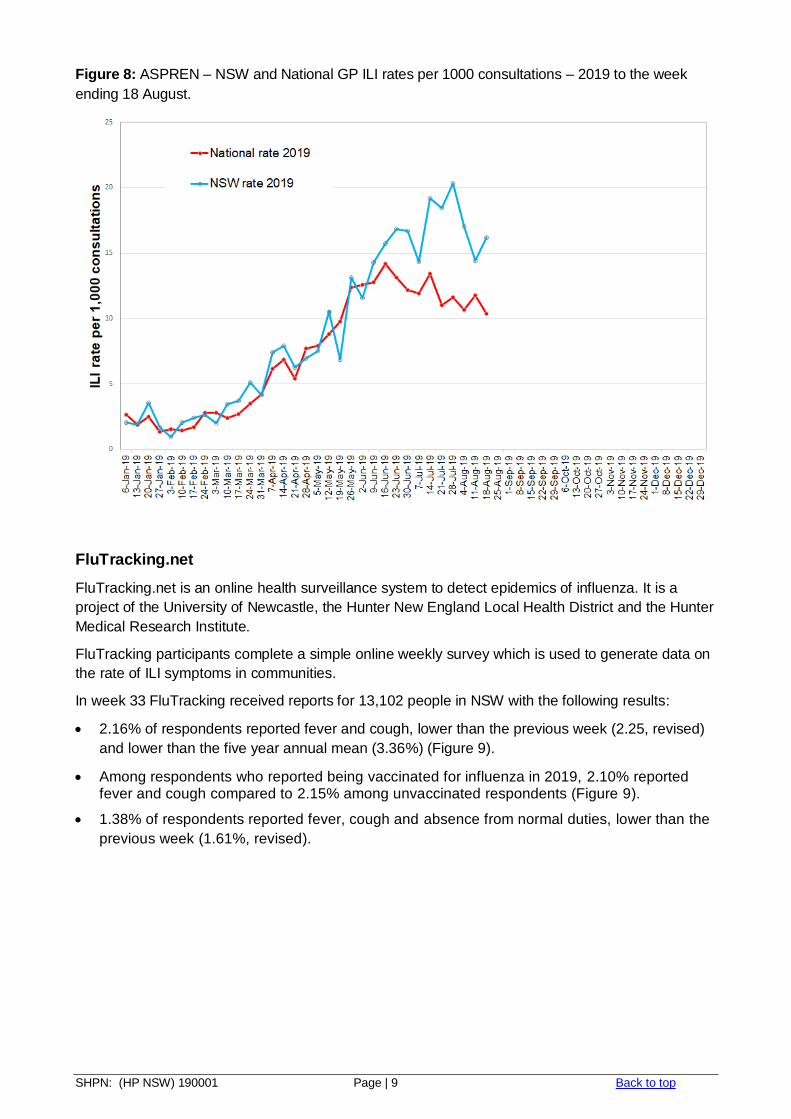
In week 33 FluTracking received reports for 13,102 people in NSW with the following results:
2.16% of respondents reported fever and cough, lower than the previous week (2.25, revised)
and lower than the five year annual mean (3.36%) (Figure 9).
Among respondents who reported being vaccinated for influenza in 2019, 2.10% reported fever and cough compared to 2.15% among unvaccinated respondents (Figure 9).
1.38% of respondents reported fever, cough and absence from normal duties, lower than the
previous week (1.61%, revised).

SHPN: (HP NSW) 190001 Page | 10 Back to top
Figure 9: FluTracking – Percent of NSW participants reporting fever and cough by vaccination status
and week, April to the week ending 18 August 2019, compared to the age standardised 5 year mean.
Note: Participants are not considered vaccinated until at least two weeks has elapsed since their recorded
time of vaccination.
For further information on the project and how to participate, please see the FluTracking website.
Healthdirect Australia
Healthdirect Australia is a national, government-owned, not-for profit organisation that collects data
based on calls to its Healthdirect helpline (1800 022 222). This data includes the number of callers
who report symptoms consistent with influenza-like illness (ILI).
In the week ending 18 August the number of ILI-related calls to Healthdirect Australia for NSW
decreased and remained within the usual range of activity for this time of year, and was in the
moderate range of activity for the season (Figure 10).
Figure 10: Healthdirect Australia – weekly ILI-related calls as a proportion of all calls for NSW, 2019
to the week ending 18 August compared to the weekly range between 2013 and 2018.
For further information see the Healthdirect Australia Flu trends website.
SHPN: (HP NSW) 190001 Page | 11 Back to top
Deaths surveillance
Coded cause of death data is not timely enough for seasonal influenza surveillance. To provide
rapid indicators of influenza and pneumonia mortality, death registrations from the NSW Registry of
Births, Deaths and Marriages are used. A keyword search is applied, across any text field of the
Medical Certificate Cause of Death (MCCD), to identify death registrations that mention influenza
or pneumonia. The MCCD text includes conditions directly leading to the death, antecedent causes
and other significant conditions contributing to the death. Two indicators are then reported:
1. Pneumonia and influenza mortality to provide a more complete picture of the impact of
influenza, and
2. Influenza deaths with laboratory confirmation for a more specific measure.
NSW Health monitors the number of people whose deaths certificates report influenza and
pneumonia, however the proportion of deaths accurately identified as being due to influenza likely
varies over time as influenza testing has become more readily available, and so trends need to be
interpreted with caution.
Pneumonia and influenza mortality
Due to delays in the death registration process, death data for recent weeks are underestimated.
For this reason, pneumonia and influenza mortality data from the three most recent weeks are not
included.
For the week ending 26 July 2019, the rate of deaths attributed to pneumonia or influenza was
1.72 per 100,000 NSW population, an increase from the previous week (1.36) and above the
epidemic threshold of 1.50 per 100,000 population (Figure 11).
This is the first week that the death rate from pneumonia or influenza has been above the epidemic
threshold since a short period from late February to mid-March (Figure 11). This is consistent with
the peak of influenza activity for this season seen in early to mid-July.
Among the 30,637 death registrations in 2019, 157 (0.51%) mentioned influenza. An additional
2504 (8.17%) death registrations mentioned pneumonia.
Figure 11: Rate of death registrations classified as influenza or pneumonia per 100,000 NSW
population, 2014 – 26 July, 2019
Source: NSW Registry of Births, Deaths and Marriages.
SHPN: (HP NSW) 190001 Page | 12 Back to top
* Notes on interpreting death data:
(a) Deaths registration data is routinely reviewed for deaths mentioning pneumonia or influenza. While
pneumonia has many causes, a well-known indicator of seasonal and pandemic influenza activity is an
increase in the number of death certificates that mention pneumonia or influenza as a cause of death.
(b) The predicted seasonal baseline estimates the predicted rate of pneumonia or influenza deaths in the
absence of influenza epidemics. If deaths exceed the epidemic threshold, then it may be an indication
that influenza is beginning to circulate widely and may be more severe.
(c) The number of deaths mentioning “Pneumonia or influenza” is reported as a rate per 100,000 NSW
population (rather than a rate per total deaths reported).
(d) Deaths referred to a coroner during the reporting period may not be available for analysis, particularly
deaths in younger people which are more likely to require a coronial inquest. Influenza-related deaths in
younger people may be under-represented in these data as a result.
(e) The interval between death and death data availability is usually at least 14 days, and so these data are
at least two weeks behind reports from emergency departments and laboratories and subject to change.
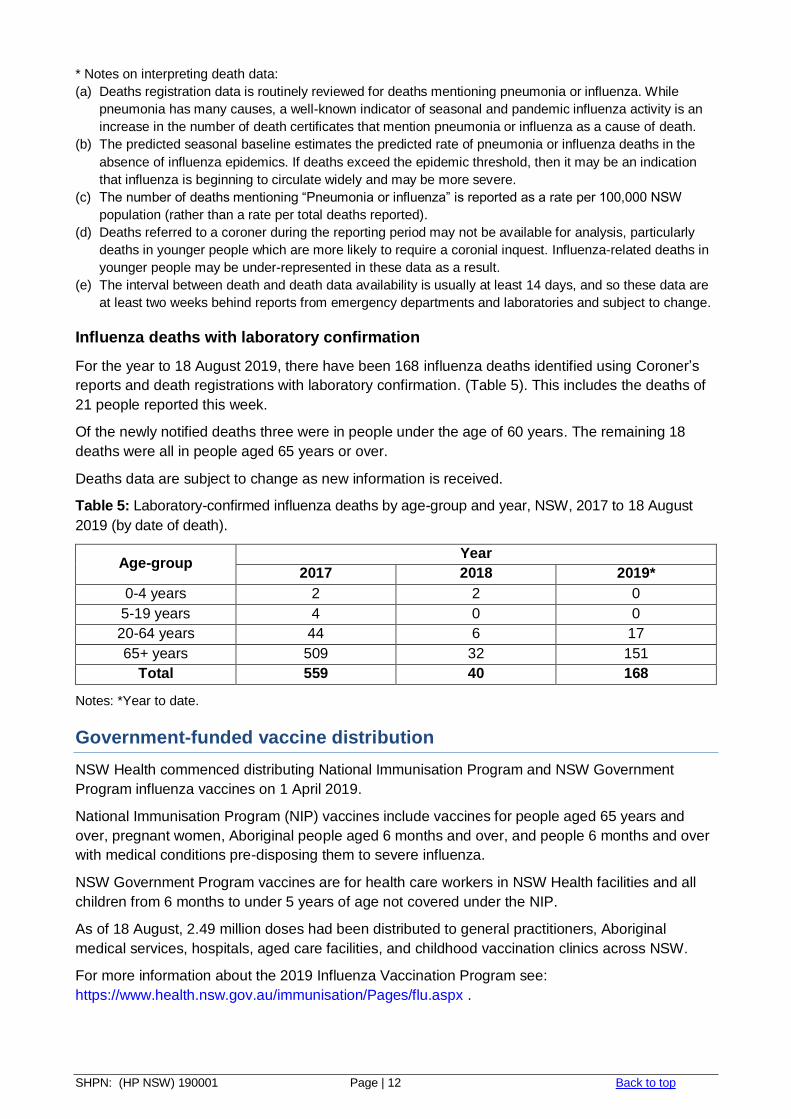
Influenza deaths with laboratory confirmation
For the year to 18 August 2019, there have been 168 influenza deaths identified using Coroner’s
reports and death registrations with laboratory confirmation. (Table 5). This includes the deaths of
21 people reported this week.
Of the newly notified deaths three were in people under the age of 60 years. The remaining 18
deaths were all in people aged 65 years or over.
Deaths data are subject to change as new information is received.
Table 5: Laboratory-confirmed influenza deaths by age-group and year, NSW, 2017 to 18 August
2019 (by date of death).
Age-group Year
2017 2018 2019*
0-4 years 2 2 0
5-19 years 4 0 0
20-64 years 44 6 17
65+ years 509 32 151
Total 559 40 168
Notes: *Year to date.
Government-funded vaccine distribution
NSW Health commenced distributing National Immunisation Program and NSW Government
Program influenza vaccines on 1 April 2019.
National Immunisation Program (NIP) vaccines include vaccines for people aged 65 years and
over, pregnant women, Aboriginal people aged 6 months and over, and people 6 months and over
with medical conditions pre-disposing them to severe influenza.
NSW Government Program vaccines are for health care workers in NSW Health facilities and all
children from 6 months to under 5 years of age not covered under the NIP.
As of 18 August, 2.49 million doses had been distributed to general practitioners, Aboriginal
medical services, hospitals, aged care facilities, and childhood vaccination clinics across NSW.
For more information about the 2019 Influenza Vaccination Program see:
https://www.health.nsw.gov.au/immunisation/Pages/flu.aspx .
SHPN: (HP NSW) 190001 Page | 13 Back to top
National and International Influenza Surveillance
National Influenza Surveillance
The fortnightly Australian Surveillance Report No.8, with data up to 11 August 2019, noted:
Activity – Currently, influenza and influenza-like illness (ILI) activity is lower than average for
this time of year compared to previous years, and is consistent with past activity following a
peak in notifications. At the national level, notifications of laboratory-confirmed influenza have
decreased in the past fortnight; however, this may be due in some measure to data entry
backlogs.
Severity – Clinical severity for the season to date, as measured through the proportion of
patients admitted directly to ICU, and deaths attributed to influenza, is low .
Virology – The majority of confirmed influenza cases reported nationally were influenza A in
the year to date (81%) and past fortnight (77%). The proportion of cases attributed to influenza
B has increased slightly in the past fortnight, following a steady decline during July.
For further information see the Australian Influenza Surveillance Reports.
Global Influenza Update
The latest WHO global update on 19 August 2019 provides data up to 4 August 2019. In the
temperate zones of the southern hemisphere, influenza detections increased overall. In summary:
In the temperate zones of the southern hemisphere, influenza activity appeared to have
peaked in most countries.
In the Caribbean, Central American, and tropical South American countries, influenza activity
was low overall.
In tropical Africa, influenza activity was low across reporting countries, with the exception of a
few countries in Eastern Africa.
In Southern Asia, influenza activity was low across reporting countries.
In South East Asia, influenza activity was decreasing or low across reporting countries except
in Myanmar.
In the temperate zone of the northern hemisphere, influenza activity remained at inter-seasonal
levels.
Worldwide, seasonal influenza A viruses accounted for the majority of detections.
Follow the link for the WHO influenza surveillance reports.
Influenza at the human-animal interface
WHO publishes regular updated risk assessments of human infections with avian and other non-
seasonal influenza viruses at Influenza at the human-animal interface, with the most recent report
published on 24 June 2019. These reports provide information on human cases of infection with
non-seasonal influenza viruses, such as H5 and H7 clade viruses, and outbreaks among animals.
Since the previous update, one new human infection with an influenza A(H1N1) variant virus was
reported. There were no new reports of human cases of avian influenza A(H5) or A(H7) reported.
The overall risk assessment for these viruses remains unchanged.
SHPN: (HP NSW) 190001 Page | 14 Back to top
Other sources of information on avian influenza and the risk of human infection include:
US CDC Avian influenza
European CDC (ECDC) Avian influenza
Public Health Agency of Canada Avian influenza H7N9.
Composition of influenza vaccines in 2019
WHO influenza vaccine strain recommendations – Southern Hemisphere, 2019
The WHO recommendations for the composition of trivalent vaccines included changes in the
influenza A(H3N2) component and the influenza B (Victoria lineage), as follows:
an A/Michigan/45/2015 (H1N1)pdm09-like virus
an A/Switzerland/8060/2017 (H3N2)-like virus
a B/Colorado/06/2017-like virus (B/Victoria lineage)
It was recommended that quadrivalent vaccines also contain a second B component, a
B/Phuket/3073/2013-like virus (B/Yamagata lineage).
Australian influenza vaccine strain recommendations – 2019 influenza season
The Australian Influenza Vaccine Committee (AIVC) recommendation for the Australian trivalent
vaccine includes a B/Yamagata lineage virus (a B/Phuket/3073/2013-like virus), rather than a
B/Victoria lineage virus, based on circulating influenza B viruses at the time of the
recommendation. The Therapeutic Goods Administration (TGA) accepted the AIVC
recommendations for 2019.
Information on NSW seasonal influenza vaccination activities in 2019, including free vaccine for all
children aged 6 months to less than 5 years can be found at:
https://www.health.nsw.gov.au/immunisation/Pages/flu.aspx .
WHO influenza vaccine strain recommendations – Northern Hemisphere, 2019-20
The WHO Consultation on the Composition of Influenza Vaccines for Use in the 2019-20 Northern
Hemisphere Influenza Season was held in Beijing on 18-20 February 2019.
From this meeting it was recommended that egg based quadrivalent vaccines for use in the 2019-
2020 northern hemisphere influenza season contain the following:
an A/Brisbane/02/2018 (H1N1)pdm09-like virus;
an A/Kansas/14/2017 (H3N2)-like virus;
a B/Colorado/06/2017-like virus (B/Victoria/2/87 lineage); and
a B/Phuket/3073/2013-like virus (B/Yamagata/16/88 lineage).
It was also recommended that the influenza B virus component of trivalent vaccines for use in the
2019-2020 northern hemisphere influenza season should be a B/Colorado/06/2017-like virus of the
B/Victoria/2/87-lineage.
In light of recent changes in the proportions of genetically and antigenically diverse A(H3N2)
viruses, the recommendation for the A(H3N2) component was announced on 21 March. More
details about the most recent influenza vaccine recommendations can be found at:
http://www.who.int/influenza/vaccines/virus/en/ .
SHPN: (HP NSW) 190001 Page | 15 Back to top
Report Notes:
1 Notes for trend comparisons with the previous week:
Trend in Cases Trend in Presentations
► Stable <10% change or <20 cases change
<10% change or <40 presentations change
▼ Decrease 10% or greater decrease 10% or greater decrease
▲ Increase 10-20% increase 10-20% increase
▲ Higher increase >20% increase >20% increase
2 All Respiratory, fever and unspecified infections presentations as a percentage of all unplanned emergency
department presentations in participating hospitals in the local health district. 3 NSW Local Health Districts and SA2: Influenza notification maps use NSW Local Health District Boundaries
and Australian Bureau of Statistics (ABS) statistical area level 2 (SA2) of place of residence of cases are shown. Note that place of residence is used as a surrogate for place of acquisition for cases; the infection may have been acquired while the person was in another area.
4 NSW Health Public Health Rapid, Emergency Disease and Syndromic Surveillance system, CEE, NSW Ministry of Health. Comparisons are made with data for the preceding 5 years. Includes unplanned presentations to 67 NSW emergency departments, which accounted for 83% of all NSW ED presentations in the 2016/2017 financial year. The coverage is lower in rural EDs. Data is continuously updated.
5 The ED ‘ILI’ syndrome includes provisional diagnoses selected by a clinician of ‘influenza-like illness’ or ‘influenza’ (including ‘pneumonia with influenza’), avian and other new influenza viruses.
6 Notes: The usual range is the range of weekly counts for the same week in the previous five years for ED presentations and for ambulance Triple (000) calls.
Key for trend since last week: Non-bold and green=decreased or steady; Non-bold and orange=increased
Key for comparison with usual range: Non-bold and green =usual range; Non-bold and orange=above
usual range, but not significantly above five-year mean; Bold and yellow=within usual range, but
significantly above five-year mean; Bold and red = above the usual range and significantly above five-year
mean (ED).
Counts are statistically significant (shown in bold) if they are at least five standard deviations above the
five-year mean. The ‘daily index of increase’ is statistically significant above a threshold of 15. LHD = Local
Health District. ii Severity indicators include: Admission or admission to a critical care ward (CCW); Triage category 1;
Ambulance arrival and Death in ED.
7 Preliminary laboratory data is provided by participating sentinel laboratories on a weekly basis and are subject to change. Point-of-care test results have been included since August 2012 but serological diagnoses are not included. Participating sentinel laboratories: Pathology North (Hunter, Royal North Shore Hospital), Pathology West (Nepean, Westmead), South Eastern Area Laboratory Services, Sydney South West Pathology Service (Liverpool, Royal Prince Alfred Hospital), The Children’s Hospital at Westmead, Australian Clinical Labs, Douglas Hanly Moir Pathology, Laverty Pathology, Medlab, SydPath, VDRLab (up to 2017), Austech, 4cyte.