Embed Size (px)
Citation preview

Influenza Virus Vaccine
Composition 2004-2005
Roland A. Levandowski, M.D.
Division of Viral Products
Prepared for Vaccines and Related Biological Products Advisory Committee18-19 February 2004

Topics for VRBPAC18-19 February 2004
For Committee Recommendation:– Selection of influenza A (H1 and H3) and B
viruses for 2004-2005
For Committee Information– Vaccine effectiveness studies 2003-2004– Avian Influenza (H5) 2003-2004
For Committee Discussion– Tissue culture isolates for influenza vaccines

Question for Committee Recommendation
What strains should be recommended for the antigenic composition of the 2004-2005 influenza virus vaccine?

Review of Strain Selection for2003-2004
A/New Caledonia/20/99 (H1N1)-like
B/Hong Kong/330/01-like B/Hong Kong/330/01 B/Hong Kong/1434/02
A/Moscow/10/99 (H3N2)-like A/Panama/2007/99

Vaccine efficacy relates to:
Vaccine immunogenicity (potency)
Match of vaccine HA/NA with wild-type viruses
– First evidence of reduced vaccine effectiveness because of antigenic drift 2 years after first vaccines licensed for use in United States
– Antigenic drift of HA/NA continuous in influenza A and B viruses
Why Change Strains in Influenza Vaccines?
Questions to Be Answered for Strain Changes Every Year
Are new (drifted or shifted) influenza viruses present?
Are these new viruses spreading in people?
Do current vaccines induce antibodies against the new viruses (HA)?
Are strains suitable for vaccines available?

Strain Selection 2003-2004:New Strains Present?
Influenza A H1N1? NO
HA of all strains were similar to the vaccine strain

Strain Selection 2003-2004:New Strains Present? (Cont)
Influenza A H3N2? YES
HA of most strains in early 2003 were similar to the vaccine strain
HA of a proportion were antigenically distinguishable
First identification of antigenically distinguishable A/Fujian-like viruses in February 2003

Strain Selection 2003-2004:New Strains Present? (Cont)
Influenza B? NO
HA of majority of strains were similar to the vaccine strain
HA of small number (<<1%) of viruses were similar to older vaccine strain

Strain Selection 2003-2004: New Viruses Spreading?
Influenza A H3N2? YES
A/Fujian-like viruses found in small proportion in Asia, Europe and North America in Feb-Mar 2003

Strain Selection 2003-2004: Viruses Inhibited by Current Vaccines?
Influenza A H3N2? Partial NO
Majority of strains (A/Panama/2007/99-like): well-inhinbited
A/Fujian-like strains: some well-inhibited others poorly inhibited

Strain Selection 2003-2004: Strains Suitable for Manufacture Available?
TIMING NO
Manufacturing depends on egg-adapted strains (wild-type or high growth reassortant)
First A/Fujian-like variants identified February 2003
No A/Fujian-like egg isolates until April 2003
High growth reassortants first available end of June 2003

Implications of Strain Selection 1
Preparation of vaccines was on schedule
The supply of vaccine matched the demand expected by previous years’ experiences

Implications of Strain Selection 2
Early widespread appearance of drift variant A/Fujian-like viruses with reports of mortality in children significantly increased vaccine demand– Excess supplies of inactivated and live vaccines
in mid November were insufficient to avoid spot shortages after Thanksgiving
Effectiveness of the vaccines against drift variant A/Fujian-like viruses was questioned– Effectiveness evaluation is an ongoing activity

Influenza Virus Vaccines Used in the United States
Inactivated– Aventis-Pasteur, Inc. (Licensed 1970’s)– Evans Vaccines Ltd. (Licensed 1980’s)
– Approx. production 2003: 83 million doses
Live attenuated – MedImmune Vaccines Inc. (Licensed June,
2003)
– Approx. production 2003: 4 million doses

Timelines for Vaccine Production

Time to First Trivalent Vaccine Lot after Strain Change
Week
0 2 4 6 8 10 12 14 16 18 20 22 24+
REFERENCE VIRUS REFERENCE REAGENTS
SEED VIRUS PREP MONOVALENT PRODUCTION STRAIN 1 STRAIN 2 STRAIN 3 TRIVALENT PRODUCTION FILLING VACCINE RELEASE VACCINE DISTRIBUTION

Relative Effort for Production of Monovalent Vaccine Components
Per Cent of Total Inactivated Vaccine
Monovalent Lots Submitted for Release
1998 1999 2000 2001 2002 2003
H3 25 17 28 21 17 23
H1 37 28 47 44 43 43
B 38 55 25 35 40 34
Strains changed
B H1 and H3
B B None

Timing of Submission of Influenza Vaccines for Release 2003
0
5
10
15
20
25
30
35
40
45
50
MAR APR MAY JUN JUL AUG SEP OCT NOV DEC
Month
Nu
mb
er
of
Lo
ts
Monovalent
Trivalent

Cumulative Trivalent Influenza Vaccine Submitted for Release 2000-2003
0
10
20
30
40
50
60
70
80
90
100
JUN JUL AUG SEP OCT NOV DECMonth
Cum
ulat
ive
Per
cen
t
2003 2002 2001 2000

Why are Influenza Vaccines Important?
Economic consequences are high because of lost work
Morbidity is high, particularly in the very young
“Pneumonia and Influenza” category is among the top ten causes of death in the US
Epidemics cause 20,000 to 40,000 deaths annually in US, mainly in the elderly
Pandemics cause even higher losses: the pandemic of 1918 caused over 500,000 deaths in the US alone

Influenza Season Morbidity:Influenza-like Illness
Baltimore 1918-1944 (H1N1)
0
5
10
15
20
25
30
35
<5 5-9 10-14
15-19
20-24
25-29
30-34
35-39
40-44
45-49
50-59
>60
Age (Yrs)
Cas
es p
er 1
0,00
0
1918-1919
1919-1920
1928-1929
1940-1941
1943-1944
Source: Public Health Reports 1944; 59:1483

Influenza Season Morbidity:Pneumonia
Baltimore 1918-1944 (H1N1)
Source: Public Health Reports 1944; 59:1483
0
1
2
3
4
5
<5 5-9 10-14 15-19 20-24 25-29 30-34 35-39 40-44 45-49 50-59 >60
Age (Yrs)
Ca
se
s p
er
10
,00
0
1918-1919
1919-1920
1928-1929
1940-1941
1943-1944

Influenza Season Morbidity: Hospitalizations
Houston 1975-1976
Source: Epidemiol Rev 1982; 4:25
0
20
40
60
80
100
120
140
160
180
<1 1-4 5-9 10-14 15-19 20-24 25-34 35-44 45-54 55-64 >65Age (Yrs)
Ho
spit
aliz
atio
ns
per
10,
000 A/Victoria/3/75 (H3N2)-like viruses

Influenza Season Mortality: Harris County, Texas 1977-1978
Source: Epidemiol Rev 1982; 4:25
0
2
4
6
8
10
12
14
16
18
20
<1 1-4 5-19 20-44 45-64 >65
Age (Yrs)
Dea
ths
per
10,
000
A/Texas/1/77 (H3N2)-like viruses

Effect of Age on Influenza Morbidity and Mortality
Influenza attack rates often highest in children < 10 years old
Serious illness in all age brackets with the young and old most affected
Mortality generally highest in the elderly, but also relatively high in young children and infants

A Brief History of Influenza Vaccine Efficacy
1941 - Request to license first inactivated vaccine in US deferred to obtain efficacy data
1942 - Small scale studies demonstrate efficacy against influenza A and B challenge
1943 - Large scale field studies demonstrate efficacy against circulating influenza viruses
1945 - Inactivated influenza vaccines licensed in US
1947 - Reduced vaccine effectiveness against drift variant
1948 - Global surveillance initiated to identify drift variants for use in vaccines

Influenza Vaccine Efficacy
Randomized, placebo controlled field efficacy studies performed 1943-1945
Vaccines prepared as whole virus, formalin inactivated preparation
Vaccine antigens – A/Puerto Rico/8/34 (H1N1), A/Weiss/43 (H1N1), B/Lee/40
Army Specialized Training Program centers at 8 universities
>10,000 study participants
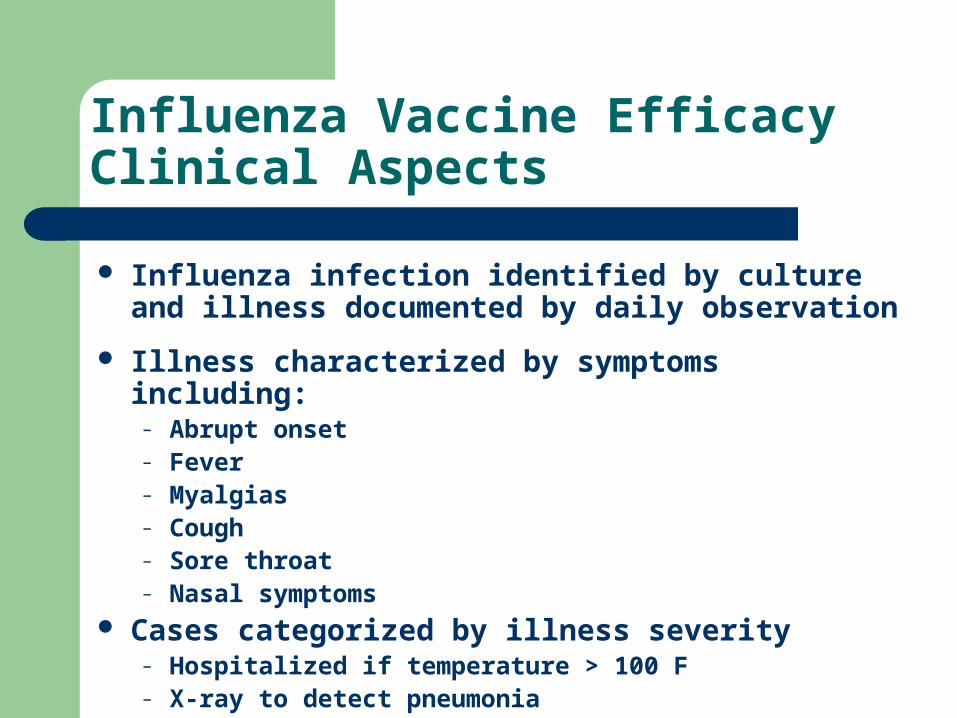
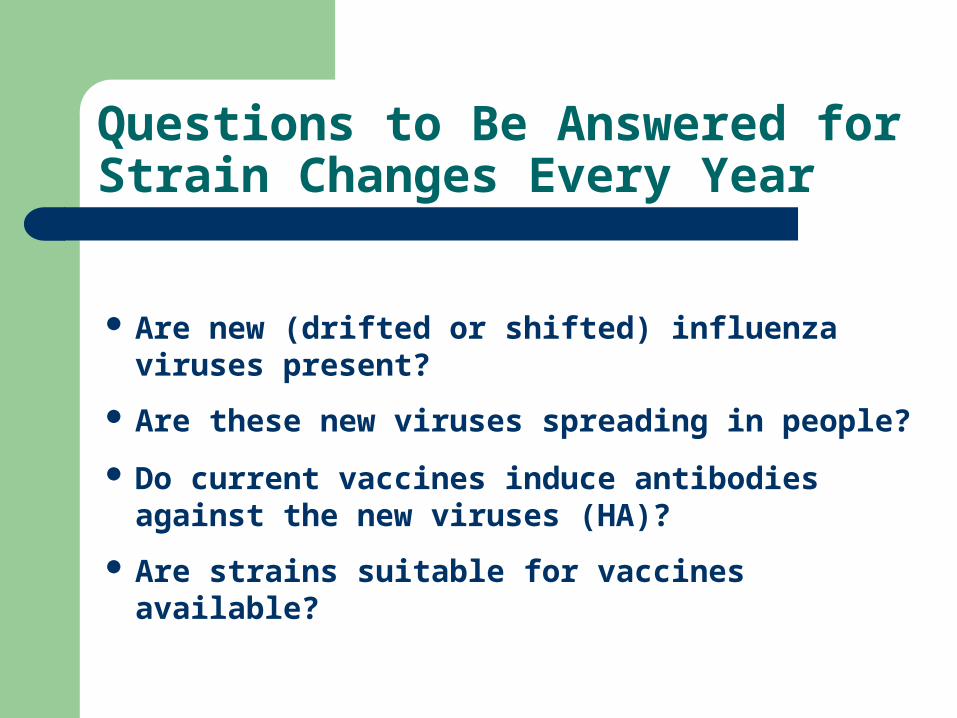
Influenza Vaccine EfficacyClinical Aspects
Influenza infection identified by culture and illness documented by daily observation
Illness characterized by symptoms including:– Abrupt onset– Fever– Myalgias– Cough– Sore throat– Nasal symptoms
Cases categorized by illness severity– Hospitalized if temperature > 100 F– X-ray to detect pneumonia

Vaccine Effectiveness against Clinical Influenza 1943-1945
Influenza A Influenza B
cases cases
N n % N n %
Vaccine 6263 138 2.2 600 7 1.2
Placebo 6211 442 7.1 1100 109 9.9
Protective
Effectiveness 69% 88%
Sources: JAMA 1944; 124:982 and JAMA 1945;131:273

Influenza Vaccine Efficacy 1943 Subanalysis: University of Michigan
Per cent with Clinical Illness
N Any respiratory
Outpatient influenza
Inpatient influenza
Pneumonia
Vaccine 878 35 5 2 0
Placebo 875 44 8 9 0.5
Protective Effectiveness
21 % 38 % 78 % 100 %
Source: Am J Hyg 1945; 42:57

Influenza Vaccine Efficacy 1943Other Observations
The placebo group was “diluted” by the presence of an immunized cohort which may have reduced transmission in the placebo group – the concept of “herd” immunity
The differences in attack rates between vaccine and placebo were greatest at the peak of the epidemic and became less as the epidemic receded, possibly because susceptibles were cumulatively eliminated– another “herd” effect

Protective Immunity to Drift Variant:Family Study, Texas, 1976
37 families with 155 members, Houston Family Study
A/Port Chalmers/1/73-like (H3N2) viruses caused an epidemic in 1975 and resulted in antibody production
A/Victoria/3/75-like viruses (drift variants of A/PC/73) caused an epidemic in 1976
Virus isolation and serology to document infection
No vaccine used (but contemporary vaccines were A/PC/73 for H3N2)

Protective Immunity to H3N2 Drift Variant A/Victoria/3/75
Pre exposure HI titer
Antibody to <10 10 20 >40
Port Chalmers/73 N=154 52 54 28 20
Per cent ill 19 19 4 5
Per cent infected 39 30 18 10
Victoria/75 N=154 64 63 21 6
Per cent ill 19 14 5 0
Per cent infected 36 24 19 17
Source: J Hyg Camb 1981; 86:303

Protective Immunity to Drift Variant:Family Study, Texas, 1986
98 families with 192 children 3-18 years old from the Houston Family Study
Inactivated or live attenuated vaccines given contained A/Chile/1/83-like H1N1 viruses
Single dose vaccine administered to all ages
A/Taiwan/1/86-like viruses (drift variants of A/Chile/83) caused an epidemic in 1986-1987
Virus isolation and serology to document infection

Protective Effectiveness againstDrift Variant A/Taiwan/1/86
Per Cent Infected
Age: 3-9 10-18 Total
Vaccine
Live Attenuated 18 24 21
Inactivated 26 0 17
Placebo 39 52 44
Protective effect:
52% live attenuated
61% inactivated
Source: J Infect Dis 1991; 163: 300

Protective Immunity to Drift Variant:Nursing Home, Colorado, 1986
Outbreak caused by H3N2 drift variant (A/Sichuan/2/87-like) of vaccine strain (A/Leningrad/6/86)
72% of residents immunized after outbreak started with peak of outbreak 2 weeks after immunization
Retrospective analysis using nursing home documentation of fever, illness, pneumonia and death
Serologic confirmation of infection in subset
Source: JAGS 1989; 37:407

0
1
2
3
4
5
6
7
8
9
10
Week 1 (Outbreakstarts)
2 (Vaccinegiven)
3 4 5
Nu
mb
er
of
Cas
es Immunized Unimmunized
Source: JAGS 1989; 37:407
Effectiveness against Drift Variant: Nursing Home, Colorado, 1987

Effectiveness against Drift Variant: Nursing Home, Colorado, 1987
After Vaccine All Residents
Vaccine No Vaccine Vaccine No Vaccine
N 64 17 74 28
Febrile URI 13 10 20 20
Pneumonia 0 3 0 12
Death 0 2 0 7
Protect Effect: 65%
Source: JAGS 1989; 37:407

Generalized Facts about Influenza Vaccine Effectiveness
Vaccine protective effect is more obvious for more severe forms of illness and for complications related to influenza infection
Vaccine shifts the spectrum of disease toward less severe consequences and milder illness
Higher antibody titers are more likely to result in protection from clinical illness > infection
Vaccine administered in an ongoing epidemic may reduce illness, pneumonia and death even when antigenic drift has occurred

WHO Recommendations for Influenza Vaccine CompositionNorthern hemisphere: 2004-2005
“ It is recommended that vaccines to be used in the 2004-2005 northern hemisphere influenza season contain the following:
an A/New Caledonia/20/99(H1N1)-like virus
an A/Fujian/411/2002(H3N2)-like virus
a B/Shanghai/361/2002-like virus ”
Question for Committee Recommendation
What strains should be recommended for the antigenic composition of the 2004-2005 influenza virus vaccine?
Based on
Epidemiology and antigenic characteristics
Serologic Responses
Availability of candidate strains