Embed Size (px)
Citation preview
Page 1
Measure title: Info-mobility tools in Burgos City: Burgos Project: Caravel Measure number: 12.02
A Introduction
A1 Objectives
Promotion of sustainable transport though electronic displays and other devices. The measure outlines to establish the following objectives:
• Objective 1: To improve the quality of urban transport through the provision of regular, frequent, constant and reliable information
• Objective 2: To promote intermodality in the urban transport network through the provision of integrated information
• Objective 3: To increase the level of information communicated on clean urban transport by introducing a variety of information displays and tactile screens.
A2 Description
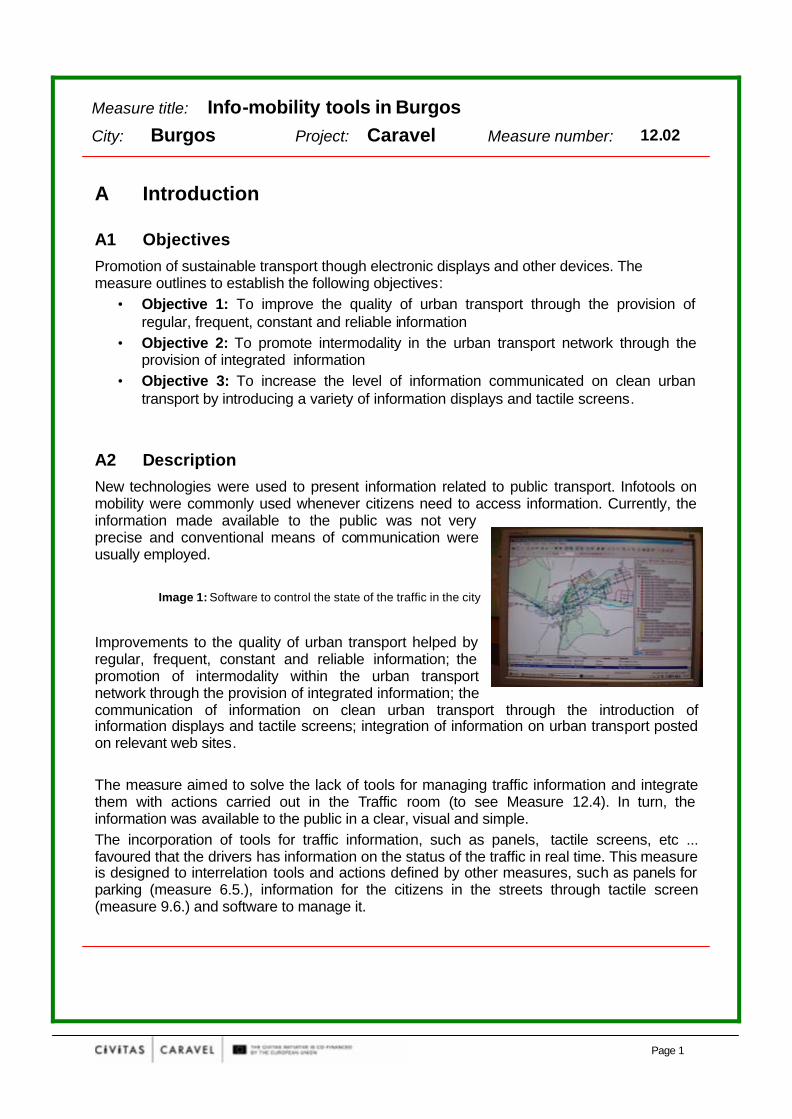
New technologies were used to present information related to public transport. Infotools on mobility were commonly used whenever citizens need to access information. Currently, the information made available to the public was not very precise and conventional means of communication were usually employed.
Image 1: Software to control the state of the traffic in the city
Improvements to the quality of urban transport helped by regular, frequent, constant and reliable information; the promotion of intermodality within the urban transport network through the provision of integrated information; the communication of information on clean urban transport through the introduction of information displays and tactile screens; integration of information on urban transport posted on relevant web sites. The measure aimed to solve the lack of tools for managing traffic information and integrate them with actions carried out in the Traffic room (to see Measure 12.4). In turn, the information was available to the public in a clear, visual and simple. The incorporation of tools for traffic information, such as panels, tactile screens, etc ... favoured that the drivers has information on the status of the traffic in real time. This measure is designed to interrelation tools and actions defined by other measures, such as panels for parking (measure 6.5.), information for the citizens in the streets through tactile screen (measure 9.6.) and software to manage it.
Measure title: Info-mobility tools in Burgos
City: Burgos Project: CARAVEL Measure number: 12.02.
Page 2
B Measure implementation
B1 Innovative aspects
• Provision of information through electronic systems with a high capacity of diffusion
among residents and visitors • Dissemination of information on clean urban transport posted on web sites frequently
visited by residents and visitors to the city This includes the following innovative aspects of the measure are:
• Use of new technology/ITS: Introduction of new panels and web site for
information of traffic flow and traffic conditions
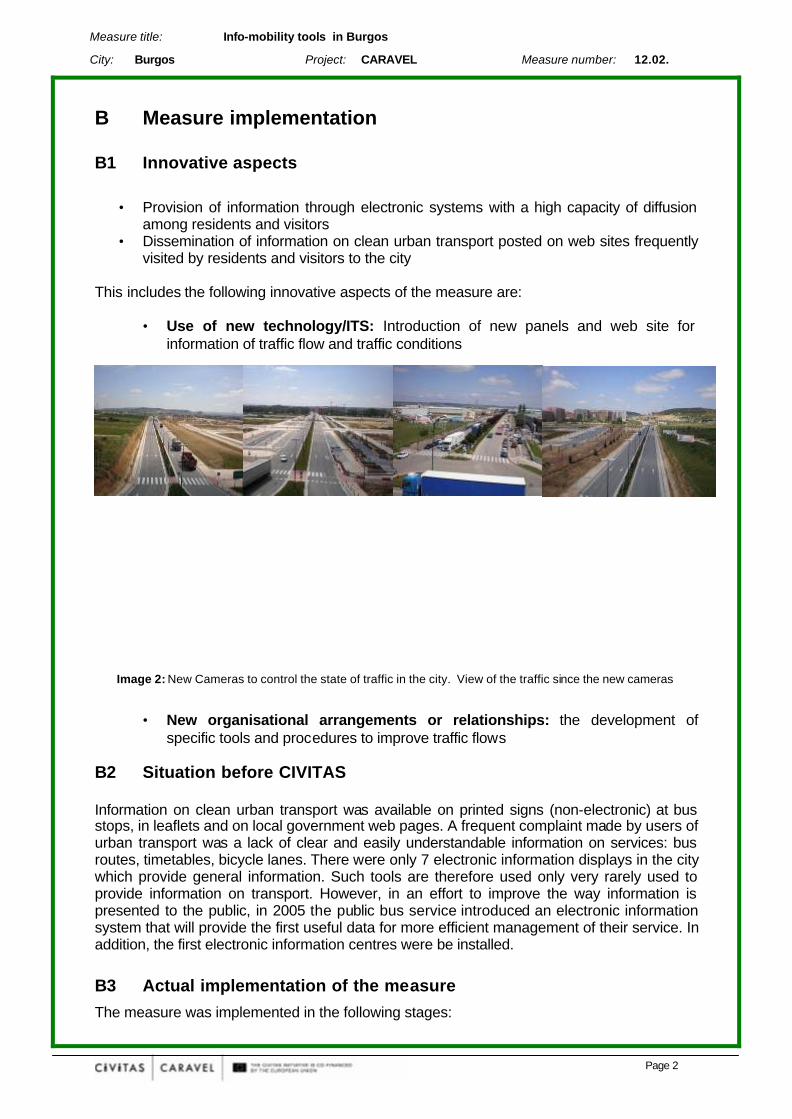
Image 2: New Cameras to control the state of traffic in the city. View of the traffic since the new cameras
• New organisational arrangements or relationships: the development of
specific tools and procedures to improve traffic flows B2 Situation before CIVITAS Information on clean urban transport was available on printed signs (non-electronic) at bus stops, in leaflets and on local government web pages. A frequent complaint made by users of urban transport was a lack of clear and easily understandable information on services: bus routes, timetables, bicycle lanes. There were only 7 electronic information displays in the city which provide general information. Such tools are therefore used only very rarely used to provide information on transport. However, in an effort to improve the way information is presented to the public, in 2005 the public bus service introduced an electronic information system that will provide the first useful data for more efficient management of their service. In addition, the first electronic information centres were be installed.
B3 Actual implementation of the measure
The measure was implemented in the following stages:
Measure title: Info-mobility tools in Burgos
City: Burgos Project: CARAVEL Measure number: 12.02.
Page 3
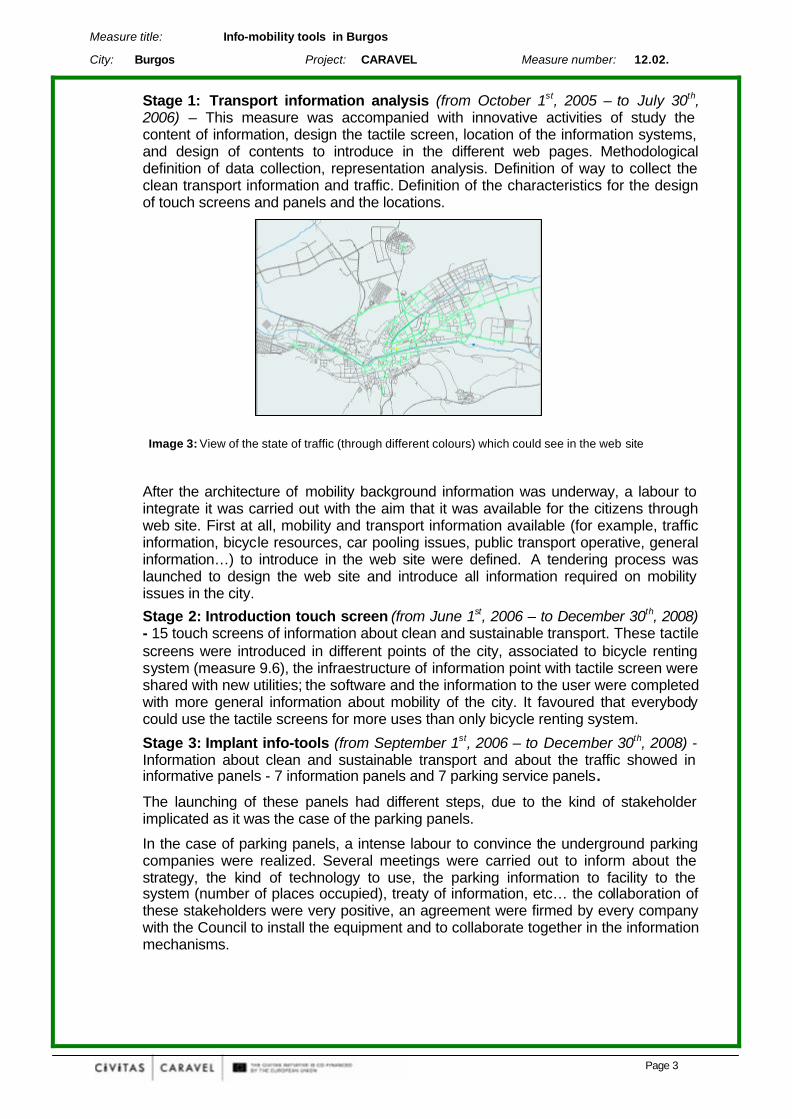
Stage 1: Transport information analysis (from October 1st, 2005 – to July 30th, 2006) – This measure was accompanied with innovative activities of study the content of information, design the tactile screen, location of the information systems, and design of contents to introduce in the different web pages. Methodological definition of data collection, representation analysis. Definition of way to collect the clean transport information and traffic. Definition of the characteristics for the design of touch screens and panels and the locations.
Image 3: View of the state of traffic (through different colours) which could see in the web site
After the architecture of mobility background information was underway, a labour to integrate it was carried out with the aim that it was available for the citizens through web site. First at all, mobility and transport information available (for example, traffic information, bicycle resources, car pooling issues, public transport operative, general information…) to introduce in the web site were defined. A tendering process was launched to design the web site and introduce all information required on mobility issues in the city.
Stage 2: Introduction touch screen (from June 1st, 2006 – to December 30th, 2008) - 15 touch screens of information about clean and sustainable transport. These tactile screens were introduced in different points of the city, associated to bicycle renting system (measure 9.6), the infraestructure of information point with tactile screen were shared with new utilities; the software and the information to the user were completed with more general information about mobility of the city. It favoured that everybody could use the tactile screens for more uses than only bicycle renting system.
Stage 3: Implant info-tools (from September 1st, 2006 – to December 30th, 2008) - Information about clean and sustainable transport and about the traffic showed in informative panels - 7 information panels and 7 parking service panels.
The launching of these panels had different steps, due to the kind of stakeholder implicated as it was the case of the parking panels.
In the case of parking panels, a intense labour to convince the underground parking companies were realized. Several meetings were carried out to inform about the strategy, the kind of technology to use, the parking information to facility to the system (number of places occupied), treaty of information, etc… the collaboration of these stakeholders were very positive, an agreement were firmed by every company with the Council to install the equipment and to collaborate together in the information mechanisms.
Measure title: Info-mobility tools in Burgos
City: Burgos Project: CARAVEL Measure number: 12.02.
Page 4
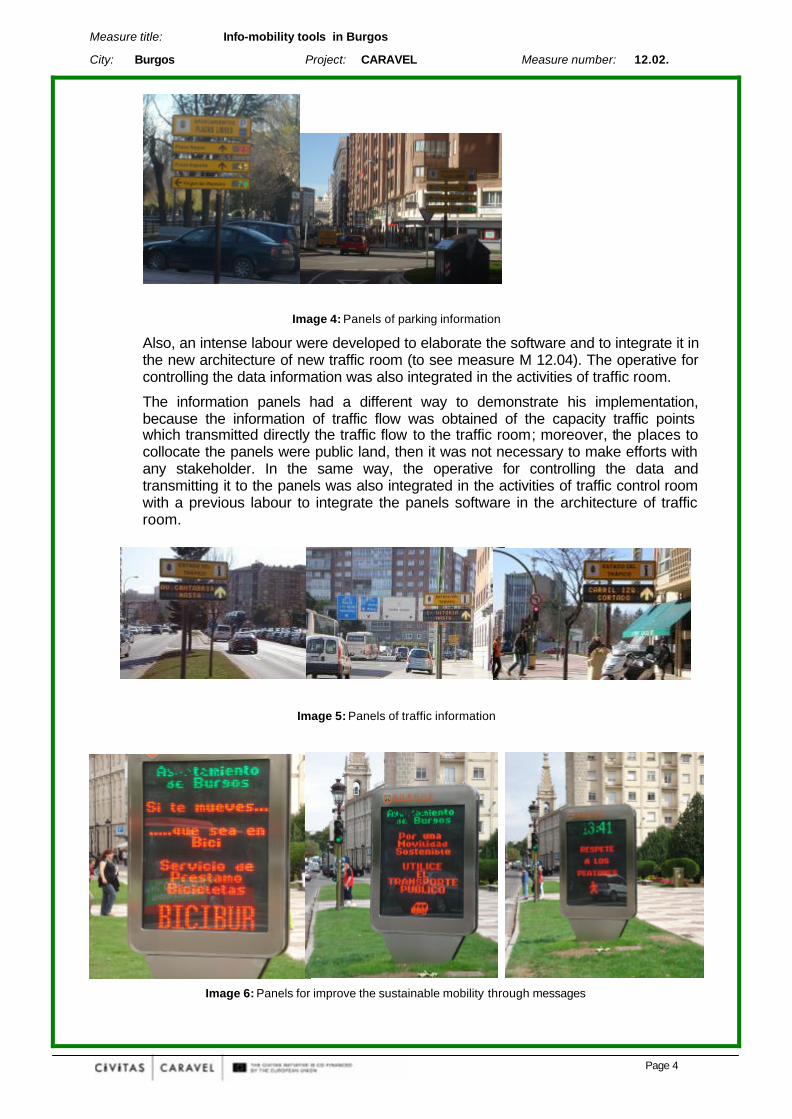
Image 4: Panels of parking information
Also, an intense labour were developed to elaborate the software and to integrate it in the new architecture of new traffic room (to see measure M 12.04). The operative for controlling the data information was also integrated in the activities of traffic room.
The information panels had a different way to demonstrate his implementation, because the information of traffic flow was obtained of the capacity traffic points which transmitted directly the traffic flow to the traffic room; moreover, the places to collocate the panels were public land, then it was not necessary to make efforts with any stakeholder. In the same way, the operative for controlling the data and transmitting it to the panels was also integrated in the activities of traffic control room with a previous labour to integrate the panels software in the architecture of traffic room.
Image 5: Panels of traffic information
Image 6: Panels for improve the sustainable mobility through messages
Measure title: Info-mobility tools in Burgos
City: Burgos Project: CARAVEL Measure number: 12.02.
Page 5
In other hand, the panels for bus stops on real time information were introduced according to the demonstrations phases of measure 08.02. The control of the panels was addressed to the bus control room and without connections with the traffic control room. However, the information of buses and bus stop on real time information was included in the architecture of web site.
Stage 4: Promotion (from February 15th, 2006– to June 30th, 2008) – Information to the citizens about the new tools though communication campaigns. New panels were installed in specific points of the city to aware the citizens about mobility and transport issues. Many messages about sustainable modes of transport are continuously sending to the panels to increase the awareness of the citizens.
Stage 5: Evaluation of the activities (from February 1st, 2005 – to September 31st, 2008) – All the evaluation activities were performed according to the evaluation plan.
B4 Deviations from the original plan
No problems have been arisen during the implementation. All foreseen activities run well.
B5 Inter-relationships with other measures
The measure is related to other measures as follows:
• Measure 6.5. - Parking strategy and management in Burgos - Panels of information of parking
• Measure 8.2. - Clean high mobility services in Burgos - Bus stop with panels of electronic information and inter-modality services
• Measure 11.2 - Sustainable mobility marketing in Burgos. – Several campaigns have been developed to communication the new info-tools introduced.
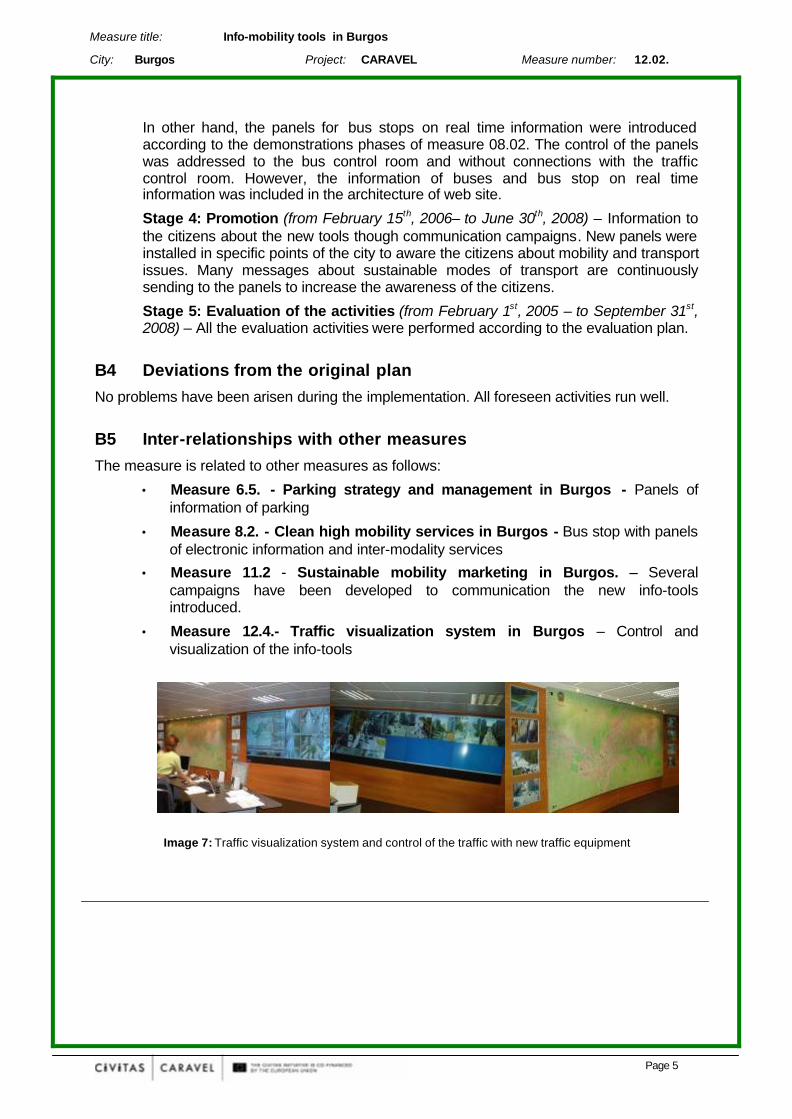
• Measure 12.4.- Traffic visualization system in Burgos – Control and visualization of the info-tools
Image 7: Traffic visualization system and control of the traffic with new traffic equipment
Measure title: Info-mobility tools in Burgos
City: Burgos Project: CARAVEL Measure number: 12.02.
Page 6
C Evaluation – methodology and results
C1 Measurement methodology
C1.1 Impacts and Indicators
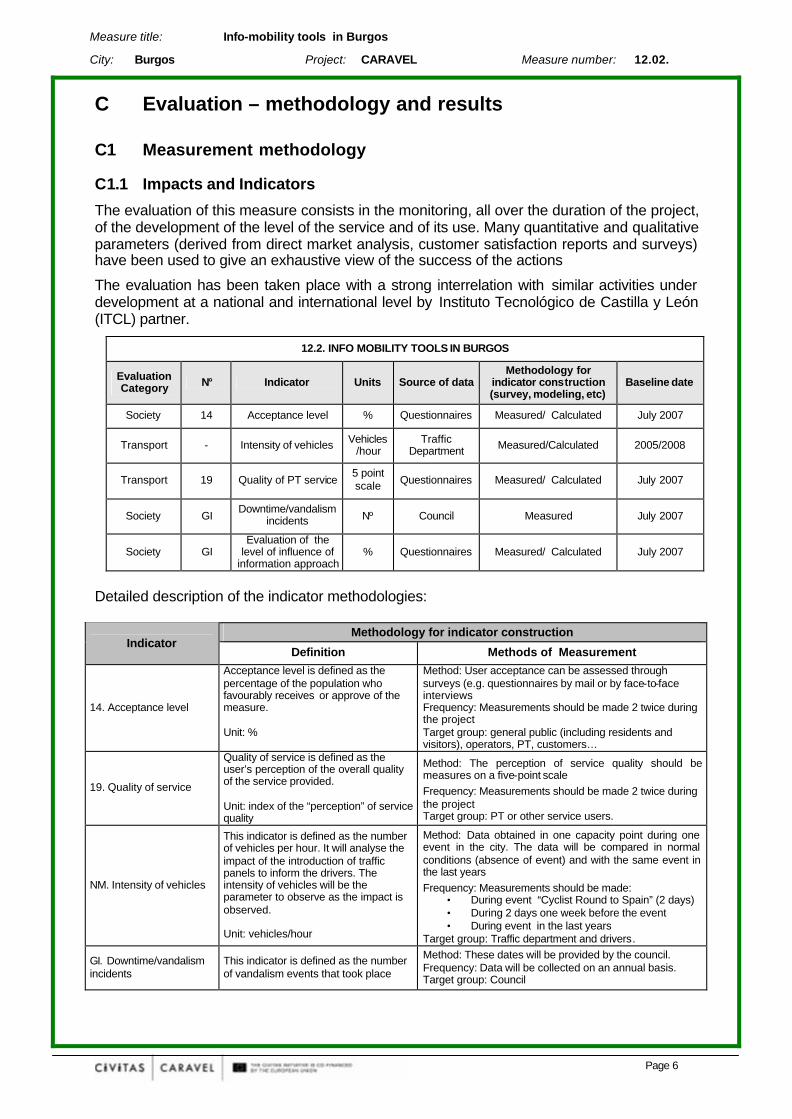
The evaluation of this measure consists in the monitoring, all over the duration of the project, of the development of the level of the service and of its use. Many quantitative and qualitative parameters (derived from direct market analysis, customer satisfaction reports and surveys) have been used to give an exhaustive view of the success of the actions
The evaluation has been taken place with a strong interrelation with similar activities under development at a national and international level by Instituto Tecnológico de Castilla y León (ITCL) partner.
12.2. INFO MOBILITY TOOLS IN BURGOS
Evaluation Category N° Indicator Units Source of data
Methodology for indicator construction (survey, modeling, etc)
Baseline date
Society 14 Acceptance level % Questionnaires Measured/ Calculated July 2007
Transport - Intensity of vehicles Vehicles/hour
Traffic Department Measured/Calculated 2005/2008
Transport 19 Quality of PT service 5 point scale Questionnaires Measured/ Calculated July 2007
Society GI Downtime/vandalism
incidents Nº Council Measured July 2007
Society GI Evaluation of the
level of influence of information approach
% Questionnaires Measured/ Calculated July 2007
Detailed description of the indicator methodologies:
Methodology for indicator construction Indicator
Definition Methods of Measurement
14. Acceptance level
Acceptance level is defined as the percentage of the population who favourably receives or approve of the measure. Unit: %
Method: User acceptance can be assessed through surveys (e.g. questionnaires by mail or by face-to-face interviews Frequency: Measurements should be made 2 twice during the project Target group: general public (including residents and visitors), operators, PT, customers…
19. Quality of service
Quality of service is defined as the user’s perception of the overall quality of the service provided. Unit: index of the “perception” of service quality
Method: The perception of service quality should be measures on a five-point scale Frequency: Measurements should be made 2 twice during the project Target group: PT or other service users.
NM. Intensity of vehicles
This indicator is defined as the number of vehicles per hour. It will analyse the impact of the introduction of traffic panels to inform the drivers. The intensity of vehicles will be the parameter to observe as the impact is observed. Unit: vehicles/hour
Method: Data obtained in one capacity point during one event in the city. The data will be compared in normal conditions (absence of event) and with the same event in the last years Frequency: Measurements should be made:
• During event “Cyclist Round to Spain” (2 days) • During 2 days one week before the event • During event in the last years
Target group: Traffic department and drivers.
GI. Downtime/vandalism incidents
This indicator is defined as the number of vandalism events that took place
Method: These dates will be provided by the council. Frequency: Data will be collected on an annual basis. Target group: Council
Measure title: Info-mobility tools in Burgos
City: Burgos Project: CARAVEL Measure number: 12.02.
Page 7
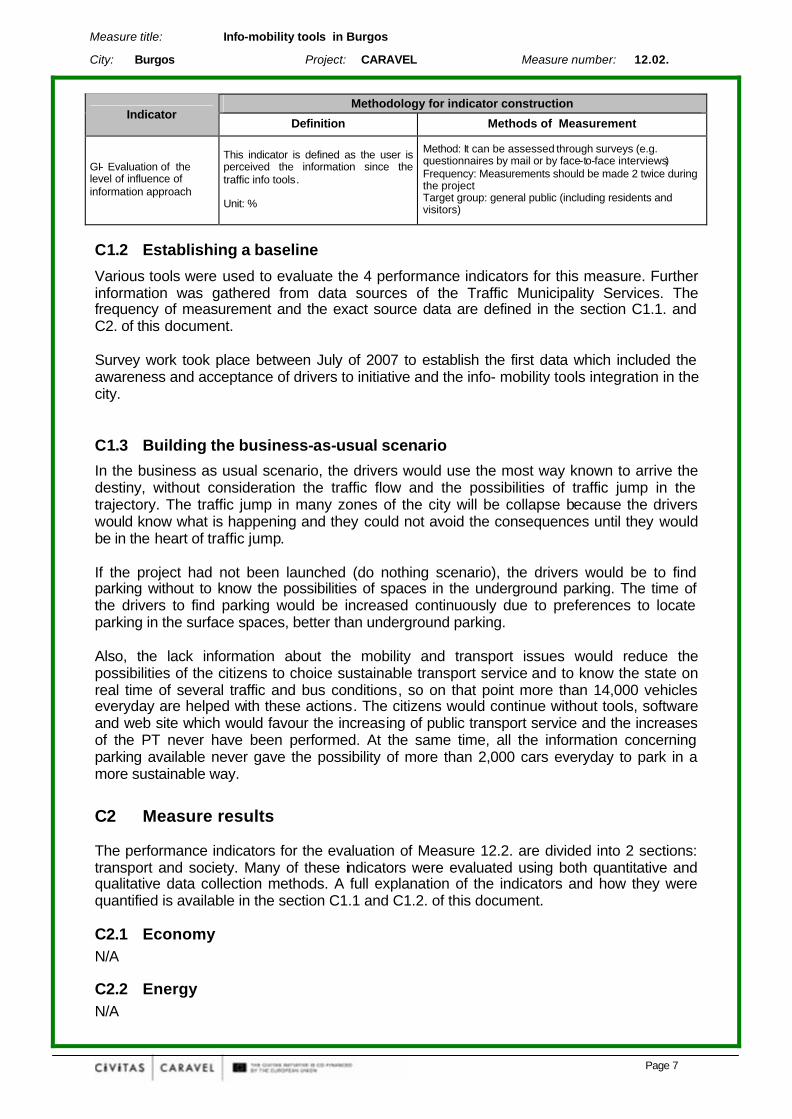
Methodology for indicator construction Indicator
Definition Methods of Measurement
GI- Evaluation of the level of influence of information approach
This indicator is defined as the user is perceived the information since the traffic info tools. Unit: %
Method: It can be assessed through surveys (e.g. questionnaires by mail or by face-to-face interviews) Frequency: Measurements should be made 2 twice during the project Target group: general public (including residents and visitors)
C1.2 Establishing a baseline
Various tools were used to evaluate the 4 performance indicators for this measure. Further information was gathered from data sources of the Traffic Municipality Services. The frequency of measurement and the exact source data are defined in the section C1.1. and C2. of this document. Survey work took place between July of 2007 to establish the first data which included the awareness and acceptance of drivers to initiative and the info- mobility tools integration in the city.
C1.3 Building the business-as-usual scenario
In the business as usual scenario, the drivers would use the most way known to arrive the destiny, without consideration the traffic flow and the possibilities of traffic jump in the trajectory. The traffic jump in many zones of the city will be collapse because the drivers would know what is happening and they could not avoid the consequences until they would be in the heart of traffic jump. If the project had not been launched (do nothing scenario), the drivers would be to find parking without to know the possibilities of spaces in the underground parking. The time of the drivers to find parking would be increased continuously due to preferences to locate parking in the surface spaces, better than underground parking. Also, the lack information about the mobility and transport issues would reduce the possibilities of the citizens to choice sustainable transport service and to know the state on real time of several traffic and bus conditions, so on that point more than 14,000 vehicles everyday are helped with these actions. The citizens would continue without tools, software and web site which would favour the increasing of public transport service and the increases of the PT never have been performed. At the same time, all the information concerning parking available never gave the possibility of more than 2,000 cars everyday to park in a more sustainable way.
C2 Measure results
The performance indicators for the evaluation of Measure 12.2. are divided into 2 sections: transport and society. Many of these indicators were evaluated using both quantitative and qualitative data collection methods. A full explanation of the indicators and how they were quantified is available in the section C1.1 and C1.2. of this document.
C2.1 Economy N/A
C2.2 Energy N/A
Measure title: Info-mobility tools in Burgos
City: Burgos Project: CARAVEL Measure number: 12.02.
Page 8
C2.3 Environment N/A
C2.4 Transport Indicator – Diary vehicles and intensity vehicles per day To demonstrate the impact of the traffic panels in the movement of the vehicles is the proposal of the transport results. To explain it, it is important the following assumptions:
• The intensity of vehicles is not modified in normal conditions, except some important event or other restrictions in the streets
• The info-tools are to help the drivers and modified punctually the movements in the city.
To observe the impact of the panels, it has selected one famous event which has two days of duration. It provokes important restrictions in the normal traffic flow. The event is the “Vuelta Ciclista a España (Cyclist Tour in Spain)”. This event produces that some parts of the city should eliminate the parking space and the circulation in concrete roads during some hours in the days while the Vuelta is in the city. It causes that the drivers have to change the habits during the duration of the event (find new parking space, alternatives to cross the city during the event, deviation of the traffic flow…). To asses the impact, it has been selected one capacity point where the Vuelta is always crossing the city. The dates for analyse the effects are explained to continue:
First – The last Vuelta was realized the 2008 year (10/09 and 11/09). All the data was taken from those days. To compare the effects, the data of the same point was compiled (to see Table 1) regarding to one week before (03/09 and 04/09) in the same day of the week.
Second – As the traffic panels were already operative in 2008, a test was performed during the last Vuelta. In the previous hours of the beginning the traffic panels show some messages to inform the drivers: “Because of the Vuelta, in the Catedral area the access will be restricted during 10/11-09, hours….).
Third – The arrival moment of the Vuelta was around 16:00 h the 10/09/08 and the leaving time was programmed 11:00 h the 11/09/08. The restrictions and messengers in the traffic panels were active from 13:00 h (10/09) to 12:00 h (11/09).
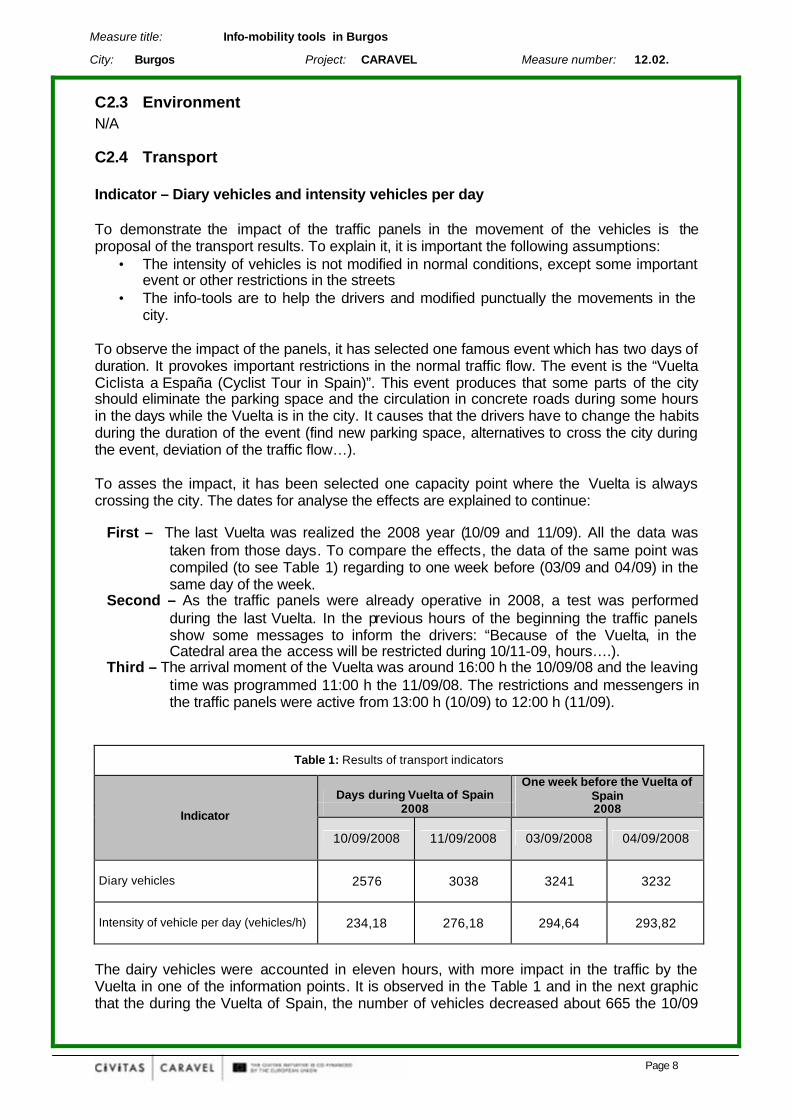
Table 1: Results of transport indicators
Days during Vuelta of Spain One week before the Vuelta of
Spain 2008 2008 Indicator
10/09/2008 11/09/2008 03/09/2008 04/09/2008
Diary vehicles 2576 3038 3241 3232
Intensity of vehicle per day (vehicles/h) 234,18 276,18 294,64 293,82
The dairy vehicles were accounted in eleven hours, with more impact in the traffic by the Vuelta in one of the information points. It is observed in the Table 1 and in the next graphic that the during the Vuelta of Spain, the number of vehicles decreased about 665 the 10/09
Measure title: Info-mobility tools in Burgos
City: Burgos Project: CARAVEL Measure number: 12.02.
Page 9
Relation traffic panels and number of vehicles
0
50
100
150
200
250
300
350
400
450
500
11:00 12:00 13:00 14:00 15:00 16:00 17:00 18:00 19:00 20:00 21:00Hours
Nu
mb
er o
f veh
icle
s
03/09/2008
04/09/2008
10/09/2008
11/09/2008
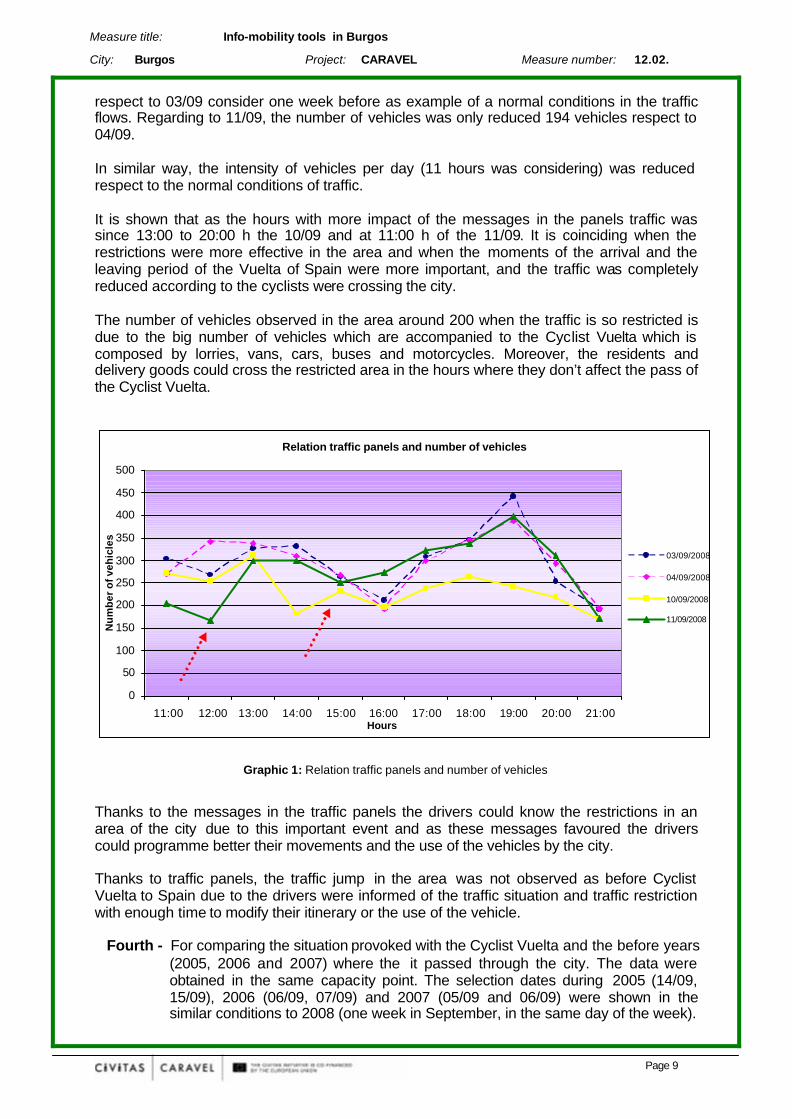
respect to 03/09 consider one week before as example of a normal conditions in the traffic flows. Regarding to 11/09, the number of vehicles was only reduced 194 vehicles respect to 04/09. In similar way, the intensity of vehicles per day (11 hours was considering) was reduced respect to the normal conditions of traffic. It is shown that as the hours with more impact of the messages in the panels traffic was since 13:00 to 20:00 h the 10/09 and at 11:00 h of the 11/09. It is coinciding when the restrictions were more effective in the area and when the moments of the arrival and the leaving period of the Vuelta of Spain were more important, and the traffic was completely reduced according to the cyclists were crossing the city. The number of vehicles observed in the area around 200 when the traffic is so restricted is due to the big number of vehicles which are accompanied to the Cyclist Vuelta which is composed by lorries, vans, cars, buses and motorcycles. Moreover, the residents and delivery goods could cross the restricted area in the hours where they don’t affect the pass of the Cyclist Vuelta.
Graphic 1: Relation traffic panels and number of vehicles
Thanks to the messages in the traffic panels the drivers could know the restrictions in an area of the city due to this important event and as these messages favoured the drivers could programme better their movements and the use of the vehicles by the city. Thanks to traffic panels, the traffic jump in the area was not observed as before Cyclist Vuelta to Spain due to the drivers were informed of the traffic situation and traffic restriction with enough time to modify their itinerary or the use of the vehicle.
Fourth - For comparing the situation provoked with the Cyclist Vuelta and the before years
(2005, 2006 and 2007) where the it passed through the city. The data were obtained in the same capacity point. The selection dates during 2005 (14/09, 15/09), 2006 (06/09, 07/09) and 2007 (05/09 and 06/09) were shown in the similar conditions to 2008 (one week in September, in the same day of the week).
Measure title: Info-mobility tools in Burgos
City: Burgos Project: CARAVEL Measure number: 12.02.
Page 10
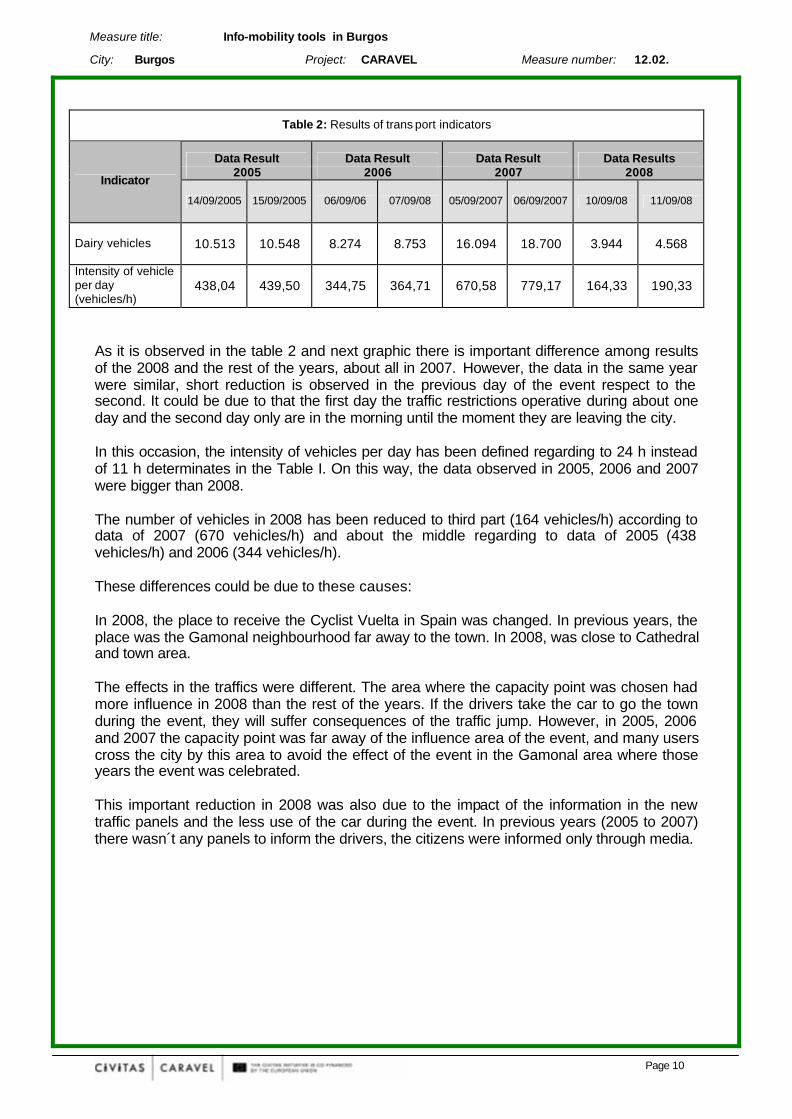
Table 2: Results of trans port indicators
Data Result Data Result Data Result Data Results 2005 2006 2007 2008
Indicator
14/09/2005 15/09/2005 06/09/06 07/09/08 05/09/2007 06/09/2007 10/09/08 11/09/08
Dairy vehicles 10.513 10.548 8.274 8.753 16.094 18.700 3.944 4.568
Intensity of vehicle per day (vehicles/h)
438,04 439,50 344,75 364,71 670,58 779,17 164,33 190,33
As it is observed in the table 2 and next graphic there is important difference among results of the 2008 and the rest of the years, about all in 2007. However, the data in the same year were similar, short reduction is observed in the previous day of the event respect to the second. It could be due to that the first day the traffic restrictions operative during about one day and the second day only are in the morning until the moment they are leaving the city. In this occasion, the intensity of vehicles per day has been defined regarding to 24 h instead of 11 h determinates in the Table I. On this way, the data observed in 2005, 2006 and 2007 were bigger than 2008. The number of vehicles in 2008 has been reduced to third part (164 vehicles/h) according to data of 2007 (670 vehicles/h) and about the middle regarding to data of 2005 (438 vehicles/h) and 2006 (344 vehicles/h). These differences could be due to these causes: In 2008, the place to receive the Cyclist Vuelta in Spain was changed. In previous years, the place was the Gamonal neighbourhood far away to the town. In 2008, was close to Cathedral and town area. The effects in the traffics were different. The area where the capacity point was chosen had more influence in 2008 than the rest of the years. If the drivers take the car to go the town during the event, they will suffer consequences of the traffic jump. However, in 2005, 2006 and 2007 the capacity point was far away of the influence area of the event, and many users cross the city by this area to avoid the effect of the event in the Gamonal area where those years the event was celebrated. This important reduction in 2008 was also due to the impact of the information in the new traffic panels and the less use of the car during the event. In previous years (2005 to 2007) there wasn´t any panels to inform the drivers, the citizens were informed only through media.
Measure title: Info-mobility tools in Burgos
City: Burgos Project: CARAVEL Measure number: 12.02.
Page 11
Comparison of Vehicles during the Cyclist Round to Spain per every year
0
200
400
600
800
1000
1200
1400
1600
0:00
1:00
2:00
3:00
4:00
5:00
6:00
7:00
8:00
9:00
10:00
11:00
12:00
13:00
14:00
15:00
16:00
17:00
18:00
19:00
20:00
21:00
22:00
23:00
Hours
Nu
mb
er o
f Veh
icle
s
14/09/2005
15/09/2005
06/09/2006
07/09/2006
05/09/2007
06/09/2007
10/09/2008
11/09/2008
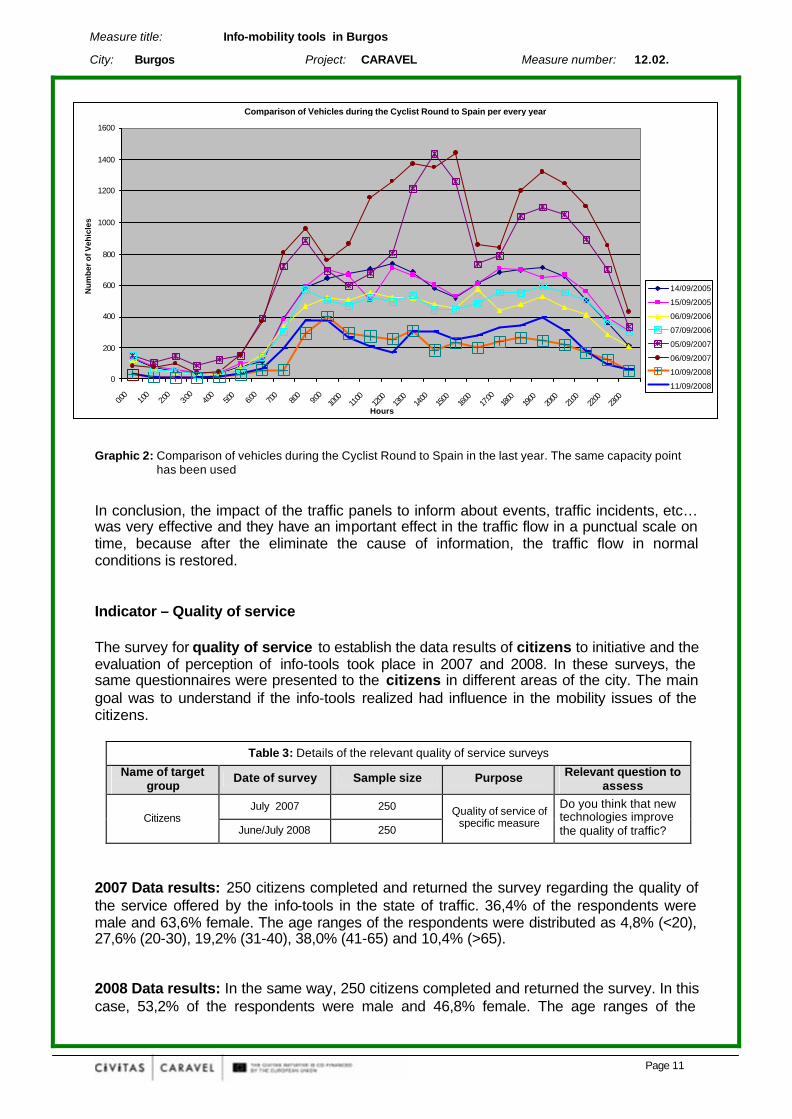
Graphic 2: Comparison of vehicles during the Cyclist Round to Spain in the last year. The same capacity point
has been used
In conclusion, the impact of the traffic panels to inform about events, traffic incidents, etc… was very effective and they have an important effect in the traffic flow in a punctual scale on time, because after the eliminate the cause of information, the traffic flow in normal conditions is restored. Indicator – Quality of service The survey for quality of service to establish the data results of citizens to initiative and the evaluation of perception of info-tools took place in 2007 and 2008. In these surveys, the same questionnaires were presented to the citizens in different areas of the city. The main goal was to understand if the info-tools realized had influence in the mobility issues of the citizens.
Table 3: Details of the relevant quality of service surveys Name of target
group Date of survey Sample size Purpose Relevant question to
assess
July 2007 250 Citizens
June/July 2008 250
Quality of service of specific measure
Do you think that new technologies improve the quality of traffic?
2007 Data results: 250 citizens completed and returned the survey regarding the quality of the service offered by the info-tools in the state of traffic. 36,4% of the respondents were male and 63,6% female. The age ranges of the respondents were distributed as 4,8% (<20), 27,6% (20-30), 19,2% (31-40), 38,0% (41-65) and 10,4% (>65). 2008 Data results: In the same way, 250 citizens completed and returned the survey. In this case, 53,2% of the respondents were male and 46,8% female. The age ranges of the
Measure title: Info-mobility tools in Burgos
City: Burgos Project: CARAVEL Measure number: 12.02.
Page 12
New technologies improve the quality of traffic
No2%
Yes98%
New technologies improve the quality of trafficNo
17%
Yes83%
respondents were distributed as 6,3% (<20), 21,6% (20-30), 27,1% (31-40), 27,9% (41-65) and 17,1% (>65).
Table 4: Results of transport indicators
Data Result Data Result Indicator Relevant Question 2007 2008
(19) Quality of service Do you think that new technologies improve the quality of traffic?
YES: 83% NO: 17%
YES: 98% NO: 2%
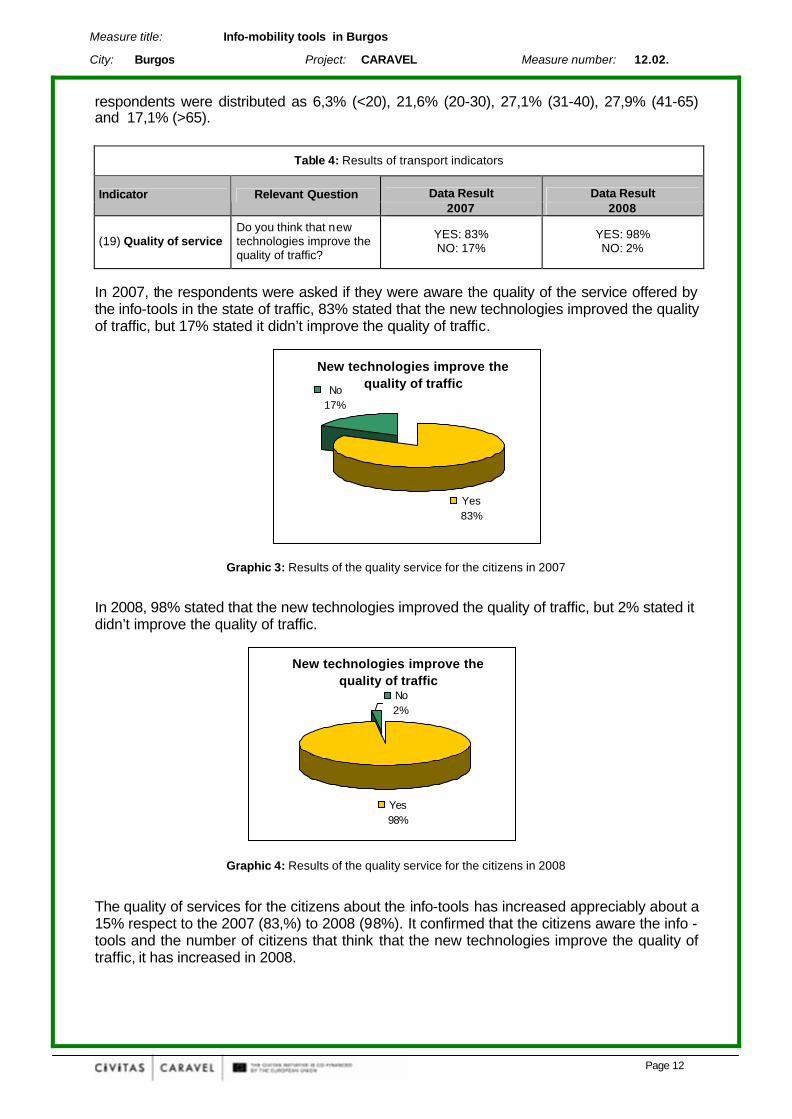
In 2007, the respondents were asked if they were aware the quality of the service offered by the info-tools in the state of traffic, 83% stated that the new technologies improved the quality of traffic, but 17% stated it didn’t improve the quality of traffic.
Graphic 3: Results of the quality service for the citizens in 2007
In 2008, 98% stated that the new technologies improved the quality of traffic, but 2% stated it didn’t improve the quality of traffic.
Graphic 4: Results of the quality service for the citizens in 2008
The quality of services for the citizens about the info-tools has increased appreciably about a 15% respect to the 2007 (83,%) to 2008 (98%). It confirmed that the citizens aware the info - tools and the number of citizens that think that the new technologies improve the quality of traffic, it has increased in 2008.
Measure title: Info-mobility tools in Burgos
City: Burgos Project: CARAVEL Measure number: 12.02.
Page 13
82,73% 17,27%
98,14% 1,86%
0% 20% 40% 60% 80% 100%
Percentage
2007
2008
New technologies improve the quality of traffic
Yes
No
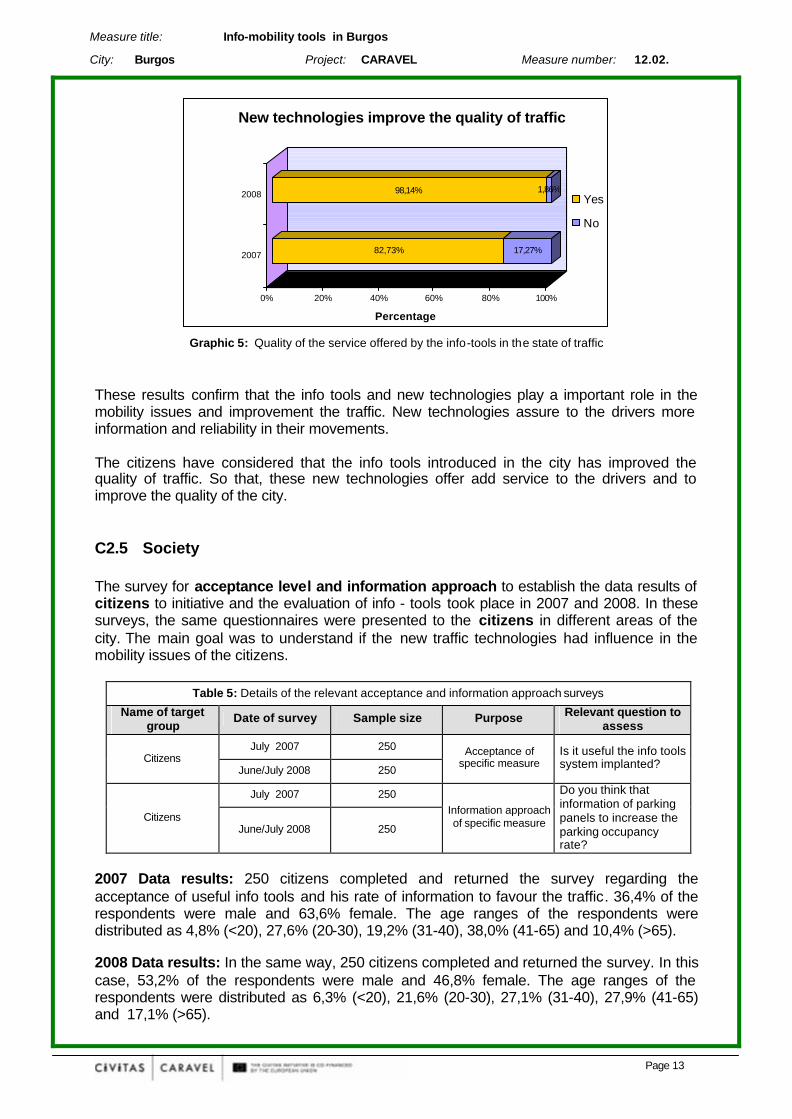
Graphic 5: Quality of the service offered by the info-tools in the state of traffic
These results confirm that the info tools and new technologies play a important role in the mobility issues and improvement the traffic. New technologies assure to the drivers more information and reliability in their movements. The citizens have considered that the info tools introduced in the city has improved the quality of traffic. So that, these new technologies offer add service to the drivers and to improve the quality of the city.
C2.5 Society The survey for acceptance level and information approach to establish the data results of citizens to initiative and the evaluation of info - tools took place in 2007 and 2008. In these surveys, the same questionnaires were presented to the citizens in different areas of the city. The main goal was to understand if the new traffic technologies had influence in the mobility issues of the citizens.
Table 5: Details of the relevant acceptance and information approach surveys Name of target
group Date of survey Sample size Purpose Relevant question to
assess
July 2007 250 Citizens
June/July 2008 250
Acceptance of specific measure
Is it useful the info tools system implanted?
July 2007 250
Citizens June/July 2008 250
Information approach of specific measure
Do you think that information of parking panels to increase the parking occupancy rate?
2007 Data results: 250 citizens completed and returned the survey regarding the acceptance of useful info tools and his rate of information to favour the traffic. 36,4% of the respondents were male and 63,6% female. The age ranges of the respondents were distributed as 4,8% (<20), 27,6% (20-30), 19,2% (31-40), 38,0% (41-65) and 10,4% (>65). 2008 Data results: In the same way, 250 citizens completed and returned the survey. In this case, 53,2% of the respondents were male and 46,8% female. The age ranges of the respondents were distributed as 6,3% (<20), 21,6% (20-30), 27,1% (31-40), 27,9% (41-65) and 17,1% (>65).
Measure title: Info-mobility tools in Burgos
City: Burgos Project: CARAVEL Measure number: 12.02.
Page 14
Acceptance of useful info tools
No13%
Yes87%
Acceptance of useful info tools
No20%
Yes80%
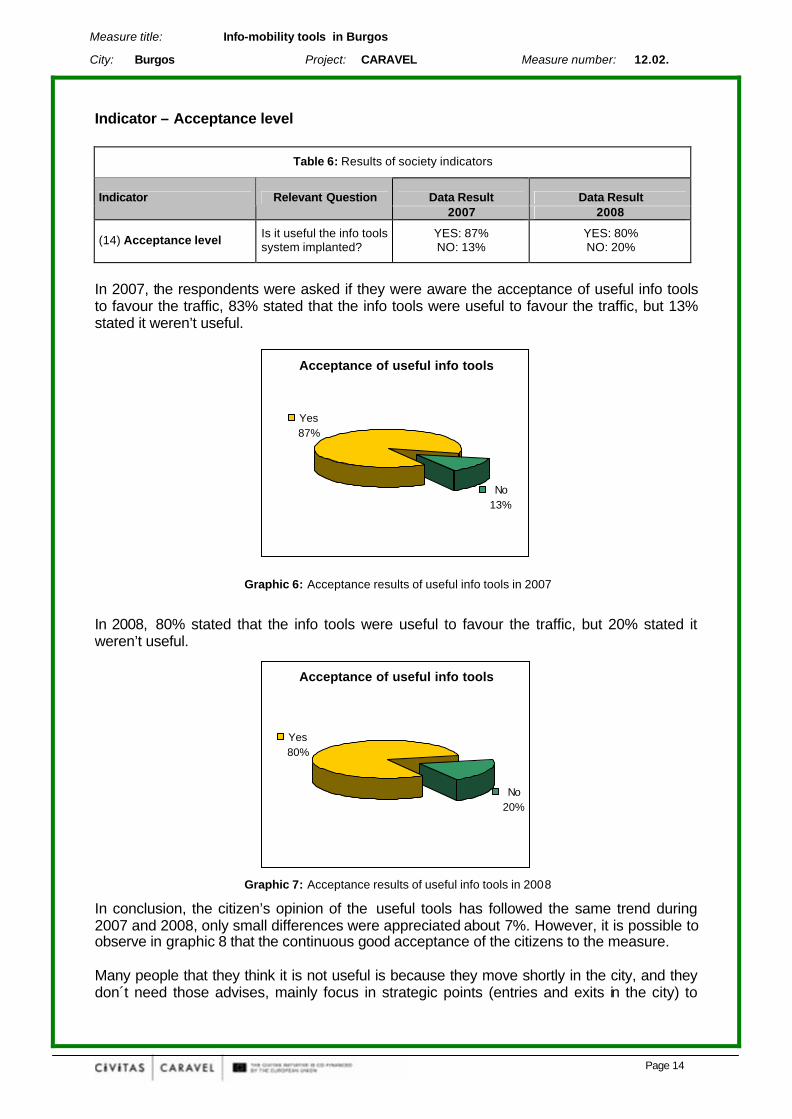
Indicator – Acceptance level
Table 6: Results of society indicators
Data Result Data Result Indicator Relevant Question
2007 2008
(14) Acceptance level Is it useful the info tools system implanted?
YES: 87% NO: 13%
YES: 80% NO: 20%
In 2007, the respondents were asked if they were aware the acceptance of useful info tools to favour the traffic, 83% stated that the info tools were useful to favour the traffic, but 13% stated it weren’t useful. Graphic 6: Acceptance results of useful info tools in 2007
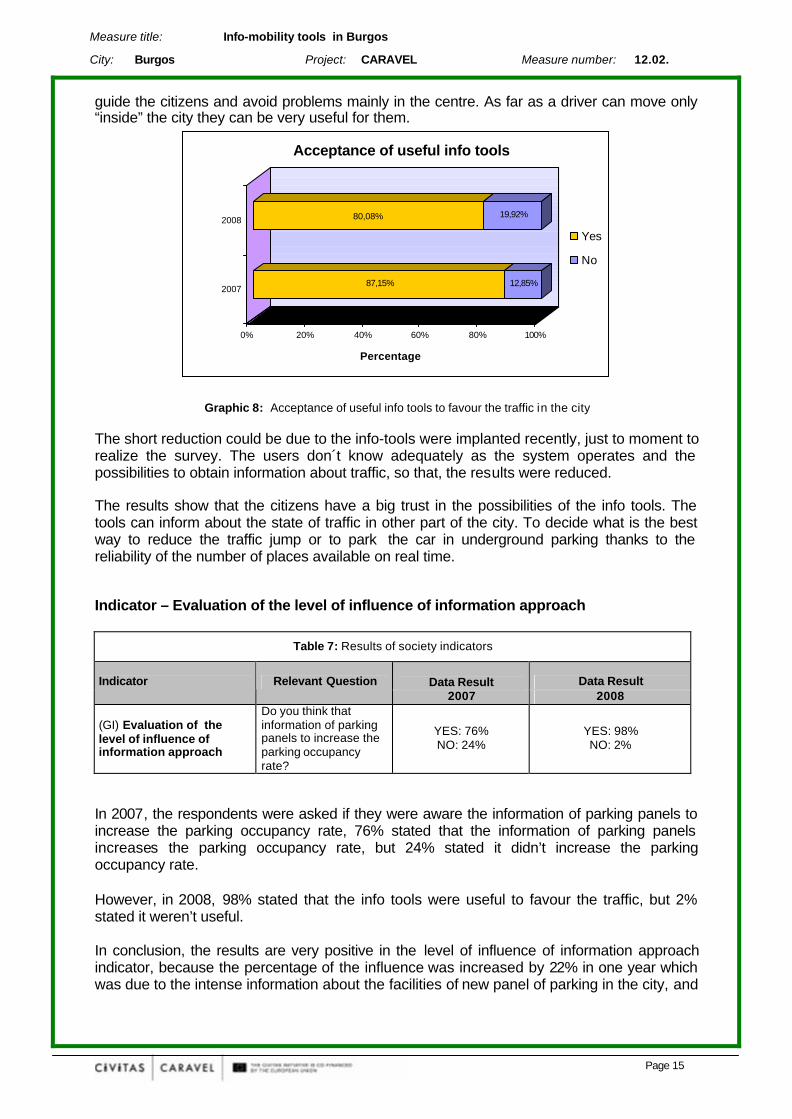
In 2008, 80% stated that the info tools were useful to favour the traffic, but 20% stated it weren’t useful. Graphic 7: Acceptance results of useful info tools in 2008
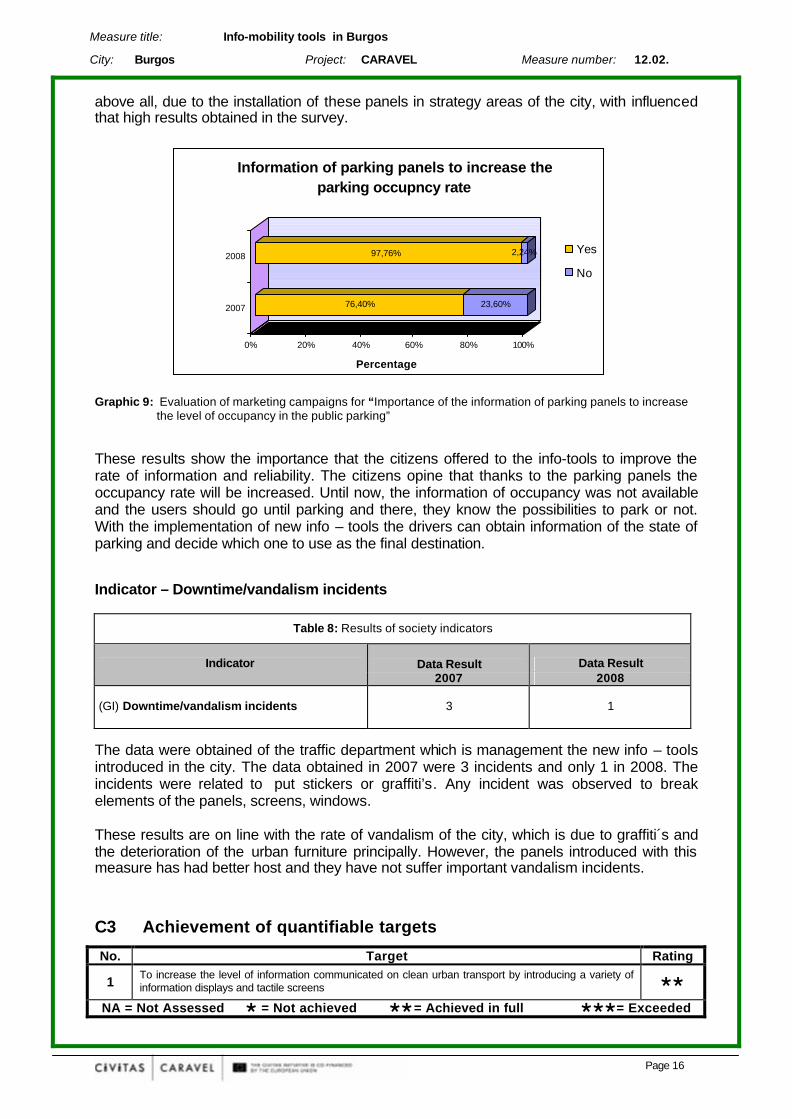
In conclusion, the citizen’s opinion of the useful tools has followed the same trend during 2007 and 2008, only small differences were appreciated about 7%. However, it is possible to observe in graphic 8 that the continuous good acceptance of the citizens to the measure. Many people that they think it is not useful is because they move shortly in the city, and they don´t need those advises, mainly focus in strategic points (entries and exits in the city) to
Measure title: Info-mobility tools in Burgos
City: Burgos Project: CARAVEL Measure number: 12.02.
Page 15
guide the citizens and avoid problems mainly in the centre. As far as a driver can move only “inside” the city they can be very useful for them.
87,15% 12,85%
80,08% 19,92%
0% 20% 40% 60% 80% 100%
Percentage
2007
2008
Acceptance of useful info tools
Yes
No
Graphic 8: Acceptance of useful info tools to favour the traffic in the city The short reduction could be due to the info-tools were implanted recently, just to moment to realize the survey. The users don´t know adequately as the system operates and the possibilities to obtain information about traffic, so that, the results were reduced. The results show that the citizens have a big trust in the possibilities of the info tools. The tools can inform about the state of traffic in other part of the city. To decide what is the best way to reduce the traffic jump or to park the car in underground parking thanks to the reliability of the number of places available on real time. Indicator – Evaluation of the level of influence of information approach
Table 7: Results of society indicators
Data Result Data Result Indicator Relevant Question
2007 2008
(GI) Evaluation of the level of influence of information approach
Do you think that information of parking panels to increase the parking occupancy rate?
YES: 76% NO: 24%
YES: 98% NO: 2%
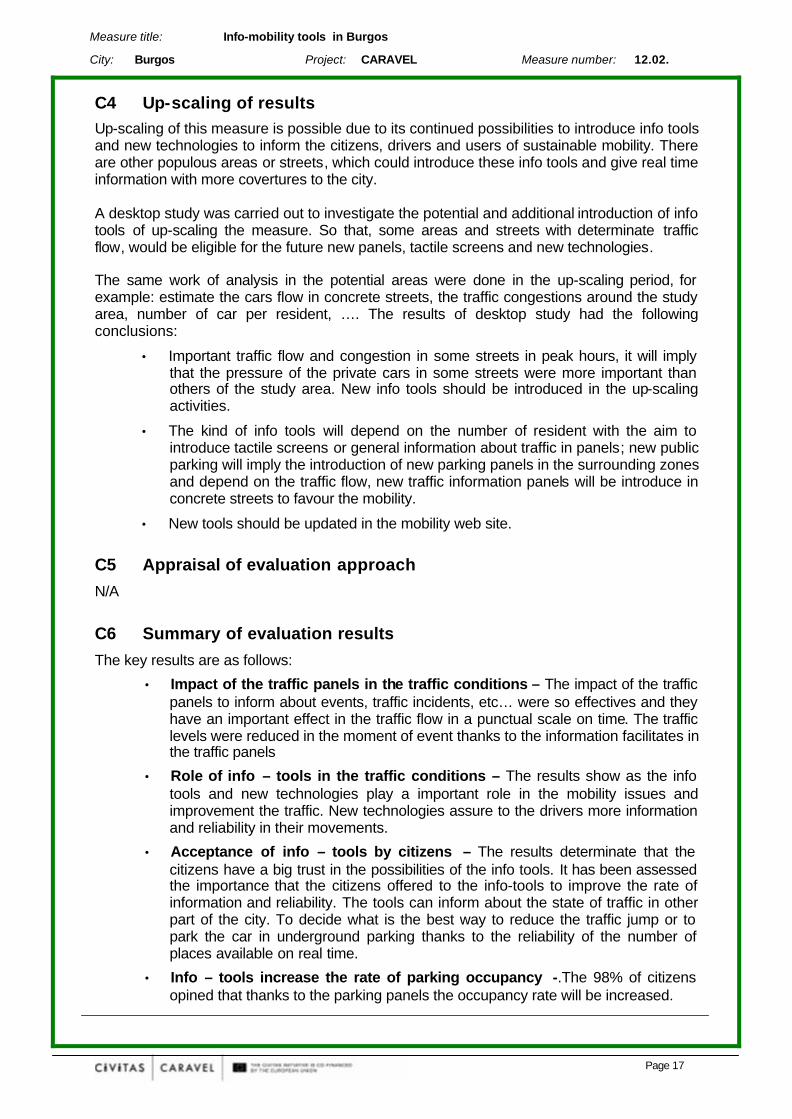
In 2007, the respondents were asked if they were aware the information of parking panels to increase the parking occupancy rate, 76% stated that the information of parking panels increases the parking occupancy rate, but 24% stated it didn’t increase the parking occupancy rate.
However, in 2008, 98% stated that the info tools were useful to favour the traffic, but 2% stated it weren’t useful. In conclusion, the results are very positive in the level of influence of information approach indicator, because the percentage of the influence was increased by 22% in one year which was due to the intense information about the facilities of new panel of parking in the city, and
Measure title: Info-mobility tools in Burgos
City: Burgos Project: CARAVEL Measure number: 12.02.
Page 16
above all, due to the installation of these panels in strategy areas of the city, with influenced that high results obtained in the survey. Graphic 9: Evaluation of marketing campaigns for “Importance of the information of parking panels to increase
the level of occupancy in the public parking” These results show the importance that the citizens offered to the info-tools to improve the rate of information and reliability. The citizens opine that thanks to the parking panels the occupancy rate will be increased. Until now, the information of occupancy was not available and the users should go until parking and there, they know the possibilities to park or not. With the implementation of new info – tools the drivers can obtain information of the state of parking and decide which one to use as the final destination. Indicator – Downtime/vandalism incidents
Table 8: Results of society indicators
Data Result Data Result Indicator
2007 2008
(GI) Downtime/vandalism incidents 3 1
The data were obtained of the traffic department which is management the new info – tools introduced in the city. The data obtained in 2007 were 3 incidents and only 1 in 2008. The incidents were related to put stickers or graffiti’s. Any incident was observed to break elements of the panels, screens, windows. These results are on line with the rate of vandalism of the city, which is due to graffiti´s and the deterioration of the urban furniture principally. However, the panels introduced with this measure has had better host and they have not suffer important vandalism incidents.
C3 Achievement of quantifiable targets
No. Target Rating
1 To increase the level of information communicated on clean urban transport by introducing a variety of information displays and tactile screens ØØ
NA = Not Assessed Ø = Not achieved ØØ= Achieved in full ØØØ= Exceeded
76,40% 23,60%
97,76% 2,24%
0% 20% 40% 60% 80% 100%
Percentage
2007
2008
Information of parking panels to increase the parking occupncy rate
Yes
No
Measure title: Info-mobility tools in Burgos
City: Burgos Project: CARAVEL Measure number: 12.02.
Page 17
C4 Up-scaling of results Up-scaling of this measure is possible due to its continued possibilities to introduce info tools and new technologies to inform the citizens, drivers and users of sustainable mobility. There are other populous areas or streets, which could introduce these info tools and give real time information with more covertures to the city. A desktop study was carried out to investigate the potential and additional introduction of info tools of up-scaling the measure. So that, some areas and streets with determinate traffic flow, would be eligible for the future new panels, tactile screens and new technologies. The same work of analysis in the potential areas were done in the up-scaling period, for example: estimate the cars flow in concrete streets, the traffic congestions around the study area, number of car per resident, …. The results of desktop study had the following conclusions:
• Important traffic flow and congestion in some streets in peak hours, it will imply that the pressure of the private cars in some streets were more important than others of the study area. New info tools should be introduced in the up-scaling activities.
• The kind of info tools will depend on the number of resident with the aim to introduce tactile screens or general information about traffic in panels; new public parking will imply the introduction of new parking panels in the surrounding zones and depend on the traffic flow, new traffic information panels will be introduce in concrete streets to favour the mobility.
• New tools should be updated in the mobility web site.
C5 Appraisal of evaluation approach
N/A
C6 Summary of evaluation results
The key results are as follows:
• Impact of the traffic panels in the traffic conditions – The impact of the traffic panels to inform about events, traffic incidents, etc… were so effectives and they have an important effect in the traffic flow in a punctual scale on time. The traffic levels were reduced in the moment of event thanks to the information facilitates in the traffic panels
• Role of info – tools in the traffic conditions – The results show as the info tools and new technologies play a important role in the mobility issues and improvement the traffic. New technologies assure to the drivers more information and reliability in their movements.
• Acceptance of info – tools by citizens – The results determinate that the citizens have a big trust in the possibilities of the info tools. It has been assessed the importance that the citizens offered to the info-tools to improve the rate of information and reliability. The tools can inform about the state of traffic in other part of the city. To decide what is the best way to reduce the traffic jump or to park the car in underground parking thanks to the reliability of the number of places available on real time.
• Info – tools increase the rate of parking occupancy -.The 98% of citizens opined that thanks to the parking panels the occupancy rate will be increased.
Measure title: Info-mobility tools in Burgos
City: Burgos Project: CARAVEL Measure number: 12.02.
Page 18
D Lessons learned
D1 Barriers and drivers
D1.1 Barriers
• Barrier 1 - Substantial cost increases for major components and budget modifications that might modify the project and any remaining measures. To prevent financial problems, strict control systems would be put in place right from the start of the project. Moreover, the local committee has prepared a contingency plan for such an eventuality.
• Barrier 2 - Failure to keep to the implementation deadlines and to satisfy quality requirements for info-mobility tools, which might delay remaining measures. Then, to avoy problems, clearly planned actions and prompt purchase and installation of the infotools
• Barrier 3 – Opposition of the underground parking companies to collaborate in the implementation of the parking panels. - Many meetings were realized to concrete the issues of the project and the participation of these companies. An agreement was realized by company to concrete the participation of every one.
• Barrier 4 – Introduction of tactile screens due to possible vandalism and high deteriorate of the machines. It was resolved through the equipment with important specifications to resist the environmental conditions of the city and vandalism.
D1.2 Drivers • Driver 1 – Social acceptance to improve the information and communication
about traffic conditions and new tools for improving the sustainable transport.
D2 Participation of stakeholders • Stakeholder 1 - Car drivers: the project tries to facilitate the information on
mobility and traffic in the city which will allow that car drivers can decide the best route to follow and avoid the traffic jump. Several surveys were launched during the project to know their opinion about the introduction of more information through panels
• Stakeholder 2 - Local/regional businesses: Commuters that arrive the city to do business and the panels installed in the city is good tools to inform about the mobility in the city.
• Stakeholder 3 – Underground parking companies: Coordination with this stakeholder to information of the occupancy rate of the underground parking and that these data can be showed in the panels to inform the drivers. Many meetings were realized to concrete the issues of the project and the participation of this target group.
• Stakeholder 4 – Citizens: Information on mobility issues were introduced in the city through different info-tools as panels, tactile screens and web site. Several surveys were launched during the project to know their opinion about the introduction of more information through panels
Measure title: Info-mobility tools in Burgos
City: Burgos Project: CARAVEL Measure number: 12.02.
Page 19
D3 Recommendations • Useful information to the citizens – To introduce new traffic technologies
should be linked to the information and diffusion level with the aim that the citizens known their possibilities and facilities his easy use (as web site, tactile screens, etc…).
• Introduction of clear and short messages – The traffic info tools should be designed to introduce clear and short messages to the drivers and general public with the aim to not divert attention and allow in short space of time reporting about the event, the state of traffic or rate of occupation.
D4 Future activities relating to the measure
New info tools will be introduced to increase the number of traffic panels in other areas of the city. Other intelligent tolls as more cameras or more collected data points will be installed. The touch screens will be implemented in the new bicycle points, and they will include all the information available to the citizens.