Embed Size (px)
DESCRIPTION
Informa Economics 2007 Agriculture Policy Roundtable Commodity Market Update By Jim Sullivan. December 13, 2007. Review of 2007 US Crops. - PowerPoint PPT Presentation
Citation preview
1
Informa Economics 2007 Agriculture Policy Roundtable
Commodity Market Update
ByJim Sullivan
Informa Economics 2007 Agriculture Policy Roundtable
Commodity Market Update
ByJim Sullivan
December 13, 2007
2
Review of 2007 US Crops
• 2007 will be a very good year for US farmers. Higher income primarily result of high prices for grains, oilseeds and livestock. Strong demand from biofuel industry and exports pulling prices higher. Weak US dollar fosters greater effective demand for US exports.
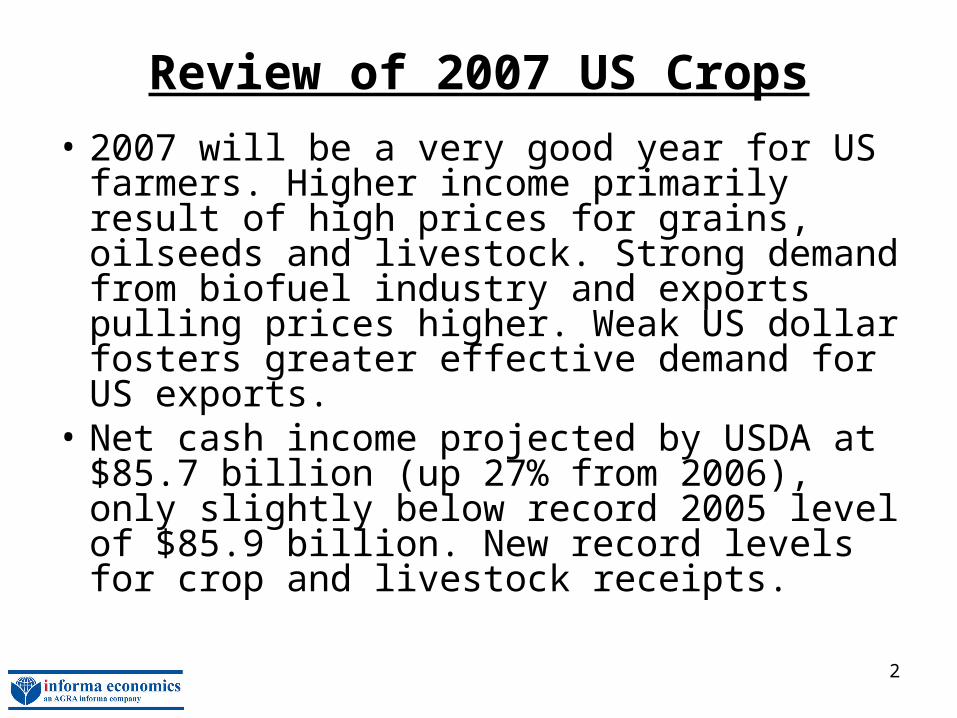
• Net cash income projected by USDA at $85.7 billion (up 27% from 2006), only slightly below record 2005 level of $85.9 billion. New record levels for crop and livestock receipts.
3
U.S. Net Cash Farm Income
43.4 42.0 46.0 46.0 42.8 45.250.3 51.0
42.436.3 33.8
38.8 39.7
53.7
69.261.4
52.1
73.6
9.3 8.29.2
13.4
7.97.3
7.3 7.5
12.4 21.5 22.920.7
11.0
16.5
13.024.4
15.8
12.1
0.0
10.0
20.0
30.0
40.0
50.0
60.0
70.0
80.0
90.0
100.0
1990 1991 1992 1993 1994 1995 1996 1997 1998 1999 2000 2001 2002 2003 2004 2005 2006 2007*
Calendar Year
Bill
ion
Do
llars
Net Cash Income Govt Payments
* USDA Est
4
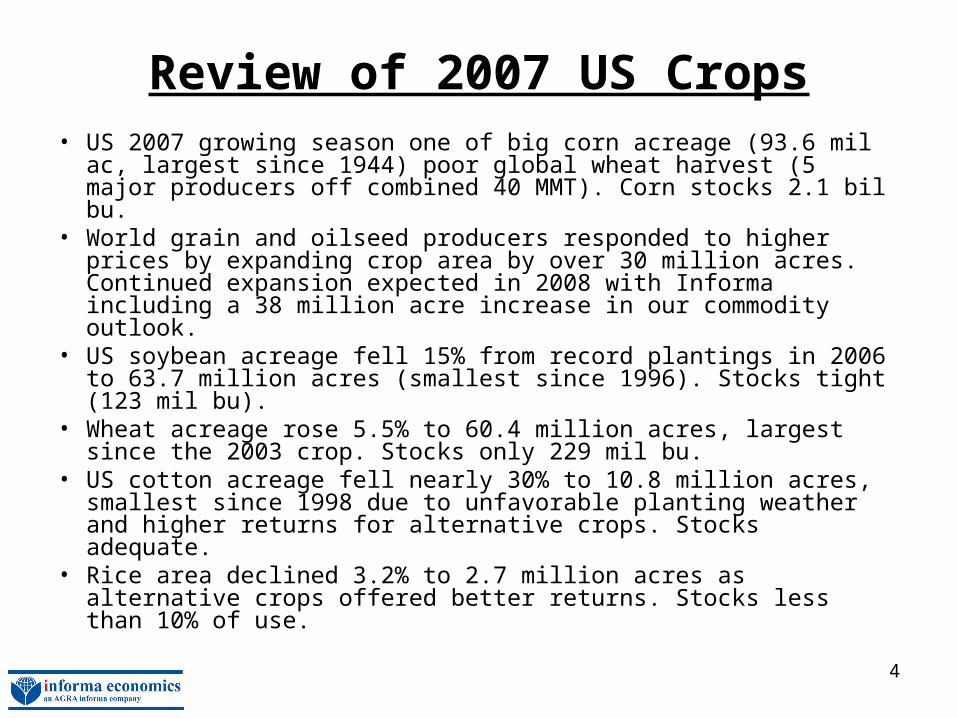
Review of 2007 US Crops• US 2007 growing season one of big corn acreage (93.6 mil
ac, largest since 1944) poor global wheat harvest (5 major producers off combined 40 MMT). Corn stocks 2.1 bil bu.
• World grain and oilseed producers responded to higher prices by expanding crop area by over 30 million acres. Continued expansion expected in 2008 with Informa including a 38 million acre increase in our commodity outlook.
• US soybean acreage fell 15% from record plantings in 2006 to 63.7 million acres (smallest since 1996). Stocks tight (123 mil bu).
• Wheat acreage rose 5.5% to 60.4 million acres, largest since the 2003 crop. Stocks only 229 mil bu.
• US cotton acreage fell nearly 30% to 10.8 million acres, smallest since 1998 due to unfavorable planting weather and higher returns for alternative crops. Stocks adequate.
• Rice area declined 3.2% to 2.7 million acres as alternative crops offered better returns. Stocks less than 10% of use.
5
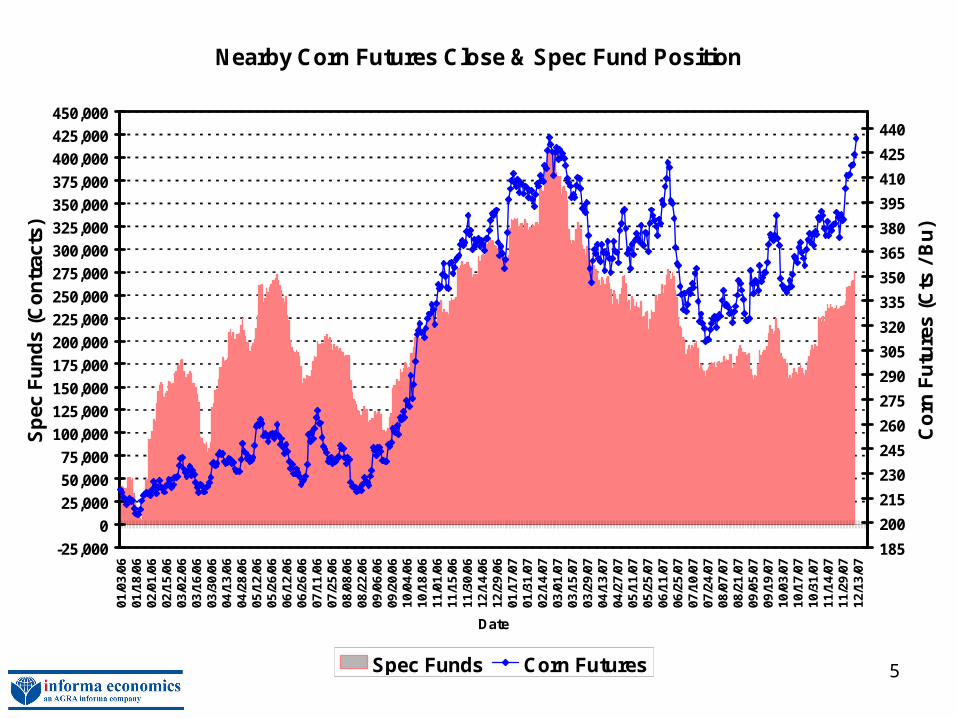
Nearby Corn Futures Close & Spec Fund Position
-25,000
0
25,000
50,000
75,000
100,000
125,000
150,000
175,000
200,000
225,000
250,000
275,000
300,000
325,000
350,000
375,000
400,000
425,000
450,00001
/03/
0601
/18/
0602
/01/
0602
/15/
0603
/02/
0603
/16/
0603
/30/
0604
/13/
0604
/28/
0605
/12/
0605
/26/
0606
/12/
0606
/26/
0607
/11/
0607
/25/
0608
/08/
0608
/22/
0609
/06/
0609
/20/
0610
/04/
0610
/18/
0611
/01/
0611
/15/
0611
/30/
0612
/14/
0612
/29/
0601
/17/
0701
/31/
0702
/14/
0703
/01/
0703
/15/
0703
/29/
0704
/13/
0704
/27/
0705
/11/
0705
/25/
0706
/11/
0706
/25/
0707
/10/
0707
/24/
0708
/07/
0708
/21/
0709
/05/
0709
/19/
0710
/03/
0710
/17/
0710
/31/
0711
/14/
0711
/29/
0712
/13/
07
Date
Sp
ec F
un
ds
(Co
ntr
acts
)
185
200
215
230
245
260
275
290
305
320
335
350
365
380
395
410
425
440
Co
rn F
utu
res
(Cts
/ B
u)
Spec Funds Corn Futures
Specs = net long 275,200 contracts on 12/12/07
6
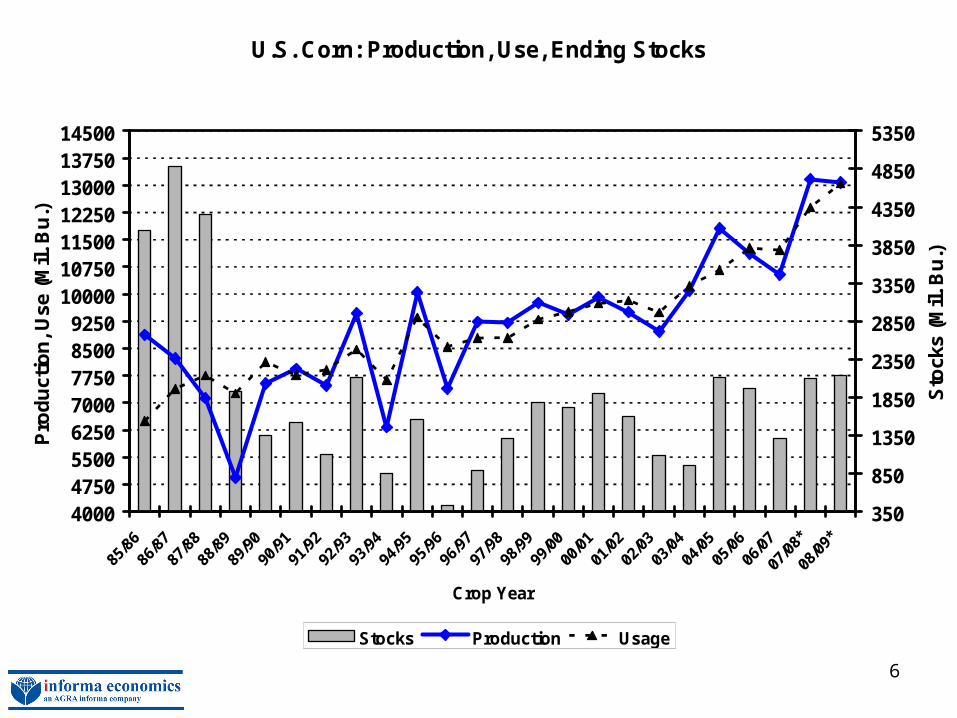
U.S. Corn: Production, Use, Ending Stocks
40004750550062507000775085009250
10000107501150012250130001375014500
Crop Year
Pro
du
ctio
n, U
se (
Mil.
Bu
.)
350
850
1350
1850
2350
2850
3350
3850
4350
4850
5350
Sto
cks
(Mil.
Bu
.)
Stocks Production Usage
* Informa Est.
7
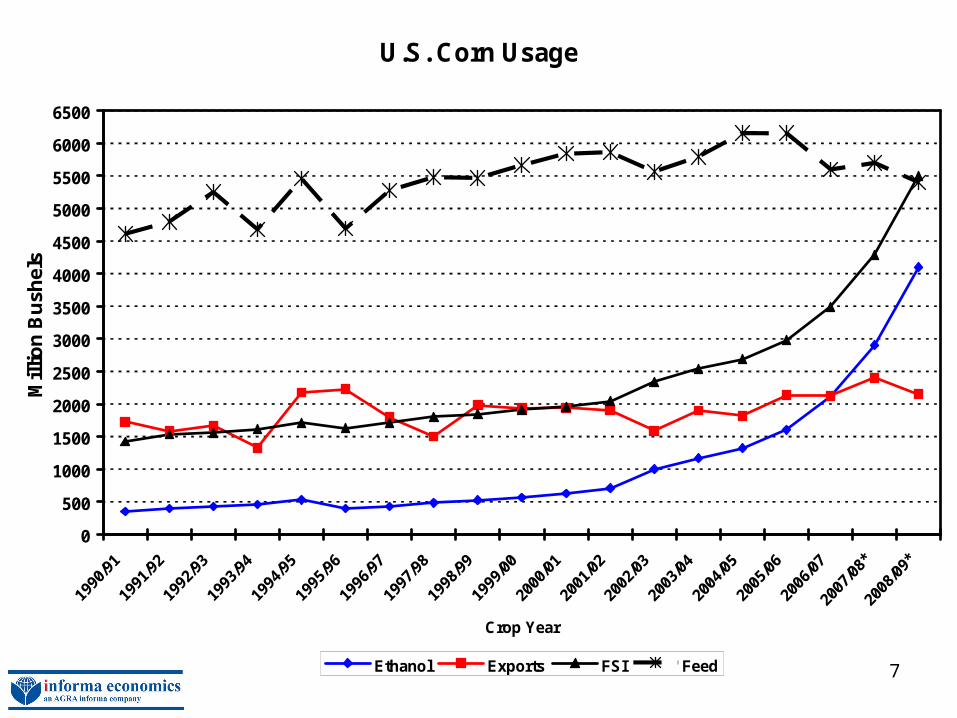
U.S. Corn Usage
0
500
1000
1500
2000
2500
3000
3500
4000
4500
5000
5500
6000
6500
Crop Year
Mill
ion
Bu
shel
s
Ethanol Exports FSI Feed
* Informa Est.
8
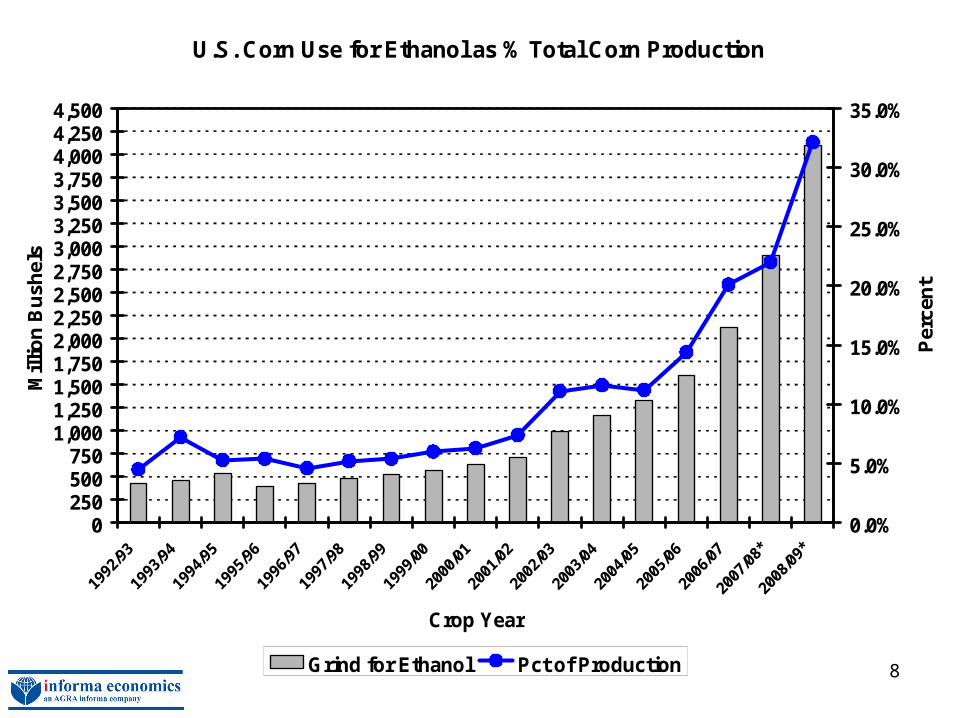
U.S. Corn Use for Ethanol as % Total Corn Production
0250500750
1,0001,2501,5001,7502,0002,2502,5002,7503,0003,2503,5003,7504,0004,2504,500
Crop Year
Mill
ion
Bu
shel
s
0.0%
5.0%
10.0%
15.0%
20.0%
25.0%
30.0%
35.0%
Per
cen
t
Grind for Ethanol Pct of Production
* Informa Est

9
Corn Grind for Ethanol Production
0.50
1.50
2.50
3.50
4.50
5.50
6.50
7.50
8.50
9.50
10.50
11.50
12.50
Crop Year
Eth
ano
l Pd
n, (
Bil
Gal
)
250
750
1,250
1,750
2,250
2,750
3,250
3,750
4,250
4,750
Co
rn G
rin
d (
Mil
Bu
)
Ethanol Pdn Corn Grind
* Informa Est.
10
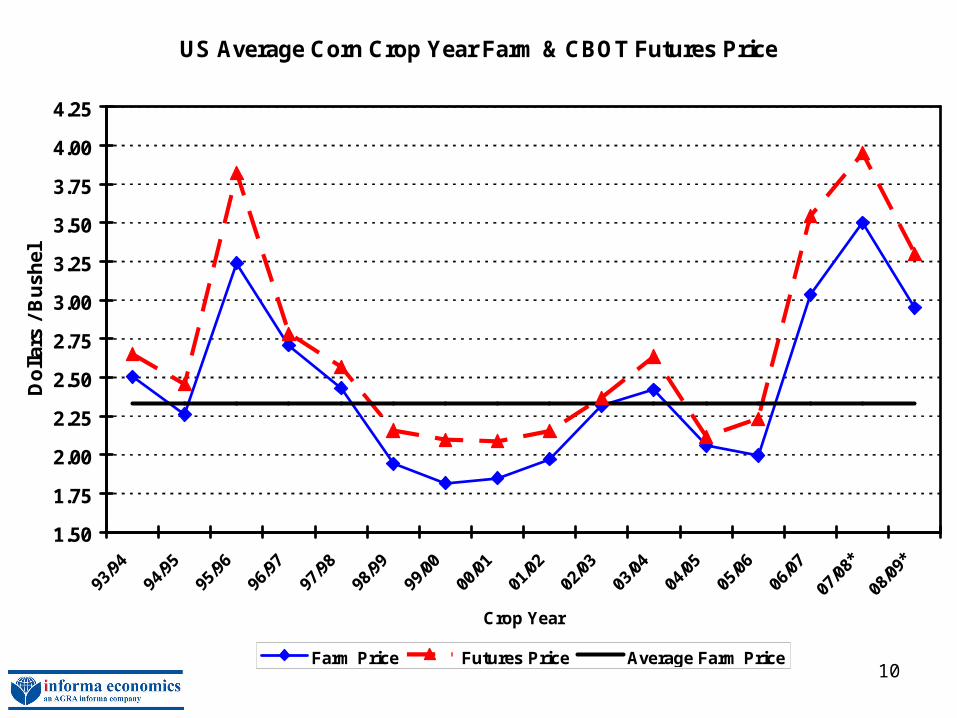
US Average Corn Crop Year Farm & CBOT Futures Price
1.50
1.75
2.00
2.25
2.50
2.75
3.00
3.25
3.50
3.75
4.00
4.25
Crop Year
Do
llars
/ B
ush
el
Farm Price Futures Price Average Farm Price
* Informa Est
11
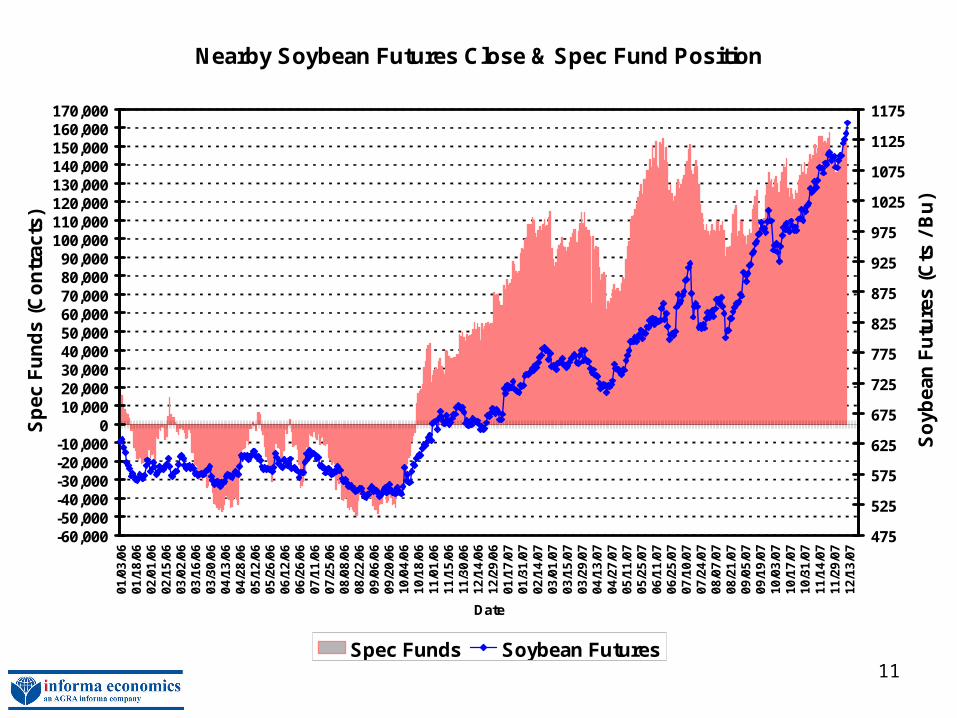
Nearby Soybean Futures Close & Spec Fund Position
-60,000-50,000-40,000-30,000-20,000-10,000
010,00020,00030,00040,00050,00060,00070,00080,00090,000
100,000110,000120,000130,000140,000150,000160,000170,000
01
/03
/06
01
/18
/06
02
/01
/06
02
/15
/06
03
/02
/06
03
/16
/06
03
/30
/06
04
/13
/06
04
/28
/06
05
/12
/06
05
/26
/06
06
/12
/06
06
/26
/06
07
/11
/06
07
/25
/06
08
/08
/06
08
/22
/06
09
/06
/06
09
/20
/06
10
/04
/06
10
/18
/06
11
/01
/06
11
/15
/06
11
/30
/06
12
/14
/06
12
/29
/06
01
/17
/07
01
/31
/07
02
/14
/07
03
/01
/07
03
/15
/07
03
/29
/07
04
/13
/07
04
/27
/07
05
/11
/07
05
/25
/07
06
/11
/07
06
/25
/07
07
/10
/07
07
/24
/07
08
/07
/07
08
/21
/07
09
/05
/07
09
/19
/07
10
/03
/07
10
/17
/07
10
/31
/07
11
/14
/07
11
/29
/07
12
/13
/07
Date
Sp
ec F
un
ds
(Co
ntr
acts
)
475
525
575
625
675
725
775
825
875
925
975
1025
1075
1125
1175
So
ybea
n F
utu
res
(Cts
/ B
u)
Spec Funds Soybean Futures
Specs = net long 159,100 contracts on 12/12/07

12
U.S. Soybean Production, Use, Ending Stocks
1500
1700
1900
2100
2300
2500
2700
2900
3100
3300
Crop Year
Pro
du
ctio
n/U
se (
Mil
Bu
)
50100150200250300350400450500550600650700750800850900950
En
din
g S
tock
s (M
il B
u)
STOCKS
PRODUCTION
USAGE
* Informa Est.

13
U.S. Soybean Exports and Crush
400
500
600
700
800
900
1,000
1,100
1,200
1,300
Crop Year
Exp
ort
s (M
il B
u)
950
1,050
1,150
1,250
1,350
1,450
1,550
1,650
1,750
1,850
1,950
Cru
sh (
Mil
Bu
)
Exports Crush
* Informa Est.
14
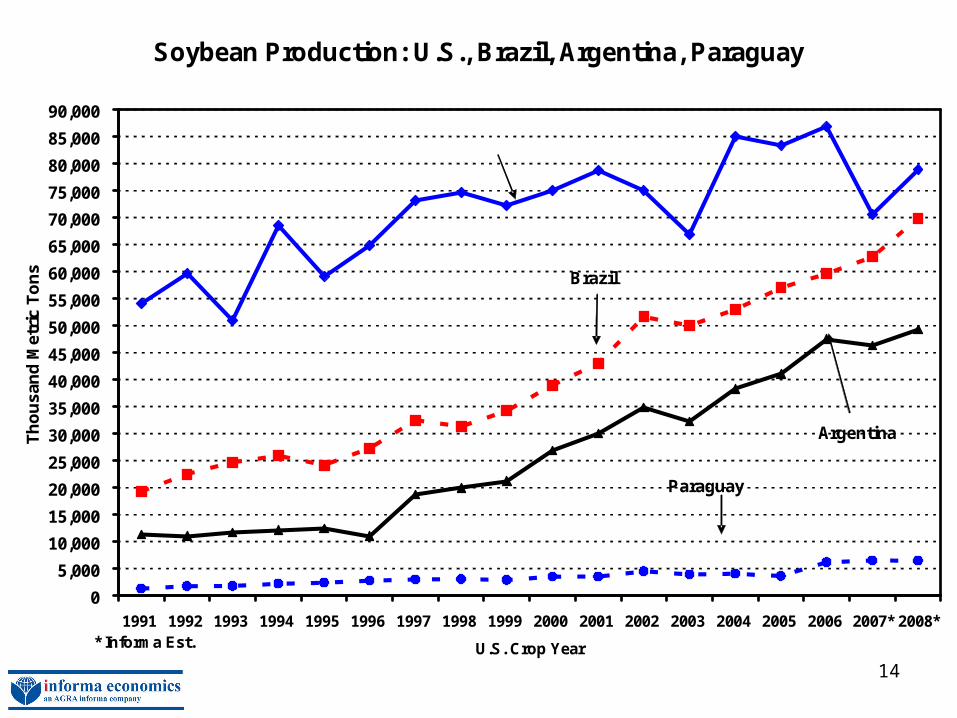
Soybean Production: U.S., Brazil, Argentina, Paraguay
0
5,000
10,000
15,000
20,000
25,000
30,000
35,000
40,000
45,000
50,000
55,000
60,000
65,000
70,000
75,000
80,000
85,000
90,000
1991 1992 1993 1994 1995 1996 1997 1998 1999 2000 2001 2002 2003 2004 2005 2006 2007* 2008*
U.S. Crop Year
Th
ou
san
d M
etri
c T
on
s
U.S.
Brazil
Argentina
Paraguay
* Informa Est.
15
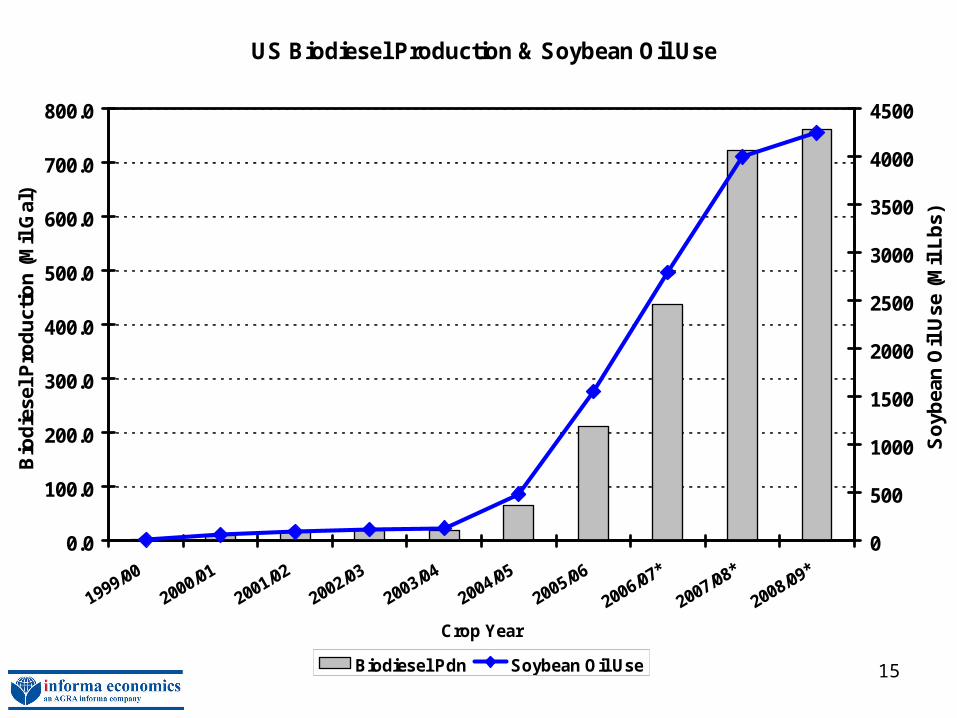
US Biodiesel Production & Soybean Oil Use
0.0
100.0
200.0
300.0
400.0
500.0
600.0
700.0
800.0
Crop Year
Bio
die
sel P
rod
uct
ion
(M
il G
al)
0
500
1000
1500
2000
2500
3000
3500
4000
4500
So
ybea
n O
il U
se (
Mil
Lb
s)
Biodiesel Pdn Soybean Oil Use
* Informa Est
16
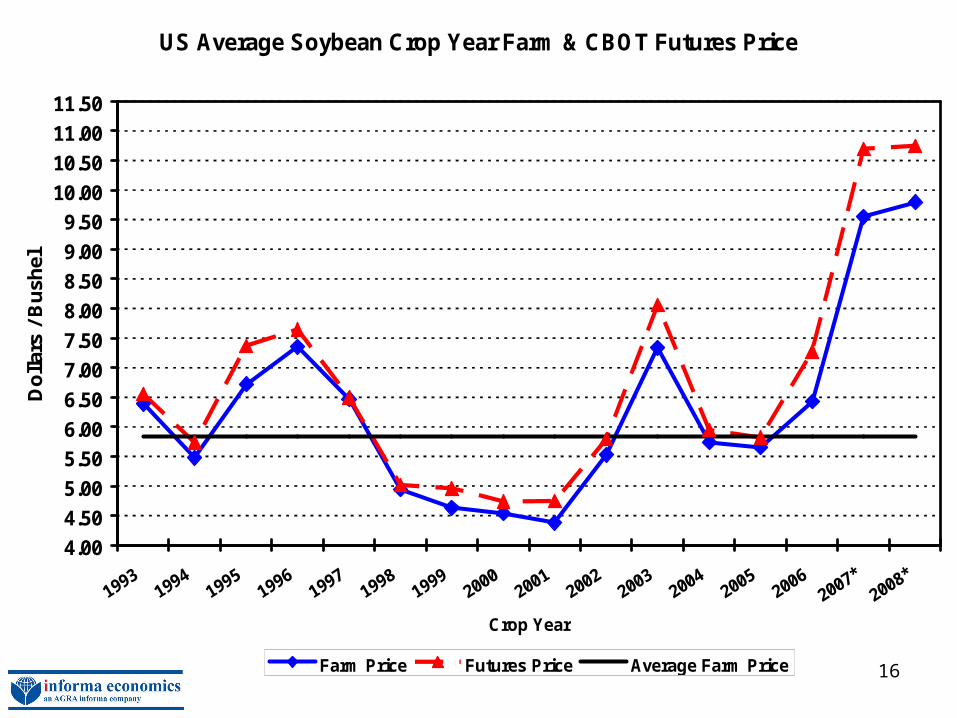
US Average Soybean Crop Year Farm & CBOT Futures Price
4.00
4.50
5.00
5.50
6.00
6.50
7.00
7.50
8.00
8.50
9.00
9.50
10.00
10.50
11.00
11.50
Crop Year
Do
llars
/ B
ush
el
Farm Price Futures Price Average Farm Price
* Informa Est.
17
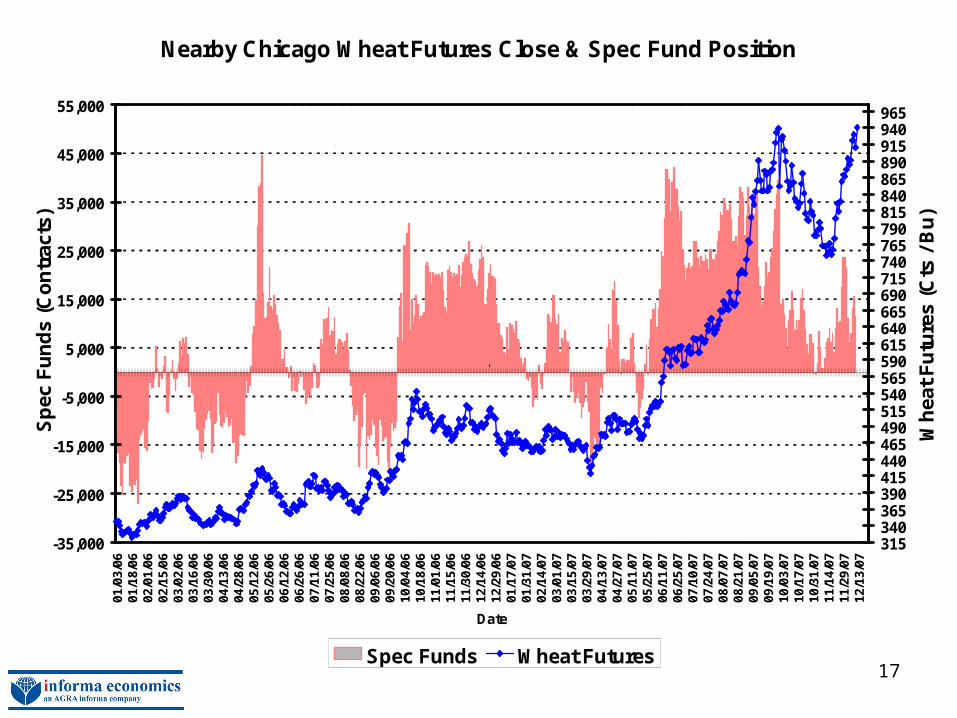
Nearby Chicago Wheat Futures Close & Spec Fund Position
-35,000
-25,000
-15,000
-5,000
5,000
15,000
25,000
35,000
45,000
55,00001
/03/
0601
/18/
0602
/01/
0602
/15/
0603
/02/
0603
/16/
0603
/30/
0604
/13/
0604
/28/
0605
/12/
0605
/26/
0606
/12/
0606
/26/
0607
/11/
0607
/25/
0608
/08/
0608
/22/
0609
/06/
0609
/20/
0610
/04/
0610
/18/
0611
/01/
0611
/15/
0611
/30/
0612
/14/
0612
/29/
0601
/17/
0701
/31/
0702
/14/
0703
/01/
0703
/15/
0703
/29/
0704
/13/
0704
/27/
0705
/11/
0705
/25/
0706
/11/
0706
/25/
0707
/10/
0707
/24/
0708
/07/
0708
/21/
0709
/05/
0709
/19/
0710
/03/
0710
/17/
0710
/31/
0711
/14/
0711
/29/
0712
/13/
07
Date
Sp
ec F
un
ds
(Co
ntr
acts
)
315340365390415440465490515540565590615640665690715740765790815840865890915940965
Wh
eat
Fu
ture
s (C
ts /
Bu
)
Spec Funds Wheat Futures
Specs = net long 11,500 contracts on 12/12/07
\

18
U.S. Wheat Production, Use, Ending Stocks
1500
1600
1700
1800
1900
2000
2100
2200
2300
2400
2500
2600
2700
2800
Crop Year
Pro
du
ctio
n, U
se (
Mil
Bu
)
1502503504505506507508509501050115012501350145015501650175018501950
En
din
g S
tock
s (
Mil
Bu
)
STOCKS
PRODUCTION
USE
* Informa Est
19
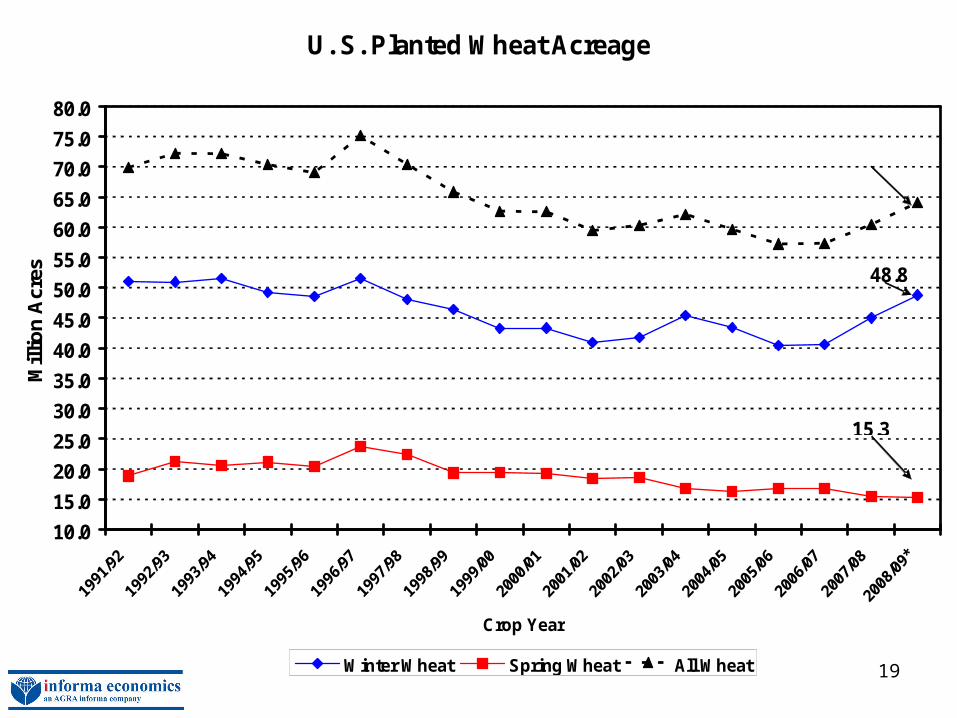
U. S. Planted Wheat Acreage
10.0
15.0
20.0
25.0
30.0
35.0
40.0
45.0
50.0
55.0
60.0
65.0
70.0
75.0
80.0
Crop Year
Mill
ion
Acr
es
Winter Wheat Spring Wheat All Wheat
* Informa Est
64.1
48.8
15.3
20
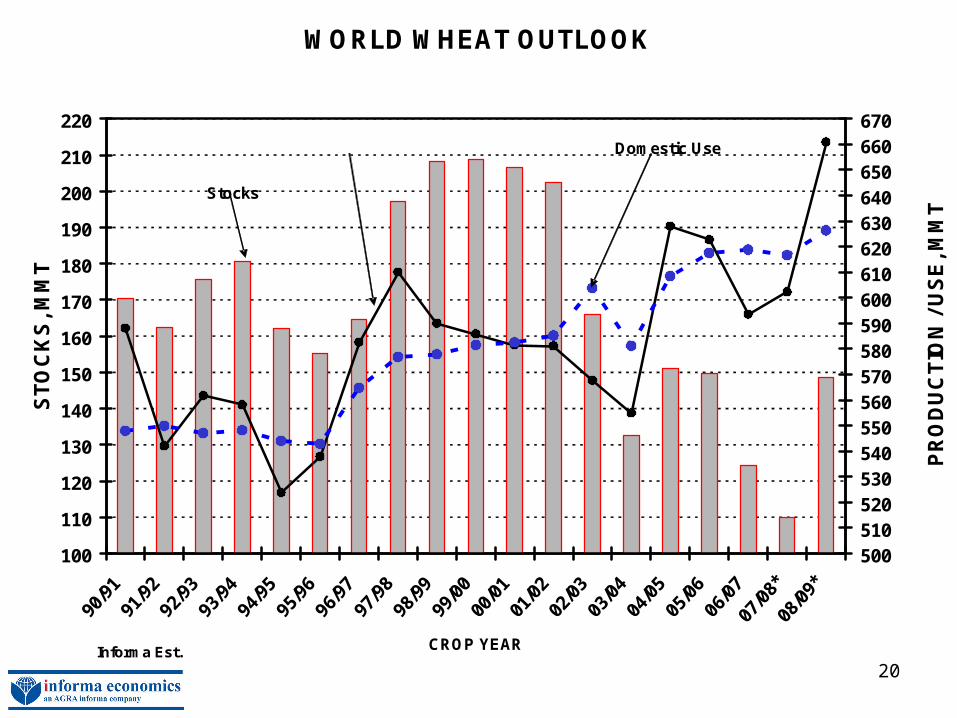
WORLD WHEAT OUTLOOK
100
110
120
130
140
150
160
170
180
190
200
210
220
90/
91 9
1/92
92/
93 9
3/94
94/
95 9
5/96
96/
9797
/98
98/9
999
/00
00/0
101
/02
02/0
303
/04
04/0
505
/06
06/0
707
/08*
08/0
9*
CROP YEAR
ST
OC
KS
, MM
T
500510520530540550560570580590600610620630640650660670
PR
OD
UC
TIO
N /
US
E, M
MT
Production Domestic Use
Stocks
Informa Est.
21
400
500
600
700
800
900
1000
1100
1200
1300
1400
1500
1600
1700M
illio
n B
ush
els
Crop Year
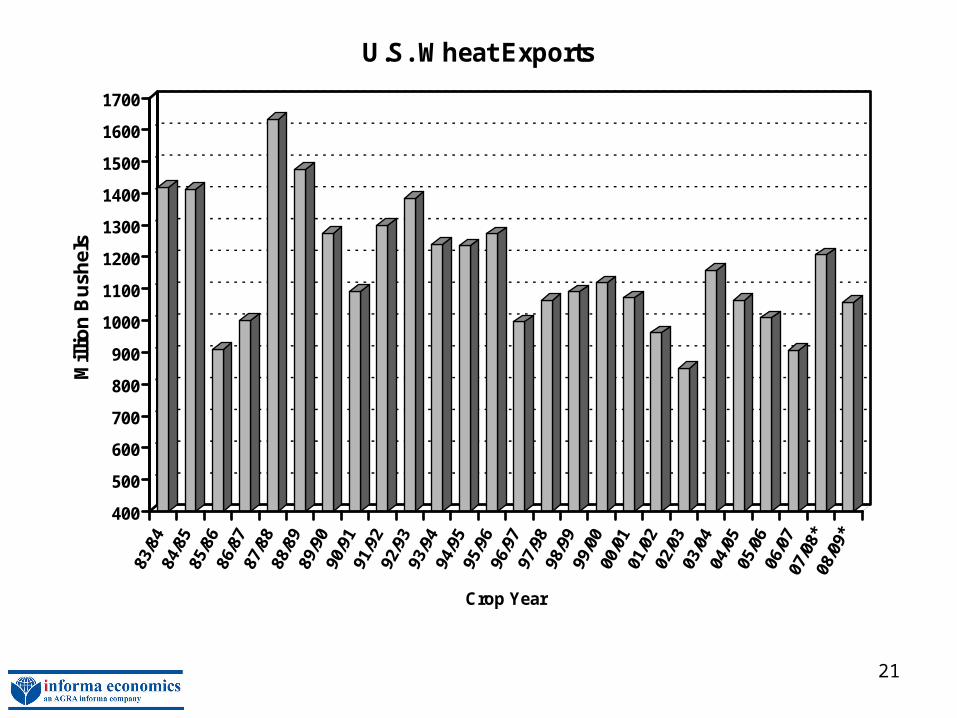
U.S. Wheat Exports
* Informa Est.
22
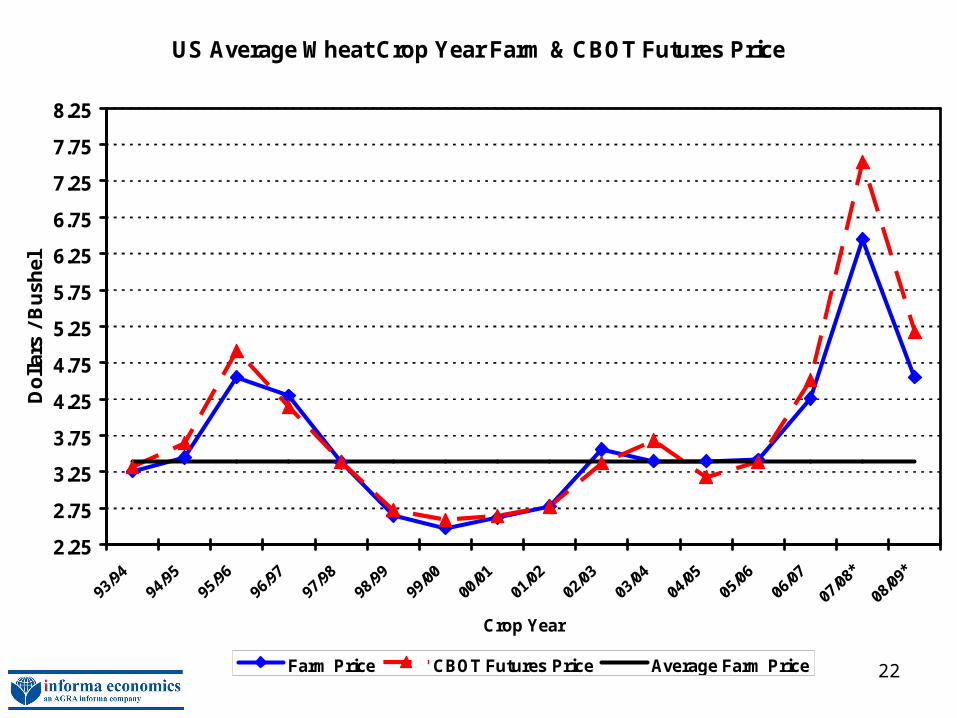
US Average Wheat Crop Year Farm & CBOT Futures Price
2.25
2.75
3.25
3.75
4.25
4.75
5.25
5.75
6.25
6.75
7.25
7.75
8.25
Crop Year
Do
llars
/ B
ush
el
Farm Price CBOT Futures Price Average Farm Price
* Informa Est
23
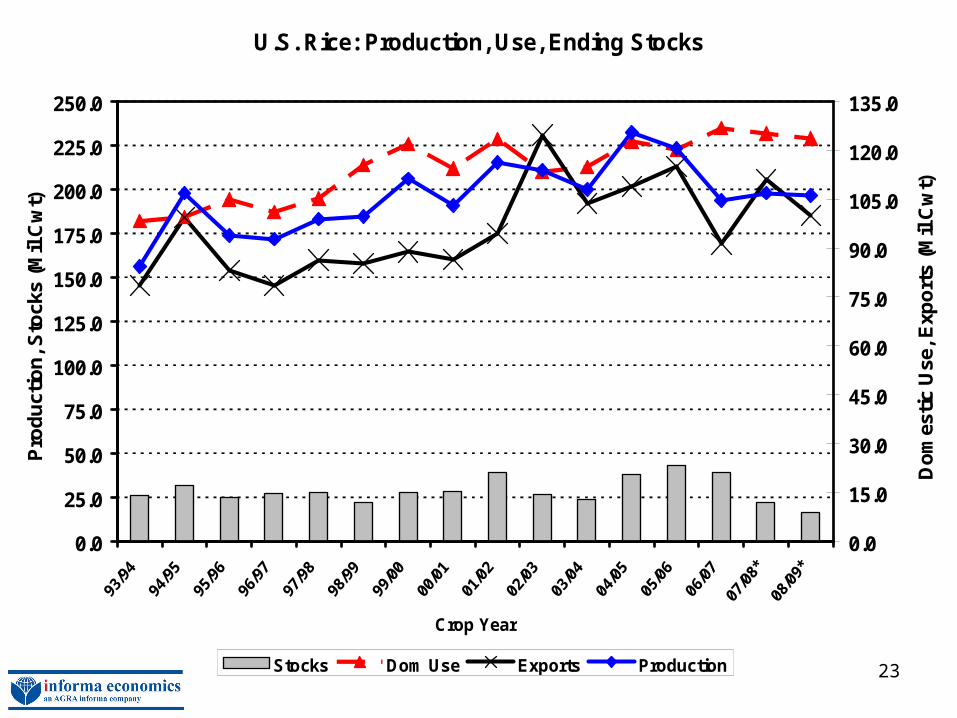
U.S. Rice: Production, Use, Ending Stocks
0.0
25.0
50.0
75.0
100.0
125.0
150.0
175.0
200.0
225.0
250.0
Crop Year
Pro
du
ctio
n, S
tock
s (M
il C
wt)
0.0
15.0
30.0
45.0
60.0
75.0
90.0
105.0
120.0
135.0
Do
mes
tic
Use
, Exp
ort
s (M
il C
wt)
Stocks Dom Use Exports Production
* Informa Est
24
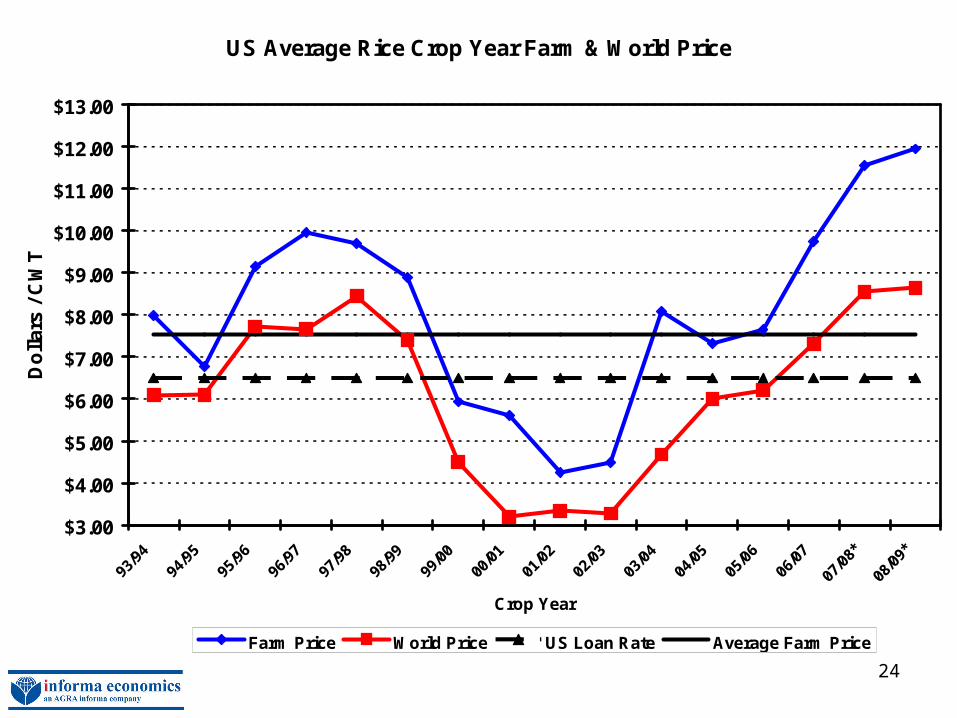
US Average Rice Crop Year Farm & World Price
$3.00
$4.00
$5.00
$6.00
$7.00
$8.00
$9.00
$10.00
$11.00
$12.00
$13.00
93/9
494
/95
95/9
696
/97
97/9
898
/99
99/0
000
/01
01/0
202
/03
03/0
404
/05
05/0
606
/07
07/0
8*
08/0
9*
Crop Year
Do
llar
s /
CW
T
Farm Price World Price US Loan Rate Average Farm Price
* Informa Est
25
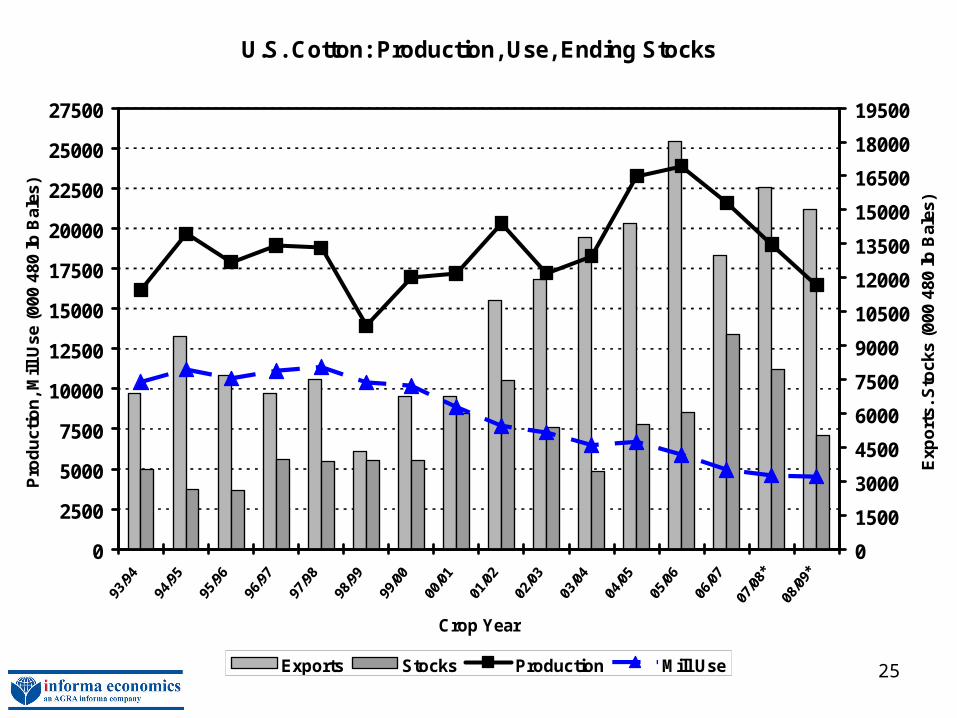
U.S. Cotton: Production, Use, Ending Stocks
0
2500
5000
7500
10000
12500
15000
17500
20000
22500
25000
27500
Crop Year
Pro
du
ctio
n, M
ill U
se (
000
480
lb B
ales
)
0
1500
3000
4500
6000
7500
9000
10500
12000
13500
15000
16500
18000
19500
Exp
ort
s. S
tock
s (0
00 4
80 lb
Bal
es)
Exports Stocks Production Mill Use
* Informa Est
26
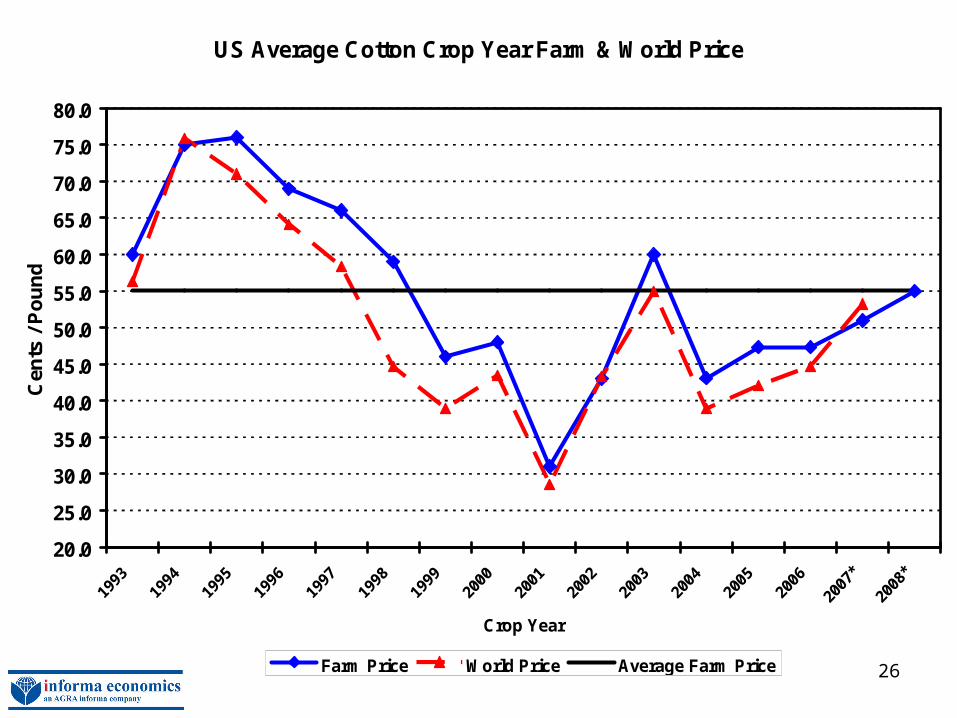
US Average Cotton Crop Year Farm & World Price
20.0
25.0
30.0
35.0
40.0
45.0
50.0
55.0
60.0
65.0
70.0
75.0
80.0
Crop Year
Cen
ts /
Po
un
d
Farm Price World Price Average Farm Price
* Informa Est
27
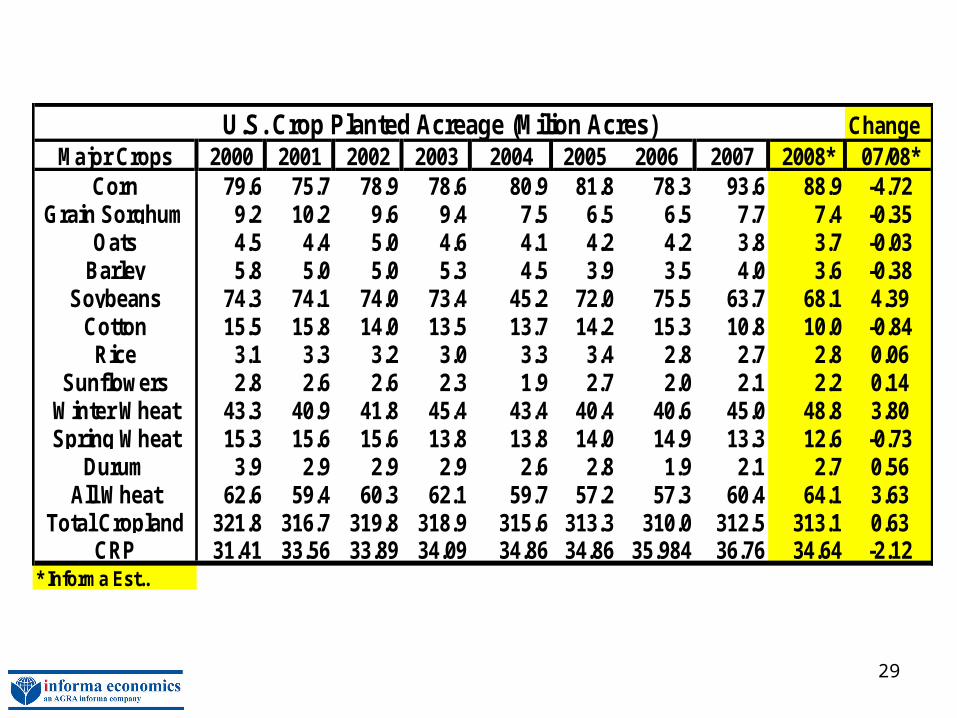
Looking Ahead to 2008 Crops• Crop returns for 2008 implied by prevailing market prices suggest
soybeans, wheat and cotton will reclaim acres from corn• Market price signals for 2008 crops prevailing during early
December imply corn acreage slipping to 4.7 million acres to 88.9 million. Soybean plantings are estimated to total 68.1 million acres, an increase of 4.4 million. Total wheat seedings are projected at 64.1 million acres, 3.7 million more than 2007. Winter wheat plantings are estimated to increase 3.8 million, but durum and other spring wheat acreage falling 171,000 acres. Farmers will be monitor changing market signals over the coming months adjusting planting ideas along with the spring weather developments.
• World grain and oilseed producers are expected to expand crop area. Two factors support the continued expansion. First, The EU reduced set-aside form 10 percent to zero for the 2008 growing season. This policy change could increase cropping area by more than 7 million acres. Second factor, the persistence of high prices which provides incentive to global producers.

28
Annual Planning Net Revenue 1/
$0
$50
$100
$150
$200
$250
$300
$350
$400
Crop Year
Do
llars
/ ac
re
Corn Soybeans Wheat Cotton
$58 vs last year $168
$113
$38
1/ as of: 12/3/2007
29
U.S. Crop Planted Acreage (Milion Acres) ChangeMajor Crops 2000 2001 2002 2003 2004 2005 2006 2007 2008* 07/08*
Corn 79.6 75.7 78.9 78.6 80.9 81.8 78.3 93.6 88.9 -4.72Grain Sorghum 9.2 10.2 9.6 9.4 7.5 6.5 6.5 7.7 7.4 -0.35
Oats 4.5 4.4 5.0 4.6 4.1 4.2 4.2 3.8 3.7 -0.03Barley 5.8 5.0 5.0 5.3 4.5 3.9 3.5 4.0 3.6 -0.38
Soybeans 74.3 74.1 74.0 73.4 45.2 72.0 75.5 63.7 68.1 4.39Cotton 15.5 15.8 14.0 13.5 13.7 14.2 15.3 10.8 10.0 -0.84Rice 3.1 3.3 3.2 3.0 3.3 3.4 2.8 2.7 2.8 0.06
Sunflowers 2.8 2.6 2.6 2.3 1.9 2.7 2.0 2.1 2.2 0.14Winter Wheat 43.3 40.9 41.8 45.4 43.4 40.4 40.6 45.0 48.8 3.80Spring Wheat 15.3 15.6 15.6 13.8 13.8 14.0 14.9 13.3 12.6 -0.73
Durum 3.9 2.9 2.9 2.9 2.6 2.8 1.9 2.1 2.7 0.56All Wheat 62.6 59.4 60.3 62.1 59.7 57.2 57.3 60.4 64.1 3.63
Total Cropland 321.8 316.7 319.8 318.9 315.6 313.3 310.0 312.5 313.1 0.63CRP 31.41 33.56 33.89 34.09 34.86 34.86 35.984 36.76 34.64 -2.12
* Informa Est..
30
Informa Economics 2007 Agriculture Policy Roundtable
Commodity Market Update
ByJim Sullivan
Informa Economics 2007 Agriculture Policy Roundtable
Commodity Market Update
ByJim Sullivan
December 13, 2007