Embed Size (px)
Citation preview
Informality: Exit and Exclusion
OECD Development CentreParisJuly 2007
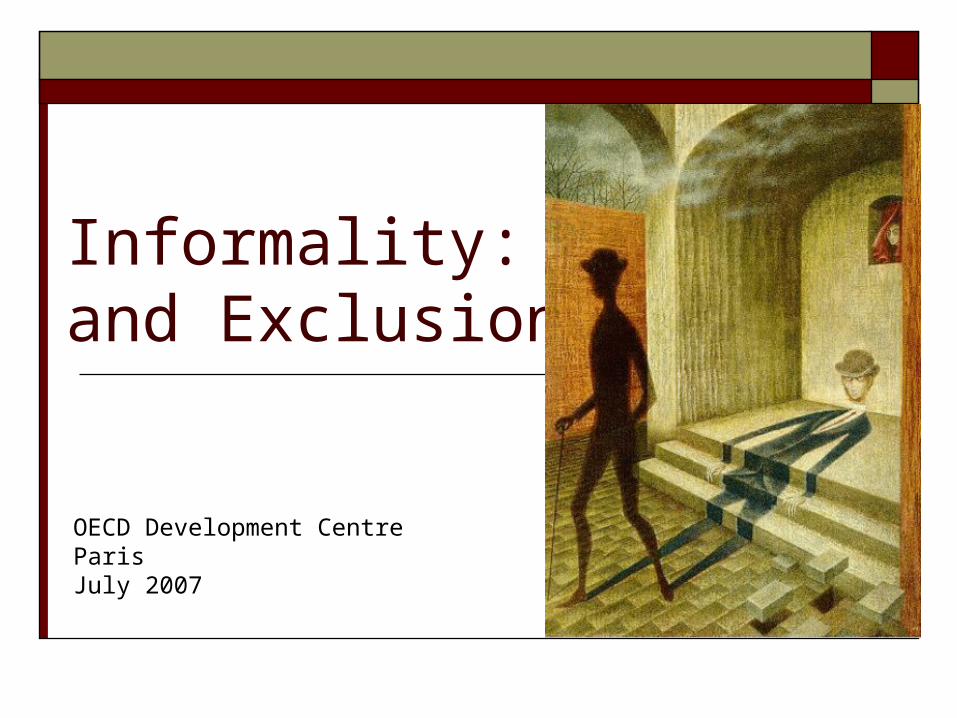
LAC not significantly more informal than comparable countries…
0
10
20
30
40
50
60
70
80
90
100
- 10,000 20,000 30,000 40,000
Latin America Advanced Countries Rest of the world
Lac
k of
Pen
sions
(% L
abor
For
ce) 1
/
2005 GDP per capita PPP adjusted
2 Measures of Informality vs Income per Capita
0
10
20
30
40
50
60
- 10,000 20,000 30,000 40,000
Latin America Advanced Countries Rest of the world
Self
Em
ploy
men
t (%
of L
abor
For
ce) 2
/
2005 GDP per capita PPP adjusted
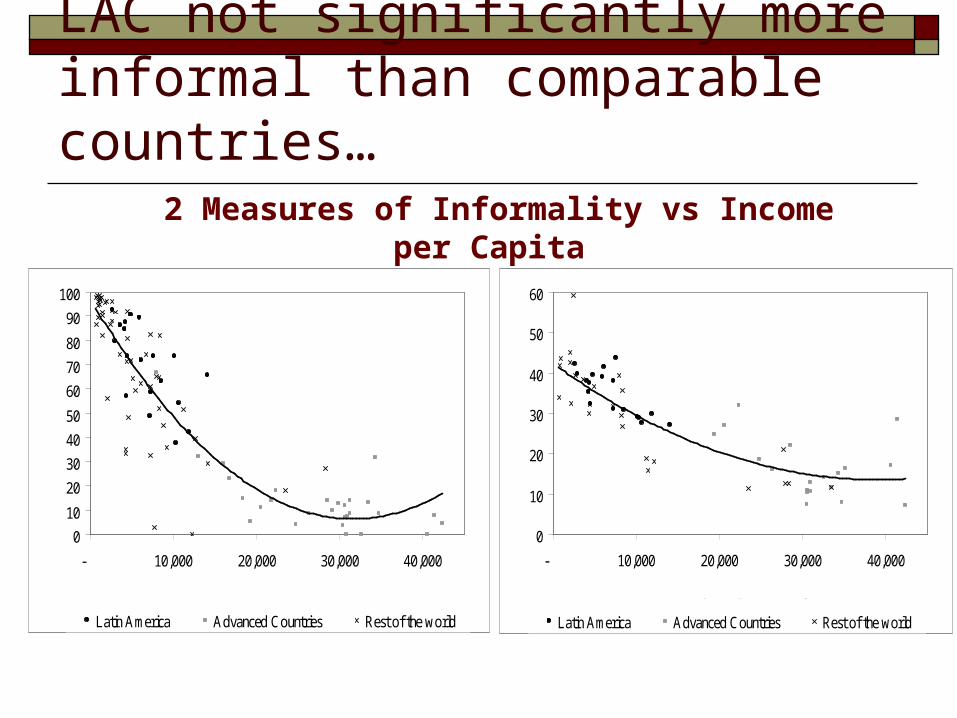
…But, a disturbing trend in the nineties
-5.2
-3.3
-0.9
-0.4
1.1
1.5
1.9
2.2
2.4
2.6
3.1
3.4
4.6
4.8
5.4
6.8
7.0
18.5
-10 -5 0 5 10 15 20
Chile 1990-2003
Brazil 1992-2003
Nicaragua 1993-2001
Costa Rica 1992-2003
Ecuador 1994-2003
Bolivia 1997-2002
Argentina 1995-2005
El Salvador 1991-2003
Mexico 1996-2002
Paraguay 1997-2003
Dominican Republic 1996-2004
Jamaica 1996-2002
Peru 1997-2003
Colombia 1996-2004
Panama 1995-2003
Honduras 1992-2002
Uruguay 1992-2004
Venezuela 1989-2003
% Informal Labor Force (Productive Definition)
-12.0
-2.4
-0.9
-0.8
-0.7
1.1
4.0
5.9
6.2
7.7
11.9
-15.0 -10.0 -5.0 0.0 5.0 10.0 15.0
El Salvador 1991-2003
Colombia 1996-1999
Paraguay 1997-2003
Brazil 1990-2003
Ecuador 1994-1998
Chile 1990-2003
Mexico 1990-2004 *
Nicaragua 1993-2001
Brazil (Met) 1992-2002
Venezuela 1995-2003
Argent ina 1992-2005
% Informal Labor Force (Legalistic Definition)
Why do we care? Unprotected workers: issue of welfare, equity and
efficiency Productivity: firms too small? Barriers to growth? Indicator of regulatory distortions Low and distorted tax collections and poor provision
of public services Weak rule of law and Governance: A problem in our
social contract?
Exit and Exclusion Traditional exclusion view of informality
Labor: inferior jobs in a segmented market Firms: denied access to services by high entry costs (de Soto)
Exit view: agents analyze costs vs. benefits of becoming formal Labor: informality offers flexibility, avoidance of poorly designed
benefits programs, and provides “decent” work Firms: don’t need/want State programs, don’t pay for them Larger firms and individuals: Why pay taxes if can avoid?
Both exist to varying degrees across countries but have different implications for policy

The Informal WorkerComparative Advantage and Constraints
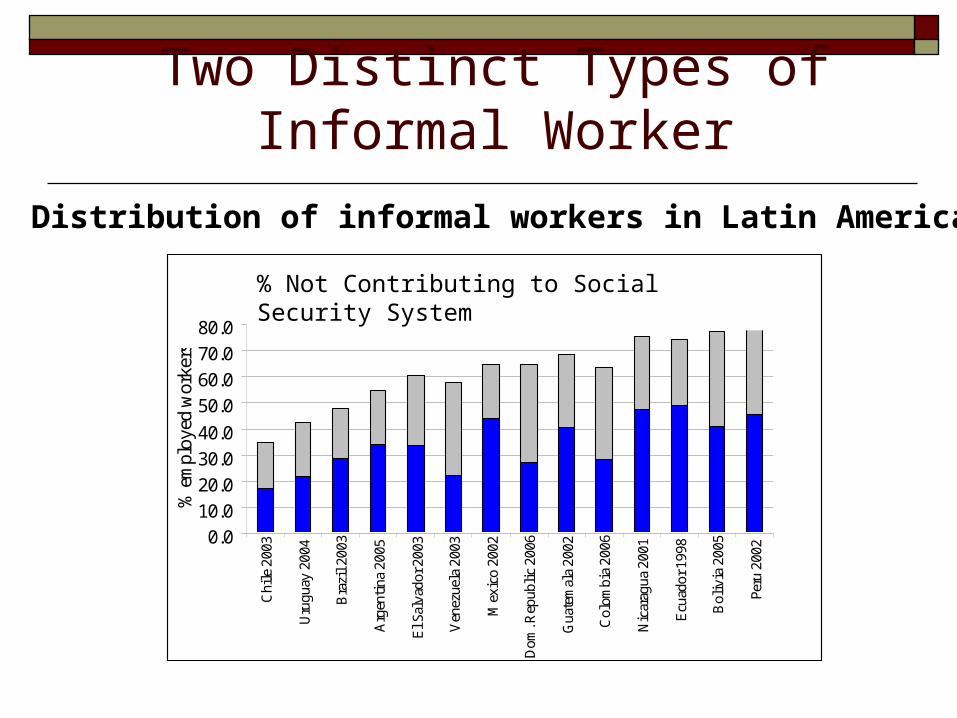
Two Distinct Types of Informal Worker
Distribution of informal workers in Latin America
% contributing to social security system
0.0
10.0
20.0
30.0
40.0
50.0
60.0
70.0
80.0
Chi
le 2
003
Uru
guay
200
4
Bra
zil 2
003
Arg
enti
na 2
005
El S
alva
dor 2
003
Ven
ezue
la 2
003
Mex
ico
2002
Dom
. Rep
ubli
c 20
06
Gua
tem
ala
2002
Col
ombi
a 20
06
Nic
arag
ua 2
001
Ecu
ador
199
8
Bol
ivia
200
5
Peru
200
2
% e
mpl
oyed
wor
kers
Informal Salaried Informal independent
% Not Contributing to Social Security System
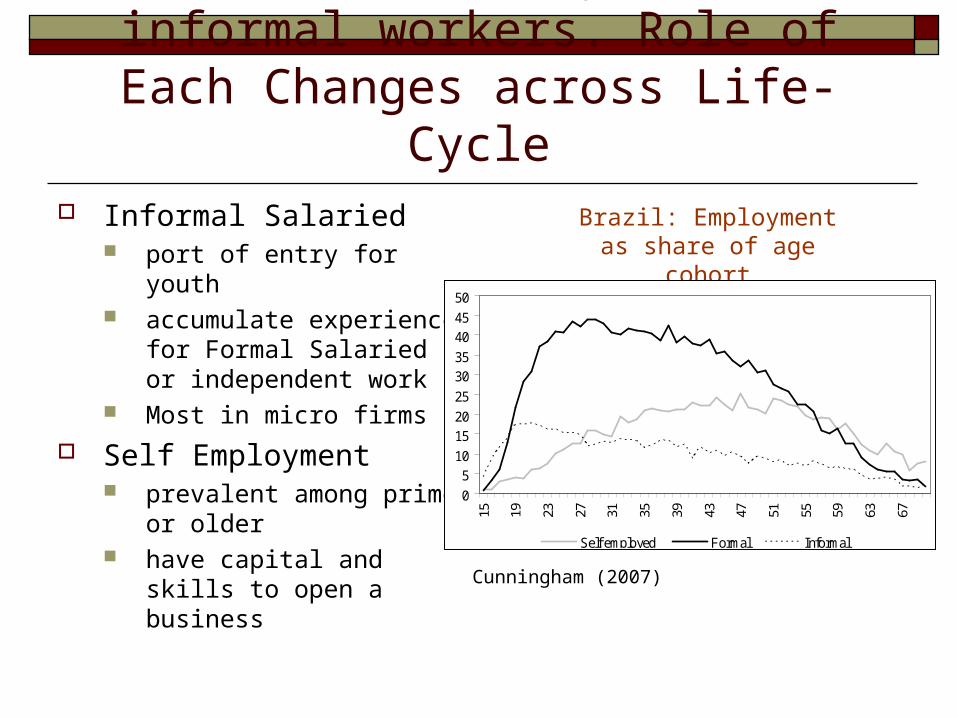
Two distinct types of informal workers. Role of Each Changes across Life-Cycle
Informal Salaried port of entry for youth accumulate experience for
Formal Salaried or independent work
Most in micro firms
Self Employment prevalent among prime or
older have capital and skills to
open a business
Brazil: Employment as share of age cohort
Cunningham (2007)
0
510
1520
25
3035
4045
50
15 19 23 27 31 35 39 43 47 51 55 59 63 67
Self employed Formal Informal
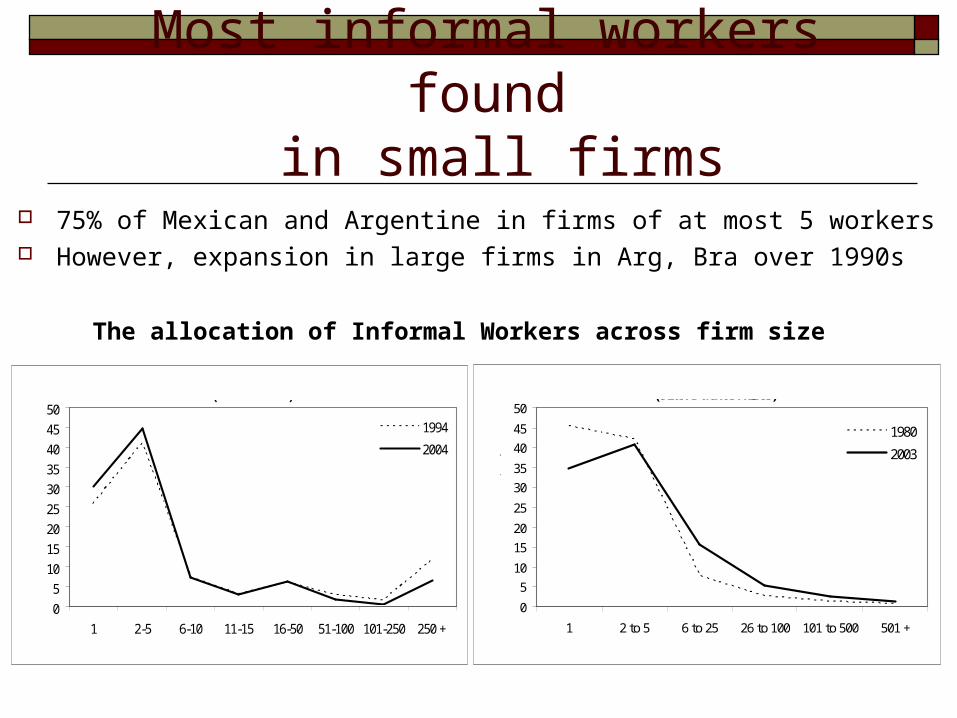
Most informal workers found in small firms
The allocation of Informal Workers across firm size
75% of Mexican and Argentine in firms of at most 5 workers However, expansion in large firms in Arg, Bra over 1990s
0
5
10
15
20
25
30
35
40
45
50
1 2-5 6-10 11-15 16-50 51-100 101-250 250 +
1994
2004
Mexico(Urban Areas)
% o
f Inf
orm
al a
nd S
elf E
mpl
oyed
wor
kers
Firm Size
0
5
10
15
20
25
30
35
40
45
50
1 2 to 5 6 to 25 26 to 100 101 to 500 501 +
1980
2003
Argentina (Gran Buenos Aires)
% o
f Inf
orm
al a
nd S
elf E
mpl
oyed
wor
kers
Firm Size
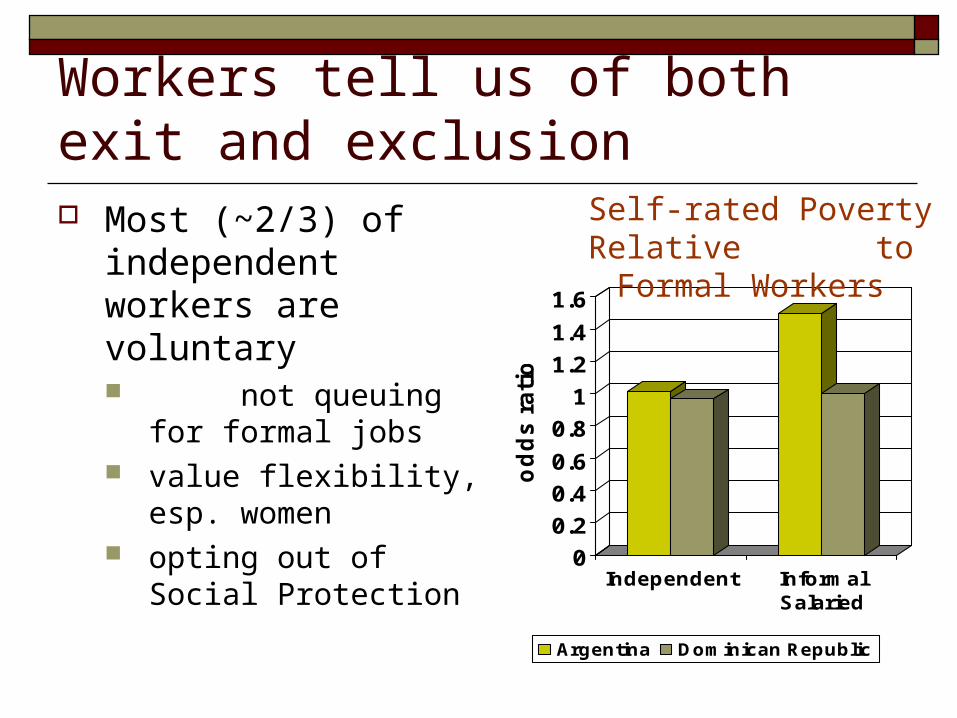
Workers tell us of both exit and exclusion Most (~2/3) of
independent workers are voluntary not queuing for
formal jobs value flexibility, esp.
women opting out of Social
Protection 0
0.2
0.4
0.6
0.8
1
1.2
1.4
1.6
od
ds
ra
tio
Independent InformalSalaried
Argentina Dominican Republic
Self-rated Poverty Relative to Formal Workers
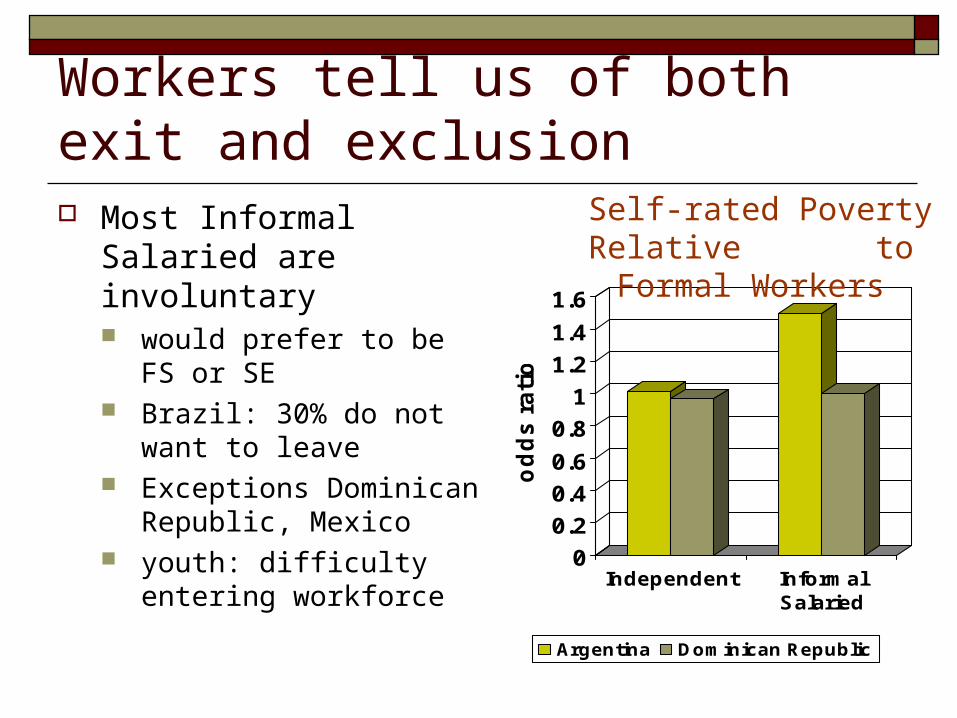
Workers tell us of both exit and exclusion Most Informal Salaried
are involuntary would prefer to be FS or
SE Brazil: 30% do not want
to leave Exceptions Dominican
Republic, Mexico youth: difficulty entering
workforce
0
0.2
0.4
0.6
0.8
1
1.2
1.4
1.6
od
ds
ra
tio
Independent InformalSalaried
Argentina Dominican Republic
Self-rated Poverty Relative to Formal Workers
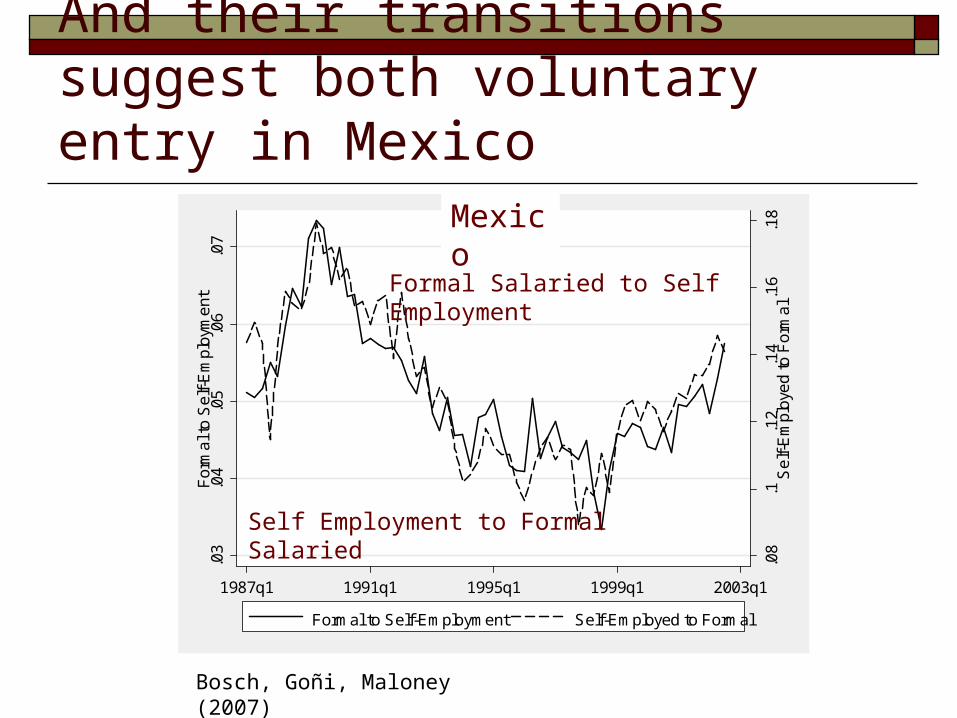
And their transitions suggest both voluntary entry in Mexico
.08
.1.1
2.1
4.1
6.1
8S
elf-
Em
ploy
ed
to F
orm
al
.03
.04
.05
.06
.07
For
ma
l to
Se
lf-E
mpl
oym
ent
1987q1 1991q1 1995q1 1999q1 2003q1
Formal to Self-Employment Self-Employed to Formal
Mexico
Self Employment to Formal Salaried
Formal Salaried to Self Employment
Bosch, Goñi, Maloney (2007)
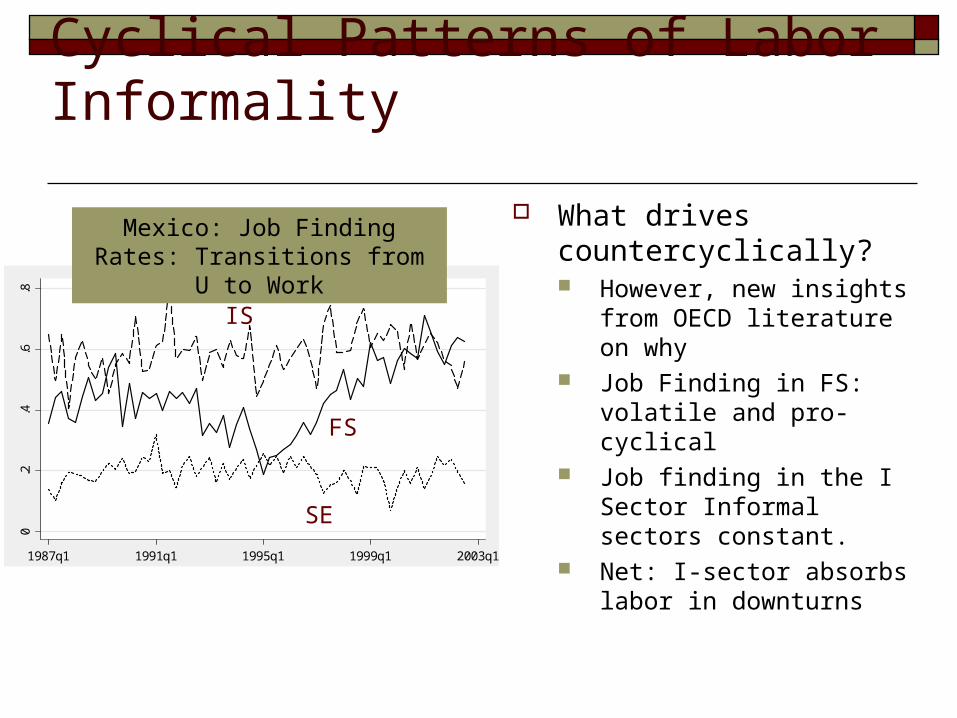
Cyclical Patterns of Labor Informality
What drives countercyclically? However, new insights from
OECD literature on why Job Finding in FS: volatile
and pro-cyclical Job finding in the I Sector
Informal sectors constant. Net: I-sector absorbs labor
in downturns
0.2
.4.6
.8
1987q1 1991q1 1995q1 1999q1 2003q1
q_unm_for q_unm_infq_unm_se
FS
IS
SE
Mexico: Job Finding Rates: Transitions from U to Work
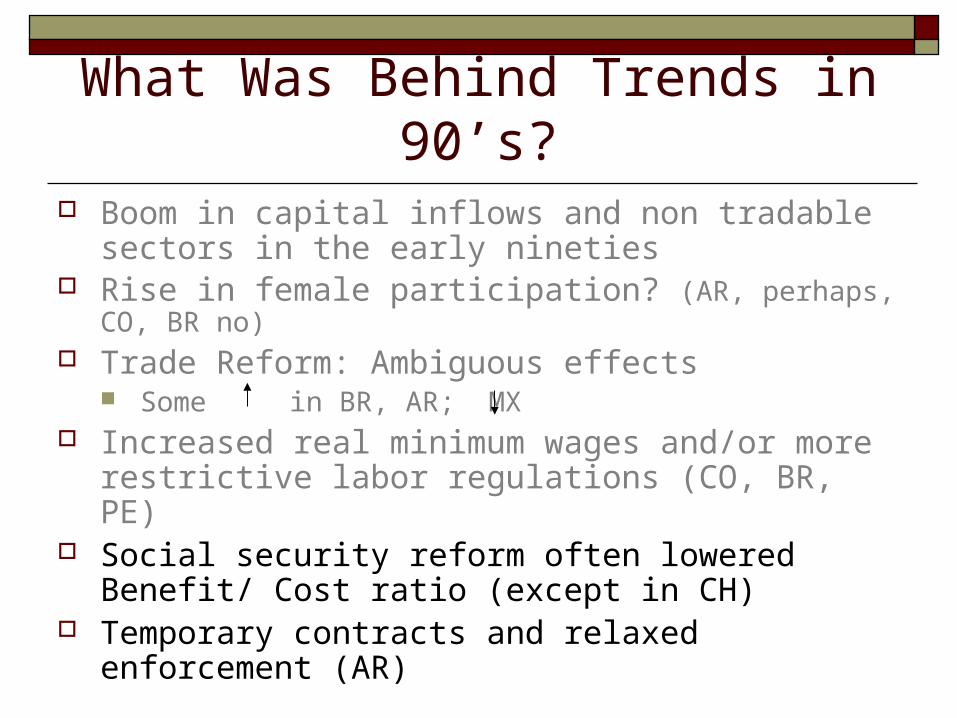
What Was Behind Trends in 90’s? Boom in capital inflows and non tradable sectors in
the early nineties Rise in female participation? (AR, perhaps, CO, BR no) Trade Reform: Ambiguous effects
Some in BR, AR; MX Increased real minimum wages and/or more
restrictive labor regulations (CO, BR, PE) Social security reform often lowered Benefit/ Cost
ratio (except in CH) Temporary contracts and relaxed enforcement (AR)
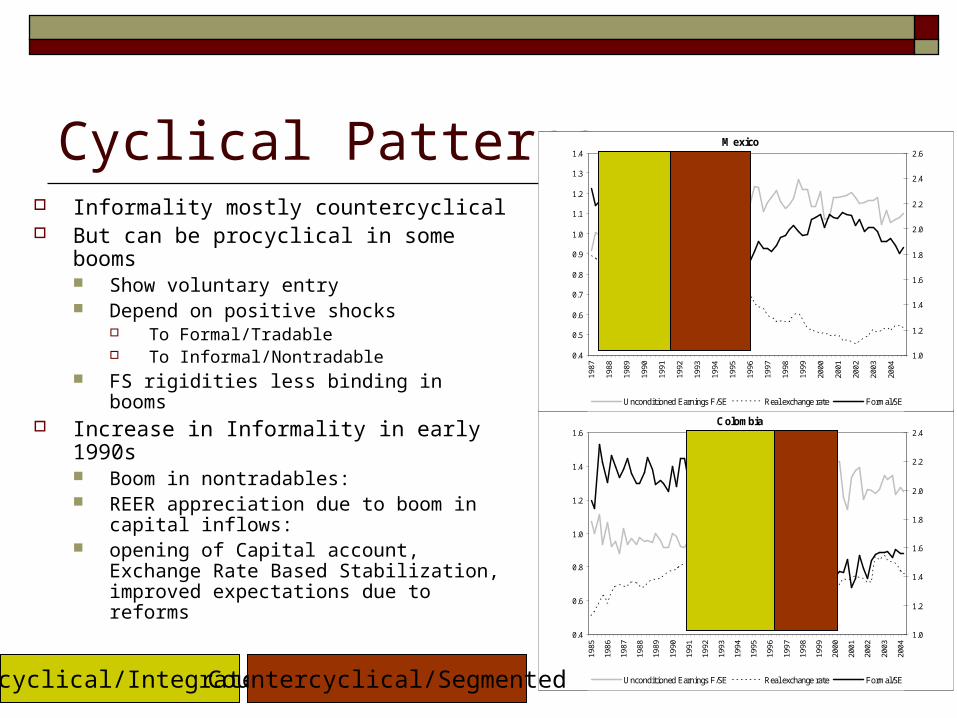
Cyclical Patterns Informality mostly countercyclical But can be procyclical in some booms
Show voluntary entry Depend on positive shocks
To Formal/Tradable To Informal/Nontradable
FS rigidities less binding in booms Increase in Informality in early 1990s
Boom in nontradables: REER appreciation due to boom in
capital inflows: opening of Capital account, Exchange
Rate Based Stabilization, improved expectations due to reforms
0.4
0.6
0.8
1.0
1.2
1.4
1.6
1985
1986
1987
1988
1989
1990
1991
1992
1993
1994
1995
1996
1997
1998
1999
2000
2001
2002
2003
2004
1 .0
1.2
1.4
1.6
1.8
2.0
2.2
2.4
Unconditioned Earnings F/SE Real exchange rate Formal/SE
Colombia
Rel
ativ
e ea
rnin
gsR
eal e
xcha
nge
rate
For
mal
/ SE
0.4
0.5
0.6
0.7
0.8
0.9
1.0
1.1
1.2
1.3
1.4
1987
1988
1989
1990
1991
1992
1993
1994
1995
1996
1997
1998
1999
2000
2001
2002
2003
2004
1 .0
1.2
1.4
1.6
1.8
2.0
2.2
2.4
2.6
Unconditioned Earnings F/SE Real exchange rate Formal/SE
Mexico
Rel
ativ
e ea
rnin
gsR
eal e
xcha
nge
rate
For
mal
/ SE
Procyclical/Integrated Countercyclical/Segmented
What Was Behind Trends in 90’s? Boom in capital inflows and non tradable sectors in
the early nineties Rise in female participation? (AR, perhaps, CO, BR no) Trade Reform: Ambiguous effects
Some in BR, AR; MX Increased real minimum wages and/or more
restrictive labor regulations (CO, BR, PE) Social security reform often lowered Benefit/ Cost
ratio (except in CH) Temporary contracts and relaxed enforcement (AR)
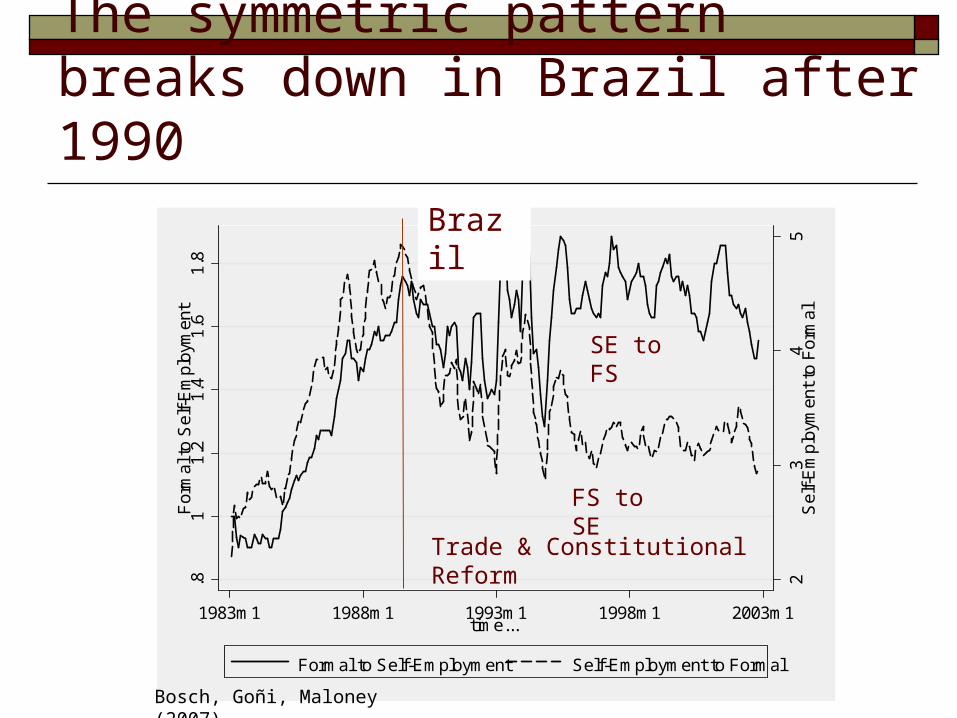
The symmetric pattern breaks down in Brazil after 1990
23
45
Sel
f-E
mpl
oym
ent
to F
orm
al
.81
1.2
1.4
1.6
1.8
For
mal
to
Sel
f-E
mpl
oym
ent
1983m1 1988m1 1993m1 1998m1 2003m1time...
Formal to Self-Employment Self-Employment to Formal
Brazil
SE to FS
FS to SE
Trade & Constitutional Reform
Bosch, Goñi, Maloney (2007)
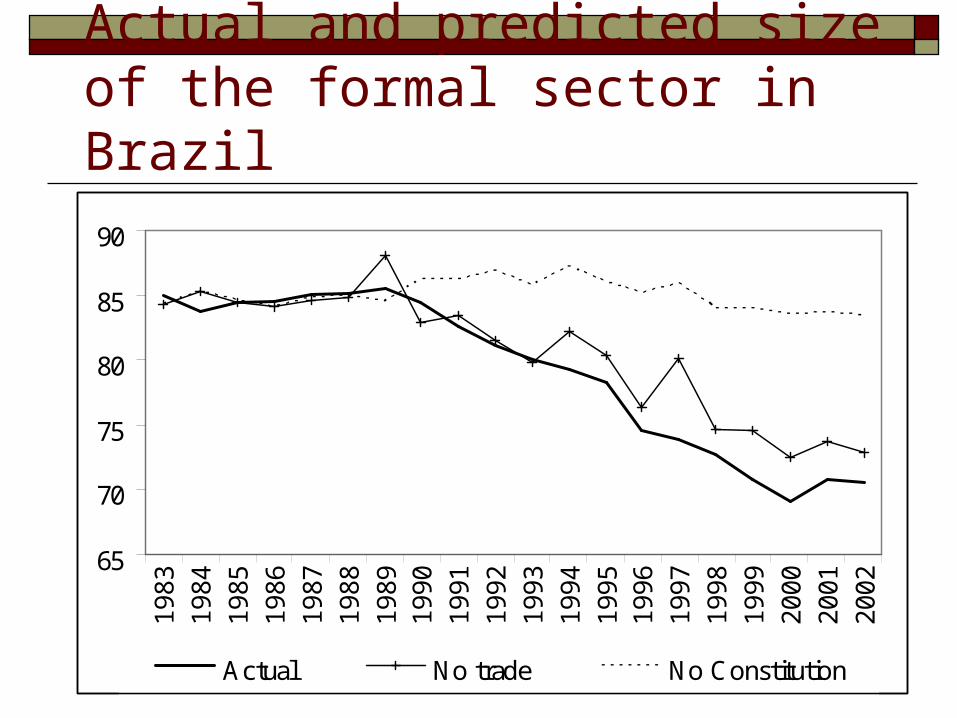
Actual and predicted size of the formal sector in Brazil
65
70
75
80
85
90
19
83
19
84
19
85
19
86
19
87
19
88
19
89
19
90
19
91
19
92
19
93
19
94
19
95
19
96
19
97
19
98
19
99
20
00
20
01
20
02
Actual No trade No Constitution
What Was Behind Trends in 90’s? Boom in capital inflows and non tradable sectors in
the early nineties Rise in female participation? (AR, perhaps, CO, BR no) Trade Reform: Ambiguous effects
Some in BR, AR; MX Increased real minimum wages and/or more
restrictive labor regulations (CO, BR, PE) Social security reform often lowered Benefit/ Cost
ratio (except in CH) Temporary contracts and relaxed enforcement (AR)

The Informal Firm
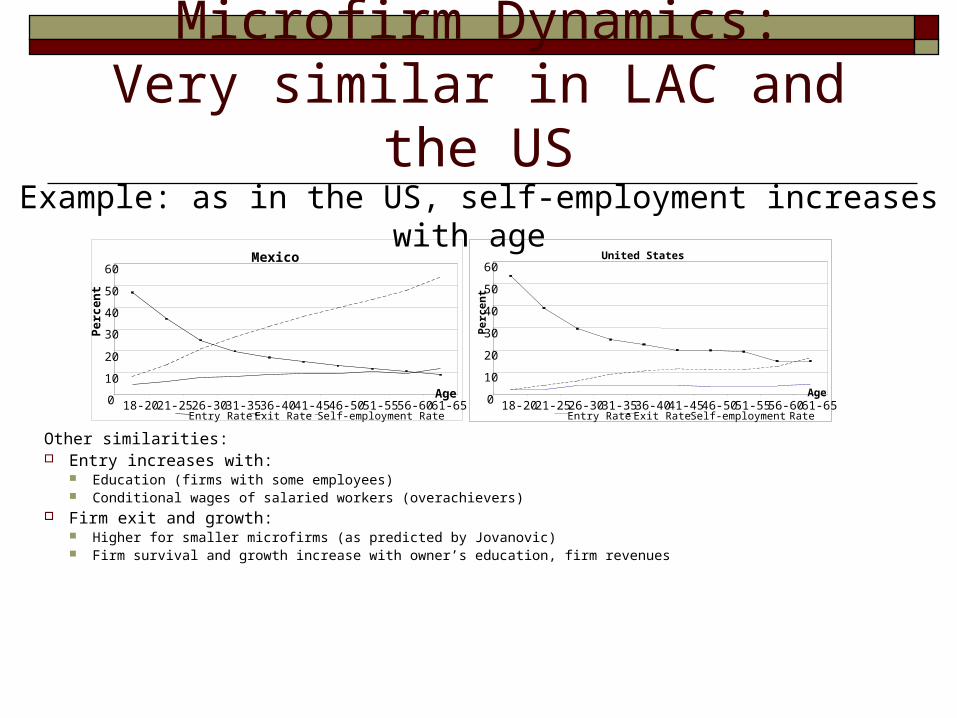
Microfirm Dynamics:Very similar in LAC and the US
Example: as in the US, self-employment increases with age
Other similarities: Entry increases with:
Education (firms with some employees) Conditional wages of salaried workers (overachievers)
Firm exit and growth: Higher for smaller microfirms (as predicted by Jovanovic) Firm survival and growth increase with owner’s education, firm revenues
Mexico
0
10
20
30
40
50
60
18-20 21-25 26-30 31-35 36-40 41-45 46-50 51-55 56-60 61-65Age
Per
ce
nt
Entry Rate Exit Rate Self-employment Rate
0
10
20
30
40
50
60
18-20 21-25 26-30 31-35 36-40 41-45 46-50 51-55 56-60 61-65Age
Per
cen
t
Entry Rate Exit Rate Self-employment Rate
United States
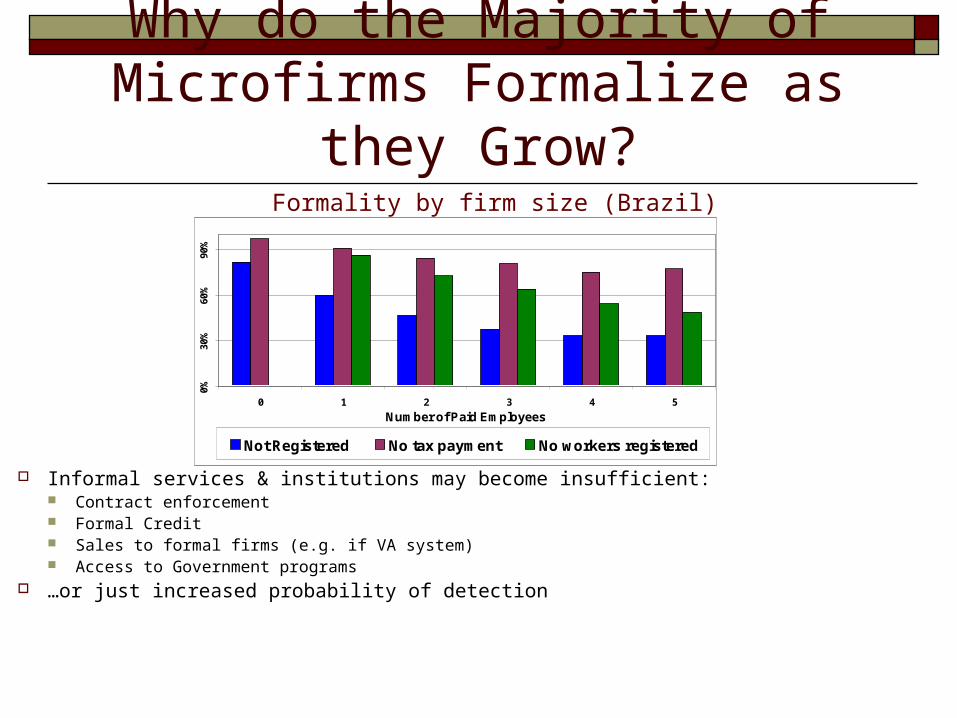
Why do the Majority of Microfirms Formalize as they Grow?
Formality by firm size (Brazil)
Informal services & institutions may become insufficient: Contract enforcement Formal Credit Sales to formal firms (e.g. if VA system) Access to Government programs
…or just increased probability of detection
0%30
%60
%90
%
0 1 2 3 4 5
Number of Paid Employees
Not Registered No tax payment No workers registered
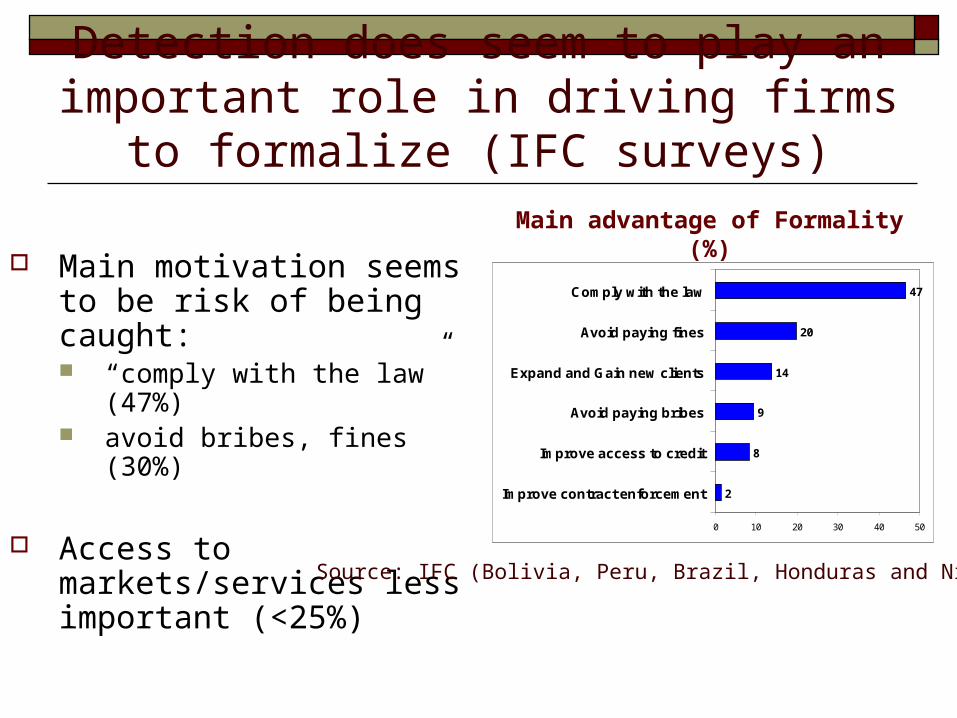
Detection does seem to play an important role in driving firms to formalize (IFC surveys)
Main advantage of Formality (%) Main motivation seems to be
risk of being caught: “comply with the law” (47%) avoid bribes, fines (30%)
Access to markets/services less important (<25%) 2
8
9
14
20
47
0 10 20 30 40 50
Improve contract enforcement
Improve access to credit
Avoid paying bribes
Expand and Gain new clients
Avoid paying fines
Comply with the law
Source: IFC (Bolivia, Peru, Brazil, Honduras and Nicaragua)
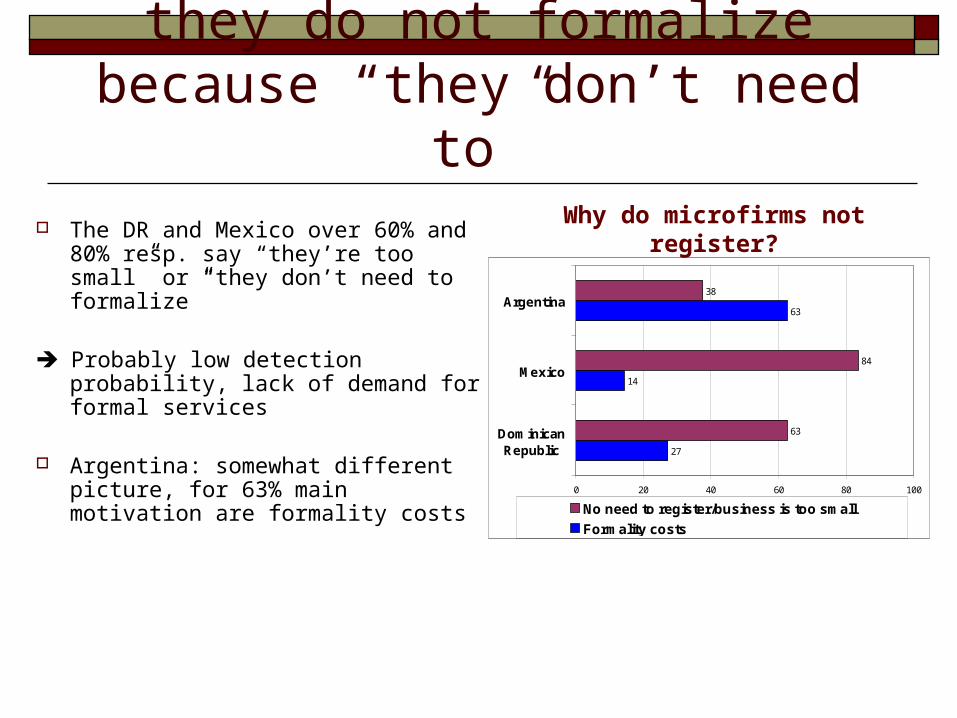
And Small Firms often say they do not formalize because “they don’t need to”
Why do microfirms not register? The DR and Mexico over 60% and 80% resp. say “they’re too small” or “they don’t need to formalize”
Probably low detection probability, lack of demand for formal services
Argentina: somewhat different picture, for 63% main motivation are formality costs
27
14
63
63
84
38
0 20 40 60 80 100
DominicanRepublic
Mexico
Argentina
No need to register/business is too small
Formality costs
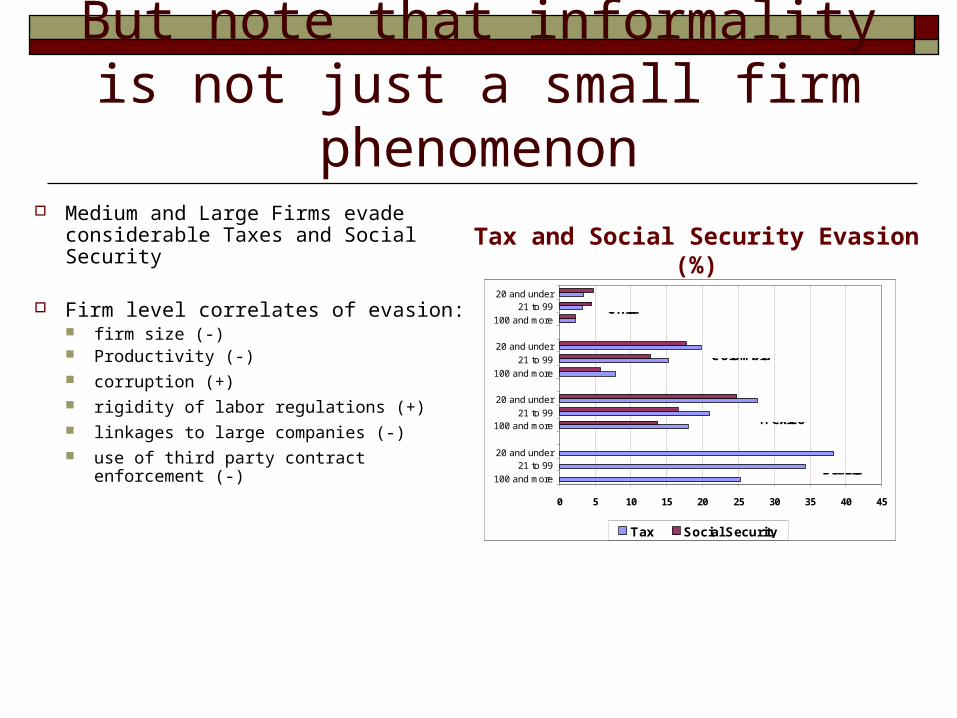
But note that informality is not just a small firm phenomenon
Tax and Social Security Evasion (%)
Medium and Large Firms evade considerable Taxes and Social Security
Firm level correlates of evasion:
firm size (-) Productivity (-) corruption (+) rigidity of labor regulations (+) linkages to large companies (-) use of third party contract enforcement (-) 0 5 10 15 20 25 30 35 40 45
100 and more
21 to 9920 and under
100 and more21 to 99
20 and under
100 and more
21 to 99
20 and under
100 and more
21 to 9920 and under
Tax Social Security
Brazil
Chile
Colombia
Mexico
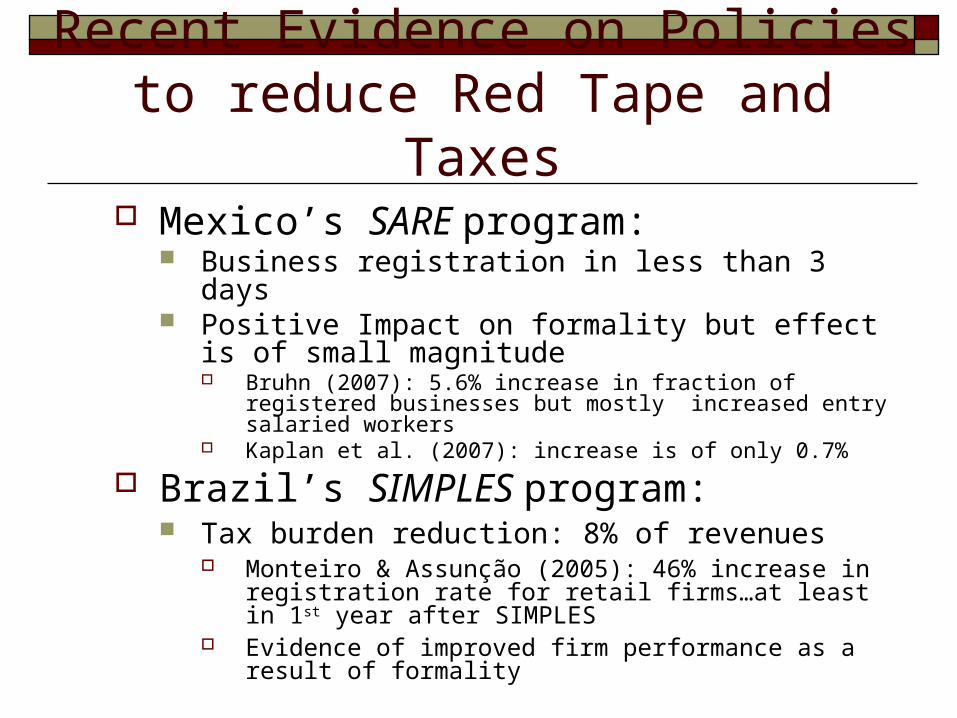
Recent Evidence on Policies to reduce Red Tape and Taxes
Mexico’s SARE program: Business registration in less than 3 days Positive Impact on formality but effect is of small
magnitude Bruhn (2007): 5.6% increase in fraction of registered businesses
but mostly increased entry salaried workers Kaplan et al. (2007): increase is of only 0.7%
Brazil’s SIMPLES program: Tax burden reduction: 8% of revenues
Monteiro & Assunção (2005): 46% increase in registration rate for retail firms…at least in 1st year after SIMPLES
Evidence of improved firm performance as a result of formality
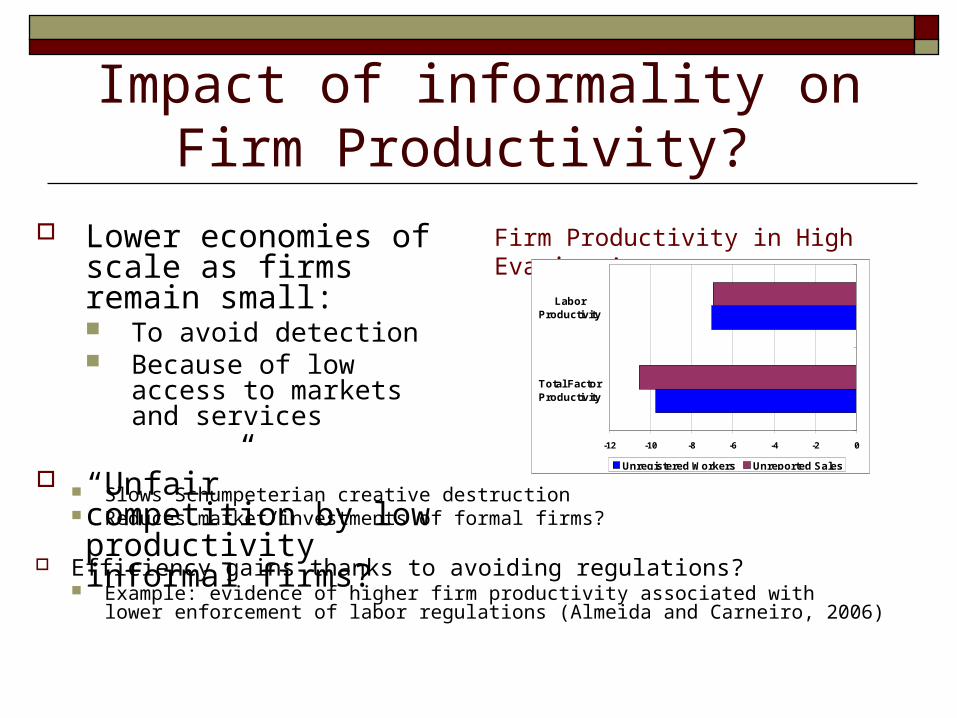
Impact of informality on Firm Productivity?
Firm Productivity in High Evasion Areas
-12 -10 -8 -6 -4 -2 0
Total FactorProductivity
LaborProductivity
Unregistered Workers Unreported Sales
Lower economies of scale as firms remain small: To avoid detection Because of low access to
markets and services
“Unfair” competition by low productivity informal firms?
Slows Schumpeterian creative destruction Reduces market/investments of formal firms?
Efficiency gains thanks to avoiding regulations? Example: evidence of higher firm productivity associated with lower enforcement of
labor regulations (Almeida and Carneiro, 2006)
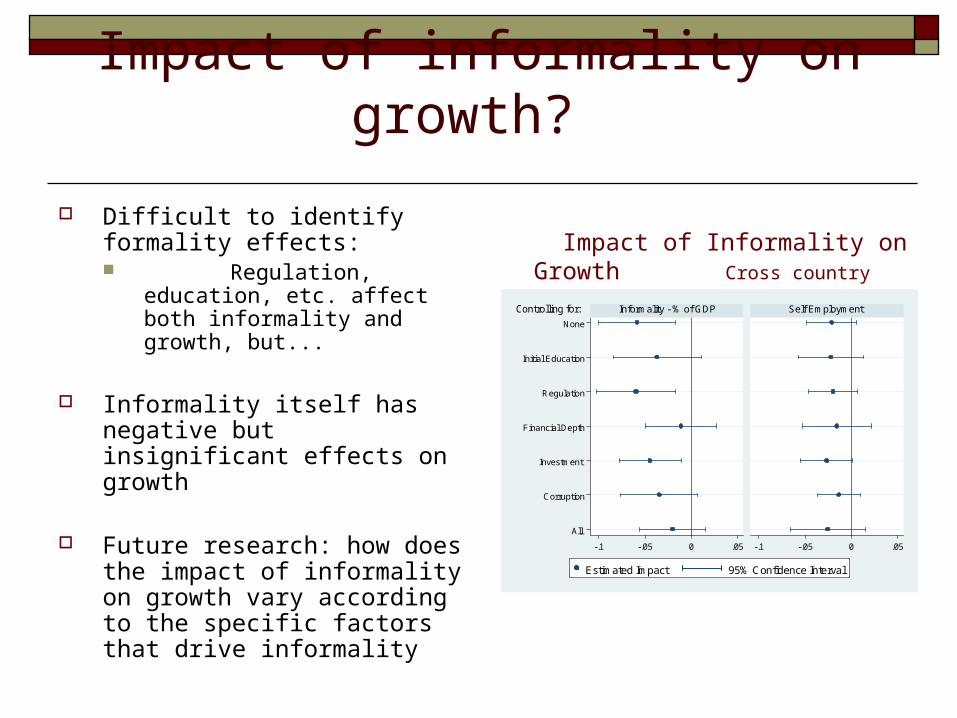
Impact of informality on growth?
Difficult to identify formality effects: Regulation,
education, etc. affect both informality and growth, but...
Informality itself has negative but insignificant effects on growth
Future research: how does the impact of informality on growth vary according to the specific factors that drive informality
Impact of Informality on Growth Cross country regressions
None
Initial Education
Regulation
Financial Depth
Investment
Corruption
All
-.1 -.05 0 .05 -.1 -.05 0 .05
Informality - % of GDP Self Employment
Estimated Impact 95% Confidence Interval
Controlling for:
Social Protection
Protecting all LAC’s citizens against risk
Andrew D. Mason
Senior Economist
Informality and Social Protection – Why do we care?
Lack of access to social protection has welfare, equity and efficiency implications
While individuals/families employ private risk management strategies – informally (prevention, self-insurance) and somewhat through the market (market insurance) …
… Lack of access to formal social protection raises important concerns on several fronts From the perspective of household welfare
Inefficient coping, impoverishing shocks (particular concerns in health and old age security)
From the societal perspective Too much uninsured risk can have external costs, productivity effects
On the social protection system Small, inefficient risk pools, foregone savings
0
10
20
30
40
50
60
70
80
BO PY PE NI GU CO EC MX SA VE AR BR UY CL CR
1990s 2000s
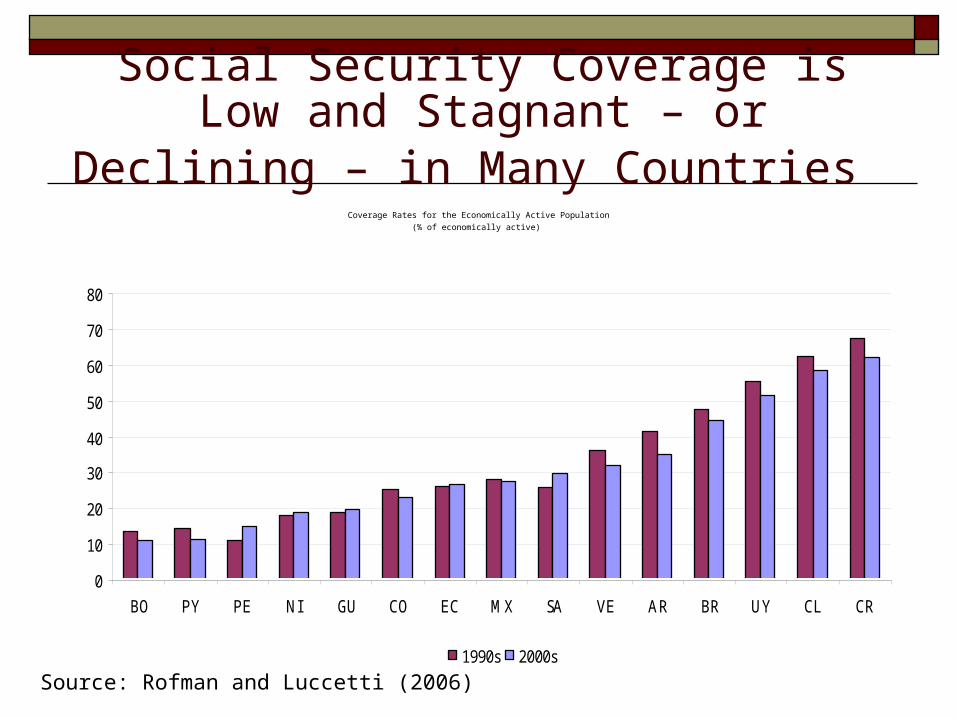
Source: Rofman and Luccetti (2006)
Coverage Rates for the Economically Active Population
(% of economically active)
Social Security Coverage is Low and Stagnant – or Declining – in Many Countries
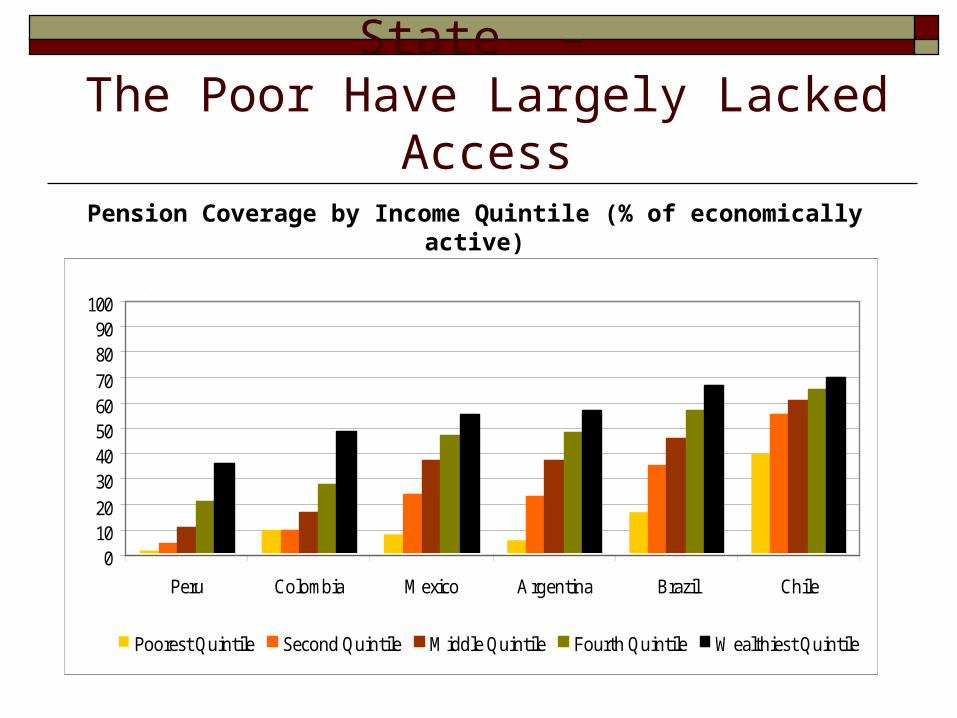
LAC’s “Truncated Welfare State” – The Poor Have Largely Lacked Access
Pension Coverage by Income Quintile (% of economically active)
01020
3040506070
8090
100
Peru Colombia Mexico Argentina Brazil Chile
Poores t Quintile Second Quintile Middle Quintile Fourth Quintile Wealthies t Quintile
Percentage
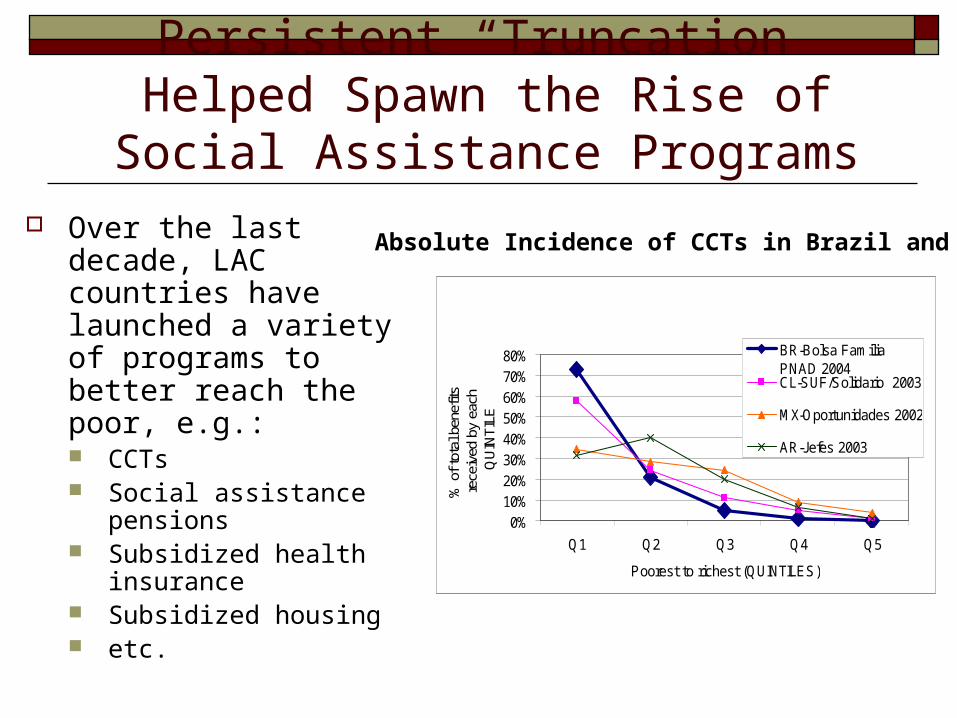
Persistent “Truncation” Helped Spawn the Rise of Social Assistance Programs
Over the last decade, LAC countries have launched a variety of programs to better reach the poor, e.g.: CCTs Social assistance
pensions Subsidized health
insurance Subsidized housing etc.
Absolute Incidence of CCTs in Brazil and LAC
Absolute Incidence - CCTs in Brazil and LAC (QUINTILES)
0%10%20%30%40%50%60%70%80%
Q1 Q2 Q3 Q4 Q5
Poorest to richest (QUINTILES)
% o
f tot
al b
enef
its
rece
ived
by
each
Q
UIN
TILE
BR-Bolsa FamiliaPNAD 2004CL-SUF/Solidario 2003
MX-Oportunidades 2002
AR-Jefes 2003
Government Failures are Pervasive and Create Incentives for Informality
Government failures exist on at least two levels … Weak design of Social Security programs
High costs via payroll contributions; rigid one-size-fits-all approach (young vs. old; paying twice for health insurance)
Excessive “bundling” of benefits (health, pensions, disability, … but also housing, childcare, sports & recreation) taxes contributors
Weak accounting for labor mobility (too-high vesting periods for pensions, intermittent coverage in health)
Low quality of services/benefits
Lack of Incentive Compatibility within the “System” Noncontributory assistance for informal workers increasingly
“compete” with Social Security reinforcing incentives for informality
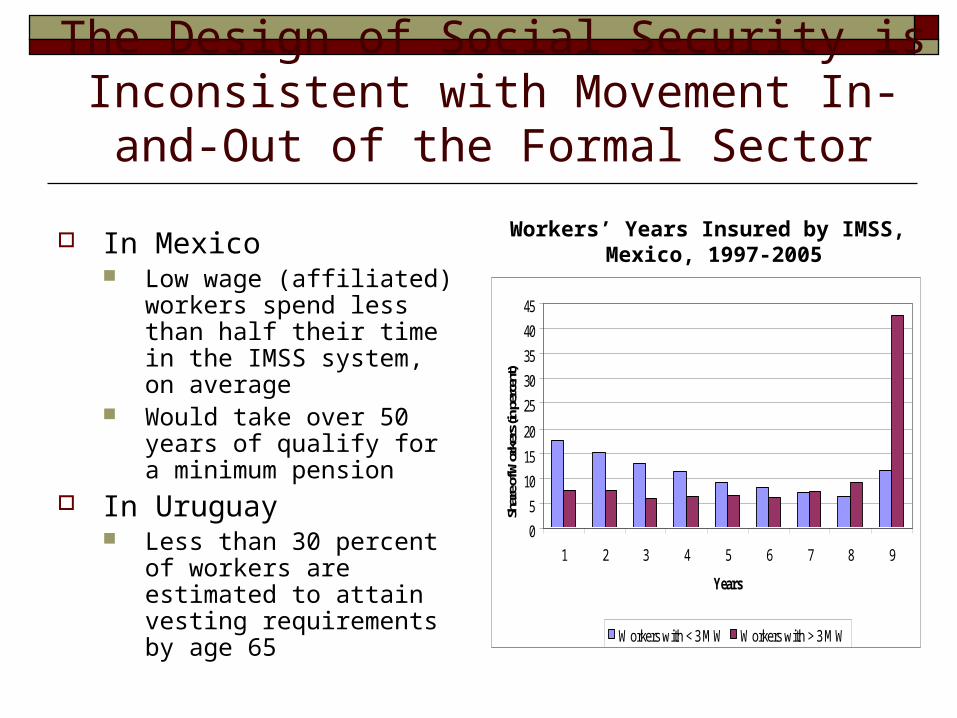
The Design of Social Security is Inconsistent with Movement In-and-Out of the Formal Sector
In Mexico Low wage (affiliated)
workers spend less than half their time in the IMSS system, on average
Would take over 50 years of qualify for a minimum pension
In Uruguay Less than 30 percent of
workers are estimated to attain vesting requirements by age 65
0
5
10
15
20
25
30
35
40
45
1 2 3 4 5 6 7 8 9
Years
Shar
e of W
orke
rs (i
n per
cent
)
Workers with < 3 MW Workers with > 3 MW
Workers’ Years Insured by IMSS, Mexico, 1997-2005
Re-engineering Social Protection to Protect all Citizens
Recommendations grounded in the economics of insurance (Comprehensive Insurance Framework) and in public economics (the appropriate role for public intervention)
In the long-term, ensure Universal “essential cover” in health, de-linked from the labor contract, and
financed by general taxation By facilitating widest possible risk pool, also enhances efficiency of the insurance
model Brazil-Fernandes, Gremaud and Narita (2006): replacing labor tax on first
minimum wage with neutrality reduces informality (1.5%) if capital investments are exempt
Poverty prevention pensions, targeted to the poor, and incentive compatible with multi-pillar systems Both pooling and savings components are important (complementary) Targeted social assistance pensions for “large gap” countries; incentive compatible,
integrated systems (a la Chile) for “smaller gap countries”
The Role of Institutions and Social Norms
Towards an Inclusive Social Contract
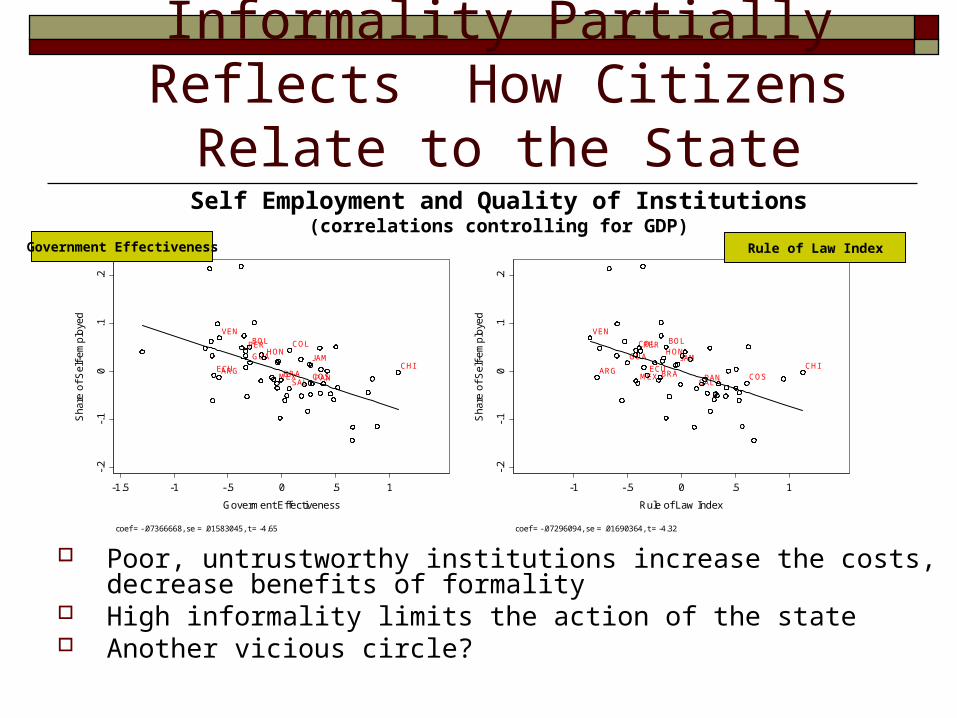
Informality Partially Reflects How Citizens Relate to the State
Self Employment and Quality of Institutions(correlations controlling for GDP)
Poor, untrustworthy institutions increase the costs, decrease benefits of formality
High informality limits the action of the state Another vicious circle?
VEN
ARG
GUA
COL
MEX
PER
ECUBRA
HONBOL
JAM
SALPAN COS
CHI
-.2
-.1
0.1
.2
Sh
are
of S
elf-
em
plo
yed
-1 -.5 0 .5 1
Rule of Law Index
coef = -.07296094, se = .01690364, t = -4.32
Rule of Law Index
ECUARG
VEN
PERBOL
GUAHON
MEXBRASAL
COL
JAM
COSPAN
CHI
-.2
-.1
0.1
.2
Sh
are
of S
elf-
em
plo
yed
-1.5 -1 -.5 0 .5 1
Goverment Effectiveness
coef = -.07366668, se = .01583045, t = -4.65
Government Effectiveness
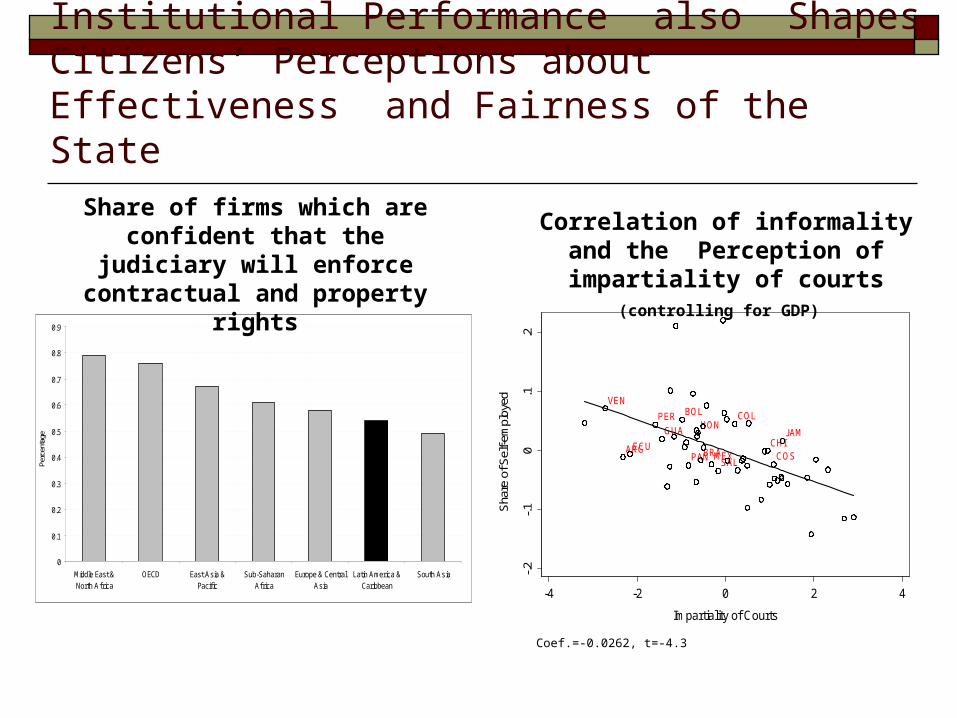
Institutional Performance also Shapes Citizens’ Perceptions about Effectiveness and Fairness of the State
0
0.1
0.2
0.3
0.4
0.5
0.6
0.7
0.8
0.9
Middle East &North Africa
OECD East Asia &Pacif ic
Sub-SaharanAfrica
Europe & CentralAsia
Latin America &Caribbean
South Asia
Perc
enta
ge
Share of firms which are confident that the judiciary will enforce
contractual and property rights
VEN
ARGECU
PER
GUA
BOL
PAN
HON
BRAMEXSAL
COL
CHICOS
JAM
-.2-.1
0.1
.2
Sha
re o
f Sel
f-em
ploy
ed
-4 -2 0 2 4
Impartiality of Courts
coef = -.02625821, se = .00611322, t = -4.3
Correlation of informality and the Perception of impartiality of courts
(controlling for GDP)
Coef.=-0.0262, t=-4.3
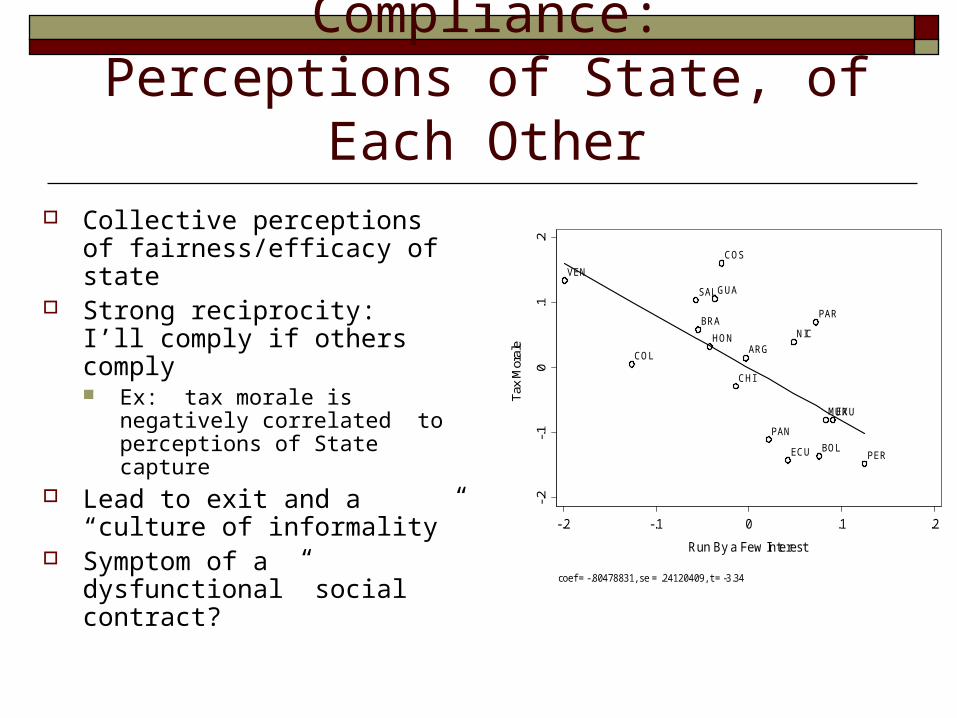
“Social Norms” of Compliance:Perceptions of State, of Each Other
Collective perceptions of fairness/efficacy of state
Strong reciprocity: I’ll comply if others comply Ex: tax morale is negatively
correlated to perceptions of State capture
Lead to exit and a “culture of informality”
Symptom of a dysfunctional” social contract?
VEN
COL
SAL
BRA
HON
GUA
COS
CHI
ARG
PAN
ECU
NIC
PAR
BOL
MEXURU
PER
-.2-.1
0.1
.2
Tax
Mor
ale
-.2 -.1 0 .1 .2
Run By a Few Interest
coef = -.80478831, se = .24120409, t = -3.34
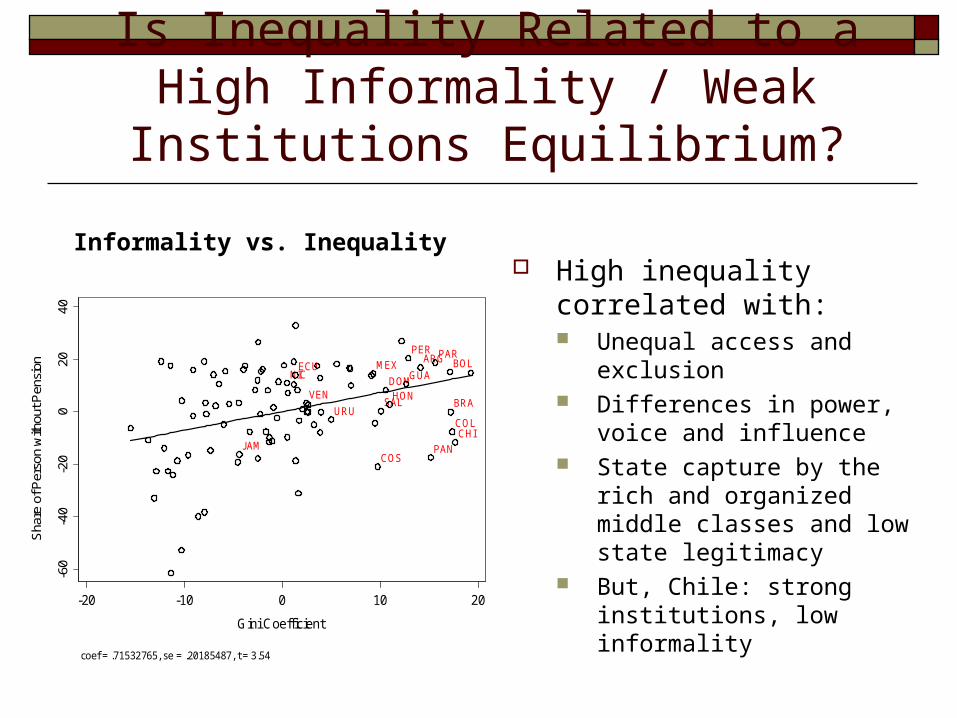
Is Inequality Related to a High Informality / Weak Institutions Equilibrium?
Informality vs. Inequality High inequality correlated
with: Unequal access and
exclusion Differences in power, voice
and influence State capture by the rich and
organized middle classes and low state legitimacy
But, Chile: strong institutions, low informality
JAM
NICECU
VEN
URU
MEX
COS
SAL
DOMHON
GUA
PERARG
PAN
PARBOL
BRA
COLCHI
-60
-40
-20
020
40
Sha
re o
f Per
son
with
out P
ensi
on
-20 -10 0 10 20
Gini Coefficient
coef = .71532765, se = .20185487, t = 3.54
Policies to Reduce Informality Reduce opportunity cost of informality: raise productivity in
the formal sector improved Investment Climate higher human capital accumulation
Remove segmenting distortions in labor markets where applicable
Tilt the benefit/cost ratio of firms and workers to opt for formality: removing distortionary incentives in Social Protection Systems, reducing cost of doing business for all firms improving services associated with formality especially for SME’s,
Improve quality and fairness of institutions and policies and even handed enforcement: move social norms towards a culture of compliance. A potential virtuous circle