Embed Size (px)
Citation preview
1
Informality in Turkey: Size, Trends, Determinants and
Consequences
Background Paper by
José Guilherme Reis
Diego Angel-Urdinola and
Cristian Quijada Torres
for
Country Economic Memorandum (CEM) – Informality: Causes,
Consequences, Policies
June 2009
2
INFORMALITY IN TURKEY: SIZE, TRENDS, DETERMINANTS AND CONSEQUENCES1
1.1 Informality is a matter of concern among policymakers and the business
community throughout the world. Impacts on productivity and growth, reduction in the
tax base and as a consequence in the amount of resources available to invest in the
provision of public goods and equity issues related to the existence of unprotected
workers are, not necessarily in this order, the main concerns associated with having a
significant part of the production and labor force in informality. Businesses tend to be
particularly concerned with the unfair competition associated with informality: recent
World Bank surveys of firms around the world show that firms tend to rank competition
from informal firms as one of their top three obstacles to do business. This can be seen in
14 Latin American countries, where 38.7 percent of the manufacturing firms ranked
informality ahead of issues such as tax rates and access to finance (Gonzalez and
Lamanna, 2007), as well as in countries as diverse as Vietnam and Mozambique, where
this same obstacle was ranked the top constraint for business growth. In the most recent
enterprise survey in Turkey, this topic was ranked the 4th
major constraint for business
growth.2
1.2 Whereas informality has been defined in a number of different ways in the
economic literature, it has been mostly associated with negative economic outcomes,
such as unprotected work, low firm productivity and tax evasion. This traditional view on
the consequences of informality is also usually associated with a particular view of what
drives informality. This view argues that, in general, workers and firms in the informal
sector would prefer to be formal (registering with the state, paying taxes, affiliating with
social security, etc.), but for reasons related to the state of the economy, the functioning
of the labor market, or the regulatory environment, they are prevented from doing so. As
argued by Perry et al. (2007), however, there is considerable evidence suggesting that the
informal sector is fairly heterogeneous, with workers and firms that have been excluded
from the formal economy coexisting with others that have opted out on the basis of
implicit cost benefit analysis. This latter concept of ―exit‖ posits that at least some of
those in the informal sector are there as a matter of choice. Specifically, some workers
and firms, upon making some implicit or explicit assessment of the benefits and costs of
formality, choose to opt out of the formal sector. Given existing opportunities and
constraints, they actually prefer informality. Since there is a wide range of degrees to
which exit or exclusion holds in any economy, these two perspectives are complementary
characterizations rather than competing hypotheses.
1.3 Understanding this heterogeneity in the informal sector, as well as the various
factors that influence individuals and firms’ decisions to ―take their business‖ to the
informal economy, is critical for the design of public policies. Indeed, even in those cases
where informality is driven by exit and not by exclusion, there are good reasons for policy
makers to want to move away from a social equilibrium in which a large number of
1 Paper prepared by José Guilherme Reis (LCSPF, World Bank), Diego Angel-Urdinola (ECSHD, World
Bank), and Cristian Quijada Torres (LCSPF, World Bank). Sunita Varada (consultant), provided excellent
research support. 2 The top 3 constraints were access to finance, tax rates and political instability. The survey was carried out
in 2008 and a report is expected to be published in 2009.
3
workers lack protection from negative shocks, where the informal status of many firms
limits their productivity and growth potential and where a large informal sector reduces
fiscal revenues.
1.4 With this motivation, the present chapter has 3 objectives: the first one is to
review evidence from various data sources, both macro and micro, on the incidence of
informality in Turkey, providing an overview of informal activities in the country; the
second objective is to analyze the role played in the specific case of Turkey of various
potential determinants of informality among firms and workers, again using different
sources of data, including the recent surveys undertaken for this report; third, it aims at
illustrating some of the consequences that informality appears to have on firm
performance.
Defining Informality
1.5 Informality is a heterogeneous concept, encompassing different situations such as
the unregistered small firm, the street vendor and the large, registered, ―formal‖ firm that
employs a share of its workers without offering them written contracts with access to
benefits and unemployment protection. It is thus difficult to measure and evaluate, and
actually impossible to characterize on a one-size-fits-all basis. Participants in the informal
sector, whether firms or workers, may have chosen to be there or may have been
excluded from the formal sector; some of the formal firms ―hide‖ sales (and thus taxes)
and employees (and thus contributions), while informal participants may pay some or no
taxes, suggesting that informality can hardly be described as a dichotomous condition.
Adding a time dimension does not help much in disentangling the observed behaviors:
available evidence suggests that informal participants may stay in the sector for a short or
extended period of time. Moreover, the short run relationship between the informal sector
and growth varies across countries—there is evidence of pro-cyclicality as well as of
counter-cyclicality, depending on specific countries and periods. In the long run, the
informal sector may vary in nature according to the phase of the development cycle—as
economic opportunities grow, incentives to ―start-up‖ a small business may expand,
while the attractiveness of informal wage labor may decline.
1.6 In general terms, the informal sector is broadly defined as the collection of firms,
workers, and activities that operate outside the legal and regulatory frameworks. The
reality is that different types of informality co-exist and that no one definition is likely to
be a self-contained characterization of the sector. There are informal activities that aim,
first, at the survival of the individual or household through direct subsistence production
or through simple sale of goods and services in the market, while there are others more
oriented toward increasing managerial flexibility and decreasing labor costs of formal
sector firms through off-the-books hiring and sub-contracting of informal entrepreneurs
(Portes and Haller, 2005).
1.7 Informal activities of survival are more associated to developing countries (Portes
and Haller, 2005; Gerxhani, 2004). Gerxhani (2004) argues, for instance, that informal
activities geared towards survival can broadly be described as both labor-intensive and
low-technology. They also bring in modest capital accumulation, if any at all. However
4
many of the indicators commonly used to measure informality, such as status of labor,
unreported income and tax evasion, and GNP accounts, imply that the informal activities
being measured are directed towards activities that go beyond just ―survival‖. Hence
informality is more than the sum of the self-employed, and the crude differentiation
between the registered and the un-registered firms would not suffice to characterize
informality in its multi-faceted totality. By focusing on activities of the registered firms,
for instance, the Enterprise Surveys of the World Bank clearly acknowledges informality
as in continuum rather than as bipolar opposite of the formal. Therefore any research on
informality conducted in a country of substantial industrial activity such as Turkey should
account for informal activities of the registered firms as well as the unregistered activities
of the survival type.
Measuring Informality3
1.8 If defining informality is a complex task, its measurement is an even more
daunting one. Given that it is identified with working outside the legal and regulatory
frameworks, informality is best described as a hidden, unobserved variable. That is, a
variable for which an accurate and complete measurement is not feasible but for which an
approximation is possible through indicators reflecting its various aspects. To provide an
estimate of the magnitude of informality in a country, it is better to use different
indicators which, when taken together, can provide a more robust approximation to
informality. Because of the ―hidden‖ nature of the sector and its heterogeneity, this
report relies on a combination of indicators to arrive at a sense of the scale of informal
activity. These same indicators are used later in the chapter to test different hypotheses
regarding the motivations behind decisions to become informal.
1.9 There are essentially two methods to measure informality: the first type is a direct
(micro) measurement based on individual surveys, such as the World Bank’s Enterprise
Surveys, which explicitly ask the firm’s owner or manager the year when the firm started
its operations and the year the firm was legally registered. A discrepancy between the two
is typically considered as the time when the firm operated informally. In some household
surveys or labor forces surveys, interviewees are asked whether in their current
employment they have signed a formal contract, or whether they are affiliated to the
social security administration (meaning that they, or their employer are contributing to a
pension plan or other protection program). The problem with this measure is that the
interviewee’s answer depends heavily on the phrasing of the question, and (in the case of
firms for instance) many interviewees will be reluctant to reveal their behavior, so that
one has to formulate indirect questions instead, which are likely to be much less accurate.
In addition, looking at workers covered by a pension plan, for instance, might be
misleading as some countries have recently shifted their participation schemes to include
self-employed workers, hence blurring the distinction between pension-plan holders as
formal and non-holders as informal.
1.10 The tax-audits method basically takes data from tax audits to determine the
percentage of the firms audited that evaded taxes and quantifies the amount of tax
3 This section is largely based on Perry and all (2007) and on Oviedo (2008).
5
underreporting as informal activity (one can also determine the legal status of the firm
with tax audits). The shortcoming of this information is that typically tax audits are not
conducted randomly and hence the information is not representative of the population of
firms.
1.11 Several indirect techniques use aggregate data instead. The first measure
estimates the size of the informal economy as the difference between aggregate income
and aggregate expenditure from the National Accounts, however, it has been used in a
few developed countries only, as it requires independent calculations of aggregate income
and expenditure. From the employment perspective, measures include taking the
difference between total labor force and total employment, and an index of pension
coverage of the population. The latter has the caveat that in recent years, coverage has
been expanded in several countries to the overall population regardless of their
employment status.
1.12 Other indirect techniques include the physical input approach, which measures
the growth of the informal economy as the difference between the growth rate of GDP
and the growth rate of electricity consumption. A related measure takes the difference
between the fitted values of an estimated money demand equation and the actual amount
of cash that circulates in the economy. These measures have several disadvantages. First,
they both assume that in the base year of the estimation (chosen arbitrarily according to
sample availability) the size of the informal sector is close to zero. Second, they both
make unrealistic assumptions about the use of electricity (constant coefficient per unit of
GDP, which ignores technological progress) and of money demand (common velocity of
circulation in formal and informal sector, and exclusive use of cash in the informal
sector). In practice, both measures are highly sensitive to variation in these assumptions:
in particular, changing the base year for the estimation of either model produces very
different estimates of the size of the informal sector.
1.13 Yet another method that has been used in recent years is the Multiple Indicator-
Multiple Cause (MIMIC) model, popularized by Schneider (2004) who applied it for 145
countries. This model assumes that while informal activity is not observable, its
magnitude can be represented by a latent variable (in index form), and both its causes and
effects can be observed and measured. This latent variable is then used in a set of two
equations: in the first, the latent variable is the dependent variable and its causes are the
explanatory variables; in the second, the effects of informality are modeled as a function
of the latent variable. The set is then simultaneously estimated and the fitted values of the
latent variable are used to compute an estimate of the size of the informal sector as a
share of GDP. This technique has been criticized because of the lack of theoretical
support for the equations supposed to capture the causes and effects of informal activity,
and it has also been argued that the estimation results are sensitive to transformations of
the data, to measurement units, and to the sample used. Its use, nevertheless, remains
widespread, probably as a consequence of the aforementioned difficulties to obtain broad
estimates of informality.
1.14 In addition to estimating the size or stock of informal activities, it is also
important to measure flows, incorporating the movements into and out of informality that
6
indeed take place for many individuals and firms throughout their lifetime. A few studies
have quantified these movements; among them we can cite Flores et al. (2004) and
Maloney (2004) for Mexico, and Perry et al. (2007) for other Latin American countries.
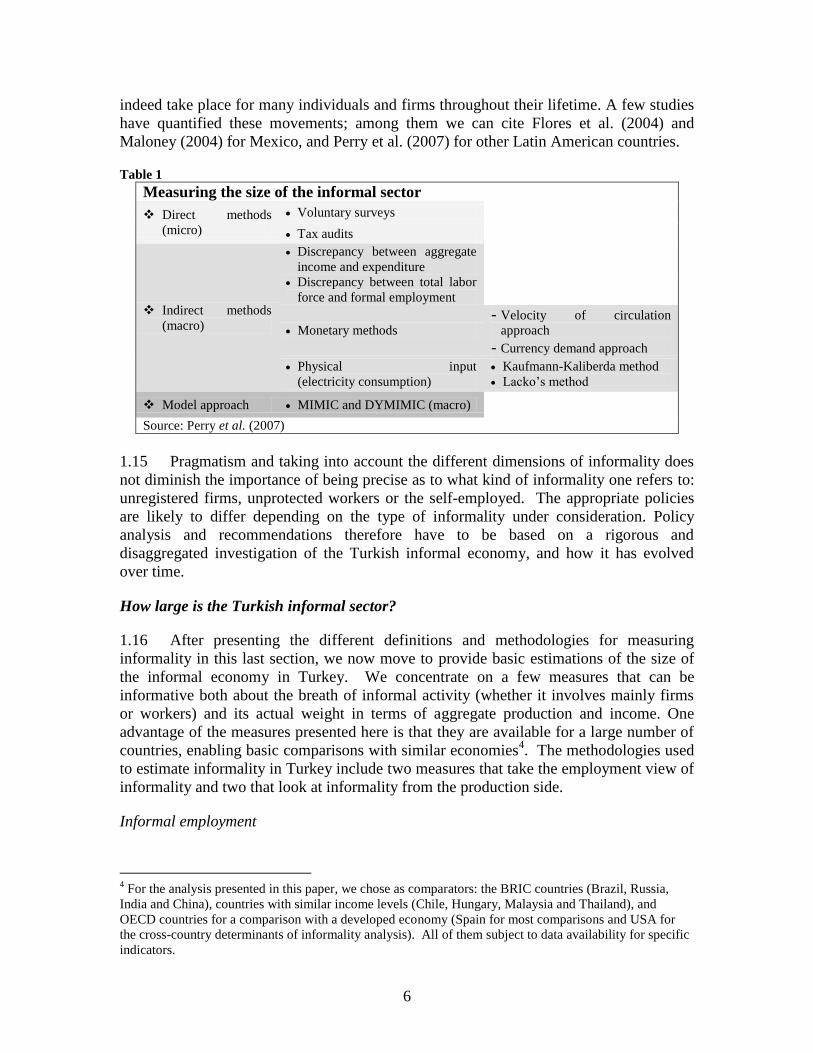
Table 1
Measuring the size of the informal sector
Direct methods
(micro)
Voluntary surveys
Tax audits
Indirect methods
(macro)
Discrepancy between aggregate
income and expenditure
Discrepancy between total labor
force and formal employment
Monetary methods
- Velocity of circulation
approach
- Currency demand approach
Physical input
(electricity consumption)
Kaufmann-Kaliberda method
Lacko’s method
Model approach MIMIC and DYMIMIC (macro)
Source: Perry et al. (2007)
1.15 Pragmatism and taking into account the different dimensions of informality does
not diminish the importance of being precise as to what kind of informality one refers to:
unregistered firms, unprotected workers or the self-employed. The appropriate policies
are likely to differ depending on the type of informality under consideration. Policy
analysis and recommendations therefore have to be based on a rigorous and
disaggregated investigation of the Turkish informal economy, and how it has evolved
over time.
How large is the Turkish informal sector?
1.16 After presenting the different definitions and methodologies for measuring
informality in this last section, we now move to provide basic estimations of the size of
the informal economy in Turkey. We concentrate on a few measures that can be
informative both about the breath of informal activity (whether it involves mainly firms
or workers) and its actual weight in terms of aggregate production and income. One
advantage of the measures presented here is that they are available for a large number of
countries, enabling basic comparisons with similar economies4. The methodologies used
to estimate informality in Turkey include two measures that take the employment view of
informality and two that look at informality from the production side.
Informal employment
4 For the analysis presented in this paper, we chose as comparators: the BRIC countries (Brazil, Russia,
India and China), countries with similar income levels (Chile, Hungary, Malaysia and Thailand), and
OECD countries for a comparison with a developed economy (Spain for most comparisons and USA for
the cross-country determinants of informality analysis). All of them subject to data availability for specific
indicators.
7
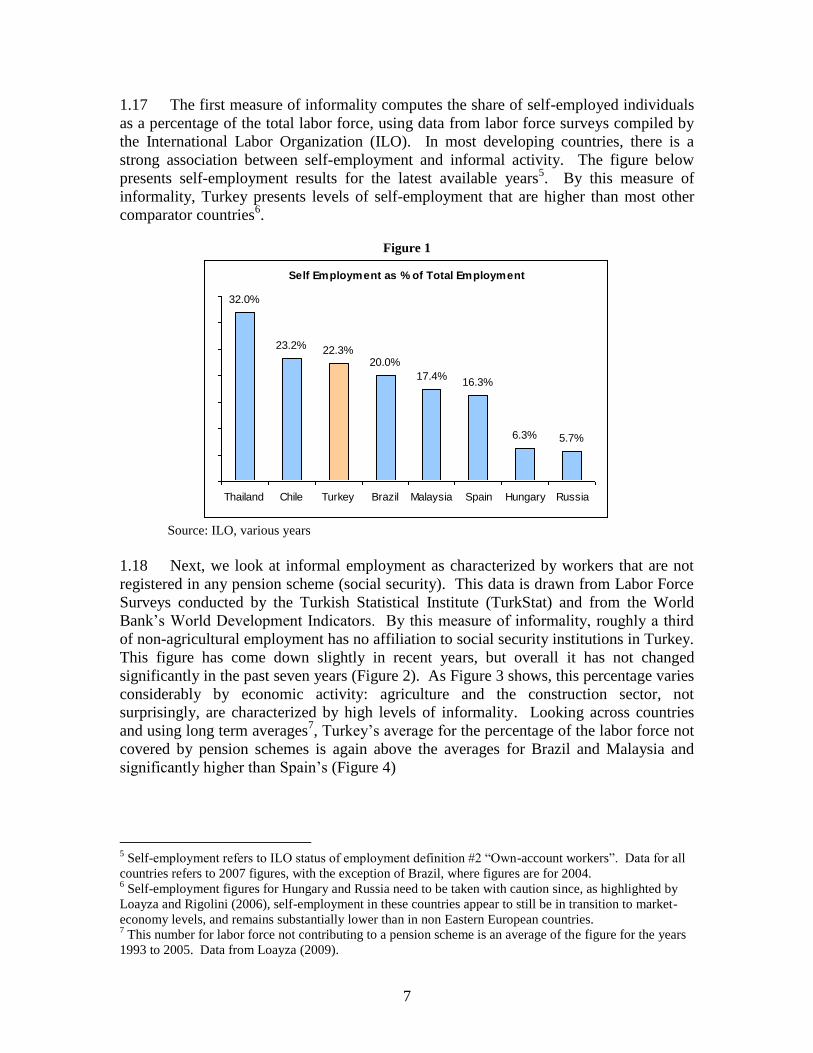
1.17 The first measure of informality computes the share of self-employed individuals
as a percentage of the total labor force, using data from labor force surveys compiled by
the International Labor Organization (ILO). In most developing countries, there is a
strong association between self-employment and informal activity. The figure below
presents self-employment results for the latest available years5. By this measure of
informality, Turkey presents levels of self-employment that are higher than most other
comparator countries6.
Figure 1
Source: ILO, various years
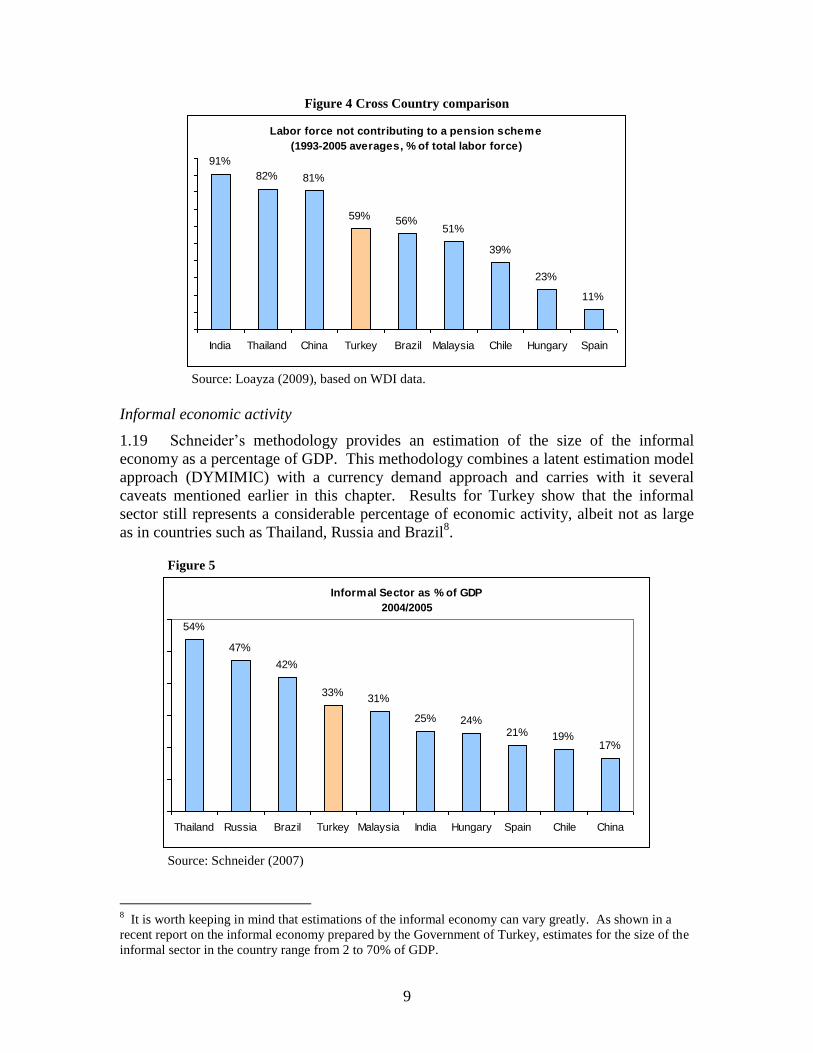
1.18 Next, we look at informal employment as characterized by workers that are not
registered in any pension scheme (social security). This data is drawn from Labor Force
Surveys conducted by the Turkish Statistical Institute (TurkStat) and from the World
Bank’s World Development Indicators. By this measure of informality, roughly a third
of non-agricultural employment has no affiliation to social security institutions in Turkey.
This figure has come down slightly in recent years, but overall it has not changed
significantly in the past seven years (Figure 2). As Figure 3 shows, this percentage varies
considerably by economic activity: agriculture and the construction sector, not
surprisingly, are characterized by high levels of informality. Looking across countries
and using long term averages7, Turkey’s average for the percentage of the labor force not
covered by pension schemes is again above the averages for Brazil and Malaysia and
significantly higher than Spain’s (Figure 4)
5 Self-employment refers to ILO status of employment definition #2 ―Own-account workers‖. Data for all
countries refers to 2007 figures, with the exception of Brazil, where figures are for 2004. 6 Self-employment figures for Hungary and Russia need to be taken with caution since, as highlighted by
Loayza and Rigolini (2006), self-employment in these countries appear to still be in transition to market-
economy levels, and remains substantially lower than in non Eastern European countries. 7 This number for labor force not contributing to a pension scheme is an average of the figure for the years
1993 to 2005. Data from Loayza (2009).
Self Employment as % of Total Employment
32.0%
23.2% 22.3%20.0%
17.4%16.3%
6.3% 5.7%
Thailand Chile Turkey Brazil Malaysia Spain Hungary Russia

8
Figure 2 Non-Agriculture Informal Employment (no pension coverage)
as % of Total Non-Agriculture Employment
Source: TurkStat
Figure 3 Informal Employment (no pension coverage)as % of Total Employment,
by Sector
Source: Turkstat (2006)
0%
5%
10%
15%
20%
25%
30%
35%
40%
2000 2001 2002 2003 2004 2005 2006 2007
Total Men Women
87.4%
62.2%
48.5%
43.1%
39.9%
32.0%
19.6%
18.0%
15.6%
3.2%
Agriculture, forestry, hunting & fishery
Construction & Public Works
Overall
Wholesale & retail, restaurants & hotels
Transport, communications & storage
Manufacturing
Financial institutions, insurance and real estate
Community services, social & personal services
Mining
Electricity, w ater & gas
9
Figure 4 Cross Country comparison
Source: Loayza (2009), based on WDI data.
Informal economic activity
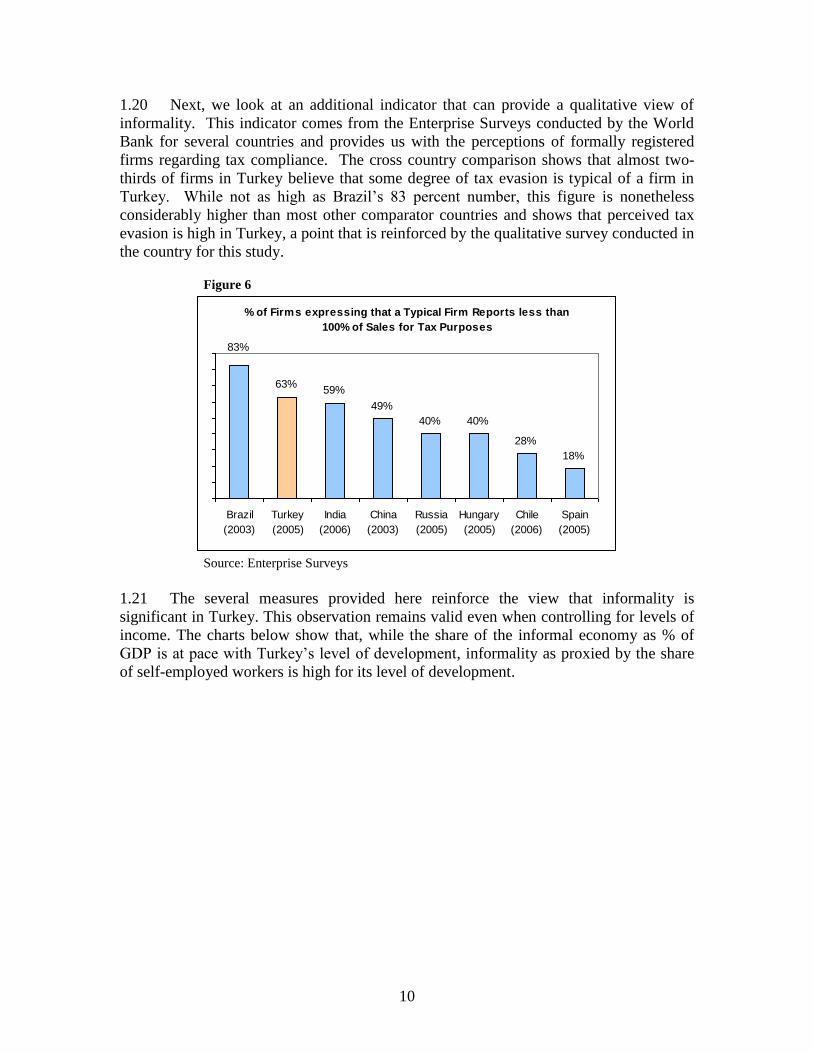
1.19 Schneider’s methodology provides an estimation of the size of the informal
economy as a percentage of GDP. This methodology combines a latent estimation model
approach (DYMIMIC) with a currency demand approach and carries with it several
caveats mentioned earlier in this chapter. Results for Turkey show that the informal
sector still represents a considerable percentage of economic activity, albeit not as large
as in countries such as Thailand, Russia and Brazil8.
Figure 5
Source: Schneider (2007)
8 It is worth keeping in mind that estimations of the informal economy can vary greatly. As shown in a
recent report on the informal economy prepared by the Government of Turkey, estimates for the size of the
informal sector in the country range from 2 to 70% of GDP.
Labor force not contributing to a pension scheme
(1993-2005 averages, % of total labor force)
91%
82% 81%
59% 56%51%
39%
23%
11%
India Thailand China Turkey Brazil Malaysia Chile Hungary Spain
Informal Sector as % of GDP
2004/2005
54%
47%
42%
33%31%
25% 24%21% 19%
17%
Thailand Russia Brazil Turkey Malaysia India Hungary Spain Chile China
10
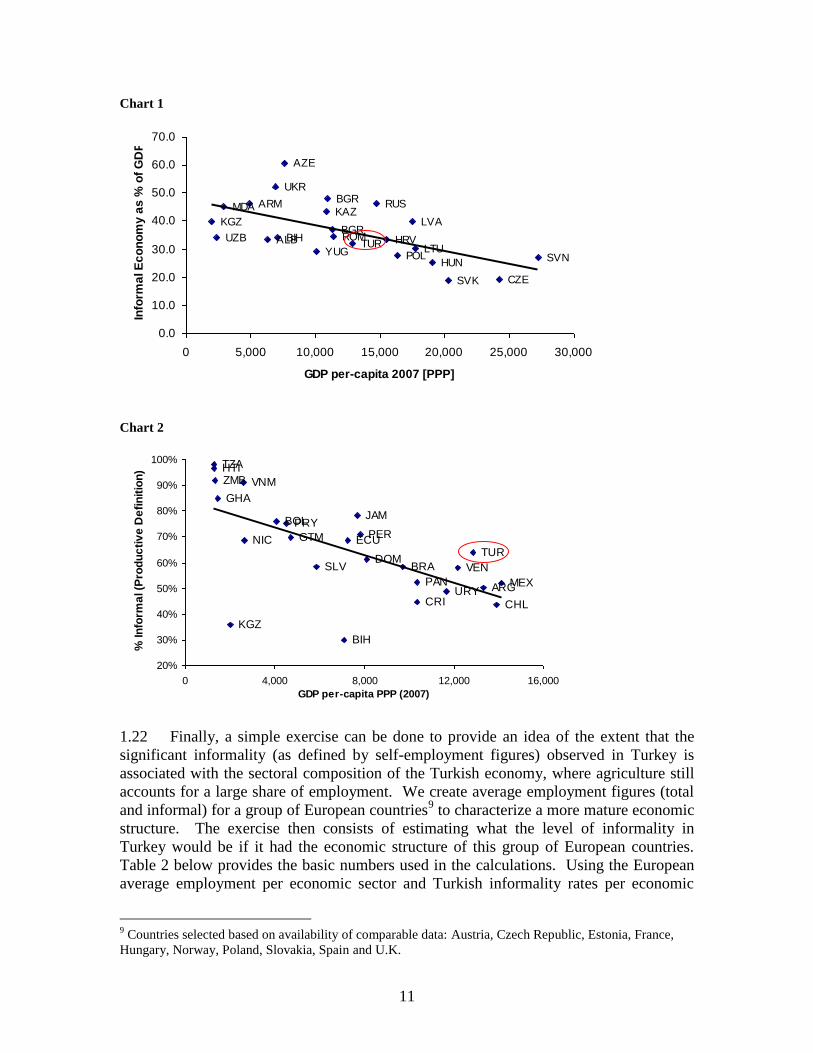
1.20 Next, we look at an additional indicator that can provide a qualitative view of
informality. This indicator comes from the Enterprise Surveys conducted by the World
Bank for several countries and provides us with the perceptions of formally registered
firms regarding tax compliance. The cross country comparison shows that almost two-
thirds of firms in Turkey believe that some degree of tax evasion is typical of a firm in
Turkey. While not as high as Brazil’s 83 percent number, this figure is nonetheless
considerably higher than most other comparator countries and shows that perceived tax
evasion is high in Turkey, a point that is reinforced by the qualitative survey conducted in
the country for this study.
Figure 6
Source: Enterprise Surveys
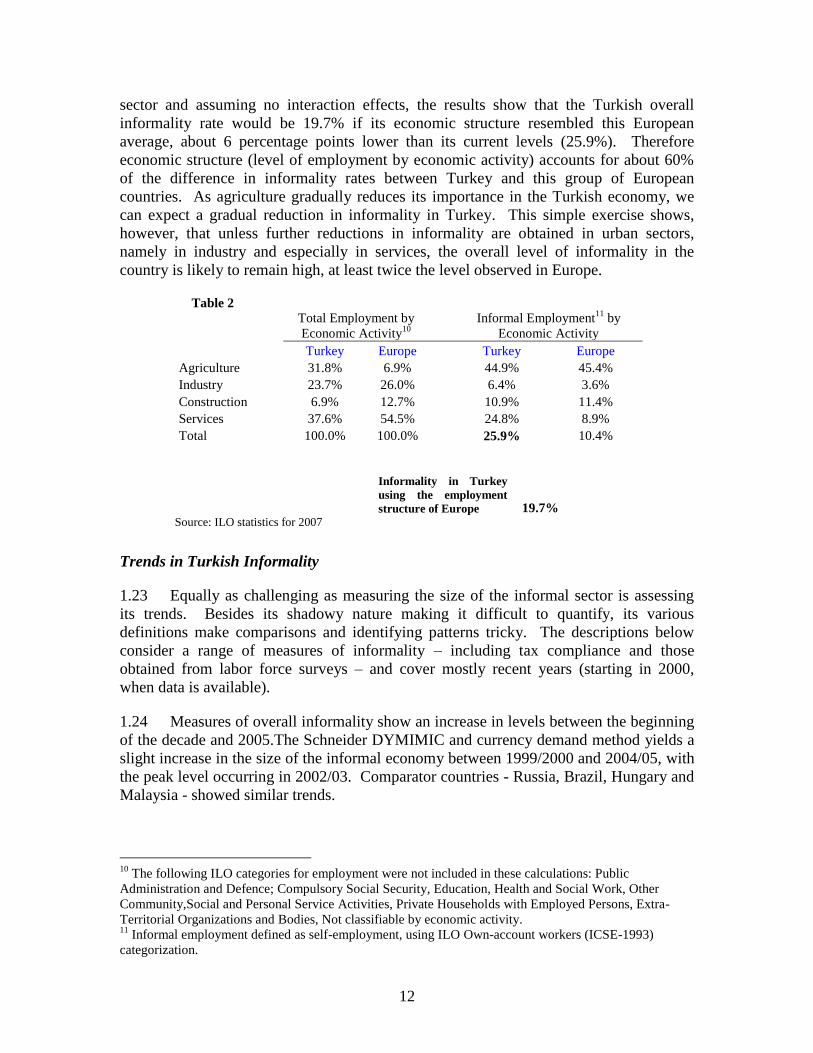
1.21 The several measures provided here reinforce the view that informality is
significant in Turkey. This observation remains valid even when controlling for levels of
income. The charts below show that, while the share of the informal economy as % of
GDP is at pace with Turkey’s level of development, informality as proxied by the share
of self-employed workers is high for its level of development.
% of Firms expressing that a Typical Firm Reports less than
100% of Sales for Tax Purposes
63%59%
49%
40% 40%
28%
18%
83%
Brazil
(2003)
Turkey
(2005)
India
(2006)
China
(2003)
Russia
(2005)
Hungary
(2005)
Chile
(2006)
Spain
(2005)
11
Chart 1
Chart 2
1.22 Finally, a simple exercise can be done to provide an idea of the extent that the
significant informality (as defined by self-employment figures) observed in Turkey is
associated with the sectoral composition of the Turkish economy, where agriculture still
accounts for a large share of employment. We create average employment figures (total
and informal) for a group of European countries9 to characterize a more mature economic
structure. The exercise then consists of estimating what the level of informality in
Turkey would be if it had the economic structure of this group of European countries.
Table 2 below provides the basic numbers used in the calculations. Using the European
average employment per economic sector and Turkish informality rates per economic
9 Countries selected based on availability of comparable data: Austria, Czech Republic, Estonia, France,
Hungary, Norway, Poland, Slovakia, Spain and U.K.
ALB
ARM
AZE
BGR
BIHBGR
HRV
CZE
HUN
KAZKGZ LVA
LTU
MDA
POL
ROM
RUS
YUG
SVK
SVN
TUR
UKR
UZB
0.0
10.0
20.0
30.0
40.0
50.0
60.0
70.0
0 5,000 10,000 15,000 20,000 25,000 30,000
GDP per-capita 2007 [PPP]
Info
rma
l E
co
no
my
as
% o
f G
DP
ARG
BOL
BIH
BRA
CHLCRI
DOM
ECU
SLV
GHA
GTM
HTI
JAM
KGZ
MEX
NIC
PAN
PRYPER
TZA
TUR
URY
VEN
VNMZMB
20%
30%
40%
50%
60%
70%
80%
90%
100%
0 4,000 8,000 12,000 16,000
GDP per-capita PPP (2007)
% In
form
al (P
rod
uc
tiv
e D
efi
nit
ion
)
12
sector and assuming no interaction effects, the results show that the Turkish overall
informality rate would be 19.7% if its economic structure resembled this European
average, about 6 percentage points lower than its current levels (25.9%). Therefore
economic structure (level of employment by economic activity) accounts for about 60%
of the difference in informality rates between Turkey and this group of European
countries. As agriculture gradually reduces its importance in the Turkish economy, we
can expect a gradual reduction in informality in Turkey. This simple exercise shows,
however, that unless further reductions in informality are obtained in urban sectors,
namely in industry and especially in services, the overall level of informality in the
country is likely to remain high, at least twice the level observed in Europe.
Table 2
Total Employment by
Economic Activity10
Informal Employment11
by
Economic Activity
Turkey Europe Turkey Europe
Agriculture 31.8% 6.9% 44.9% 45.4%
Industry 23.7% 26.0% 6.4% 3.6%
Construction 6.9% 12.7% 10.9% 11.4%
Services 37.6% 54.5% 24.8% 8.9%
Total 100.0% 100.0% 25.9% 10.4%
Informality in Turkey
using the employment
structure of Europe 19.7% Source: ILO statistics for 2007
Trends in Turkish Informality
1.23 Equally as challenging as measuring the size of the informal sector is assessing
its trends. Besides its shadowy nature making it difficult to quantify, its various
definitions make comparisons and identifying patterns tricky. The descriptions below
consider a range of measures of informality – including tax compliance and those
obtained from labor force surveys – and cover mostly recent years (starting in 2000,
when data is available).
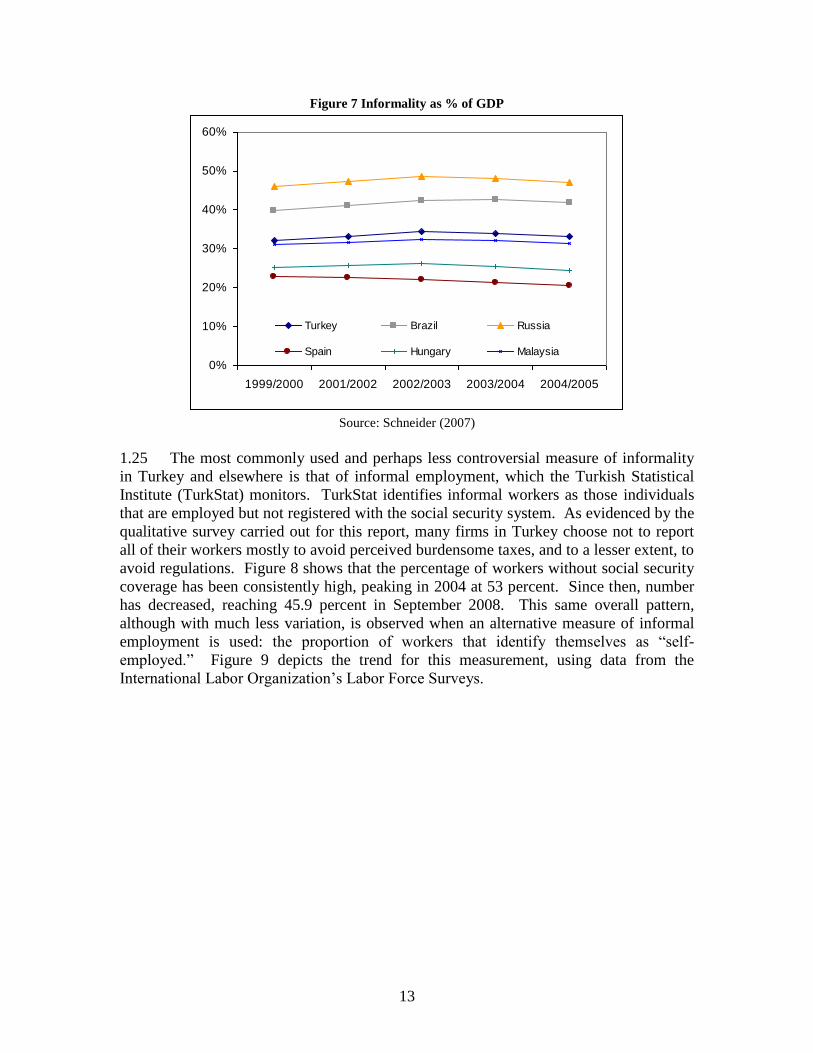
1.24 Measures of overall informality show an increase in levels between the beginning
of the decade and 2005.The Schneider DYMIMIC and currency demand method yields a
slight increase in the size of the informal economy between 1999/2000 and 2004/05, with
the peak level occurring in 2002/03. Comparator countries - Russia, Brazil, Hungary and
Malaysia - showed similar trends.
10
The following ILO categories for employment were not included in these calculations: Public
Administration and Defence; Compulsory Social Security, Education, Health and Social Work, Other
Community,Social and Personal Service Activities, Private Households with Employed Persons, Extra-
Territorial Organizations and Bodies, Not classifiable by economic activity. 11
Informal employment defined as self-employment, using ILO Own-account workers (ICSE-1993)
categorization.
13
Figure 7 Informality as % of GDP
Source: Schneider (2007)
1.25 The most commonly used and perhaps less controversial measure of informality
in Turkey and elsewhere is that of informal employment, which the Turkish Statistical
Institute (TurkStat) monitors. TurkStat identifies informal workers as those individuals
that are employed but not registered with the social security system. As evidenced by the
qualitative survey carried out for this report, many firms in Turkey choose not to report
all of their workers mostly to avoid perceived burdensome taxes, and to a lesser extent, to
avoid regulations. Figure 8 shows that the percentage of workers without social security
coverage has been consistently high, peaking in 2004 at 53 percent. Since then, number
has decreased, reaching 45.9 percent in September 2008. This same overall pattern,
although with much less variation, is observed when an alternative measure of informal
employment is used: the proportion of workers that identify themselves as ―self-
employed.‖ Figure 9 depicts the trend for this measurement, using data from the
International Labor Organization’s Labor Force Surveys.
0%
10%
20%
30%
40%
50%
60%
1999/2000 2001/2002 2002/2003 2003/2004 2004/2005
Turkey Brazil Russia
Spain Hungary Malaysia

14
Figure 8
Source: TUIK, Labor Force Survey.
Figure 9
Source: International Labor Organization Statistics
Disaggregating Labor Informality Trends12
1.26 We next disaggregate the trends for labor informality by employment sector,
education level, profession, employment status and firm size. The goal is to determine
the main forces behind the decreasing trend in informality observed in the period 2001 to
200613
. We look first at the employment sector breakdown.
12
The definition for informality used in this section of the report is that of workers without pension
coverage (i.e. not registered with any social security institution), unless noted otherwise. 13
More recently, a drop in non-agricultural informality has been observed. This fall has been concentrated
in regular and casual employees, especially women and took place despite a slight increase in informal self-
Percentage of Informality in Total Employment
50.6%
52.9%
52.1%51.7%
53.0%
50.1%
48.5%
46.9%
45.9%
42%
44%
46%
48%
50%
52%
54%
2000 2001 2002 2003 2004 2005 2006 2007 2008
Percentage of Informality in Total Employment - ILO
23.5%
22.3%
24.7%24.9%
23.8%24.8% 24.7% 24.7%
16%
18%
20%
22%
24%
26%
28%
30%
2000 2001 2002 2003 2004 2005 2006 2007
15
Employment Sector
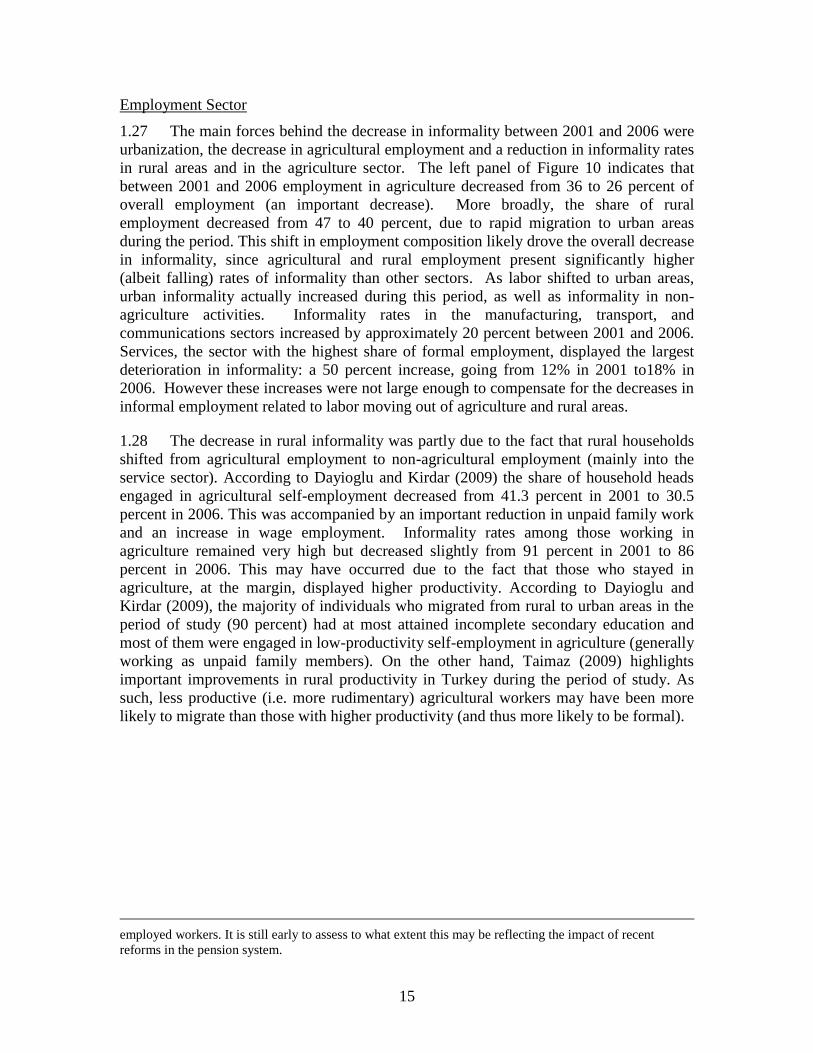
1.27 The main forces behind the decrease in informality between 2001 and 2006 were
urbanization, the decrease in agricultural employment and a reduction in informality rates
in rural areas and in the agriculture sector. The left panel of Figure 10 indicates that
between 2001 and 2006 employment in agriculture decreased from 36 to 26 percent of
overall employment (an important decrease). More broadly, the share of rural
employment decreased from 47 to 40 percent, due to rapid migration to urban areas
during the period. This shift in employment composition likely drove the overall decrease
in informality, since agricultural and rural employment present significantly higher
(albeit falling) rates of informality than other sectors. As labor shifted to urban areas,
urban informality actually increased during this period, as well as informality in non-
agriculture activities. Informality rates in the manufacturing, transport, and
communications sectors increased by approximately 20 percent between 2001 and 2006.
Services, the sector with the highest share of formal employment, displayed the largest
deterioration in informality: a 50 percent increase, going from 12% in 2001 to18% in
2006. However these increases were not large enough to compensate for the decreases in
informal employment related to labor moving out of agriculture and rural areas.
1.28 The decrease in rural informality was partly due to the fact that rural households
shifted from agricultural employment to non-agricultural employment (mainly into the
service sector). According to Dayioglu and Kirdar (2009) the share of household heads
engaged in agricultural self-employment decreased from 41.3 percent in 2001 to 30.5
percent in 2006. This was accompanied by an important reduction in unpaid family work
and an increase in wage employment. Informality rates among those working in
agriculture remained very high but decreased slightly from 91 percent in 2001 to 86
percent in 2006. This may have occurred due to the fact that those who stayed in
agriculture, at the margin, displayed higher productivity. According to Dayioglu and
Kirdar (2009), the majority of individuals who migrated from rural to urban areas in the
period of study (90 percent) had at most attained incomplete secondary education and
most of them were engaged in low-productivity self-employment in agriculture (generally
working as unpaid family members). On the other hand, Taimaz (2009) highlights
important improvements in rural productivity in Turkey during the period of study. As
such, less productive (i.e. more rudimentary) agricultural workers may have been more
likely to migrate than those with higher productivity (and thus more likely to be formal).
employed workers. It is still early to assess to what extent this may be reflecting the impact of recent
reforms in the pension system.
16
Figure 10 Informality Rates and Employment Composition by Employment Sector
in Turkey [2001 – 2006]
Source: World Bank using 2001-2006 LFS data.
36
47
33
45
26
40
0
10
20
30
40
50
60
70
80
90
100
Agriculture Rural
% o
f T
ota
l E
mp
loy
me
nt
2001 2003 2006
29
75
31
52
35
91
34
66
48
86
0
10
20
30
40
50
60
70
80
90
100
Agriculture Non
Agriculture
Rural Urban Total
% In
form
al
2001 2003 2006
17
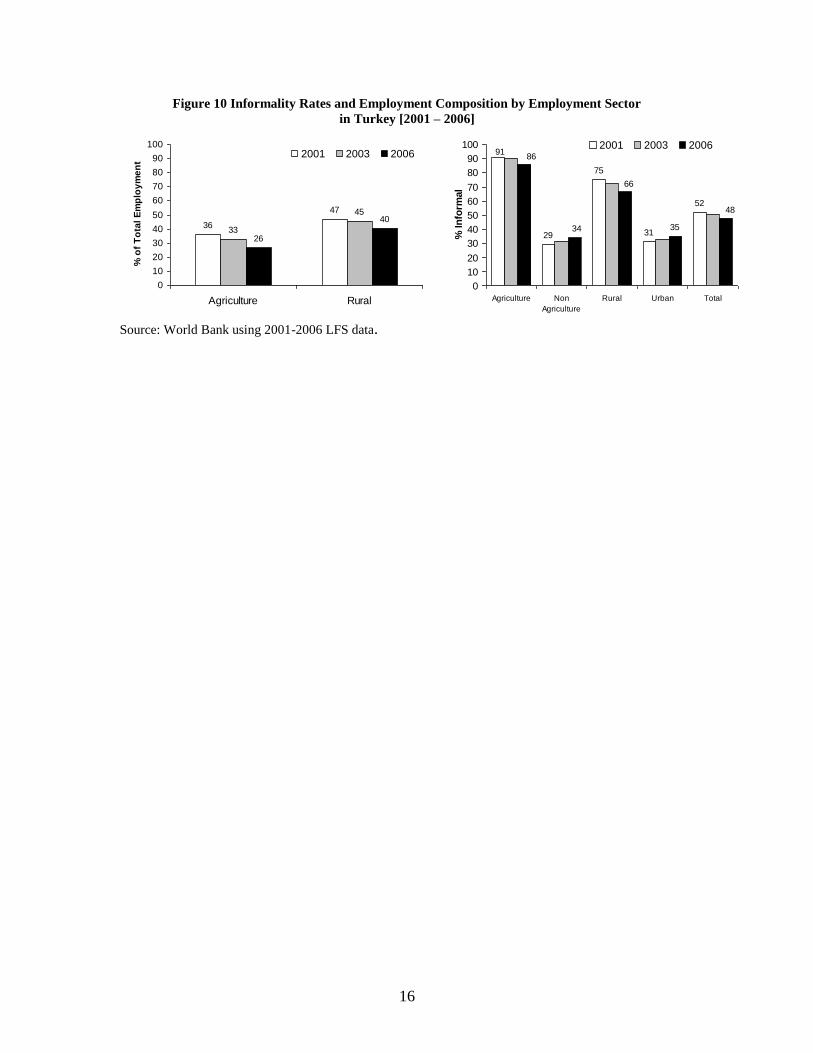
Figure 11 Dynamics of Informality and Employment by Employment Sector in Turkey
[2001 – 2006]
Source: World Bank using 2001-2006 LFS data. Bubble graph: The X Axis illustrates the percentage
change in employment composition; the Y Axis, the percentage change in informality rates. The size of the
Bubble illustrated the informality rate in 2006
Education Level
1.29 Improvements in informality mainly benefited unskilled labor, which still
accounts for the majority of the employed population. The left panel of Figure 12
indicates the composition of employment in Turkey by educational attainment. Not
surprisingly, informality rates are higher among individuals with lower education
attainment and decrease as workers become more educated. Estimates for 2006 indicate
that the majority of all individuals employed in Turkey (52 percent) have attained at most
primary education. However, since Turkey is becoming a more educated country, the
Share of Employment by Industry in Turkey, 2006
Agriculture
27%
Manufacturing
19%Costruction
6%
Trans./commun.
5%
Fin./real estate
svs.
5%
Services
17%
Wholesale
21%
Agriculture
[86% informal]
Manuf.
[32% Informal]
Costruction
[58% Informal]
Wholesale
[43% Informal]
Trans./commun.
[40% informal]Fin./real estate svs.
[19% informal]
Services
[18% Informal]
-20.0%
0.0%
20.0%
40.0%
60.0%
80.0%
-50.0% -25.0% 0.0% 25.0% 50.0%
Size of the Buble:
Informality rate in 2006
% Change in Informality
[2001-2006]
% Change in
Pop Share
[2001-2006]
Share of TTL employment
is growing
Informality
is growing
18
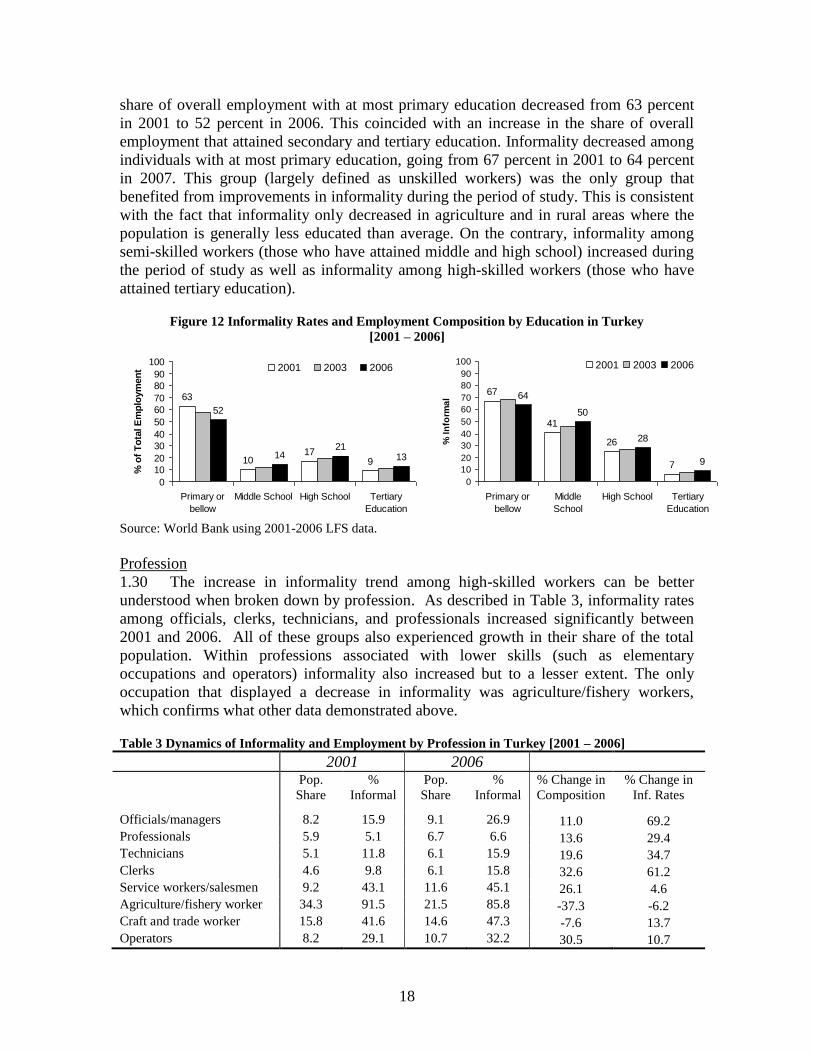
share of overall employment with at most primary education decreased from 63 percent
in 2001 to 52 percent in 2006. This coincided with an increase in the share of overall
employment that attained secondary and tertiary education. Informality decreased among
individuals with at most primary education, going from 67 percent in 2001 to 64 percent
in 2007. This group (largely defined as unskilled workers) was the only group that
benefited from improvements in informality during the period of study. This is consistent
with the fact that informality only decreased in agriculture and in rural areas where the
population is generally less educated than average. On the contrary, informality among
semi-skilled workers (those who have attained middle and high school) increased during
the period of study as well as informality among high-skilled workers (those who have
attained tertiary education).
Figure 12 Informality Rates and Employment Composition by Education in Turkey
[2001 – 2006]
Source: World Bank using 2001-2006 LFS data.
Profession
1.30 The increase in informality trend among high-skilled workers can be better
understood when broken down by profession. As described in Table 3, informality rates
among officials, clerks, technicians, and professionals increased significantly between
2001 and 2006. All of these groups also experienced growth in their share of the total
population. Within professions associated with lower skills (such as elementary
occupations and operators) informality also increased but to a lesser extent. The only
occupation that displayed a decrease in informality was agriculture/fishery workers,
which confirms what other data demonstrated above.
Table 3 Dynamics of Informality and Employment by Profession in Turkey [2001 – 2006]
2001 2006 Pop.
Share
%
Informal
Pop.
Share
%
Informal
% Change in
Composition
% Change in
Inf. Rates
Officials/managers 8.2 15.9 9.1 26.9 11.0 69.2
Professionals 5.9 5.1 6.7 6.6 13.6 29.4
Technicians 5.1 11.8 6.1 15.9 19.6 34.7
Clerks 4.6 9.8 6.1 15.8 32.6 61.2
Service workers/salesmen 9.2 43.1 11.6 45.1 26.1 4.6
Agriculture/fishery worker 34.3 91.5 21.5 85.8 -37.3 -6.2
Craft and trade worker 15.8 41.6 14.6 47.3 -7.6 13.7
Operators 8.2 29.1 10.7 32.2 30.5 10.7
63
1017
9
52
1421
13
0
10
20
30
40
50
60
70
80
90
100
Primary or
bellow
Middle School High School Tertiary
Education
% o
f T
ota
l E
mp
loym
en
t 2001 2003 2006
67
41
26
7
64
50
28
9
0
10
20
30
40
50
60
70
80
90
100
Primary or
bellow
Middle
School
High School Tertiary
Education
% I
nfo
rma
l
2001 2003 2006
19
Elementary occupations 8.7 54.1 13.7 63.5 57.5 17.4
Source: World Bank using 2001-2006 LFS data.
Employment Status
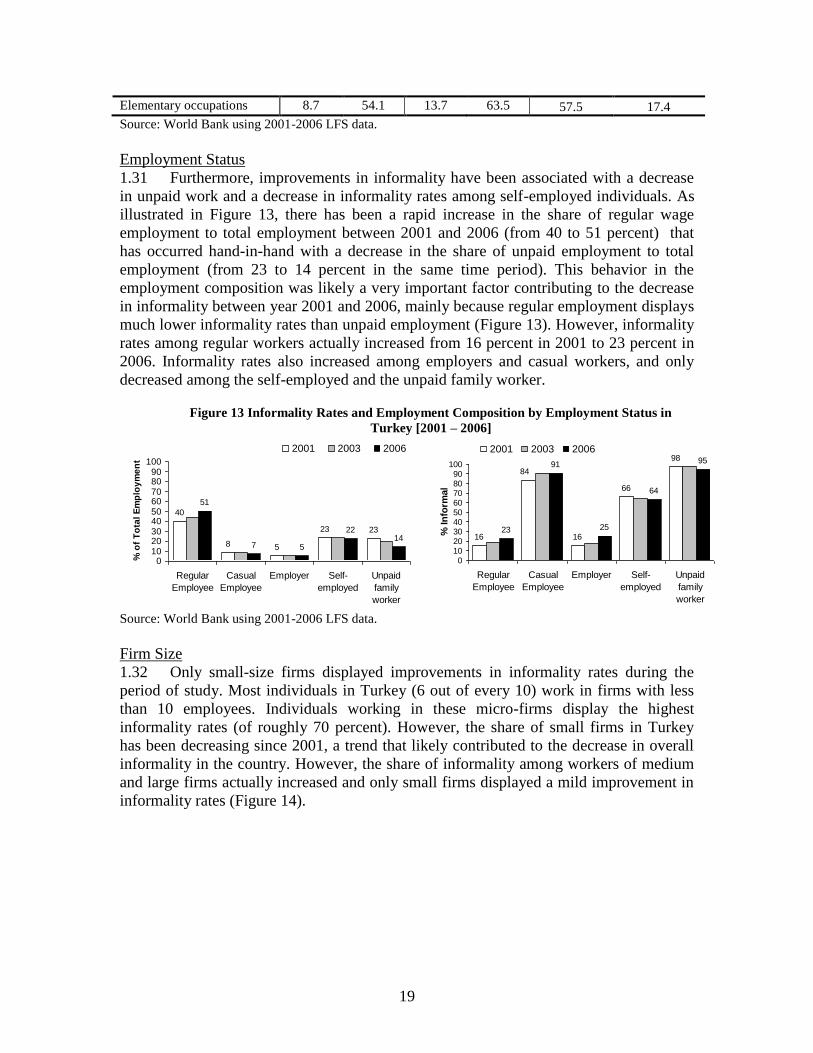
1.31 Furthermore, improvements in informality have been associated with a decrease
in unpaid work and a decrease in informality rates among self-employed individuals. As
illustrated in Figure 13, there has been a rapid increase in the share of regular wage
employment to total employment between 2001 and 2006 (from 40 to 51 percent) that
has occurred hand-in-hand with a decrease in the share of unpaid employment to total
employment (from 23 to 14 percent in the same time period). This behavior in the
employment composition was likely a very important factor contributing to the decrease
in informality between year 2001 and 2006, mainly because regular employment displays
much lower informality rates than unpaid employment (Figure 13). However, informality
rates among regular workers actually increased from 16 percent in 2001 to 23 percent in
2006. Informality rates also increased among employers and casual workers, and only
decreased among the self-employed and the unpaid family worker.
Figure 13 Informality Rates and Employment Composition by Employment Status in
Turkey [2001 – 2006]
Source: World Bank using 2001-2006 LFS data.
Firm Size
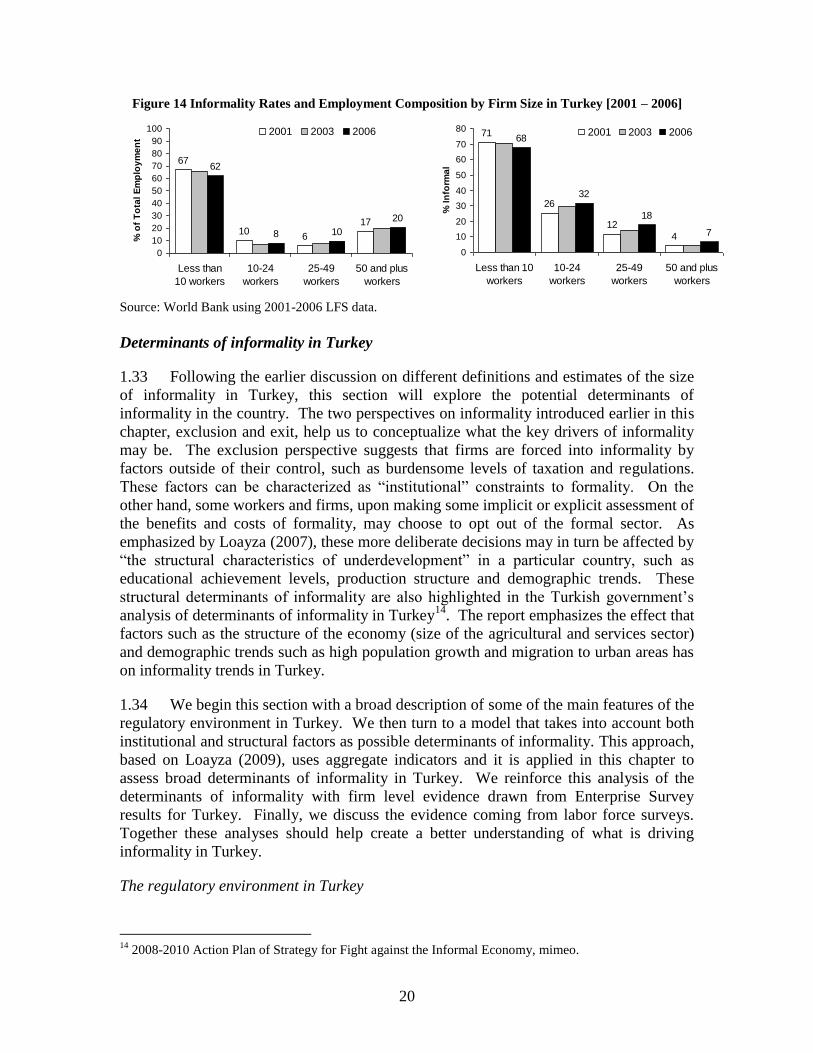
1.32 Only small-size firms displayed improvements in informality rates during the
period of study. Most individuals in Turkey (6 out of every 10) work in firms with less
than 10 employees. Individuals working in these micro-firms display the highest
informality rates (of roughly 70 percent). However, the share of small firms in Turkey
has been decreasing since 2001, a trend that likely contributed to the decrease in overall
informality in the country. However, the share of informality among workers of medium
and large firms actually increased and only small firms displayed a mild improvement in
informality rates (Figure 14).
40
8 5
23 23
51
7 5
2214
0102030405060708090
100
Regular
Employee
Casual
Employee
Employer Self-
employed
Unpaid
family
worker
% o
f T
ota
l E
mp
loy
me
nt
2001 2003 2006
16 16
66
98
23
91
25
64
95
84
0102030405060708090
100
Regular
Employee
Casual
Employee
Employer Self-
employed
Unpaid
family
worker
% In
form
al
2001 2003 2006
20
Figure 14 Informality Rates and Employment Composition by Firm Size in Turkey [2001 – 2006]
Source: World Bank using 2001-2006 LFS data.
Determinants of informality in Turkey
1.33 Following the earlier discussion on different definitions and estimates of the size
of informality in Turkey, this section will explore the potential determinants of
informality in the country. The two perspectives on informality introduced earlier in this
chapter, exclusion and exit, help us to conceptualize what the key drivers of informality
may be. The exclusion perspective suggests that firms are forced into informality by
factors outside of their control, such as burdensome levels of taxation and regulations.
These factors can be characterized as ―institutional‖ constraints to formality. On the
other hand, some workers and firms, upon making some implicit or explicit assessment of
the benefits and costs of formality, may choose to opt out of the formal sector. As
emphasized by Loayza (2007), these more deliberate decisions may in turn be affected by
―the structural characteristics of underdevelopment‖ in a particular country, such as
educational achievement levels, production structure and demographic trends. These
structural determinants of informality are also highlighted in the Turkish government’s
analysis of determinants of informality in Turkey14
. The report emphasizes the effect that
factors such as the structure of the economy (size of the agricultural and services sector)
and demographic trends such as high population growth and migration to urban areas has
on informality trends in Turkey.
1.34 We begin this section with a broad description of some of the main features of the
regulatory environment in Turkey. We then turn to a model that takes into account both
institutional and structural factors as possible determinants of informality. This approach,
based on Loayza (2009), uses aggregate indicators and it is applied in this chapter to
assess broad determinants of informality in Turkey. We reinforce this analysis of the
determinants of informality with firm level evidence drawn from Enterprise Survey
results for Turkey. Finally, we discuss the evidence coming from labor force surveys.
Together these analyses should help create a better understanding of what is driving
informality in Turkey.
The regulatory environment in Turkey
14
2008-2010 Action Plan of Strategy for Fight against the Informal Economy, mimeo.
67
106
17
62
8 10
20
0
10
20
30
40
50
60
70
80
90
100
Less than
10 workers
10-24
workers
25-49
workers
50 and plus
workers
% o
f T
ota
l E
mp
loy
me
nt
2001 2003 2006 71
26
12
4
68
32
18
7
0
10
20
30
40
50
60
70
80
Less than 10
workers
10-24
workers
25-49
workers
50 and plus
workers
% I
nfo
rma
l
2001 2003 2006

21
1.35 Many aspects of the regulatory environment of a country can influence the
decision of firms to stay in the informal sector or to adopt informal practices.15
In what
follows, we concentrate in 3 aspects that are deemed more relevant for a discussion of
informality in Turkey: the tax system, labor regulation and costs of registry and permits.
Taxes
1.36 The complexity of the tax system and the level of the tax burden are among the
aspects of the regulatory environment most associated with informal behavior. The
causality often goes both ways: high tax burden leads to increased tax evasion that ends
up shrinking the tax base and leading to higher nominal rates. Many developing countries
find themselves in this type of a ―bad equilibrium‖ outcome.
1.37 There is no shortage of complaints in the Turkish private sector related to taxes.
The 2007 ICA for Turkey identifies high taxation rates as the main cause of informality,
leading to losses in productivity, and employment. When asked as part of the Enterprise
Survey what competitive advantages informal firms have over formal ones, the top two
answers from firms were that ―they do not pay VAT‖ and ―they do not pay corporate tax
and other taxes.‖ Results from a qualitative survey conducted for this study in 2008
among 50 firms found that most respondents believed tax rates to be too high. Small
firms are especially critical of the rates, and believe they share an unfair burden of taxes,
with many admitting they do not pay them in full.16
1.38 Survey results confirm the finding that tax rates are perceived as high, and
suggest that decreases in rates could lead to better compliance. A survey with 1,000 firms
conducted for this study asked specific questions on the predicted influence of a
reduction in corporate or income taxes and value added taxes by half on government’s tax
revenues. The majority of the respondents stated that a reduction of both corporate or
income taxes and value added taxes in the sector would increase government’s revenues
(72.8%, 70.8% respectively). However, when asked to characterize how widespread
common practices of tax evasion are in their sector, the responses suggest that tax
evasion is not widespread (see table 4 below). Respondents used a scale from one to ten
to evaluate the extent of the given practice (1 = not widespread at all, 10 = very
widespread). Out of eleven practices of tax evasion, the most widespread practice was
declaring taxes lower than the actual level (mean= 4.56), followed by buying (mean=
3.62) and selling (mean= 3.57) goods and services without receipt, and writing receipts
that are lower than the actual value (mean= 3.51).
Table 4 Firms’ Perceptions on Practices about taxes
How widespread are_........................ N Minimum Maximum Mean
Std.
Deviation
15
The World Bank’s Investment Climate Assessment (ICA) and the Doing Business data, among others,
provide insights into what administrative processes are likely to push firms towards informality. 16
One small entrepreneur, a glassware shop owner, stated ―Who is paying the taxes? No one can give
away half of their income for taxes and survive!‖

22
Declaring taxes lower 1030 1 10 4.56 3.073
Using fake invoice 1025 1 10 2.73 2.445
Buying goods and services without receipts 1033 1 10 3.62 2.872
Selling goods and services without receipts 1033 1 10 3.57 2.885
Writing receipts lower than the actual value 1031 1 10 3.51 2.819
Using unregistered electricity-water 1031 1 10 2.27 2.175
Imports with receipts lower than the actual value 976 1 10 2.48 2.307
Imports without receipts 971 1 10 2.26 2.152
Exports without receipts 967 1 10 2.26 2.152
Export with receipts higher than the actual value
and claiming VAT returns 963 1 10 2.58 2.439
Exports with double receipts 908 1 10 2.19 2.147
Valid N (listwise) 898
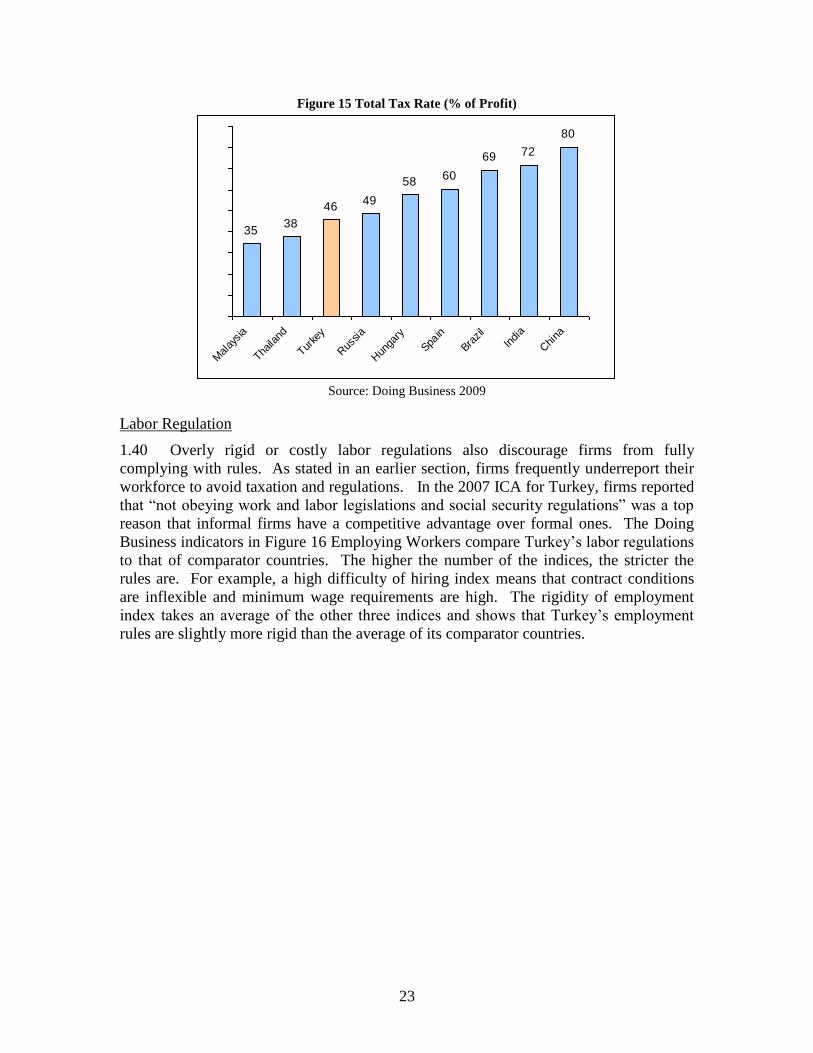
1.39 Despite this widespread concern, tax rates in Turkey are not particularly high,
especially when one compares Turkey’s tax rates with other European countries. Payroll
taxes are indeed high in Turkey (Davutyan 2007), but overall taxation stands at levels
that are comparable to comparator countries. According to the 2009 Doing Business
results, Turkey’s total tax rate of 45.5 percent of profits is lower than most comparator
countries.17
In 2005, this rate stood at 53 percent. This assessment is corroborated by
other sources: the overall tax burden in Turkey as measured by the IMF is also not
particularly high compared with Turkey’s competitors. This suggests that the problem
may lie more on the complexity of the tax system, with many loopholes and exemptions
still in place that favor evasion (see the paper on tax policy and administration for a more
complete discussion about the tax system in Turkey).
17
Total tax rate includes all taxes and mandatory contributions a firm must make, accounting for
deductions and exemptions for a typical firm.
23
Figure 15 Total Tax Rate (% of Profit)
Source: Doing Business 2009
Labor Regulation
1.40 Overly rigid or costly labor regulations also discourage firms from fully
complying with rules. As stated in an earlier section, firms frequently underreport their
workforce to avoid taxation and regulations. In the 2007 ICA for Turkey, firms reported
that ―not obeying work and labor legislations and social security regulations‖ was a top
reason that informal firms have a competitive advantage over formal ones. The Doing
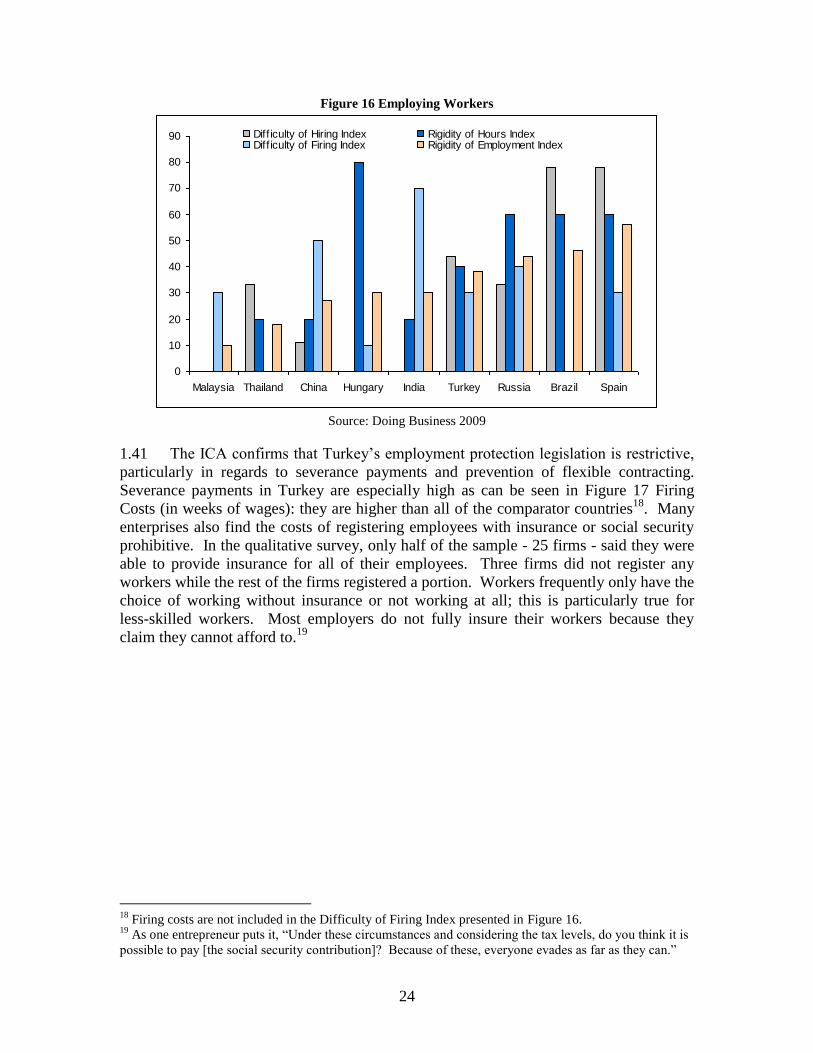
Business indicators in Figure 16 Employing Workers compare Turkey’s labor regulations
to that of comparator countries. The higher the number of the indices, the stricter the
rules are. For example, a high difficulty of hiring index means that contract conditions
are inflexible and minimum wage requirements are high. The rigidity of employment
index takes an average of the other three indices and shows that Turkey’s employment
rules are slightly more rigid than the average of its comparator countries.
3538
4649
5860
69 72
80
Mal
aysia
Thaila
nd
Turke
y
Rus
sia
Hun
gary
Spain
Brazil
Indi
a
Chi
na
24
Figure 16 Employing Workers
Source: Doing Business 2009
1.41 The ICA confirms that Turkey’s employment protection legislation is restrictive,
particularly in regards to severance payments and prevention of flexible contracting.
Severance payments in Turkey are especially high as can be seen in Figure 17 Firing
Costs (in weeks of wages): they are higher than all of the comparator countries18
. Many
enterprises also find the costs of registering employees with insurance or social security
prohibitive. In the qualitative survey, only half of the sample - 25 firms - said they were
able to provide insurance for all of their employees. Three firms did not register any
workers while the rest of the firms registered a portion. Workers frequently only have the
choice of working without insurance or not working at all; this is particularly true for
less-skilled workers. Most employers do not fully insure their workers because they
claim they cannot afford to.19
18
Firing costs are not included in the Difficulty of Firing Index presented in Figure 16. 19
As one entrepreneur puts it, ―Under these circumstances and considering the tax levels, do you think it is
possible to pay [the social security contribution]? Because of these, everyone evades as far as they can.‖
0
10
20
30
40
50
60
70
80
90
Malaysia Thailand China Hungary India Turkey Russia Brazil Spain
Diff iculty of Hiring Index Rigidity of Hours IndexDiff iculty of Firing Index Rigidity of Employment Index

25
Figure 17 Firing Costs (in weeks of wages)
Source: Doing Business 2009
Registration
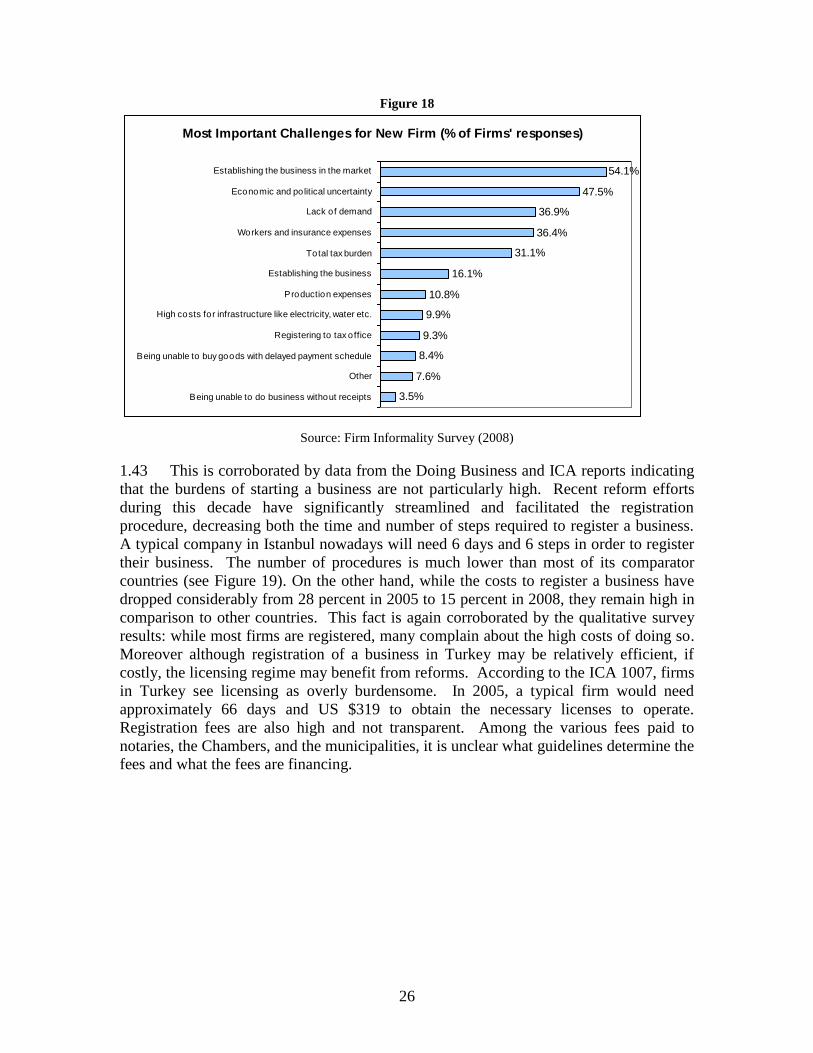
1.42 Contrary to what is found in many developing countries, business registration
does not seem to be an obstacle to formality. Only a small fraction of firms sampled by
the different surveys was not registered at the time of sampling or was not registered
when they began operating. The informality Firm Survey results show that only 5% of
sampled firms did not register before they began operations. The BEEPS 2008 results
show that 94% of firms were formally registered when they started their operations.
Finally, only 3 out of 50 firms interviewed for the qualitative survey were not formally
registered. Moreover, most firms do not perceive registration as a major challenge for a
newly established business. It ranks low in a list of challenges that firms face: only 9.3%
thought of it as a major challenge, well below other issues such as being able to establish
the business in the market (54% of responses), political and economic uncertainty (47%),
and wages and tax burden (36% and 31% respectively). As a consequence, rates of entry
and exit for firms in Turkey are robust, when compared to other emerging economies20
.
20
Source: ICA Turkey 2007
17
35 37
54 56 56
75
91 95
Russ
ia
Hung
ary
Bra
zil
Thaila
nd
India
Spa
in
Malay
sia
Chin
a
Turke
y
26
Figure 18
Source: Firm Informality Survey (2008)
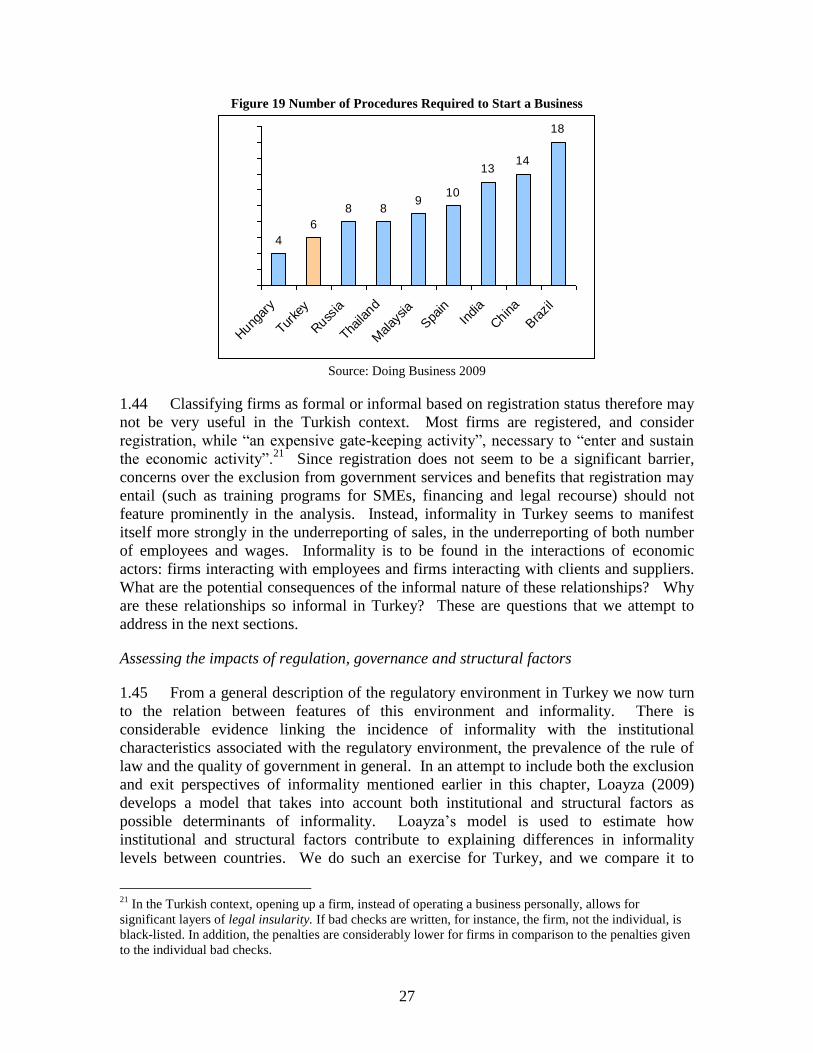
1.43 This is corroborated by data from the Doing Business and ICA reports indicating
that the burdens of starting a business are not particularly high. Recent reform efforts
during this decade have significantly streamlined and facilitated the registration
procedure, decreasing both the time and number of steps required to register a business.
A typical company in Istanbul nowadays will need 6 days and 6 steps in order to register
their business. The number of procedures is much lower than most of its comparator
countries (see Figure 19). On the other hand, while the costs to register a business have
dropped considerably from 28 percent in 2005 to 15 percent in 2008, they remain high in
comparison to other countries. This fact is again corroborated by the qualitative survey
results: while most firms are registered, many complain about the high costs of doing so.
Moreover although registration of a business in Turkey may be relatively efficient, if
costly, the licensing regime may benefit from reforms. According to the ICA 1007, firms
in Turkey see licensing as overly burdensome. In 2005, a typical firm would need
approximately 66 days and US $319 to obtain the necessary licenses to operate.
Registration fees are also high and not transparent. Among the various fees paid to
notaries, the Chambers, and the municipalities, it is unclear what guidelines determine the
fees and what the fees are financing.
Most Important Challenges for New Firm (% of Firms' responses)
54.1%
47.5%
36.9%
36.4%
31.1%
16.1%
10.8%
9.9%
9.3%
8.4%
7.6%
3.5%
Establishing the business in the market
Economic and political uncertainty
Lack of demand
Workers and insurance expenses
Total tax burden
Establishing the business
Production expenses
High costs for infrastructure like electricity, water etc.
Registering to tax office
Being unable to buy goods with delayed payment schedule
Other
Being unable to do business without receipts
27
Figure 19 Number of Procedures Required to Start a Business
Source: Doing Business 2009
1.44 Classifying firms as formal or informal based on registration status therefore may
not be very useful in the Turkish context. Most firms are registered, and consider
registration, while ―an expensive gate-keeping activity‖, necessary to ―enter and sustain
the economic activity‖.21
Since registration does not seem to be a significant barrier,
concerns over the exclusion from government services and benefits that registration may
entail (such as training programs for SMEs, financing and legal recourse) should not
feature prominently in the analysis. Instead, informality in Turkey seems to manifest
itself more strongly in the underreporting of sales, in the underreporting of both number
of employees and wages. Informality is to be found in the interactions of economic
actors: firms interacting with employees and firms interacting with clients and suppliers.
What are the potential consequences of the informal nature of these relationships? Why
are these relationships so informal in Turkey? These are questions that we attempt to
address in the next sections.
Assessing the impacts of regulation, governance and structural factors
1.45 From a general description of the regulatory environment in Turkey we now turn
to the relation between features of this environment and informality. There is
considerable evidence linking the incidence of informality with the institutional
characteristics associated with the regulatory environment, the prevalence of the rule of
law and the quality of government in general. In an attempt to include both the exclusion
and exit perspectives of informality mentioned earlier in this chapter, Loayza (2009)
develops a model that takes into account both institutional and structural factors as
possible determinants of informality. Loayza’s model is used to estimate how
institutional and structural factors contribute to explaining differences in informality
levels between countries. We do such an exercise for Turkey, and we compare it to
21
In the Turkish context, opening up a firm, instead of operating a business personally, allows for
significant layers of legal insularity. If bad checks are written, for instance, the firm, not the individual, is
black-listed. In addition, the penalties are considerably lower for firms in comparison to the penalties given
to the individual bad checks.
4
6
8 89
10
1314
18
Hung
ary
Turke
y
Russ
ia
Thaila
nd
Malay
sia
Spa
inIn
dia
Chin
a
Bra
zil
28
informality levels in two comparator countries: the United States, representing a highly
developed and industrialized OECD country, and Chile, a fast-growing developing
economy where levels of informality are relatively low.
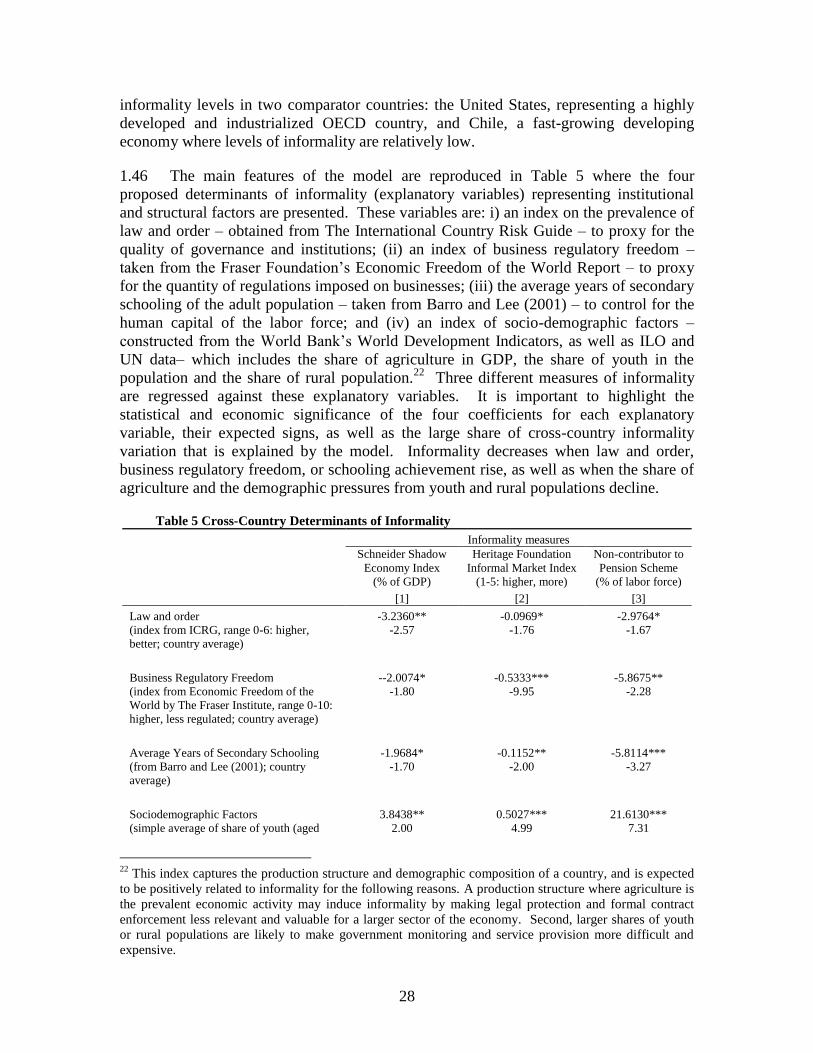
1.46 The main features of the model are reproduced in Table 5 where the four
proposed determinants of informality (explanatory variables) representing institutional
and structural factors are presented. These variables are: i) an index on the prevalence of
law and order – obtained from The International Country Risk Guide – to proxy for the
quality of governance and institutions; (ii) an index of business regulatory freedom –
taken from the Fraser Foundation’s Economic Freedom of the World Report – to proxy
for the quantity of regulations imposed on businesses; (iii) the average years of secondary
schooling of the adult population – taken from Barro and Lee (2001) – to control for the
human capital of the labor force; and (iv) an index of socio-demographic factors –
constructed from the World Bank’s World Development Indicators, as well as ILO and
UN data– which includes the share of agriculture in GDP, the share of youth in the
population and the share of rural population.22
Three different measures of informality
are regressed against these explanatory variables. It is important to highlight the
statistical and economic significance of the four coefficients for each explanatory
variable, their expected signs, as well as the large share of cross-country informality
variation that is explained by the model. Informality decreases when law and order,
business regulatory freedom, or schooling achievement rise, as well as when the share of
agriculture and the demographic pressures from youth and rural populations decline.
Table 5 Cross-Country Determinants of Informality
Informality measures
Schneider Shadow
Economy Index
(% of GDP)
Heritage Foundation
Informal Market Index
(1-5: higher, more)
Non-contributor to
Pension Scheme
(% of labor force)
[1] [2] [3]
Law and order -3.2360** -0.0969* -2.9764*
(index from ICRG, range 0-6: higher,
better; country average)
-2.57 -1.76 -1.67
Business Regulatory Freedom --2.0074* -0.5333*** -5.8675**
(index from Economic Freedom of the
World by The Fraser Institute, range 0-10:
higher, less regulated; country average)
-1.80 -9.95 -2.28
Average Years of Secondary Schooling -1.9684* -0.1152** -5.8114***
(from Barro and Lee (2001); country
average)
-1.70 -2.00 -3.27
Sociodemographic Factors 3.8438** 0.5027*** 21.6130***
(simple average of share of youth (aged 2.00 4.99 7.31
22
This index captures the production structure and demographic composition of a country, and is expected
to be positively related to informality for the following reasons. A production structure where agriculture is
the prevalent economic activity may induce informality by making legal protection and formal contract
enforcement less relevant and valuable for a larger sector of the economy. Second, larger shares of youth
or rural populations are likely to make government monitoring and service provision more difficult and
expensive.
29
10-24) population, share of rural
population, and share of agriculture in
GDP; country average)
Constant 60.3429*** 6.6326*** 113.3110***
10.48 31.72 11.40
No. of observations 84 86 70
R-squared 0.57 0.89 0.88 Notes: (1) t-statistics are presented below the corresponding coefficients. (4) *, ** and *** denote significance at the 10
percent, 5 percent and 1 percent levels, respectively. See Loayza (2009) for further information on countries included in
each regression, definitions and sources of variables used to compute country averages of informality measures.
Source: Loayza (2009).
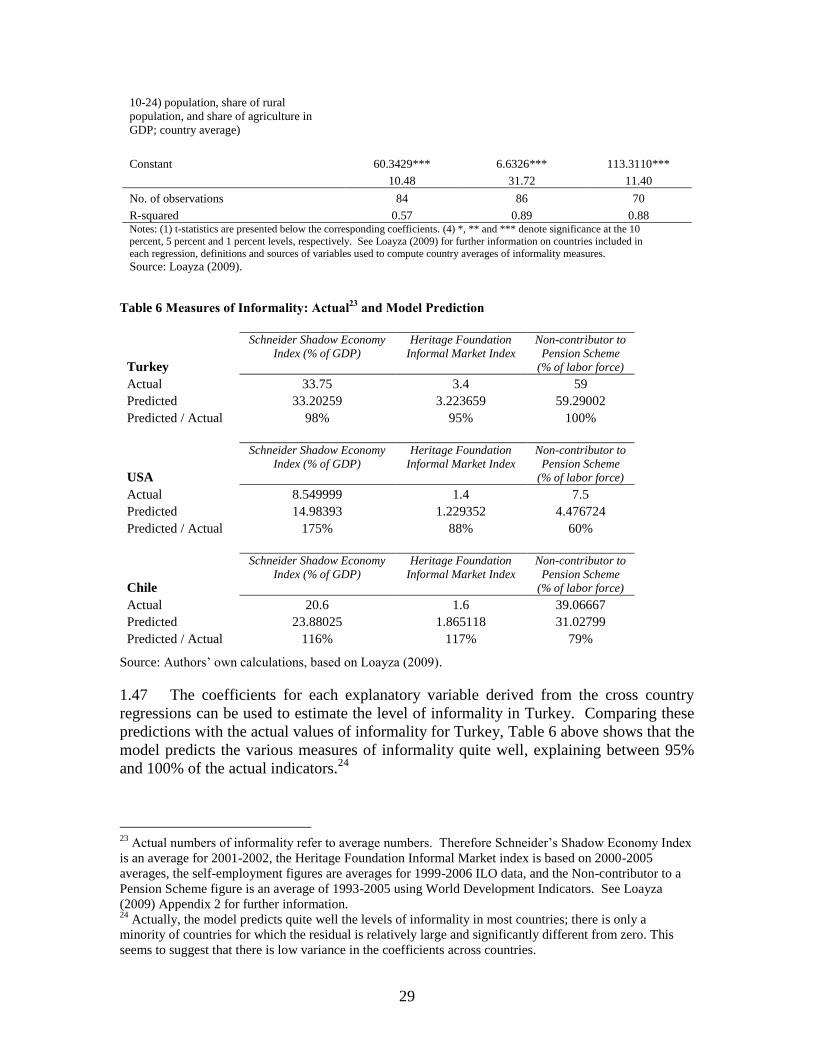
Table 6 Measures of Informality: Actual23
and Model Prediction
Turkey
Schneider Shadow Economy
Index (% of GDP) Heritage Foundation
Informal Market Index
Non-contributor to
Pension Scheme
(% of labor force)
Actual 33.75 3.4 59
Predicted 33.20259 3.223659 59.29002
Predicted / Actual 98% 95% 100%
USA
Schneider Shadow Economy
Index (% of GDP) Heritage Foundation
Informal Market Index
Non-contributor to
Pension Scheme
(% of labor force)
Actual 8.549999 1.4 7.5
Predicted 14.98393 1.229352 4.476724
Predicted / Actual 175% 88% 60%
Chile
Schneider Shadow Economy
Index (% of GDP) Heritage Foundation
Informal Market Index
Non-contributor to
Pension Scheme
(% of labor force)
Actual 20.6 1.6 39.06667
Predicted 23.88025 1.865118 31.02799
Predicted / Actual 116% 117% 79%
Source: Authors’ own calculations, based on Loayza (2009).
1.47 The coefficients for each explanatory variable derived from the cross country
regressions can be used to estimate the level of informality in Turkey. Comparing these
predictions with the actual values of informality for Turkey, Table 6 above shows that the
model predicts the various measures of informality quite well, explaining between 95%
and 100% of the actual indicators.24
23
Actual numbers of informality refer to average numbers. Therefore Schneider’s Shadow Economy Index
is an average for 2001-2002, the Heritage Foundation Informal Market index is based on 2000-2005
averages, the self-employment figures are averages for 1999-2006 ILO data, and the Non-contributor to a
Pension Scheme figure is an average of 1993-2005 using World Development Indicators. See Loayza
(2009) Appendix 2 for further information. 24
Actually, the model predicts quite well the levels of informality in most countries; there is only a
minority of countries for which the residual is relatively large and significantly different from zero. This
seems to suggest that there is low variance in the coefficients across countries.

30
1.48 We next explore the relative importance of each one of the independent variables
in explaining the differences in predicted informality between Turkey and the United
States and between Turkey and Chile. We first calculate the predicted and actual
differences between two countries for each one of the informality measures. Figure 20
shows that for the Turkey-United States comparison, the model gives fairly accurate
predictions for the differences in informality levels using both the Heritage Foundation
Index and the indicator of the percentage of labor force without pension coverage. When
informality is measured by Schneider’s Shadow Economy Index, the model considerably
under predicts the level of informality. For the Turkey-Chile comparison, the model
gives more accurate predictions for the differences in informality levels using the
Heritage Foundation Index and Schneider’s Shadow Economy Index than it does for
informality as measured by percentage of labor force without pension coverage, where
the model over predicts the actual difference. With these under and over predictions in
mind, this model can then be used to assess the relative importance of each one of the
independent variables in explaining the differences in predicted informality between
Turkey and the United States and Turkey and Chile. By multiplying the estimated
coefficients by the differences across countries in the averages of the corresponding
variables, it is possible to decompose cross-country informality differences in fractions
attributable to selected business environment factors.
Figure 20 Percentage of actual differences in informality levels predicted by model
Source: Authors’ own calculations, based on Loayza (2009).
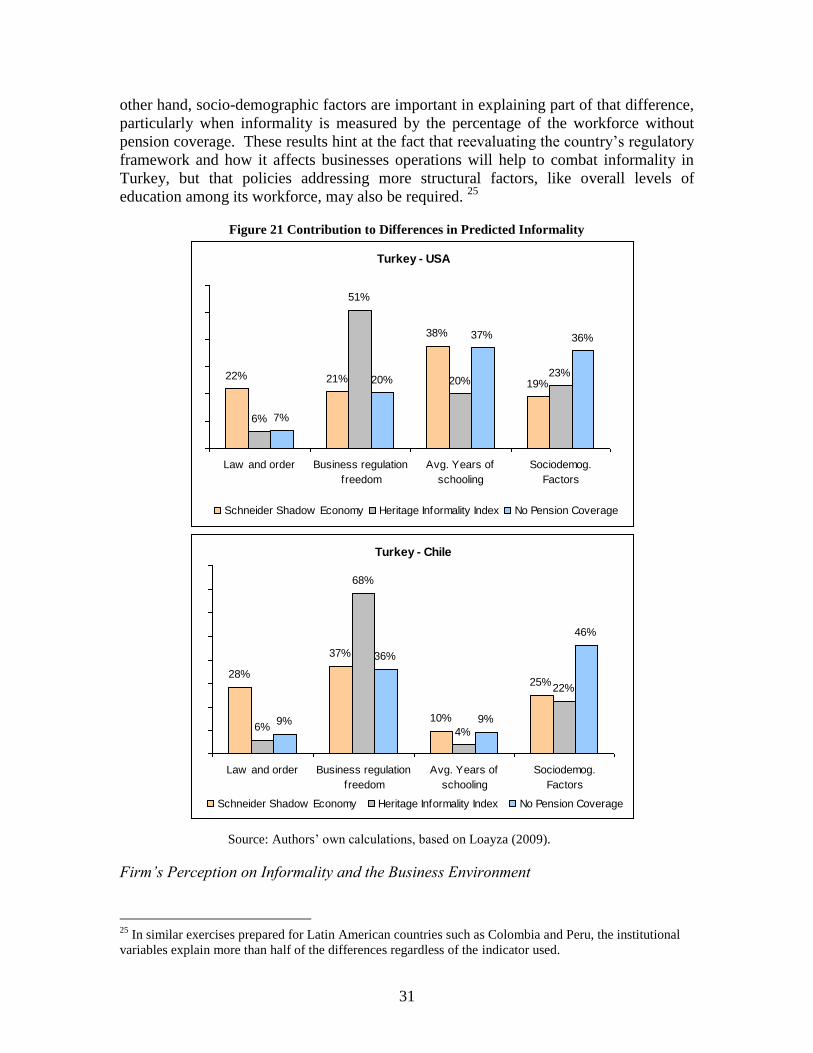
1.49 Figure 21 show that both structural factors, especially educational attainment, and
institutional factors, particularly the regulatory burden indicator, do play a significant role
in explaining the differences in informality levels between Turkey and the United States.
Education explains between 20 and 38% of the differences in informality between Turkey
and the U.S, while the proxy for law and order explain much less, between 6 and 22%,
depending on the index of informality used. The regulatory framework shows more
variance according to the different indexes, explaining as much as 51% of the differences
when the Heritage Informality Index is used. The comparison with Chile shows that the
regulatory burden indicator accounts for the majority of the difference seen in predicted
values of informality between the two countries. Given the relatively more similar
education attainment levels in the two countries, it is not surprising to see that education
does not explain much of the difference in informality between Turkey and Chile. On the
Turkey - USA
72%
100%106%
Schneider Shadow
Economy
Heritage Informality
Index
No Pension
Coverage
Turkey - Chile
71% 75%
142%
Schneider Shadow
Economy
Heritage Informality
Index
No Pension
Coverage
31
other hand, socio-demographic factors are important in explaining part of that difference,
particularly when informality is measured by the percentage of the workforce without
pension coverage. These results hint at the fact that reevaluating the country’s regulatory
framework and how it affects businesses operations will help to combat informality in
Turkey, but that policies addressing more structural factors, like overall levels of
education among its workforce, may also be required. 25
Figure 21 Contribution to Differences in Predicted Informality
Source: Authors’ own calculations, based on Loayza (2009).
Firm’s Perception on Informality and the Business Environment
25
In similar exercises prepared for Latin American countries such as Colombia and Peru, the institutional
variables explain more than half of the differences regardless of the indicator used.
Turkey - Chile
28%
37%
10%
25%
6%
68%
4%
22%
9%
36%
9%
46%
Law and order Business regulation
freedom
Avg. Years of
schooling
Sociodemog.
Factors
Schneider Shadow Economy Heritage Informality Index No Pension Coverage
Turkey - USA
22% 21%
38%
19%
6%
51%
20%23%
7%
20%
37% 36%
Law and order Business regulation
freedom
Avg. Years of
schooling
Sociodemog.
Factors
Schneider Shadow Economy Heritage Informality Index No Pension Coverage
32
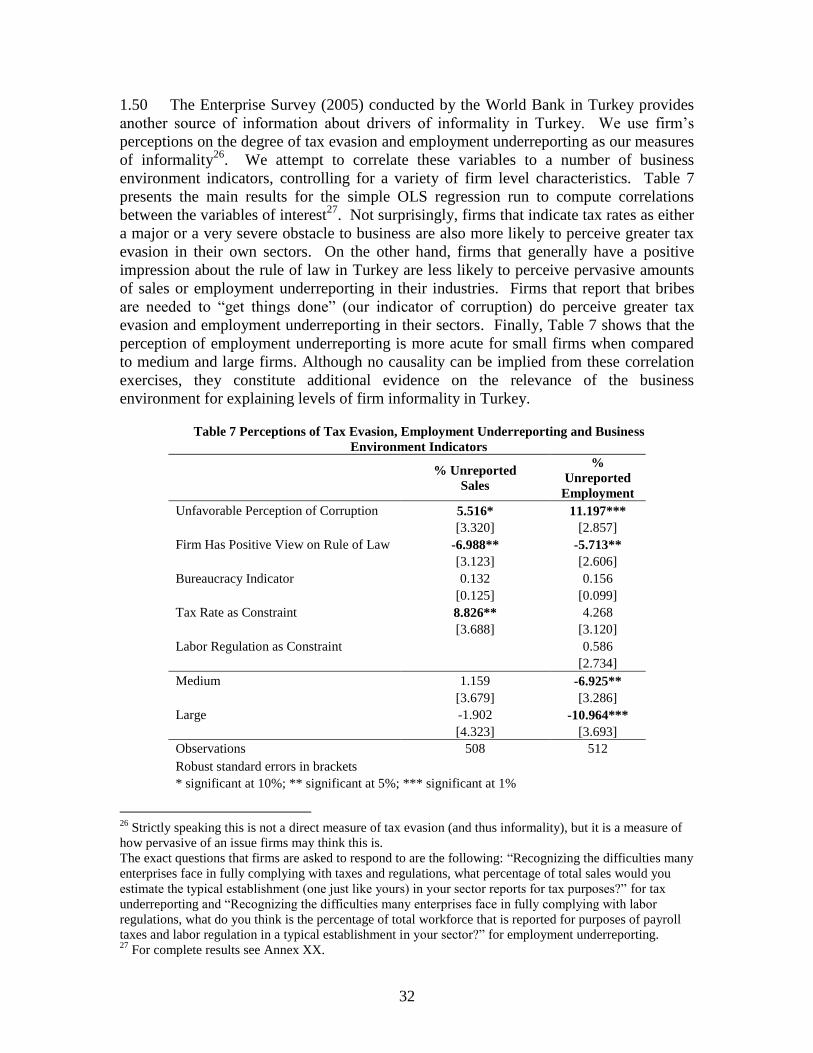
1.50 The Enterprise Survey (2005) conducted by the World Bank in Turkey provides
another source of information about drivers of informality in Turkey. We use firm’s
perceptions on the degree of tax evasion and employment underreporting as our measures
of informality26
. We attempt to correlate these variables to a number of business
environment indicators, controlling for a variety of firm level characteristics. Table 7
presents the main results for the simple OLS regression run to compute correlations
between the variables of interest27
. Not surprisingly, firms that indicate tax rates as either
a major or a very severe obstacle to business are also more likely to perceive greater tax
evasion in their own sectors. On the other hand, firms that generally have a positive
impression about the rule of law in Turkey are less likely to perceive pervasive amounts
of sales or employment underreporting in their industries. Firms that report that bribes
are needed to ―get things done‖ (our indicator of corruption) do perceive greater tax
evasion and employment underreporting in their sectors. Finally, Table 7 shows that the
perception of employment underreporting is more acute for small firms when compared
to medium and large firms. Although no causality can be implied from these correlation
exercises, they constitute additional evidence on the relevance of the business
environment for explaining levels of firm informality in Turkey.
Table 7 Perceptions of Tax Evasion, Employment Underreporting and Business
Environment Indicators
% Unreported
Sales
%
Unreported
Employment
Unfavorable Perception of Corruption 5.516* 11.197***
[3.320] [2.857]
Firm Has Positive View on Rule of Law -6.988** -5.713**
[3.123] [2.606]
Bureaucracy Indicator 0.132 0.156
[0.125] [0.099]
Tax Rate as Constraint 8.826** 4.268
[3.688] [3.120]
Labor Regulation as Constraint 0.586
[2.734]
Medium 1.159 -6.925**
[3.679] [3.286]
Large -1.902 -10.964***
[4.323] [3.693]
Observations 508 512
Robust standard errors in brackets
* significant at 10%; ** significant at 5%; *** significant at 1%
26
Strictly speaking this is not a direct measure of tax evasion (and thus informality), but it is a measure of
how pervasive of an issue firms may think this is.
The exact questions that firms are asked to respond to are the following: ―Recognizing the difficulties many
enterprises face in fully complying with taxes and regulations, what percentage of total sales would you
estimate the typical establishment (one just like yours) in your sector reports for tax purposes?‖ for tax
underreporting and ―Recognizing the difficulties many enterprises face in fully complying with labor
regulations, what do you think is the percentage of total workforce that is reported for purposes of payroll
taxes and labor regulation in a typical establishment in your sector?‖ for employment underreporting. 27
For complete results see Annex XX.

33
Sector and regional controls included. Omitted variables: Marmara (region=1), small
firms, food and beverages sector
Who Competes Against Informal Firms?
1.51 A final exercise is presented that also uses data from the Enterprise Survey
relating firm’s own response to whether they compete with informal businesses and some
basic firm characteristics. A simple differential probit regression is used to model this
relationship and the results are presented in Table 8 below. A basic profile emerges of
the kind of firm that is more likely to face informal competition. Foreign ownership, firm
size and manufacturing sector all appear to be highly and significantly correlated to
likelihood of competing against informal firms. Specifically, foreign ownership
decreases the likelihood that a firm will compete with informal businesses by about 25
percentage points. Likewise, firms in the machinery sector tend to be less likely to face
competition from informal firms when compared to firms in the food and beverage
sectors. A possible explanation for this is that the machinery sector is more capital
intensive than the food and beverage sector and thus requires higher levels of investments
that are more likely to be available for formal, registered firms. Medium and large firms
are also less likely to face informal competition, although the negative relationship for
large firms lacks statistical significance.
1.52 To account for structural factors that could also explain an increased likelihood of
competing in markets where informality is more prevalent, two variables that attempt to
capture the levels of education of the firm’s manager and workforce are included. Indeed
we find that firms whose manager has at least some level of secondary education are
about 9 percentage points less likely to compete with informal firms, when compared to
firms with less educated managers. Firms that have higher levels of education among its
workforce are also less likely to compete with informal businesses.
1.53 Finally it is important to note that variables that a priori were thought likely to
have a negative correlation with informal competition (such as location in a special
economic zone, exporter status or supplier to large or foreign clients) do not show a
discernible or significant relationship to informal competition.
Table 8 Competing Against Informal Businesses
Firm Competes
Against Informal
Businesses
Firm Competes
Against Informal
Businesses
Firm Competes
Against Informal
Businesses
[1] [2] [3]
Labor Productivity -0.000* 0 -0.000*
(Value added per worker) [0.000] [0.000] [0.000]
Large or Foreign Client
Dummy 0.015 0.008 0.015
[0.048] [0.048] [0.048]
Direct exporter (10%+) 0.066 0.06 0.063
[0.049] [0.049] [0.049]
Foreign owned (10%+) -0.251* -0.232* -0.229
[0.132] [0.140] [0.140]
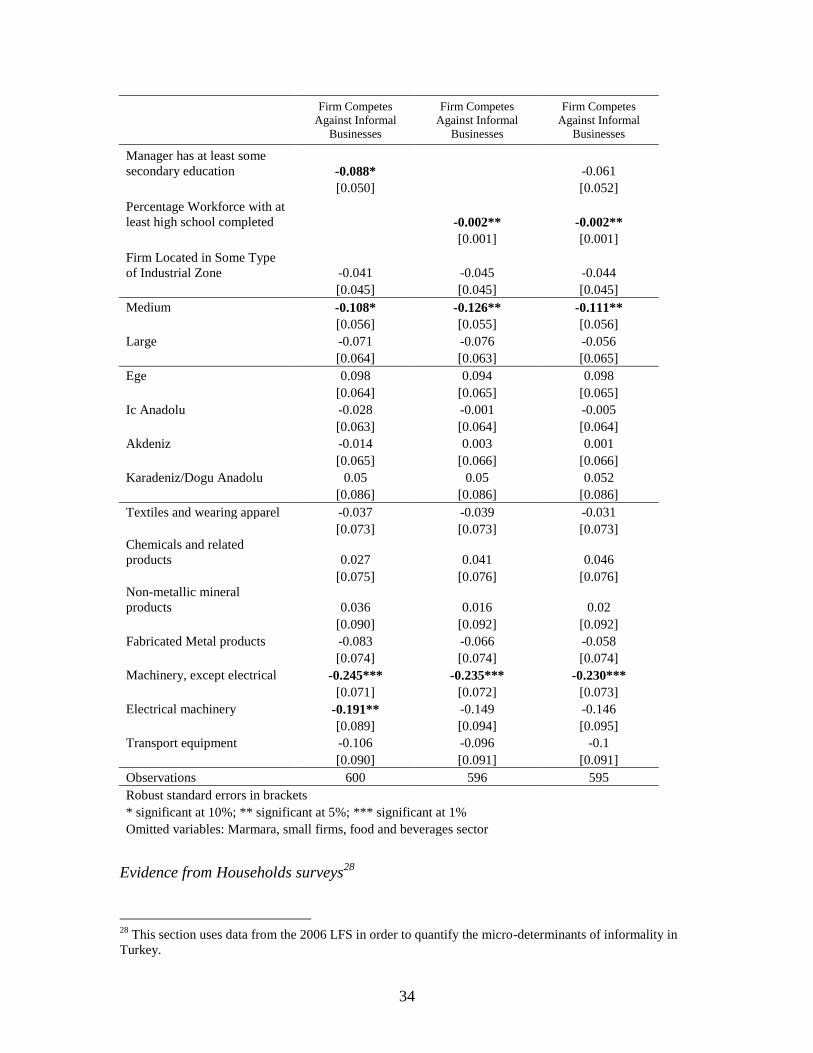
34
Firm Competes
Against Informal
Businesses
Firm Competes
Against Informal
Businesses
Firm Competes
Against Informal
Businesses
Manager has at least some
secondary education -0.088* -0.061
[0.050] [0.052]
Percentage Workforce with at
least high school completed -0.002** -0.002**
[0.001] [0.001]
Firm Located in Some Type
of Industrial Zone -0.041 -0.045 -0.044
[0.045] [0.045] [0.045]
Medium -0.108* -0.126** -0.111**
[0.056] [0.055] [0.056]
Large -0.071 -0.076 -0.056
[0.064] [0.063] [0.065]
Ege 0.098 0.094 0.098
[0.064] [0.065] [0.065]
Ic Anadolu -0.028 -0.001 -0.005
[0.063] [0.064] [0.064]
Akdeniz -0.014 0.003 0.001
[0.065] [0.066] [0.066]
Karadeniz/Dogu Anadolu 0.05 0.05 0.052
[0.086] [0.086] [0.086]
Textiles and wearing apparel -0.037 -0.039 -0.031
[0.073] [0.073] [0.073]
Chemicals and related
products 0.027 0.041 0.046
[0.075] [0.076] [0.076]
Non-metallic mineral
products 0.036 0.016 0.02
[0.090] [0.092] [0.092]
Fabricated Metal products -0.083 -0.066 -0.058
[0.074] [0.074] [0.074]
Machinery, except electrical -0.245*** -0.235*** -0.230***
[0.071] [0.072] [0.073]
Electrical machinery -0.191** -0.149 -0.146
[0.089] [0.094] [0.095]
Transport equipment -0.106 -0.096 -0.1
[0.090] [0.091] [0.091]
Observations 600 596 595
Robust standard errors in brackets
* significant at 10%; ** significant at 5%; *** significant at 1%
Omitted variables: Marmara, small firms, food and beverages sector
Evidence from Households surveys28
28
This section uses data from the 2006 LFS in order to quantify the micro-determinants of informality in
Turkey.
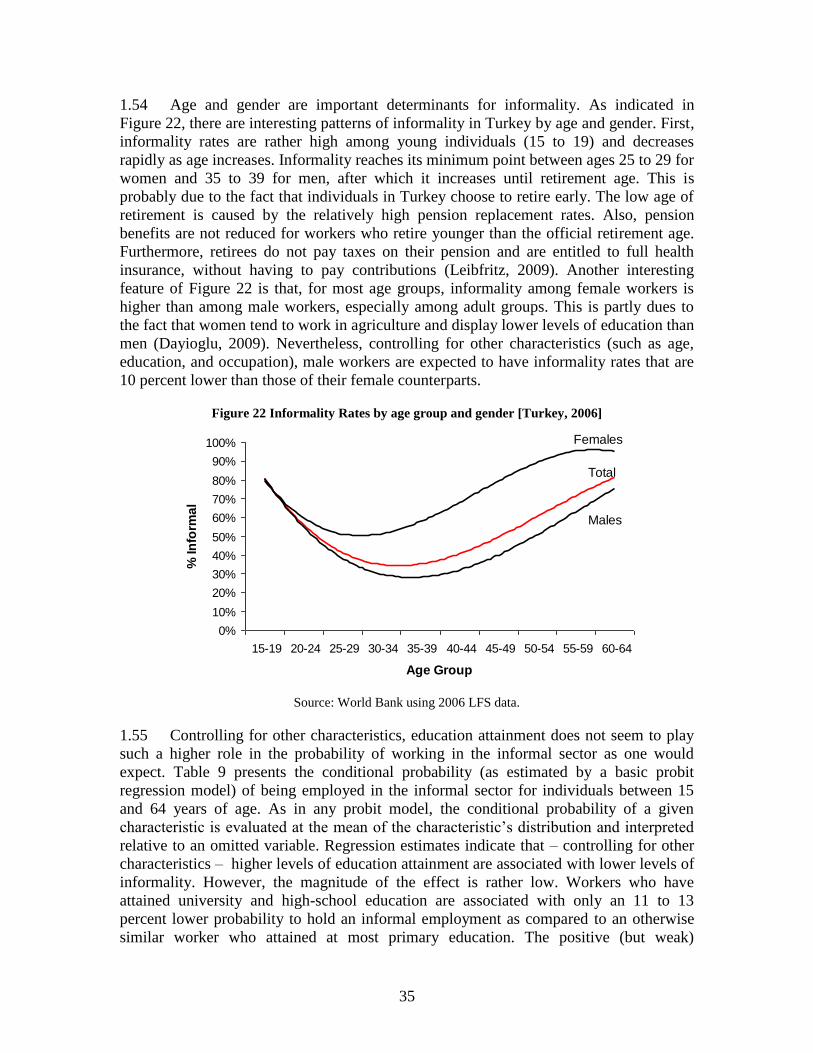
35
1.54 Age and gender are important determinants for informality. As indicated in
Figure 22, there are interesting patterns of informality in Turkey by age and gender. First,
informality rates are rather high among young individuals (15 to 19) and decreases
rapidly as age increases. Informality reaches its minimum point between ages 25 to 29 for
women and 35 to 39 for men, after which it increases until retirement age. This is
probably due to the fact that individuals in Turkey choose to retire early. The low age of
retirement is caused by the relatively high pension replacement rates. Also, pension
benefits are not reduced for workers who retire younger than the official retirement age.
Furthermore, retirees do not pay taxes on their pension and are entitled to full health
insurance, without having to pay contributions (Leibfritz, 2009). Another interesting
feature of Figure 22 is that, for most age groups, informality among female workers is
higher than among male workers, especially among adult groups. This is partly dues to
the fact that women tend to work in agriculture and display lower levels of education than
men (Dayioglu, 2009). Nevertheless, controlling for other characteristics (such as age,
education, and occupation), male workers are expected to have informality rates that are
10 percent lower than those of their female counterparts.
Figure 22 Informality Rates by age group and gender [Turkey, 2006]
Source: World Bank using 2006 LFS data.
1.55 Controlling for other characteristics, education attainment does not seem to play
such a higher role in the probability of working in the informal sector as one would
expect. Table 9 presents the conditional probability (as estimated by a basic probit
regression model) of being employed in the informal sector for individuals between 15
and 64 years of age. As in any probit model, the conditional probability of a given
characteristic is evaluated at the mean of the characteristic’s distribution and interpreted
relative to an omitted variable. Regression estimates indicate that – controlling for other
characteristics – higher levels of education attainment are associated with lower levels of
informality. However, the magnitude of the effect is rather low. Workers who have
attained university and high-school education are associated with only an 11 to 13
percent lower probability to hold an informal employment as compared to an otherwise
similar worker who attained at most primary education. The positive (but weak)
0%
10%
20%
30%
40%
50%
60%
70%
80%
90%
100%
15-19 20-24 25-29 30-34 35-39 40-44 45-49 50-54 55-59 60-64
Age Group
% In
form
al
Total
Males
Females
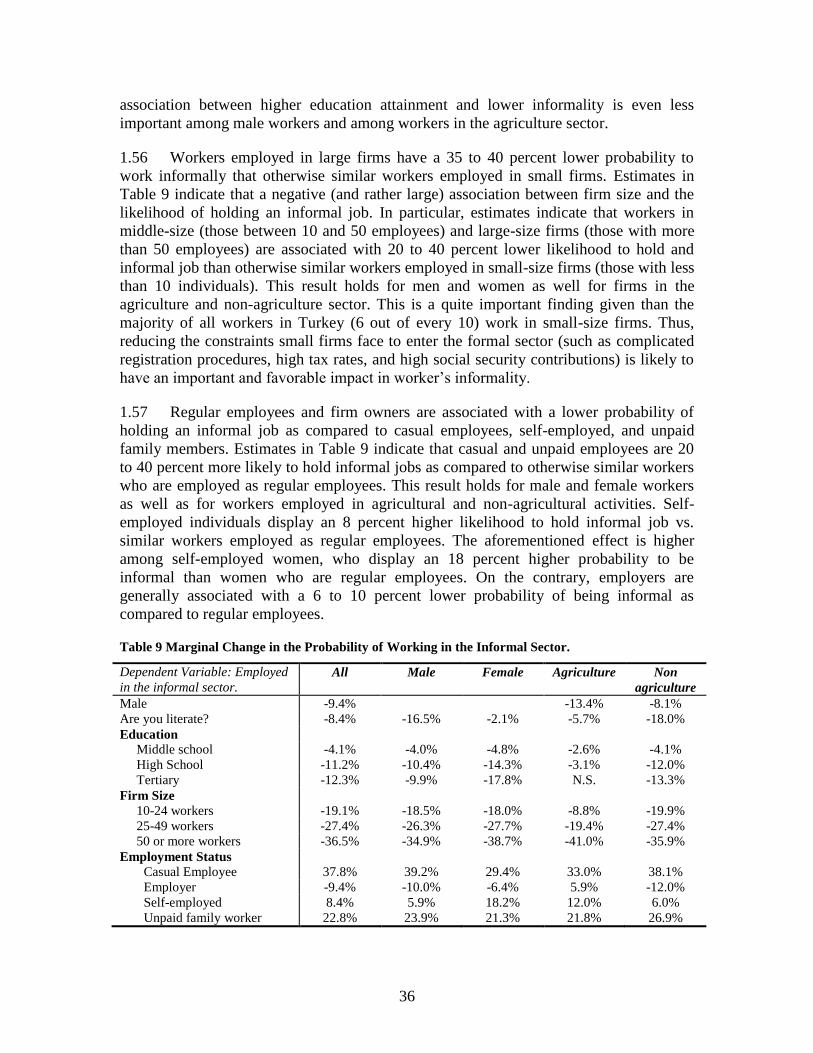
36
association between higher education attainment and lower informality is even less
important among male workers and among workers in the agriculture sector.
1.56 Workers employed in large firms have a 35 to 40 percent lower probability to
work informally that otherwise similar workers employed in small firms. Estimates in
Table 9 indicate that a negative (and rather large) association between firm size and the
likelihood of holding an informal job. In particular, estimates indicate that workers in
middle-size (those between 10 and 50 employees) and large-size firms (those with more
than 50 employees) are associated with 20 to 40 percent lower likelihood to hold and
informal job than otherwise similar workers employed in small-size firms (those with less
than 10 individuals). This result holds for men and women as well for firms in the
agriculture and non-agriculture sector. This is a quite important finding given than the
majority of all workers in Turkey (6 out of every 10) work in small-size firms. Thus,
reducing the constraints small firms face to enter the formal sector (such as complicated
registration procedures, high tax rates, and high social security contributions) is likely to
have an important and favorable impact in worker’s informality.
1.57 Regular employees and firm owners are associated with a lower probability of
holding an informal job as compared to casual employees, self-employed, and unpaid
family members. Estimates in Table 9 indicate that casual and unpaid employees are 20
to 40 percent more likely to hold informal jobs as compared to otherwise similar workers
who are employed as regular employees. This result holds for male and female workers
as well as for workers employed in agricultural and non-agricultural activities. Self-
employed individuals display an 8 percent higher likelihood to hold informal job vs.
similar workers employed as regular employees. The aforementioned effect is higher
among self-employed women, who display an 18 percent higher probability to be
informal than women who are regular employees. On the contrary, employers are
generally associated with a 6 to 10 percent lower probability of being informal as
compared to regular employees.
Table 9 Marginal Change in the Probability of Working in the Informal Sector.
Dependent Variable: Employed
in the informal sector. All Male Female Agriculture Non
agriculture
Male -9.4% -13.4% -8.1%
Are you literate? -8.4% -16.5% -2.1% -5.7% -18.0%
Education
Middle school -4.1% -4.0% -4.8% -2.6% -4.1%
High School -11.2% -10.4% -14.3% -3.1% -12.0%
Tertiary -12.3% -9.9% -17.8% N.S. -13.3%
Firm Size
10-24 workers -19.1% -18.5% -18.0% -8.8% -19.9%
25-49 workers -27.4% -26.3% -27.7% -19.4% -27.4%
50 or more workers -36.5% -34.9% -38.7% -41.0% -35.9%
Employment Status
Casual Employee 37.8% 39.2% 29.4% 33.0% 38.1%
Employer -9.4% -10.0% -6.4% 5.9% -12.0%
Self-employed 8.4% 5.9% 18.2% 12.0% 6.0%
Unpaid family worker 22.8% 23.9% 21.3% 21.8% 26.9%
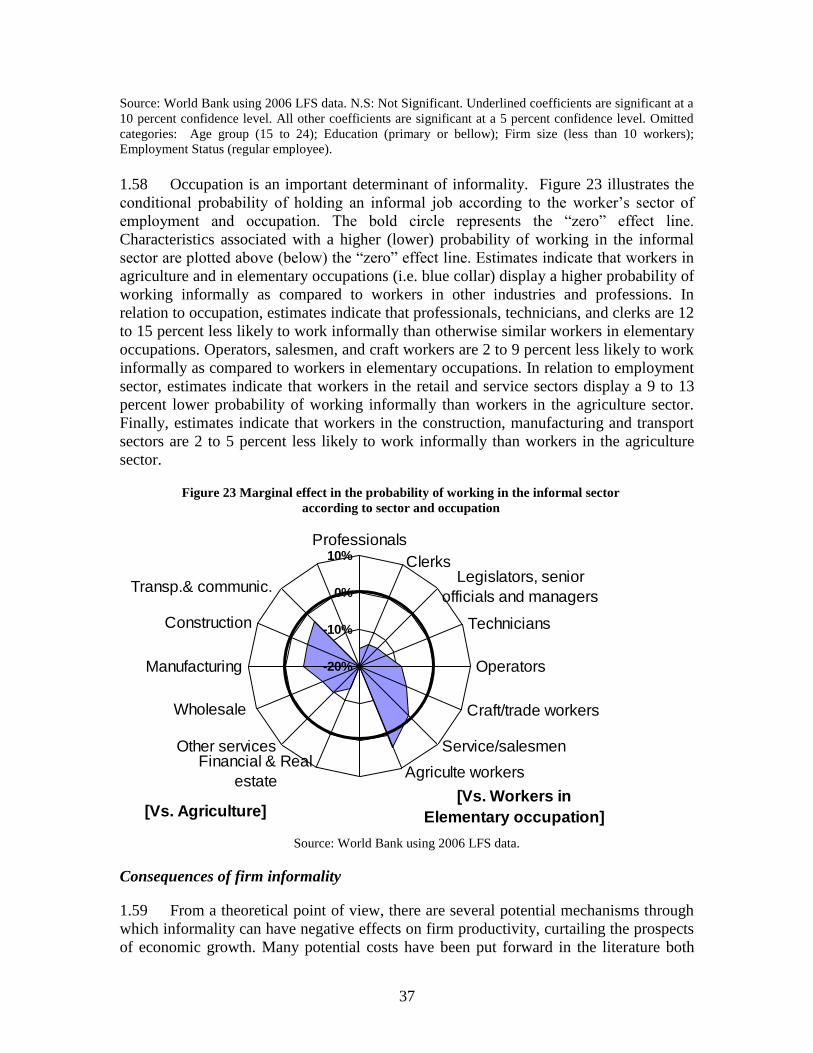
37
Source: World Bank using 2006 LFS data. N.S: Not Significant. Underlined coefficients are significant at a
10 percent confidence level. All other coefficients are significant at a 5 percent confidence level. Omitted
categories: Age group (15 to 24); Education (primary or bellow); Firm size (less than 10 workers);
Employment Status (regular employee).
1.58 Occupation is an important determinant of informality. Figure 23 illustrates the
conditional probability of holding an informal job according to the worker’s sector of
employment and occupation. The bold circle represents the ―zero‖ effect line.
Characteristics associated with a higher (lower) probability of working in the informal
sector are plotted above (below) the ―zero‖ effect line. Estimates indicate that workers in
agriculture and in elementary occupations (i.e. blue collar) display a higher probability of
working informally as compared to workers in other industries and professions. In
relation to occupation, estimates indicate that professionals, technicians, and clerks are 12
to 15 percent less likely to work informally than otherwise similar workers in elementary
occupations. Operators, salesmen, and craft workers are 2 to 9 percent less likely to work
informally as compared to workers in elementary occupations. In relation to employment
sector, estimates indicate that workers in the retail and service sectors display a 9 to 13
percent lower probability of working informally than workers in the agriculture sector.
Finally, estimates indicate that workers in the construction, manufacturing and transport
sectors are 2 to 5 percent less likely to work informally than workers in the agriculture
sector.
Figure 23 Marginal effect in the probability of working in the informal sector
according to sector and occupation
Source: World Bank using 2006 LFS data.
Consequences of firm informality
1.59 From a theoretical point of view, there are several potential mechanisms through
which informality can have negative effects on firm productivity, curtailing the prospects
of economic growth. Many potential costs have been put forward in the literature both
-20%
-10%
0%
10%Professionals
ClerksLegislators, senior
officials and managers
Technicians
Operators
Craft/trade workers
Service/salesmen
Agriculte workersFinancial & Real
estate
Other services
Wholesale
Manufacturing
Construction
Transp.& communic.
[Vs. Workers in
Elementary occupation][Vs. Agriculture]
38
from the economic efficiency and from the public choice point of view. For instance,
Loayza (1996, 2007) and the United Kingdom National Audit Office (2008), among
others, argue that through tax evasion informal firms pose a ―free rider‖ problem because
they congest public goods that are provided for by tax contributions from formal firms
and workers without contributing to the resources necessary to maintain and expand
provision of these public goods.
1.60 Another important potential cost often cited in the literature emphasizes
efficiency considerations. If the large majority of informal firms stay very small, it is
possible that they never reach an efficient scale of production (De Soto 1969, Mckinsey
2006). Informality is associated with the presence of very small firms with limited access
to medium- and long-term finance or to the rapidly expanding global market, and who
therefore cannot achieve their full potential in terms of productivity or competitiveness.
1.61 As noted in Perry et al. (2007) there is one important caveat to consider, namely
that the size restriction may be less important in the services sector, where there may be
less room for exploiting economies of scale (Lewis 2004) and where there is a massive
participation of informal labor. As a result of their small scale, informal firms are also
less motivated to use technological innovation, one of the key drivers of productivity.
Low levels of innovation and technology absorption may also emerge as consequence of
the absence of focus on longer term relationship with stakeholders that characterize the
informal sector. In the absence of formal labor contracts, for instance, informal firms
usually maintain frail relations with their employees, restraining mutual incentives to
increase human capital and hence productivity.
1.62 Unfair competition is another mechanism through which informality can affect
growth, preventing a more efficient resource allocation. Perry et al. (2007) point out that
firms that are insufficiently competitive and in other circumstances would be forced to
withdraw from the market can remain active in the informal sector. This outcome slows
down the flow of human and capital resources to more dynamic and productive sectors,
triggering a low productivity trap. As noted in Oviedo (2008), though, arguments based
on the premise that informal firms ―unfairly‖ take market share from law-abiding formal
firms turn out to be theoretically ambiguous and little empirical evidence exists to
determine their economic importance.
1.63 In this section we explore recent firm surveys carried out in Turkey in order to
assess some of the costs or consequences of informality. For a more complete evaluation
of the impact of informality on productivity, see Taymaz (2009). We begin, however,
with a brief summary of how firms view informality and its impact on firm performance.
Informality and firm’s perception of its impact on performance
1.64 Most firms do not view informality as the most significant constraint to their
businesses. Results from the different surveys may at first give an impression that
informality is a major issue for firms in Turkey. However, careful analysis of the data
shows that while many firms seem to be in direct competition with informal businesses
(about 45% in ES 2005 and 52% of service firms in BEEPS 2008), this competition only
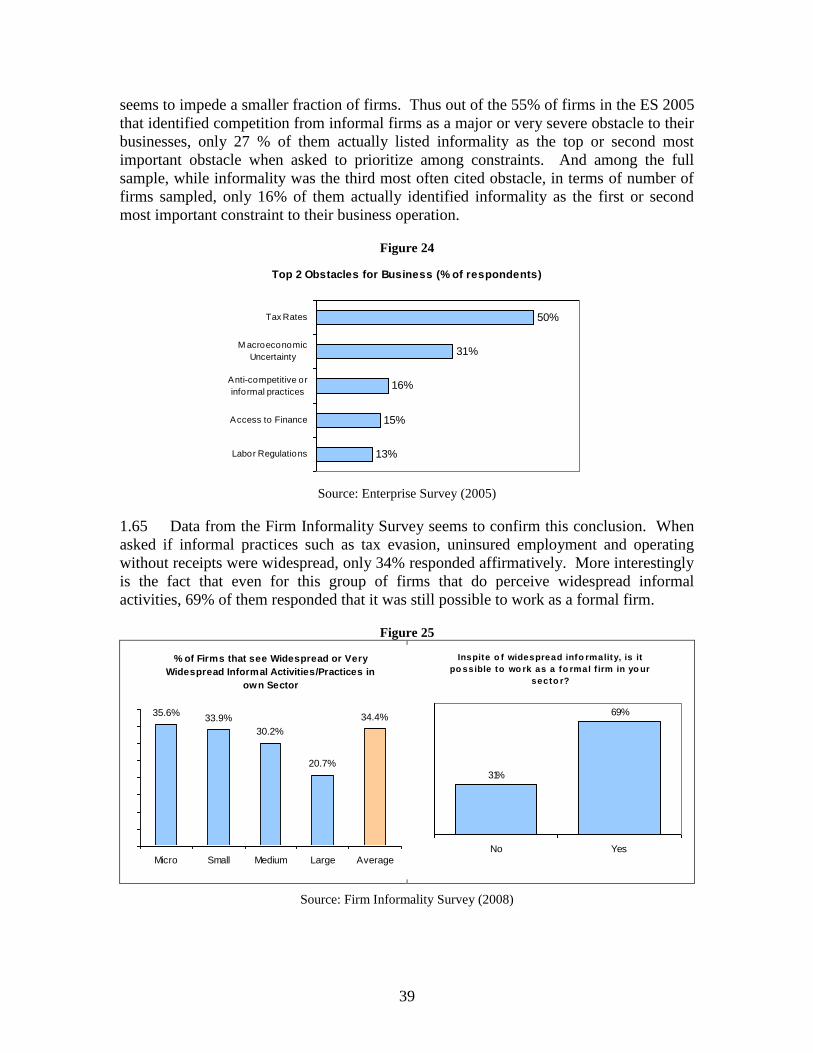
39
seems to impede a smaller fraction of firms. Thus out of the 55% of firms in the ES 2005
that identified competition from informal firms as a major or very severe obstacle to their
businesses, only 27 % of them actually listed informality as the top or second most
important obstacle when asked to prioritize among constraints. And among the full
sample, while informality was the third most often cited obstacle, in terms of number of
firms sampled, only 16% of them actually identified informality as the first or second
most important constraint to their business operation.
Figure 24
Source: Enterprise Survey (2005)
1.65 Data from the Firm Informality Survey seems to confirm this conclusion. When
asked if informal practices such as tax evasion, uninsured employment and operating
without receipts were widespread, only 34% responded affirmatively. More interestingly
is the fact that even for this group of firms that do perceive widespread informal
activities, 69% of them responded that it was still possible to work as a formal firm.
Figure 25
Source: Firm Informality Survey (2008)
Top 2 Obstacles for Business (% of respondents)
50%
31%
16%
15%
13%
Tax Rates
M acroeconomic
Uncertainty
Anti-competitive or
informal practices
Access to Finance
Labor Regulations
% of Firms that see Widespread or Very
Widespread Informal Activities/Practices in
own Sector
35.6%33.9%
30.2%
20.7%
34.4%
Micro Small Medium Large Average
Inspite o f widespread info rmality, is it
po ssible to wo rk as a fo rmal f irm in yo ur
secto r?
69%
31%
YesNo
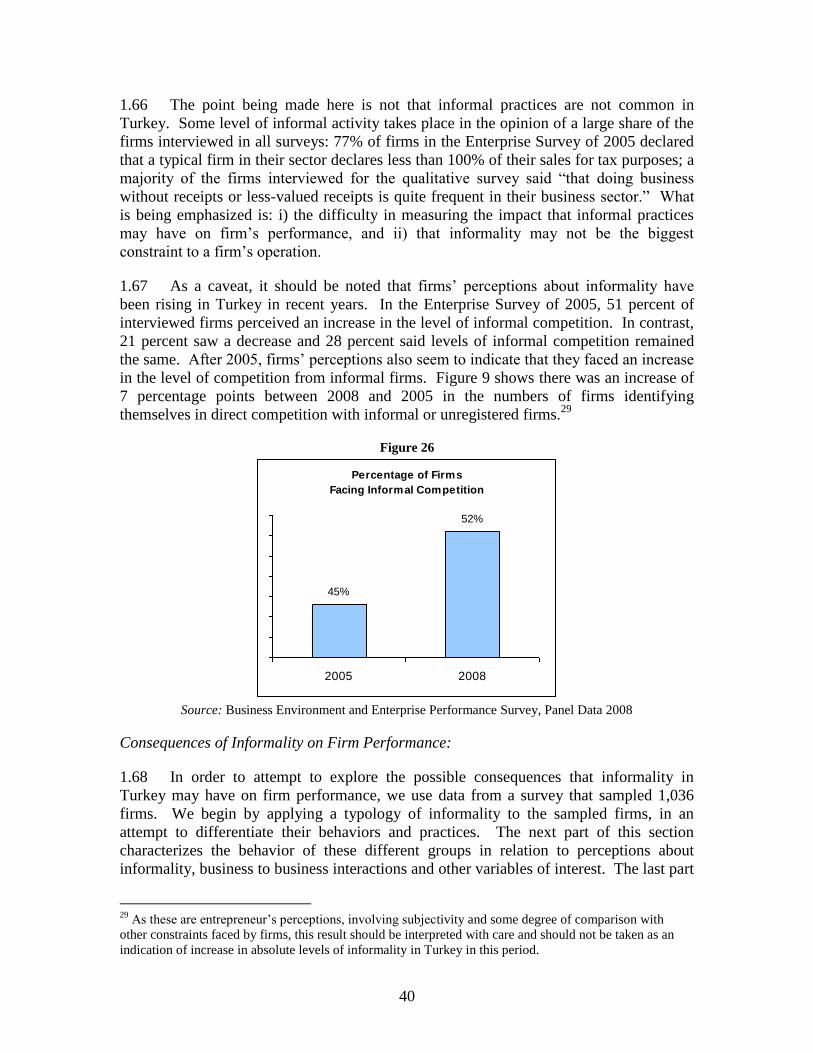
40
1.66 The point being made here is not that informal practices are not common in
Turkey. Some level of informal activity takes place in the opinion of a large share of the
firms interviewed in all surveys: 77% of firms in the Enterprise Survey of 2005 declared
that a typical firm in their sector declares less than 100% of their sales for tax purposes; a
majority of the firms interviewed for the qualitative survey said ―that doing business
without receipts or less-valued receipts is quite frequent in their business sector.‖ What
is being emphasized is: i) the difficulty in measuring the impact that informal practices
may have on firm’s performance, and ii) that informality may not be the biggest
constraint to a firm’s operation.
1.67 As a caveat, it should be noted that firms’ perceptions about informality have
been rising in Turkey in recent years. In the Enterprise Survey of 2005, 51 percent of
interviewed firms perceived an increase in the level of informal competition. In contrast,
21 percent saw a decrease and 28 percent said levels of informal competition remained
the same. After 2005, firms’ perceptions also seem to indicate that they faced an increase
in the level of competition from informal firms. Figure 9 shows there was an increase of
7 percentage points between 2008 and 2005 in the numbers of firms identifying
themselves in direct competition with informal or unregistered firms.29
Figure 26
Source: Business Environment and Enterprise Performance Survey, Panel Data 2008
Consequences of Informality on Firm Performance:
1.68 In order to attempt to explore the possible consequences that informality in
Turkey may have on firm performance, we use data from a survey that sampled 1,036
firms. We begin by applying a typology of informality to the sampled firms, in an
attempt to differentiate their behaviors and practices. The next part of this section
characterizes the behavior of these different groups in relation to perceptions about
informality, business to business interactions and other variables of interest. The last part
29
As these are entrepreneur’s perceptions, involving subjectivity and some degree of comparison with
other constraints faced by firms, this result should be interpreted with care and should not be taken as an
indication of increase in absolute levels of informality in Turkey in this period.
Percentage of Firms
Facing Informal Competition
45%
52%
2005 2008
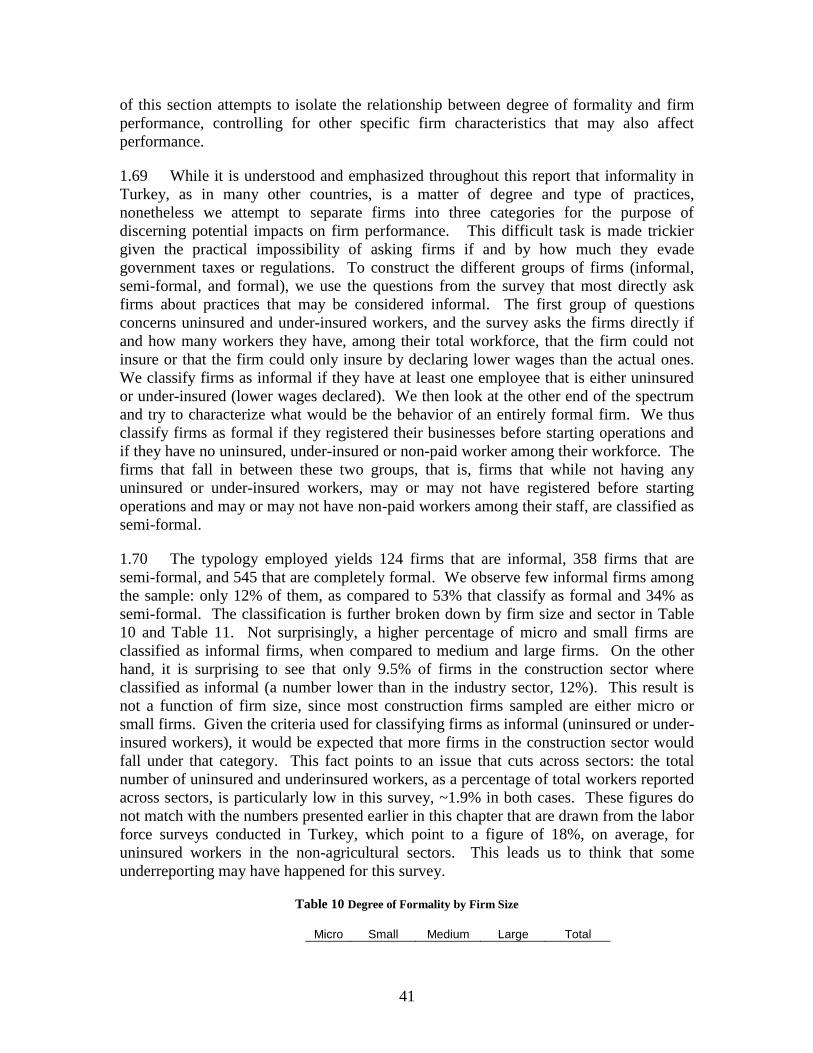
41
of this section attempts to isolate the relationship between degree of formality and firm
performance, controlling for other specific firm characteristics that may also affect
performance.
1.69 While it is understood and emphasized throughout this report that informality in
Turkey, as in many other countries, is a matter of degree and type of practices,
nonetheless we attempt to separate firms into three categories for the purpose of
discerning potential impacts on firm performance. This difficult task is made trickier
given the practical impossibility of asking firms if and by how much they evade
government taxes or regulations. To construct the different groups of firms (informal,
semi-formal, and formal), we use the questions from the survey that most directly ask
firms about practices that may be considered informal. The first group of questions
concerns uninsured and under-insured workers, and the survey asks the firms directly if
and how many workers they have, among their total workforce, that the firm could not
insure or that the firm could only insure by declaring lower wages than the actual ones.
We classify firms as informal if they have at least one employee that is either uninsured
or under-insured (lower wages declared). We then look at the other end of the spectrum
and try to characterize what would be the behavior of an entirely formal firm. We thus
classify firms as formal if they registered their businesses before starting operations and
if they have no uninsured, under-insured or non-paid worker among their workforce. The
firms that fall in between these two groups, that is, firms that while not having any
uninsured or under-insured workers, may or may not have registered before starting
operations and may or may not have non-paid workers among their staff, are classified as
semi-formal.
1.70 The typology employed yields 124 firms that are informal, 358 firms that are
semi-formal, and 545 that are completely formal. We observe few informal firms among
the sample: only 12% of them, as compared to 53% that classify as formal and 34% as
semi-formal. The classification is further broken down by firm size and sector in Table
10 and Table 11. Not surprisingly, a higher percentage of micro and small firms are
classified as informal firms, when compared to medium and large firms. On the other
hand, it is surprising to see that only 9.5% of firms in the construction sector where
classified as informal (a number lower than in the industry sector, 12%). This result is
not a function of firm size, since most construction firms sampled are either micro or
small firms. Given the criteria used for classifying firms as informal (uninsured or under-
insured workers), it would be expected that more firms in the construction sector would
fall under that category. This fact points to an issue that cuts across sectors: the total
number of uninsured and underinsured workers, as a percentage of total workers reported
across sectors, is particularly low in this survey, ~1.9% in both cases. These figures do
not match with the numbers presented earlier in this chapter that are drawn from the labor
force surveys conducted in Turkey, which point to a figure of 18%, on average, for
uninsured workers in the non-agricultural sectors. This leads us to think that some
underreporting may have happened for this survey.
Table 10 Degree of Formality by Firm Size
Micro Small Medium Large Total
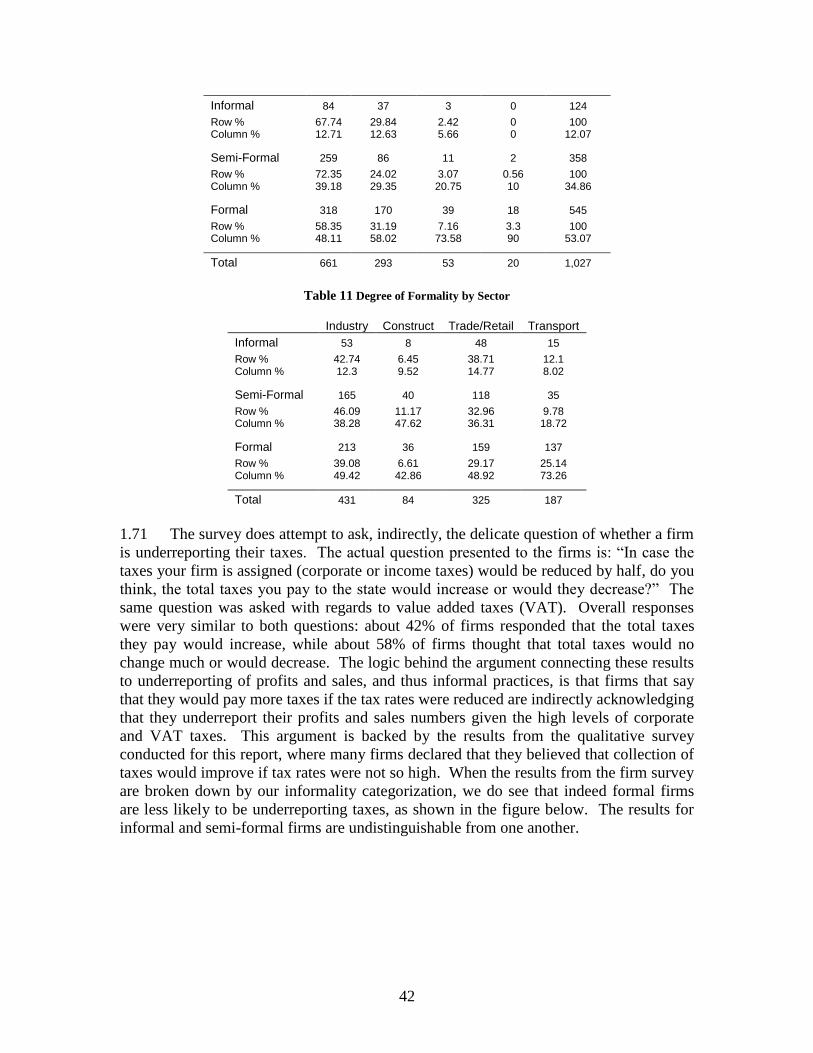
42
Informal 84 37 3 0 124
Row % 67.74 29.84 2.42 0 100 Column % 12.71 12.63 5.66 0 12.07
Semi-Formal 259 86 11 2 358
Row % 72.35 24.02 3.07 0.56 100 Column % 39.18 29.35 20.75 10 34.86
Formal 318 170 39 18 545
Row % 58.35 31.19 7.16 3.3 100 Column % 48.11 58.02 73.58 90 53.07
Total 661 293 53 20 1,027
Table 11 Degree of Formality by Sector
Industry Construct Trade/Retail Transport
Informal 53 8 48 15
Row % 42.74 6.45 38.71 12.1 Column % 12.3 9.52 14.77 8.02
Semi-Formal 165 40 118 35
Row % 46.09 11.17 32.96 9.78 Column % 38.28 47.62 36.31 18.72
Formal 213 36 159 137
Row % 39.08 6.61 29.17 25.14 Column % 49.42 42.86 48.92 73.26
Total 431 84 325 187
1.71 The survey does attempt to ask, indirectly, the delicate question of whether a firm
is underreporting their taxes. The actual question presented to the firms is: ―In case the
taxes your firm is assigned (corporate or income taxes) would be reduced by half, do you
think, the total taxes you pay to the state would increase or would they decrease?‖ The
same question was asked with regards to value added taxes (VAT). Overall responses
were very similar to both questions: about 42% of firms responded that the total taxes
they pay would increase, while about 58% of firms thought that total taxes would no
change much or would decrease. The logic behind the argument connecting these results
to underreporting of profits and sales, and thus informal practices, is that firms that say
that they would pay more taxes if the tax rates were reduced are indirectly acknowledging
that they underreport their profits and sales numbers given the high levels of corporate
and VAT taxes. This argument is backed by the results from the qualitative survey
conducted for this report, where many firms declared that they believed that collection of
taxes would improve if tax rates were not so high. When the results from the firm survey
are broken down by our informality categorization, we do see that indeed formal firms
are less likely to be underreporting taxes, as shown in the figure below. The results for
informal and semi-formal firms are undistinguishable from one another.

43
Figure 27 Would a cut (by half) in your taxes lead to an increase in
the total taxes you pay to the state?
Source: Firm Informality Survey (2008)
1.72 Moving on to perceptions, the results show that overall only 35 % of firms see
widespread informal activities/practices in their sectors. When broken down, however,
this proportion rises to about 61% among firms classified as informal.
Figure 28 Are informal activities/practices
widespread in your sector? (%)
Source: Firm Informality Survey (2008)
1.73 The data collected with the survey also allows for an examination of how firms
deal with each other (business to business transactions), and how prevalent certain more
informal practices may be. One section of the survey looks into delayed payment
arrangements that firms may go into when buying or selling goods or services.
According to the data the practice seems to be widespread among the sampled firms.
Well over two thirds of all firms engage in this practice; when the data is segregated by
firm size, we see that large firms also use this arrangement, albeit less enthusiastically:
58% of firms confirmed that they engage in delayed payments when buying goods or
services, and 44% of firms when selling goods or services. Separating firms by their
formality status, Figure 29 and Figure 30 show again that while the practice is widely
0
10
20
30
40
50
60
70
No Yes No Yes
Cut in Corporate Taxes Cut in VAT Taxes
Informal Semi-Formal Formal
61
36
28
39
64
72
Informal Semi-Formal Formal
Yes No
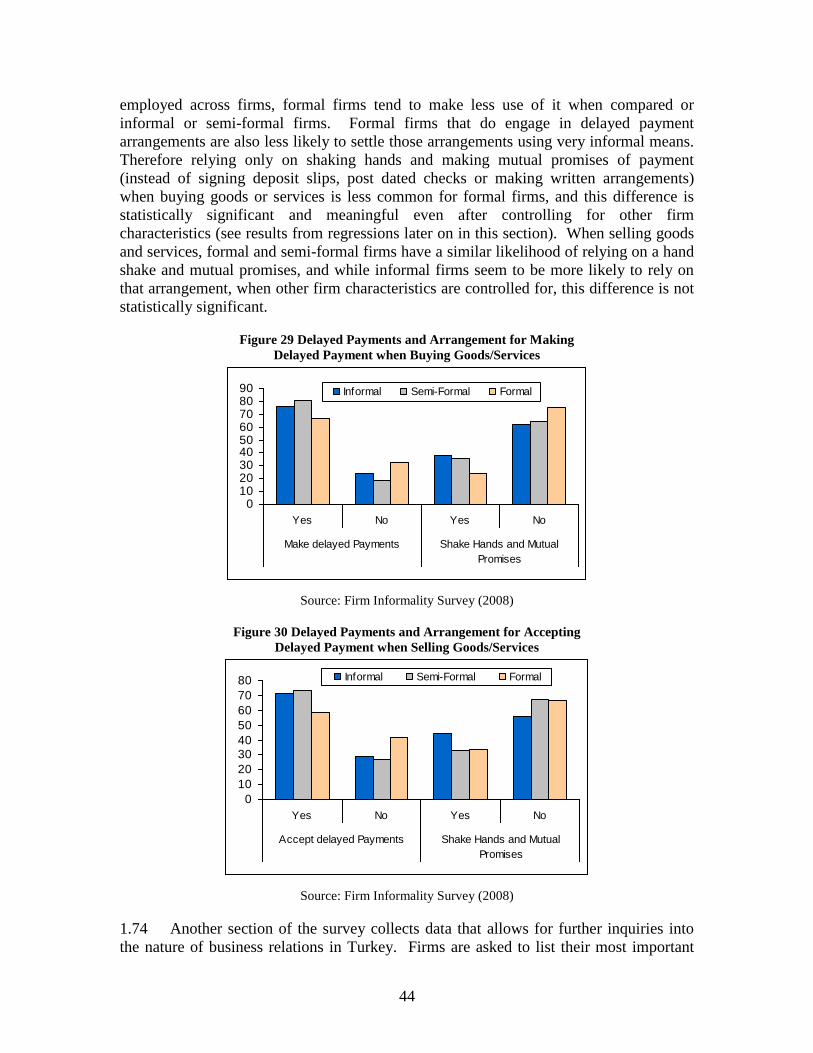
44
employed across firms, formal firms tend to make less use of it when compared or
informal or semi-formal firms. Formal firms that do engage in delayed payment
arrangements are also less likely to settle those arrangements using very informal means.
Therefore relying only on shaking hands and making mutual promises of payment
(instead of signing deposit slips, post dated checks or making written arrangements)
when buying goods or services is less common for formal firms, and this difference is
statistically significant and meaningful even after controlling for other firm
characteristics (see results from regressions later on in this section). When selling goods
and services, formal and semi-formal firms have a similar likelihood of relying on a hand
shake and mutual promises, and while informal firms seem to be more likely to rely on
that arrangement, when other firm characteristics are controlled for, this difference is not
statistically significant.
Figure 29 Delayed Payments and Arrangement for Making
Delayed Payment when Buying Goods/Services
Source: Firm Informality Survey (2008)
Figure 30 Delayed Payments and Arrangement for Accepting
Delayed Payment when Selling Goods/Services
Source: Firm Informality Survey (2008)
1.74 Another section of the survey collects data that allows for further inquiries into
the nature of business relations in Turkey. Firms are asked to list their most important
0102030405060708090
Yes No Yes No
Make delayed Payments Shake Hands and Mutual
Promises
Informal Semi-Formal Formal
0
10
20
3040
50
60
70
80
Yes No Yes No
Accept delayed Payments Shake Hands and Mutual
Promises
Informal Semi-Formal Formal
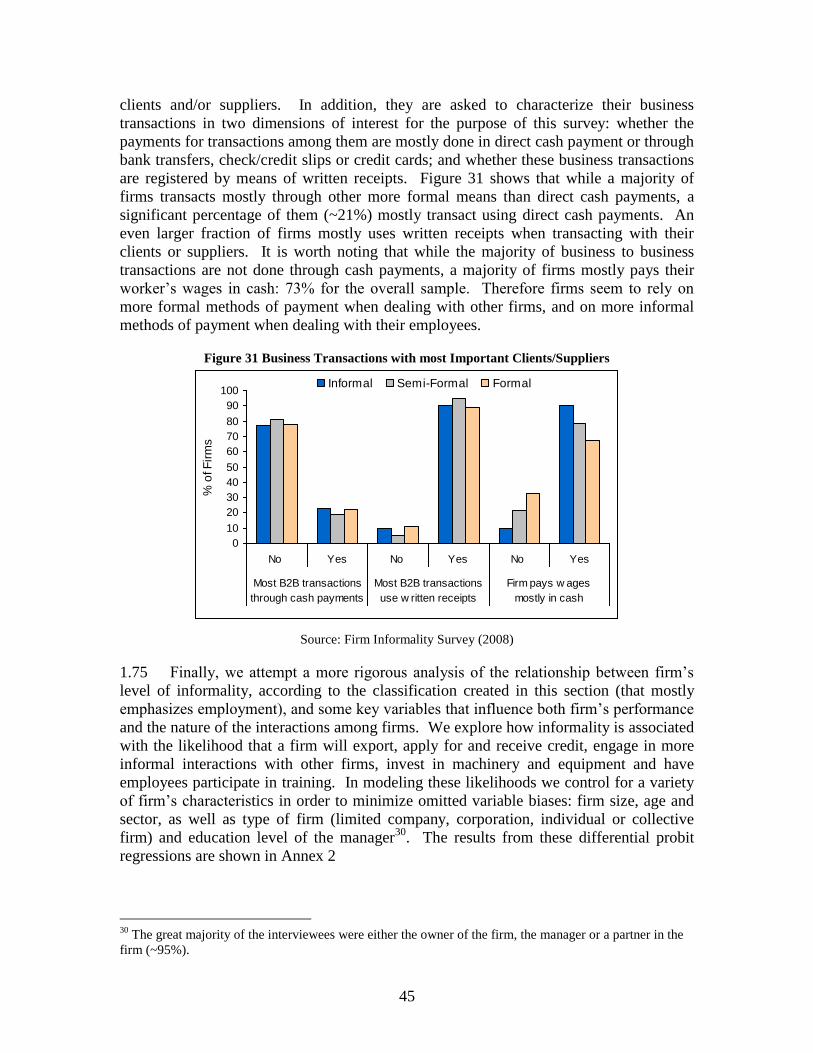
45
clients and/or suppliers. In addition, they are asked to characterize their business
transactions in two dimensions of interest for the purpose of this survey: whether the
payments for transactions among them are mostly done in direct cash payment or through
bank transfers, check/credit slips or credit cards; and whether these business transactions
are registered by means of written receipts. Figure 31 shows that while a majority of
firms transacts mostly through other more formal means than direct cash payments, a
significant percentage of them (~21%) mostly transact using direct cash payments. An
even larger fraction of firms mostly uses written receipts when transacting with their
clients or suppliers. It is worth noting that while the majority of business to business
transactions are not done through cash payments, a majority of firms mostly pays their
worker’s wages in cash: 73% for the overall sample. Therefore firms seem to rely on
more formal methods of payment when dealing with other firms, and on more informal
methods of payment when dealing with their employees.
Figure 31 Business Transactions with most Important Clients/Suppliers
Source: Firm Informality Survey (2008)
1.75 Finally, we attempt a more rigorous analysis of the relationship between firm’s
level of informality, according to the classification created in this section (that mostly
emphasizes employment), and some key variables that influence both firm’s performance
and the nature of the interactions among firms. We explore how informality is associated
with the likelihood that a firm will export, apply for and receive credit, engage in more
informal interactions with other firms, invest in machinery and equipment and have
employees participate in training. In modeling these likelihoods we control for a variety
of firm’s characteristics in order to minimize omitted variable biases: firm size, age and
sector, as well as type of firm (limited company, corporation, individual or collective
firm) and education level of the manager30
. The results from these differential probit
regressions are shown in Annex 2
30
The great majority of the interviewees were either the owner of the firm, the manager or a partner in the
firm (~95%).
0
10
20
30
40
50
60
70
80
90
100
No Yes No Yes No Yes
Most B2B transactions
through cash payments
Most B2B transactions
use w ritten receipts
Firm pays w ages
mostly in cash
% o
f F
irm
s
Informal Semi-Formal Formal

46
1.76 We observe that formality seems to be related to an increased likelihood that a
firm will export, when compared to semi-formal firms. Other noteworthy results are:
- Formal firms are more likely to apply for and have their credit application approved
than semi-formal and informal firms (the difference with the latter one is not
statistically significant at the 10% level of confidence);
- Informal and semi-formal firms have an increased likelihood of relying on a ―hand
shake and mutual promises‖ when arranging delayed payments to buy goods or
services;
- Somewhat surprisingly, firms that have very informal employment relationships
with some of their employees are just as likely to have had their workers participate
in training programs as firms that have strictly formal employment practices.
1.77 To further explore this last issue, we used a different measure of informality to
run the same probit regressions: the percentage of underinsured and noninsured workers
over the total number of workers in a firm. Under this specification, results show that it
is the depth of informality, more than a simple dichotomy of having under or noninsured
employees, that really matters for the likelihood of training employees. And under this
specification firms with greater percentages of noninsured or underinsured employees are
indeed much less likely to have employees participate in training. Finally in regards to
training, a significant correlation emerges between the level of education of the firm’s
management and the likelihood of employees participating in training programs
(regardless of the specification used for the informality variable).
Conclusions
1.78 Drawing on different data sources, including surveys carried out for this report,
this chapter attempted to provide an overall picture of informality in Turkey, its relative
importance, its evolution over recent years, as well as possible causes and consequences.
As emphasized earlier in this chapter, given informality’s many facets, we attempted to
look at the issue from the side of both firms and workers. The picture that emerges is that
informality is still a significant issue in Turkey, in spite of recent decreasing trends seen
in the share of informal workers. This observation remains valid even when controlling
for levels of income. In fact, informality as proxied by the share of self-employed
workers is high for the country’s level of development.
1.79 The decrease in labor informality in Turkey that has taken place in the past few
years has been driven mainly by urbanization and the reduction in informality rates in the
agricultural sector and in rural areas, where a significant amount of household work has
shifted from agriculture to non-agricultural activities. At the same time, these same
sociodemographic or structural factors are also responsible for the still significant levels
of informality observed in Turkey today. This is evident when informality rates in
Turkey are compared to other comparator countries (USA, Chile and a constructed
average of selected European countries). However, the analysis presented in this chapter
also makes clear that while significant, structural factors are not the only factors behind
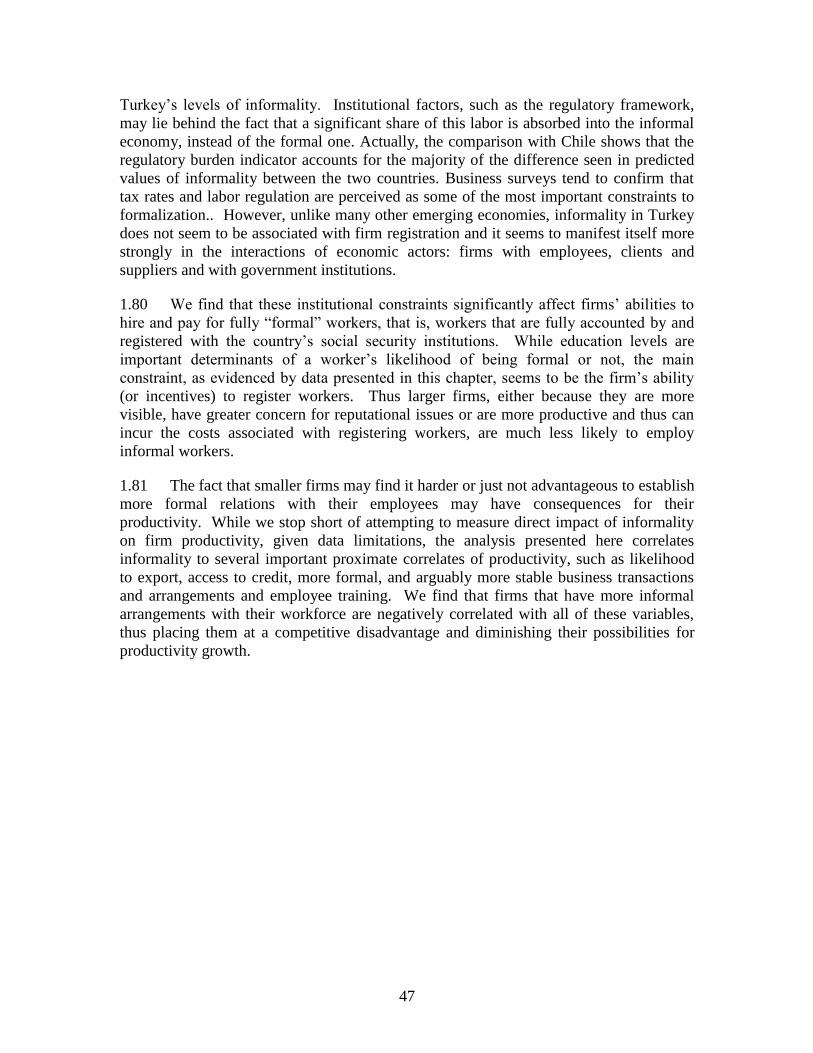
47
Turkey’s levels of informality. Institutional factors, such as the regulatory framework,
may lie behind the fact that a significant share of this labor is absorbed into the informal
economy, instead of the formal one. Actually, the comparison with Chile shows that the
regulatory burden indicator accounts for the majority of the difference seen in predicted
values of informality between the two countries. Business surveys tend to confirm that
tax rates and labor regulation are perceived as some of the most important constraints to
formalization.. However, unlike many other emerging economies, informality in Turkey
does not seem to be associated with firm registration and it seems to manifest itself more
strongly in the interactions of economic actors: firms with employees, clients and
suppliers and with government institutions.
1.80 We find that these institutional constraints significantly affect firms’ abilities to
hire and pay for fully ―formal‖ workers, that is, workers that are fully accounted by and
registered with the country’s social security institutions. While education levels are
important determinants of a worker’s likelihood of being formal or not, the main
constraint, as evidenced by data presented in this chapter, seems to be the firm’s ability
(or incentives) to register workers. Thus larger firms, either because they are more
visible, have greater concern for reputational issues or are more productive and thus can
incur the costs associated with registering workers, are much less likely to employ
informal workers.
1.81 The fact that smaller firms may find it harder or just not advantageous to establish
more formal relations with their employees may have consequences for their
productivity. While we stop short of attempting to measure direct impact of informality
on firm productivity, given data limitations, the analysis presented here correlates
informality to several important proximate correlates of productivity, such as likelihood
to export, access to credit, more formal, and arguably more stable business transactions
and arrangements and employee training. We find that firms that have more informal
arrangements with their workforce are negatively correlated with all of these variables,
thus placing them at a competitive disadvantage and diminishing their possibilities for
productivity growth.
48
1.82 REFERENCES
Gonzalez, A. S., & Lamanna, F. (2007). Who fears competition from informal firms
Evidence from Latin America. Washington, D.C.: World Bank.
Loayza, Norman, (1996). ―The Economics of the Informal Sector: A Simple Model and
Some Evidence from Latin America,‖ Carnegie-Rochester Conference Series on Public
Policy, Vol. 45, pp. 129-162.
Loayza, Norman and Jamele Rigolini, (2006). ―Informality Trends and Cycles,‖ World
Bank Policy Research Working Paper 4078.
Loayza, Norman, (2007). "The causes and consequences of informality in Peru,"
Working Papers 2007-018, Banco Central de Reserva del Perú).
Loayza, Norman, (2009). "Informality in Latin America and the Caribbean" Mimeo,
World Bank.
Oviedo, A. M. (2008). ―Economic Informality: Causes, Costs, and Policies. A Critical
Survey of the International Literature‖. Background paper for Turkey Country Economic
Memorandum Economic Growth and Informality. Mimeo, World Bank.
Perry, Guillermo E., William F. Maloney, Omar S. Arias, Pablo Fajnzylber, Andrew D.
Mason, and Jaime Saavedra-Chanduvi. (2007). Informality: Exit and Exclusion.
Washington, D.C.: World Bank.
Schneider, Friedrich, (2004). ―The Size of the Shadow Economies of 145 Countries all
over the World: First Results over the Period 1999 to 2003,‖ IZA DP No. 1431.
49
ANNEX 1
Explanation of Selected Regression Variables.
Unreported Sales: The exact question that firms are asked to respond to is the following:
―Recognizing the difficulties many enterprises face in fully complying with taxes and
regulations, what percentage of total sales would you estimate the typical establishment
(one just like yours) in your sector reports for tax purposes? Responses were coded as
variable q68a and we used (100-q68a) as the variable for unreported sales.
Unreported Employment: The exact question that firms are asked to respond to is the
following: ―Recognizing the difficulties many enterprises face in fully complying with
labor regulations, what do you think is the percentage of total workforce that is reported
for purposes of payroll taxes and labor regulation in a typical establishment in your
sector? Responses were coded as variable q68b and we used (100-q68b) as the variable
for unreported sales.
Unfavorable Perception of Corruption: bribe=1 if firm agrees that bribes are needed to
get things done.
Rule of Law Indicator: ―To what extent do you agree with the statement‖: ―I am
confident that the judicial system will enforce my contractual and property rights in
business disputes‖ – Dummy Variable =1 if firm ―Tends to agree‖, ―Agrees in most
cases‖ or ―Fully Agrees‖ with the statement.
Bureaucracy Indicator: In a typical week over the last year, what percentage of total
senior management’s time was spent in dealing with requirements imposed by
government regulations, including dealing with officials, completing forms etc?
Tax Rate as Constraint: taxrate=1 if tax rates are a severe or major constraint to
business
Labor Regulation as Constraint: laboreg=1 if labor regulation is a severe or major
constraint to business
Firm’s age: in years.
Labor productivity: value added per worker.
Large or Foreign Client Dummy: Variable to check whether firm sells more than 50 %
to foreign or large firms
Firm Located in Some Type of Industrial Zone: Dummy variable = 1 if firms is
located in either a:
- Small industry district,
- Organized industrial zone,
- Technology development zone,
- Or free trade zone.

50
Firm Competes Against Informal Businesses: Dummy variable =1 for firms that
answer Yes
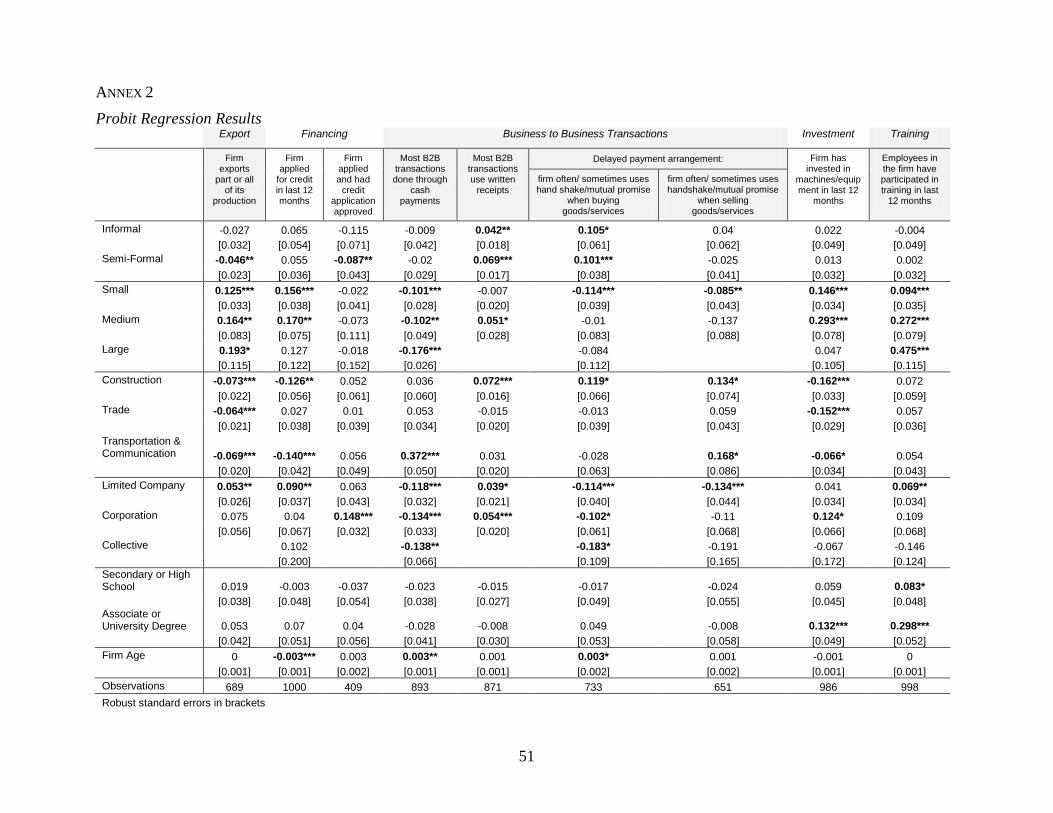
51
ANNEX 2
Probit Regression Results Export Financing Business to Business Transactions Investment Training
Firm exports
part or all of its
production
Firm applied
for credit in last 12 months
Firm applied and had
credit application approved
Most B2B transactions done through
cash payments
Most B2B transactions use written
receipts
Delayed payment arrangement: Firm has invested in
machines/equipment in last 12
months
Employees in the firm have participated in training in last
12 months
firm often/ sometimes uses hand shake/mutual promise
when buying goods/services
firm often/ sometimes uses handshake/mutual promise
when selling goods/services
Informal -0.027 0.065 -0.115 -0.009 0.042** 0.105* 0.04 0.022 -0.004
[0.032] [0.054] [0.071] [0.042] [0.018] [0.061] [0.062] [0.049] [0.049]
Semi-Formal -0.046** 0.055 -0.087** -0.02 0.069*** 0.101*** -0.025 0.013 0.002
[0.023] [0.036] [0.043] [0.029] [0.017] [0.038] [0.041] [0.032] [0.032]
Small 0.125*** 0.156*** -0.022 -0.101*** -0.007 -0.114*** -0.085** 0.146*** 0.094***
[0.033] [0.038] [0.041] [0.028] [0.020] [0.039] [0.043] [0.034] [0.035]
Medium 0.164** 0.170** -0.073 -0.102** 0.051* -0.01 -0.137 0.293*** 0.272***
[0.083] [0.075] [0.111] [0.049] [0.028] [0.083] [0.088] [0.078] [0.079]
Large 0.193* 0.127 -0.018 -0.176*** -0.084 0.047 0.475***
[0.115] [0.122] [0.152] [0.026] [0.112] [0.105] [0.115]
Construction -0.073*** -0.126** 0.052 0.036 0.072*** 0.119* 0.134* -0.162*** 0.072
[0.022] [0.056] [0.061] [0.060] [0.016] [0.066] [0.074] [0.033] [0.059]
Trade -0.064*** 0.027 0.01 0.053 -0.015 -0.013 0.059 -0.152*** 0.057
[0.021] [0.038] [0.039] [0.034] [0.020] [0.039] [0.043] [0.029] [0.036]
Transportation & Communication -0.069*** -0.140*** 0.056 0.372*** 0.031 -0.028 0.168* -0.066* 0.054
[0.020] [0.042] [0.049] [0.050] [0.020] [0.063] [0.086] [0.034] [0.043]
Limited Company 0.053** 0.090** 0.063 -0.118*** 0.039* -0.114*** -0.134*** 0.041 0.069**
[0.026] [0.037] [0.043] [0.032] [0.021] [0.040] [0.044] [0.034] [0.034]
Corporation 0.075 0.04 0.148*** -0.134*** 0.054*** -0.102* -0.11 0.124* 0.109
[0.056] [0.067] [0.032] [0.033] [0.020] [0.061] [0.068] [0.066] [0.068]
Collective 0.102 -0.138** -0.183* -0.191 -0.067 -0.146
[0.200] [0.066] [0.109] [0.165] [0.172] [0.124]
Secondary or High School 0.019 -0.003 -0.037 -0.023 -0.015 -0.017 -0.024 0.059 0.083*
[0.038] [0.048] [0.054] [0.038] [0.027] [0.049] [0.055] [0.045] [0.048] Associate or University Degree 0.053 0.07 0.04 -0.028 -0.008 0.049 -0.008 0.132*** 0.298***
[0.042] [0.051] [0.056] [0.041] [0.030] [0.053] [0.058] [0.049] [0.052]
Firm Age 0 -0.003*** 0.003 0.003** 0.001 0.003* 0.001 -0.001 0
[0.001] [0.001] [0.002] [0.001] [0.001] [0.002] [0.002] [0.001] [0.001]
Observations 689 1000 409 893 871 733 651 986 998
Robust standard errors in brackets
52
* significant at 10%; ** significant at 5%; *** significant at 1%
Omitted categories: Formal, Micro firm, industry, individual firm and primary education or less

53
Export Financing Business to Business Transactions Investment Training
Firm exports
part or all of its
production
Firm applied
for credit in last 12 months
Firm applied and had
credit application approved
Most B2B transactions done through
cash payments
Most B2B transactions use written
receipts
Delayed payment arrangement: Firm has invested in
machines/equipment in last 12
months
Employees in the firm have participated in training in last
12 months
firm often/ sometimes uses hand shake/mutual promise
when buying goods/services
firm often/ sometimes uses handshake/mutual promise
when selling goods/services
Percentage of Informal Workers 0.031 -0.02 -0.086 0.005 0.012 0.031 -0.002 -0.053 -0.144* (uninsured and under-insured) [0.066] [0.081] [0.091] [0.064] [0.045] [0.085] [0.093] [0.076] [0.081]
Small 0.126*** 0.154*** -0.017 -0.100*** -0.009 -0.121*** -0.081* 0.145*** 0.093***
[0.033] [0.038] [0.042] [0.028] [0.022] [0.038] [0.043] [0.034] [0.035]
Medium 0.174** 0.163** -0.052 -0.101** 0.05 -0.026 -0.137 0.289*** 0.265***
[0.085] [0.075] [0.105] [0.050] [0.033] [0.080] [0.088] [0.078] [0.079]
Large 0.217* 0.109 -0.004 -0.175*** -0.114 0.041 0.468***
[0.119] [0.123] [0.139] [0.026] [0.102] [0.103] [0.116]
Construction -0.077*** -0.123** 0.051 0.034 0.077*** 0.125* 0.132* -0.161*** 0.071
[0.021] [0.056] [0.061] [0.060] [0.017] [0.066] [0.074] [0.033] [0.058]
Trade -0.065*** 0.025 0.009 0.054 -0.02 -0.016 0.061 -0.151*** 0.057
[0.021] [0.038] [0.039] [0.034] [0.021] [0.039] [0.043] [0.029] [0.036]
Transportation & Communication -0.066*** -0.150*** 0.064 0.377*** 0.022 -0.047 0.175** -0.069** 0.053
[0.021] [0.042] [0.048] [0.049] [0.023] [0.061] [0.086] [0.034] [0.043]
Limited Company 0.059** 0.082** 0.074* -0.116*** 0.032 -0.118*** -0.137*** 0.036 0.064*
[0.026] [0.037] [0.044] [0.032] [0.021] [0.040] [0.045] [0.034] [0.034]
Corporation 0.1 0.023 0.152*** -0.132*** 0.048* -0.119** -0.114* 0.114* 0.101
[0.062] [0.067] [0.032] [0.033] [0.026] [0.058] [0.068] [0.065] [0.067]
Collective 0.098 -0.137** -0.184 -0.184 -0.065 -0.138
[0.200] [0.067] [0.114] [0.172] [0.173] [0.129]
Secondary or High School 0.025 -0.012 -0.022 -0.02 -0.025 -0.028 -0.024 0.054 0.080*
[0.038] [0.048] [0.053] [0.038] [0.028] [0.049] [0.054] [0.045] [0.048] Associate or University Degree 0.062 0.061 0.054 -0.025 -0.017 0.034 -0.008 0.128*** 0.295***
[0.042] [0.051] [0.055] [0.041] [0.031] [0.053] [0.057] [0.049] [0.052]
Firm Age 0 -0.004*** 0.003* 0.003** 0.001 0.002 0.001 -0.001 0
[0.001] [0.001] [0.002] [0.001] [0.001] [0.001] [0.002] [0.001] [0.001]
Observations 689 1000 409 893 871 733 651 986 998
Robust standard errors in brackets
* significant at 10%; ** significant at 5%; *** significant at 1%
Omitted categories: Micro firm, industry, individual firm and primary education or less