Embed Size (px)
Citation preview
This paper presents preliminary findings and is being distributed to economists
and other interested readers solely to stimulate discussion and elicit comments.
The views expressed in this paper are those of the authors and are not necessarily
reflective of views at the Federal Reserve Bank of New York or the Federal
Reserve System. Any errors or omissions are the responsibility of the authors.
Federal Reserve Bank of New York
Staff Reports
Information and Anti-American Attitudes
Adeline Delavande
Basit Zafar
Staff Report No. 558
April 2012
Revised September 2015
Information and Anti-American Attitudes
Adeline Delavande and Basit Zafar
Federal Reserve Bank of New York Staff Reports, no. 558
April 2012; revised September 2015
JEL classification: D83, L80
Abstract
This paper investigates how attitudes toward the United States are affected by the provision of
information. We generate a panel of attitudes in urban Pakistan, in which respondents are
randomly exposed to fact-based statements describing the United States in either a positive or
negative light. Anti-American sentiment is high and heterogenous in our sample at the baseline,
and systematically correlated with intended behavior, such as intended migration. We find that
revised attitudes are, on average, significantly different from baseline attitudes: attitudes are
revised upward (downward) upon receipt of positive (negative) information, indicating that
providing information had a meaningful effect on U.S. favorability. There is, however, substantial
heterogeneity in the revision of attitudes, with a substantial proportion of individuals not
responding to the information. Nonrevisions are primarily a result of nonmalleability of attitudes.
Revisions are driven by both saliency bias and information-based updating. In addition, the
information-based updating is partly consistent with unbiased belief updating.
Key words: attitudes, media
_________________
Delavande: University of Essex (e-mail: [email protected]). Zafar: Federal Reserve Bank of
New York (e-mail: [email protected]). The authors would like to thank Elizabeth Brown,
Maricar Mabutas, Ellen Fu, and Elizabeth Setren for outstanding research assistance. An earlier
version of this paper was circulated as "How Deeply Held are Anti-American Attitudes among
Pakistani Youth? Evidence Using Experimental Variation in Information." The paper has
benefitted from comments from Nava Ashraf, Paola Giuliano, Asim Ijaz Khwaja, Scott Nelson,
various seminar attendees at University College London, Reading University, Kent University,
Université de Cergy-Pontoise, and participants at the 2012 NBER Political Economy Summer
Institute Meeting, the 2012 NBER Economics of National Security Summer Institute Meeting, the
2012 AALIMS-Stanford University Conference on Economic and Political Development of the
Muslim World, and the 2012 CIPREE Workshop on Formation and Revision of Subjective
Expectations. The authors are enormously indebted to their local field teams and participating
institutions, for without their assistance this project would not have reached its conclusion.
Funding through a RAND Independent Research and Development grant is gratefully
acknowledged. Delavande also acknowledges funding from the ESRC Research Centre on Micro-
social Change. Any errors that remain are those of the authors. The views expressed in this paper
are those of the authors and are not necessarily reflective of views at the Federal Reserve Bank of
New York or the Federal Reserve System.
1 Introduction
Favorable attitudes towards the US are rarer in the Muslim world than anywhere else (Pew
Global Attitudes Project; Gallup World Poll; Kohut and Stokes, 2006). This anti-American
sentiment is a concern because it delegitimizes democratic values, weakens America’s influence
in foreign affairs,1 and correlates positively with a greater incidence of international terrorism
directed towards the US (Koehane and Katzenstein, 2007; Krueger and Maleckova, 2009). In
addition, many of the intractable conflicts in the world today involve Muslim countries, and the
ability of the US to influence the outcomes of these disputes depends on how it is viewed by
the locals. Therefore, understanding the sources of the anti-American sentiment in the Muslim
world has far-reaching political implications. However, there remains little direct evidence on
what drives these attitudes and whether providing information may change them.
Some experts have argued that anti-Americanism is a cultural phenomenon arising from
fundamental disagreements about social norms and values (Huntington, 1996). An alternate ex-
planation is that American foreign policy drives anti-Americanism (Cole, 2006; Esposito, 2007).
An additional factor in the Muslim world is the well-known anti-Western slant of media coverage
and the manipulation of public perceptions by political leaders and agencies (Ajami, 2001; Reetz,
2006; Fair, 2010). This distortion of information may play an important role in the formation
of attitudes and beliefs. As a result, policy-makers have argued that more information could
improve attitudes toward the US in the Muslim world (see examples in Gentzkow and Shapiro,
2004). But existing work also shows that more information does not necessarily lead to con-
vergence in attitudes (e.g., Lord et al. 1979). In this paper, we present evidence on whether
providing information to urban Pakistani youth can shape their attitudes towards the US, and
the mechanisms through which that may happen.
For this purpose, we conduct a randomized information-based experiment embedded within
a survey with young urban Pakistanis from distinct backgrounds. We surveyed a random sample
of 735 respondents from two large cities, and a sample of 1,691 students pursuing Bachelor’s-
equivalent degrees at three higher educational institutions in the two cities. The students at
these educational institutions differ in their religious and socioeconomic backgrounds, and have
varied exposure to Western and English-language news sources. Because of the institutional sort-
ing based on socioeconomic and other characteristics, these sub-groups represent very different
segments of the Pakistani society.
1Anti-American sentiment is generally cited as being a concern for US foreign policy in three main areas: (1)spurring terrorism toward the US or its citizens, (2) harming US commercial interests abroad, and (3) making itmore diffi cult for the US to achieve its policy goals or to rally support for its specific political objectives (Lindbergand Nossel, 2007). While there is little robust evidence suggesting that anti-Americanism threatens cooperationto fight terror, there seems to be greater consensus that Anti-Americanism is associated with increased flows ofpersonnel into terrorist recruitment streams (Charney and Yakatan, 2005; Berman, 2006), and with impedingdiplomacy and inhibiting implementation of US policy (Robichaud and Goldbrenner, 2006).
1
We focus on Pakistan since it presents a particularly interesting case: First, it is considered a
crucial partner in the war on terror.2 Second, despite being a close geopolitical ally of the US and
a major recipient of US foreign aid, there is widespread concern in US policy circles about the
increasing anti-American sentiment in Pakistan.3 Third, as shown in Figure 1, Pakistani attitudes
towards the US are negative compared even to responses from other Muslim countries, and have
become increasingly negative since 2006. We focus on youth because the Pakistani population is
overwhelmingly young (72% are younger than 34, US Census Bureau, 2011), and give particular
attention to elite groups—defined as college-level students—because these individuals will most
likely exert a strong influence in their communities and some will eventually become policy
makers and dictate future policy.
Our main survey employs a within-subject design. We first elicit respondents’baseline atti-
tudes towards various countries and those countries’people. Next, as part of the experiment,
survey respondents are randomly exposed to one of five possible information treatments, which
provide them with fact-based statements describing the US in either a positive or negative light.
In the next stage, the respondents’attitudes are re-elicited. In the final stage, information priors
about the treatments are queried. This design allows us to explore the controlled effects of the
information treatments and to make causal inferences about the role of information on public
opinion. It mitigates potential endogeneity issues related to the self-selection of information
sources. By employing both positive and negative information treatments, our design also allows
us to investigate whether responses to the two kinds of information differ in some systematic
ways. In addition, our within-subject design combined with the elicitation of priors allows us to
uncover the mechanisms of attitude revision, which is particularly relevant from a policy point-
of-view, and would be impossible to uncover using a between-subject design. In particular, we
evaluate whether the changes in attitudes are driven by updating (biased or unbiased) of beliefs
about US actions and/or changes in preferences/saliency attached to these actions. We also col-
lect rich demographic data, which allow us to explore, at a micro level, how attitudes correlate
with observable population characteristics, and whether the impact of information varies by the
respondent’s background.
Anti-American sentiment is high in our sample: the mean favorability reported for the US
is 2.58 (on a 0-10 scale, where 0 means very unfavorable and 10 means very favorable), which
2For example, US Defense Secretary Leon Panetta, while speaking to reporters on December 13, 2011 said"Ultimately, we can’t win the war in Afghanistan without being able to win in our relationship with Pakistan aswell". Similarly, his predecessor, Robert Gates, speaking at the American Enterprise Institute (AEI) on May25, 2011, said, "Pakistan is very important, not just because of Afghanistan but because of its nuclear weapons,because of the importance of stability in the subcontinent."
3The US Secretary of State, Hillary Clinton, in a speech to the Asia Society on February 18, 2011, whenreferring to the dire state of Pakistan’s public finances said "shocking, unjustified anti-Americanism will notresolve these problems" (http://www.state.gov/secretary/rm/2011/02/156815.htm). Similarly, on her first visitto Pakistan on May 27, 2011, following the raid that killed Osama bin Laden, she commented "Pakistan shouldunderstand that anti-Americanism and conspiracy theories will not make problems disappear".
2
is worse than the average rating of all other countries for which attitudes were elicited, with
the exception of India.4 Opinions are also heterogeneous, with groups that are wealthier and
more exposed to Western media holding relatively more favorable attitudes towards the US. US
favorability is positively correlated with respondents’perceived likelihood of US taking certain
positive actions (from the Pakistani perspective) in the future, casting doubt on the hypothesis
that attitudes are merely a cultural construct. We also document a robust relationship between
baseline US favorability and (intended) behavior. First, respondents’stated likelihood of migrat-
ing to the US if an economic opportunity were to come along is (economically and statistically)
higher for those with more favorable US attitudes. Second, respondents were presented with an
incentivized question where they could donate Rs. 50 (roughly 0.60 USD) to a charity. We find
that respondents with more favorable US attitudes are significantly less likely to contribute to a
conservative charity, and more likely to donate to a secular charity.
Turning to the experimental results, we find that respondents change their attitudes toward
the US after being exposed to both positive and negative information: attitudes are, on average,
revised up (down) for positive (negative) information about the US. Moreover, average revisions
are substantial, varying between 0.5% and 29% of the standard deviation of the baseline attitudes.
The average revisions, however, mask the heterogeneity in response to the information. Nearly
half of the respondents in our sample do not revise their attitudes. Notably, the propensity to
revise attitudes is higher for students in the more selective Western-style university, and for those
more proficient in English.
Policy-makers are interested not only in whether information can impact attitudes, but also
the channels through which that may happen. To shed light on that, we first outline a model of
revision of attitudes in light of new information about US actions, with two possible channels:
(1) change in preferences for US actions, and (2) updating of beliefs about the likelihood of
those actions. The first channel would suggest that respondents respond to the information
even if they were ex-ante aware of it, by changing their preferences (i.e., how much they value
some specific action) because of salience and/or availability bias (Tversky and Kahneman, 1973;
Schwarz and Vaughn, 2002; Dellavigna, 2009). The second channel is simply a pure information
acquisition story: respondents revise their attitudes because the new information changes their
beliefs. Note that the two channels have vastly different policy prescriptions. The latter would
suggest that one-time information campaigns may be suffi cient, while the frequency and timing
of the intervention would matter if updating were a result of saliency. Whether information leads
to convergence in attitudes would partly depend on the extent to which information is processed
in an unbiased way.5
4We adopt a direct elicitation approach of attitudes. See Bursztyn et al. (2014) for an indirect revealedpreference approach.
5There is evidence that individuals have a propensity to discount new information if it is inconsistent with aprior belief; in that case, information may in fact lead to more dispersed and polarized beliefs (Lord, Ross, and
3
In the data, we find substantial heterogeneity in the revision of attitudes: there is evidence of
saliency bias, unbiased information-based updating, and non-malleability of attitudes. Consistent
with salience-based revisions, we find that (i) non-revision is not more prevalent among those
who already knew the information, and (ii) even conditional on priors (that is, controlling for
the informativeness of the provided information), respondents allocated to a positive treatment
revise their attitude upwards on average. We also find that respondents who had positive priors
(i.e., those who thought more positively about the US than is warranted by the facts provided to
them in the treatment and who represent 14% of our sample), on average, revise their attitudes
in a way consistent with unbiased belief updating. But for those with negative priors, the average
revision in attitudes is not consistent with unbiased updating. In addition, we find that at least
13% of respondents have non-malleable attitudes- they do not revise their attitudes even when
the provided information was ex-ante unknown. This heterogeneity in revision processes means
that there is no convergence in attitudes following the provision of information.
Overall, our findings suggest that (i) public opinions are not purely a cultural phenomenon,
and are in part shaped by understanding of recent events, (ii) they are malleable in the face
of new information, (iii) information on both positive and negative actions taken by the US
affects Pakistanis’average opinions of America in the expected direction, and (iv) response to
information is not uniform and results from saliency as well as generally unbiased updating.
Overall, this makes the case for dissemination of accurate information about various aspects of
the Pakistan-US relationship, particularly those that are omitted or manipulated by the local
media and agencies.
We test the robustness of various features of the study design. For this purpose, at a later
date, we conducted a follow-up study at one of the institutions that consisted of two surveys
fielded a month apart. The follow-up consisted of both a within- and between- subject design.
Importantly, we can rule out an experimenter demand effect driving our main results. While our
main results focus on the immediate impacts of information, we investigate the medium-term
impact of information in the follow-up survey, but find inconclusive results.
Our paper is related to the literature focusing on how information influences attitudes, mostly
in the political domain. There is a growing literature on the role of media exposure on polit-
ical attitudes and behavior in the field and in the lab (e.g., Ansolabehere and Iyengar, 1995;
Gentzkow, 2006; DellaVigna and Kaplan, 2007; Gerber et al., 2009, DellaVigna and Gentzkow,
2010). For example, Gerber et al. (2009) randomly subscribe individuals to a conservative or
liberal newspaper prior to a gubernatorial election and find that receiving either paper led to
more support for the Democratic candidate, suggesting that media exposure matters more than
media slant in this context. A related literature investigates the impact of educational content
on attitudes (e.g., Fisman et al., 2009; Clots-Figueiras and Masella, 2013; Cantoni et al., 2014).
Lepper, 1979; Glaeser, 2004; Mullainathan and Shleifer, 2005).
4

For example, Cantoni et al. (2014) exploit geographic and time variation in the adoption of a
new curriculum in China and find that this curriculum shaped students’views on political par-
ticipation and democracy in China. Finally, other work has investigated how attitudes change in
light of various experiences (e.g., Mullainathan and Washington, 2009; Beath et al. 2012). More
generally, DellaVigna and Gentzkow (2010) review the empirical literature on "persuasion" in
various domains, though their focus is mostly on behaviors rather than attitudes. Our paper
complements this general literature by providing causal evidence of the effect of exogenously-
provided information on attitudes toward the US in a context which is both very policy-relevant
and where attitudes are extremely negative (and thought to be hard to change). Importantly,
and unlike most of the studies cited above, our paper also provides some evidence on the mech-
anisms leading to the observed changes in attitude. Our unique data collection methodology
which elicits information priors directly from respondents —data that are otherwise not available
and impossible to infer directly from observational data —allows us to investigate whether up-
dating is a result of saliency or information-processing, and whether such information processing
is biased.6
Finally, as we model attitudes as a composite element of the beliefs an individual holds toward
the US actions (past and future) and his preferences toward these actions, our analysis relates
to existing work looking at how information influences beliefs and/or preferences. Regarding
the formation of beliefs, existing empirical and theoretical work evaluates whether people are
Bayesian (e.g., El-Gamal and Grether, 1995), and why belief updating may depart from the
Bayesian model by providing explanations such as the use of heuristics (e.g., Tversky and Kan-
heman, 1973; 1974), confirmatory bias (e.g., Rabin and Schrag, 1999), the failure to account for
information repetition (e.g., DeMarzo et al. 2003), or limited memory (e.g., Mullainathan, 2002;
Shapiro, 2006). Regarding preferences, another strand of theoretical and empirical work explores
how information may change individual tastes (e.g., Becker and Murphy; 1993; Druckman and
Lupia, 2000; Glaeser, 2005; Bassi and Rasul, 2015). In our data, we find evidence of both changes
in beliefs and preferences in response to information.
This paper is organized as follows. In Section 2, we present a simple model of attitude
formation, and outline the possible channels through which our intervention may lead to a
(systematic) revision of attitudes. We describe the sample, study design and data collection
methodology in Section 3. The empirical analysis is presented in Section 4. Section 5 sheds
light on the mechanisms that lead to revisions, and the underlying heterogeneity in the revision
process. Robustness checks are presented in Section 6. Finally, Section 7 concludes.
6There is also a small related literature focusing on the correlates of anti-Americanism, primarily based oncross-country comparisons. For example, Gentzkow and Shapiro (2004) find only a limited role of media use oreducation on attitudes, but the type of media (e.g., CNN vs. Al Jazeera) and education systems matter. Blaydesand Linzer (2012) find that higher intensity of Secular-Islamist political competition increases anti-Americanism.Zirkhov (2014) report an inverse-U-shape relationship between anti-Americanism and Human Development Index.
5
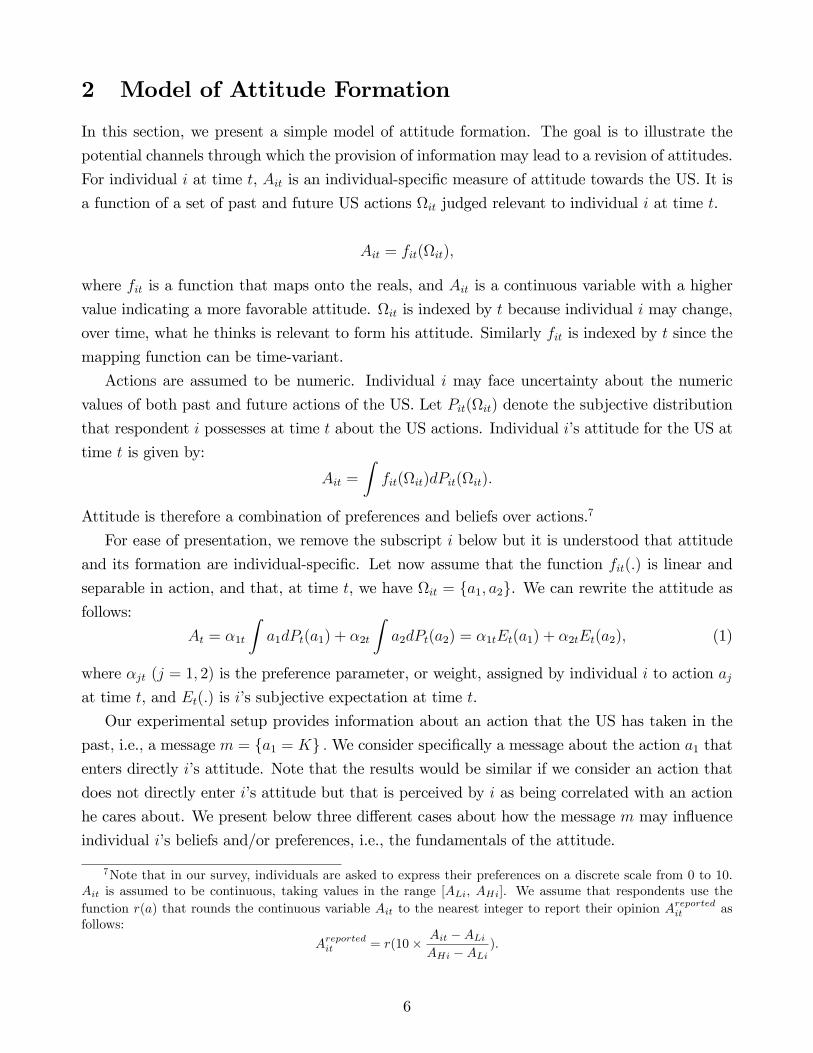
2 Model of Attitude Formation
In this section, we present a simple model of attitude formation. The goal is to illustrate the
potential channels through which the provision of information may lead to a revision of attitudes.
For individual i at time t, Ait is an individual-specific measure of attitude towards the US. It is
a function of a set of past and future US actions Ωit judged relevant to individual i at time t.
Ait = fit(Ωit),
where fit is a function that maps onto the reals, and Ait is a continuous variable with a higher
value indicating a more favorable attitude. Ωit is indexed by t because individual i may change,
over time, what he thinks is relevant to form his attitude. Similarly fit is indexed by t since the
mapping function can be time-variant.
Actions are assumed to be numeric. Individual i may face uncertainty about the numeric
values of both past and future actions of the US. Let Pit(Ωit) denote the subjective distribution
that respondent i possesses at time t about the US actions. Individual i’s attitude for the US at
time t is given by:
Ait =
∫fit(Ωit)dPit(Ωit).
Attitude is therefore a combination of preferences and beliefs over actions.7
For ease of presentation, we remove the subscript i below but it is understood that attitude
and its formation are individual-specific. Let now assume that the function fit(.) is linear and
separable in action, and that, at time t, we have Ωit = a1, a2. We can rewrite the attitude asfollows:
At = α1t
∫a1dPt(a1) + α2t
∫a2dPt(a2) = α1tEt(a1) + α2tEt(a2), (1)
where αjt (j = 1, 2) is the preference parameter, or weight, assigned by individual i to action ajat time t, and Et(.) is i’s subjective expectation at time t.
Our experimental setup provides information about an action that the US has taken in the
past, i.e., a message m = a1 = K .We consider specifically a message about the action a1 thatenters directly i’s attitude. Note that the results would be similar if we consider an action that
does not directly enter i’s attitude but that is perceived by i as being correlated with an action
he cares about. We present below three different cases about how the message m may influence
individual i’s beliefs and/or preferences, i.e., the fundamentals of the attitude.
7Note that in our survey, individuals are asked to express their preferences on a discrete scale from 0 to 10.Ait is assumed to be continuous, taking values in the range [ALi, AHi]. We assume that respondents use thefunction r(a) that rounds the continuous variable Ait to the nearest integer to report their opinion A
reportedit as
follows:
Areportedit = r(10× Ait −ALiAHi −ALi
).
6
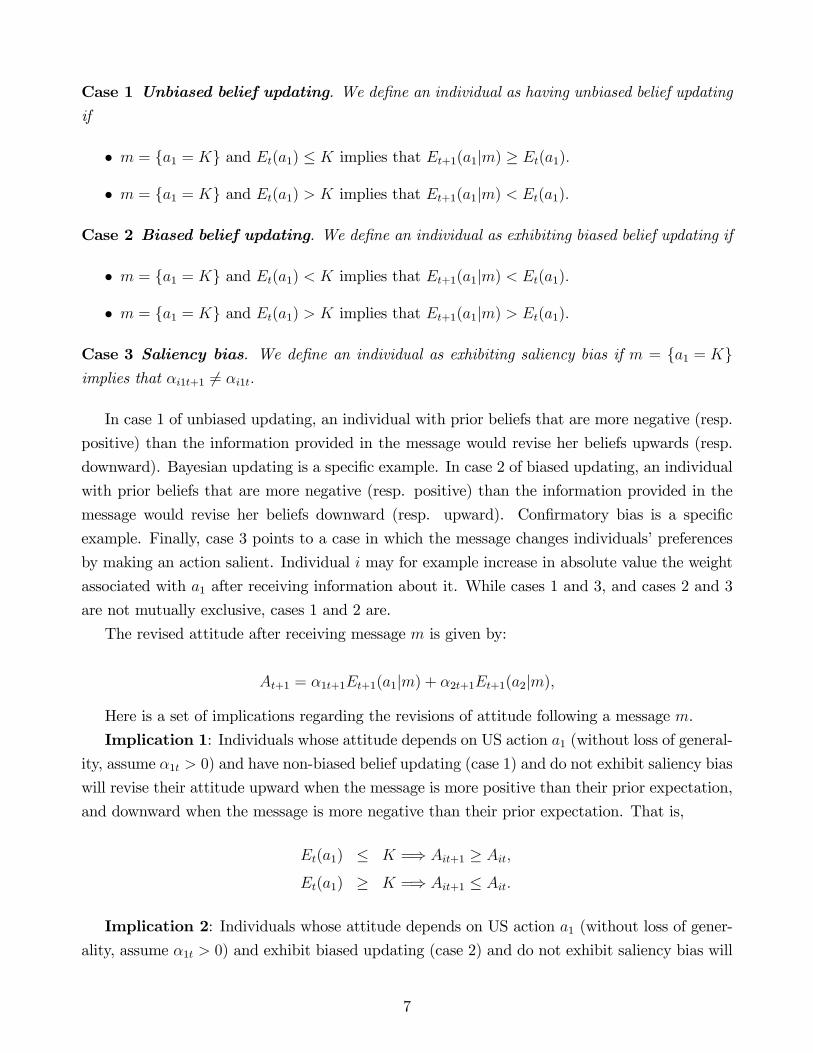
Case 1 Unbiased belief updating. We define an individual as having unbiased belief updatingif
• m = a1 = K and Et(a1) ≤ K implies that Et+1(a1|m) ≥ Et(a1).
• m = a1 = K and Et(a1) > K implies that Et+1(a1|m) < Et(a1).
Case 2 Biased belief updating. We define an individual as exhibiting biased belief updating if
• m = a1 = K and Et(a1) < K implies that Et+1(a1|m) < Et(a1).
• m = a1 = K and Et(a1) > K implies that Et+1(a1|m) > Et(a1).
Case 3 Saliency bias. We define an individual as exhibiting saliency bias if m = a1 = Kimplies that αi1t+1 6= αi1t.
In case 1 of unbiased updating, an individual with prior beliefs that are more negative (resp.
positive) than the information provided in the message would revise her beliefs upwards (resp.
downward). Bayesian updating is a specific example. In case 2 of biased updating, an individual
with prior beliefs that are more negative (resp. positive) than the information provided in the
message would revise her beliefs downward (resp. upward). Confirmatory bias is a specific
example. Finally, case 3 points to a case in which the message changes individuals’preferences
by making an action salient. Individual i may for example increase in absolute value the weight
associated with a1 after receiving information about it. While cases 1 and 3, and cases 2 and 3
are not mutually exclusive, cases 1 and 2 are.
The revised attitude after receiving message m is given by:
At+1 = α1t+1Et+1(a1|m) + α2t+1Et+1(a2|m),
Here is a set of implications regarding the revisions of attitude following a message m.
Implication 1: Individuals whose attitude depends on US action a1 (without loss of general-ity, assume α1t > 0) and have non-biased belief updating (case 1) and do not exhibit saliency bias
will revise their attitude upward when the message is more positive than their prior expectation,
and downward when the message is more negative than their prior expectation. That is,
Et(a1) ≤ K =⇒ Ait+1 ≥ Ait,
Et(a1) ≥ K =⇒ Ait+1 ≤ Ait.
Implication 2: Individuals whose attitude depends on US action a1 (without loss of gener-ality, assume α1t > 0) and exhibit biased updating (case 2) and do not exhibit saliency bias will
7
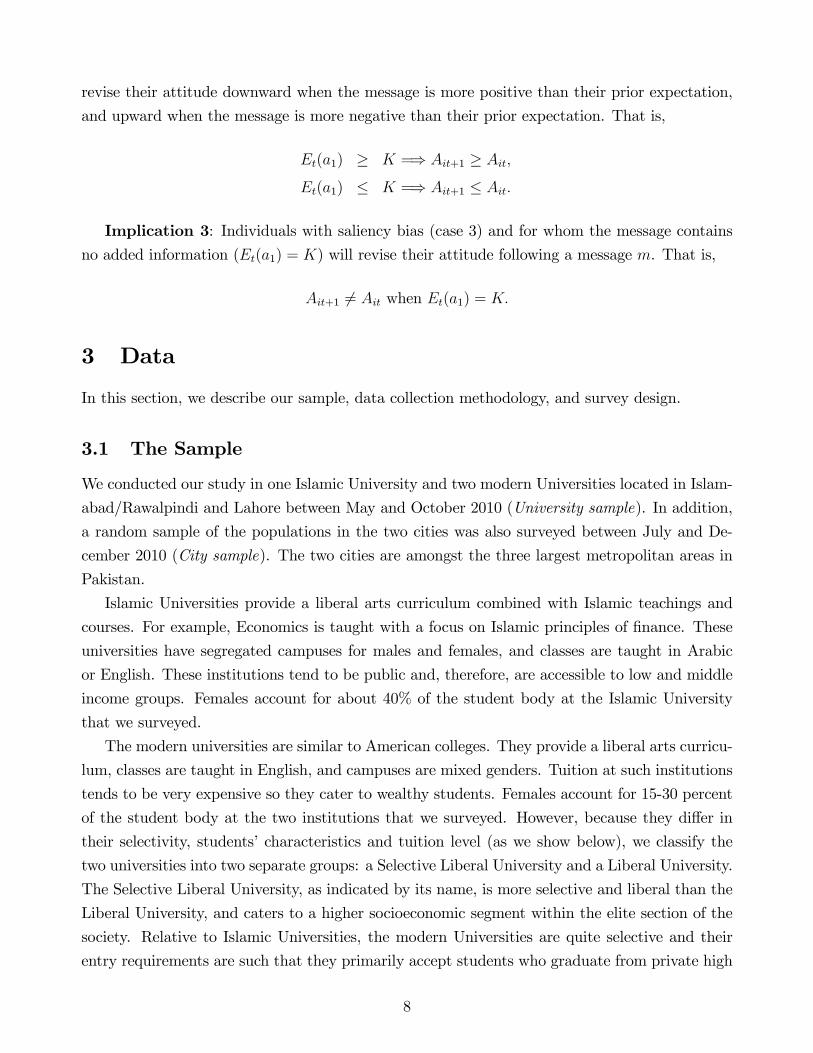
revise their attitude downward when the message is more positive than their prior expectation,
and upward when the message is more negative than their prior expectation. That is,
Et(a1) ≥ K =⇒ Ait+1 ≥ Ait,
Et(a1) ≤ K =⇒ Ait+1 ≤ Ait.
Implication 3: Individuals with saliency bias (case 3) and for whom the message contains
no added information (Et(a1) = K) will revise their attitude following a message m. That is,
Ait+1 6= Ait when Et(a1) = K.
3 Data
In this section, we describe our sample, data collection methodology, and survey design.
3.1 The Sample
We conducted our study in one Islamic University and two modern Universities located in Islam-
abad/Rawalpindi and Lahore between May and October 2010 (University sample). In addition,
a random sample of the populations in the two cities was also surveyed between July and De-
cember 2010 (City sample). The two cities are amongst the three largest metropolitan areas in
Pakistan.
Islamic Universities provide a liberal arts curriculum combined with Islamic teachings and
courses. For example, Economics is taught with a focus on Islamic principles of finance. These
universities have segregated campuses for males and females, and classes are taught in Arabic
or English. These institutions tend to be public and, therefore, are accessible to low and middle
income groups. Females account for about 40% of the student body at the Islamic University
that we surveyed.
The modern universities are similar to American colleges. They provide a liberal arts curricu-
lum, classes are taught in English, and campuses are mixed genders. Tuition at such institutions
tends to be very expensive so they cater to wealthy students. Females account for 15-30 percent
of the student body at the two institutions that we surveyed. However, because they differ in
their selectivity, students’characteristics and tuition level (as we show below), we classify the
two universities into two separate groups: a Selective Liberal University and a Liberal University.
The Selective Liberal University, as indicated by its name, is more selective and liberal than the
Liberal University, and caters to a higher socioeconomic segment within the elite section of the
society. Relative to Islamic Universities, the modern Universities are quite selective and their
entry requirements are such that they primarily accept students who graduate from private high
8
schools (which tend to have higher academic standards).
The institutions in our sample are amongst the five largest and most well-regarded institutions
in the relevant category in each city. Among all the institutions we contacted, one university
refused to participate. At each of the institutions, a random sample of students (unconditional
on gender) was selected to participate based on a listing of students provided by the registrar’s
offi ce. The average response rate at the universities was about 70%. Overall 1,691 students
participated in the study. After dropping 29 students with missing data for the key variables,
we are left with a total of 1,662 students, of whom 477 were female.
In addition, for the City sample, a random sample of 735 respondents from the two cities
was also surveyed. After restricting to respondents with non-missing data for the main variables,
we are left with 724 respondents, of whom 335 were female. Our sampling frame for the two
cities was provided by the (Pakistan) Federal Bureau of Statistics. The overall response rate was
38%, with the refusal rate being higher for females. In the analysis, we pool the data from the
two urban centers, since there are no qualitative differences between them in observables and
attitudes.
Table 1 presents the characteristics of students at the three institutions in the first three
columns, and of the City sample in the fourth column. The sorting in terms of observables
into these institutions is very drastic but as expected. As we move across the columns from
Selective Liberal University towards Islamic University in Table 1, the average socioeconomic
characteristics deteriorate. For example, the monthly parental income of Selective Liberal Uni-
versity students is nearly twice that of Liberal University students, and about four times that of
students at Islamic University. Similar patterns emerge with regards to parents’education and
asset ownership. If we compare the students to the City sample, we see that all institutions fare
better in terms of most indicators of wealth than the general populations in the two cities.
Students from the various groups also report different levels of self-reported religiosity and the
number of prayers per day. Students were asked to rate how religious they considered themselves
on a scale from 0 (not religious at all) to 10 (very religious). Religiosity increases as we move
across the first three columns of Table 1: the average religiosity is 5.4 for Selective Liberal
University students, 5.9 for Liberal University students, and 6.3 for Islamic University students.
The former also pray much less frequently every day. Average religiosity and religious practices
of the City respondents are similar to those of Islamic University students.
Finally, exposure to English-language news sources declines and consumption of conservative
news sources increases as we move from column (1) to column (3).8 Remarkably, Islamic Uni-
versity students are almost twice as likely as the City sample respondents to get their news from
conservative right-wing sources.
8The classification of news sources as conservative is done in a subjective manner, since no objective metricsexist. We classify Awsaaf, Zarb-e-Momin, Nawai Waqt, and Al Jazeerah as conservative news sources.
9
The survey elicited respondents’beliefs about the likelihood that the US would take certain
actions over the next five years. The table reports the mean likelihood (on a 0-100 scale) as
reported by these students. We see that, on average, students at the Selective Liberal University
have the most favorable beliefs about these outcomes. For example, the mean likelihood that
Selective Liberal University students assign to the US stopping drone attacks in Pakistan over
the next 5 years is about a third, compared with a mean likelihood of 26% for Liberal University
and Islamic University students, and 16% for the City sample.
In addition, we also conducted a second survey at the Liberal University during March-April
2013 (Follow-up sample). The purpose of this study was primarily to test the robustness of our
study design. The survey was conducted in 21 different classes, at the end of class time. The
classes were randomly chosen by the registrar’s offi ce, with response rates being close to 100%.
Column (5) of Table 1 shows the characteristics of the 649 students in the follow-up survey. Only
a subset of demographic characteristics were collected. Comparing the statistics with those in
column (2) of the table, we see that the follow-up sample is similar in observables to the initial
sample at Liberal University (with the exception of mean religiosity in the follow-up sample being
higher, and age slightly lower).
In short, the table shows that there is substantial sorting on observables into institutions. At
one end of the spectrum we have young males from humbler backgrounds who attend conservative
schools. At the other end of the spectrum we have wealthy students exposed to Western-type of
education and with greater access to international media.
3.2 Study Design
The details of data collection are presented in the Appendix. We now describe the relevant part
of the survey that was conducted in 2010; the follow-up survey is described later in section 6,
when we present robustness analysis. The 2010 survey essentially consists of three stages.
1. Baseline Attitudes: We first survey respondents about their attitudes towards various coun-
tries, those countries’people, and various Pakistani institutions. Unlike existing polls, such
as those by the Pew Global Attitudes Project, which elicit attitudes by employing either
a coarse Likert scale (very favorable, somewhat favorable, somewhat unfavorable, very un-
favorable) or a simple “yes/no”response, we use the following wording: “On a scale from
0 to 10, where 0 means very unfavorable and 10 means very favorable, please tell me your
opinion of ...”. The advantage of this alternate wording is that it allows the responses to be
cardinal and interpersonally comparable, and allows respondents to express the intensity
of their attitudes in a more refined manner.
Attitudes were elicited for: the United States; Saudi Arabia; India; China; the United King-
dom; Americans; Chinese people; Pakistani government; Pakistani Military; and Pakistan
10
Political Parties. We refer to these attitudes as "baseline attitudes".
2. Information Treatment: Next, we randomly provided respondents with one of five possible
information treatments (Table 2). The baseline attitudes and information treatment were
separated by a battery of questions on social and political issues. Each treatment contained
two or three pieces of fact-based information along with the news source providing the
information. The first four treatments could be characterized as highlighting a positive or
negative aspect of the US-Pakistan relationship (from a Pakistani perspective). Treatment
1 (T1) provided information on US assistance to Pakistan with a negative slant (pointing
out for example that, during 2009, the financial assistance that the US provided to Israel
was three times as much as the assistance the US provided to Pakistan), while T3 provided
information on US assistance in a positive way (pointing out for example that, in 2007,
the funds the United States disbursed to Pakistan were 21 times larger than the funds
China disbursed to Pakistan, and as many as 27 times the amount of funds Saudi Arabia
disbursed to Pakistan; China and Saudi Arabia are considered closed allies of Pakistan).
Similarly, T2 provided information on drone attacks (negative), T4 provided information on
humanitarian aid from US-based organizations (positive). Therefore, T1 and T2 provide
information that most would agree is negative about the US, while T3 and T4 provide
information that most would agree is positive about the US.9 T5 provides information
about countries other than the US, and is used as a placebo treatment.
3. Revised Attitudes: Immediately after being provided with the information, some of the
baseline attitudes were re-elicited as follows: "We would now like to re-elicit some of your
attitudes that were asked earlier. On a scale from 0 to 10, where 0 means very unfavorable
and 10 means very favorable, please tell me your opinion of...". Respondents were encour-
aged to refer to their previous responses when reporting their attitudes. We refer to these
as "revised attitudes".
4. Information Priors: Since the effect of information on attitudes (or beliefs) generally de-
pends on how new the information is, we also collected data on the respondent’s prior
about the information, i.e., we asked the respondent if each piece of information that we
provided to them was already known, or whether it was a positive or negative surprise for
them.
For example, consider the first piece of information provided in Treatment 1: "During
2009, the financial assistance that the US provided to Israel was three times as much as the
9However, there could be a perception that foreign assistance or humanitarian aid is used politically by theUS to enslave a country, and greater aid may instead be construed as an example of "capitalist or imperialistexploitation" (Kizilbash, 1988). In that case, T3 (which reveals that US assistance to Pakistan is large relativeto other donors) and T4 (which reveals the extent of humanitarian aid work by US-based organizations) may beinterpreted as negative information treatments. This is an empirical question, which we investigate in Section 4.
11
assistance the US provided to Pakistan (Source: US Aid)". We elicited respondents’priors
about this news item as follows: "Before we gave you this information, did you think that,
in 2009, the financial assistance that the US provided to Israel was more than, less than or
about three times as much as the assistance the US provided to Pakistan?".
We refer to these as "information priors". While this is not the most natural way of
eliciting priors, this elicitation strategy was intentional on our part. One, respondents
could easily go back and forth in the questionnaire, and so could have easily revised their
priors if they were elicited before the information had been revealed. Second, because of
concerns that respondents may anchor to numbers presented to them in the information
treatments (Tversky and Kahneman, 1974), we chose to elicit priors this way instead of
asking them for a point response. In the follow-up study, comparing priors of a control and
treatment group, we test for the robustness of our design (see section 6).
Three points about the study design deserve further discussion. First, respondents are ran-
domly allocated to an information treatment. Since individuals self-select their sources of infor-
mation in the real world, randomly exposing them to an information treatment gets around this
endogeneity issue and allows us to evaluate the causal impact of information on attitudes. Sec-
ond, we employ both positive and negative information treatments. This allows us to investigate
whether responses to the two kinds of information differ in some systematic way. In principle,
having a study design with one positive and one negative information treatment would have suf-
ficed. However, given that we know little about what kinds of information matter for attitudes,
we chose to have five different information treatments. The two negative information treatments
focus on very different aspects: the relatively low financial assistance that Pakistan receives from
the US (relative to some other recipient countries), and different aspects of the drone program.
The two positive treatments focused on either the humanitarian work being done by US orga-
nizations or the relatively high financial aid Pakistan receives from the US (relative to some
other donors). Including treatments with such a wide spectrum of information then reduces the
likelihood of respondents not finding any of these information treatments relevant (in which case
we would observe no causal effect of information).10
Finally, we employ a within-subject design for the purpose of uncovering the mechanisms of
attitude revision. From a policy aspect, we are interested not only in whether attitudes can
be impacted by information provision but also in how that might happen. While the former
can be investigated by using either a within- or between- subject design, the mechanisms that
lead to revision require the researcher having data on both the respondent’s pre-information and
10Since there is little prior knowledge of how relevant different kinds of information are for attitudes formation,we restricted each information treatment to either positive information or negative information about the US, butnot both. As we show in the model section, restricting the treatments to either positive or negative informationallows us to get clear predictions for how attitudes should be revised. Under reasonable assumptions, that wouldgenerally not be possible if a treatment included both kinds of information.
12
post-information attitudes. One concern with the within-subject design may be the experimenter
demand effect, that is, respondents may revise their attitudes upon receipt of information simply
because they believe doing so constitutes appropriate behavior (Zizzo, 2010). This would lead to
larger responsiveness in the within- versus the between- design. On the other hand, respondents
in the within-subject design may anchor their responses to the baseline level, and may be less
susceptible to revise their attitudes upon provision of information- this would bias the revisions
downwards. For our purposes, the upward bias from the experimenter-demand effect would be a
bigger concern. While our main analysis uses the within-subject design, section 6 presents results
from the follow-up study which employs both a within- and between- subject design, allowing us
to investigate the robustness of our study design.
4 Empirical Analysis
We first describe the baseline attitudes and how they correlate with other observable charac-
teristics and behavior. We then present the average treatment effects and next look at the
mechanisms and heterogeneity in the revision process.
4.1 Baseline Attitudes
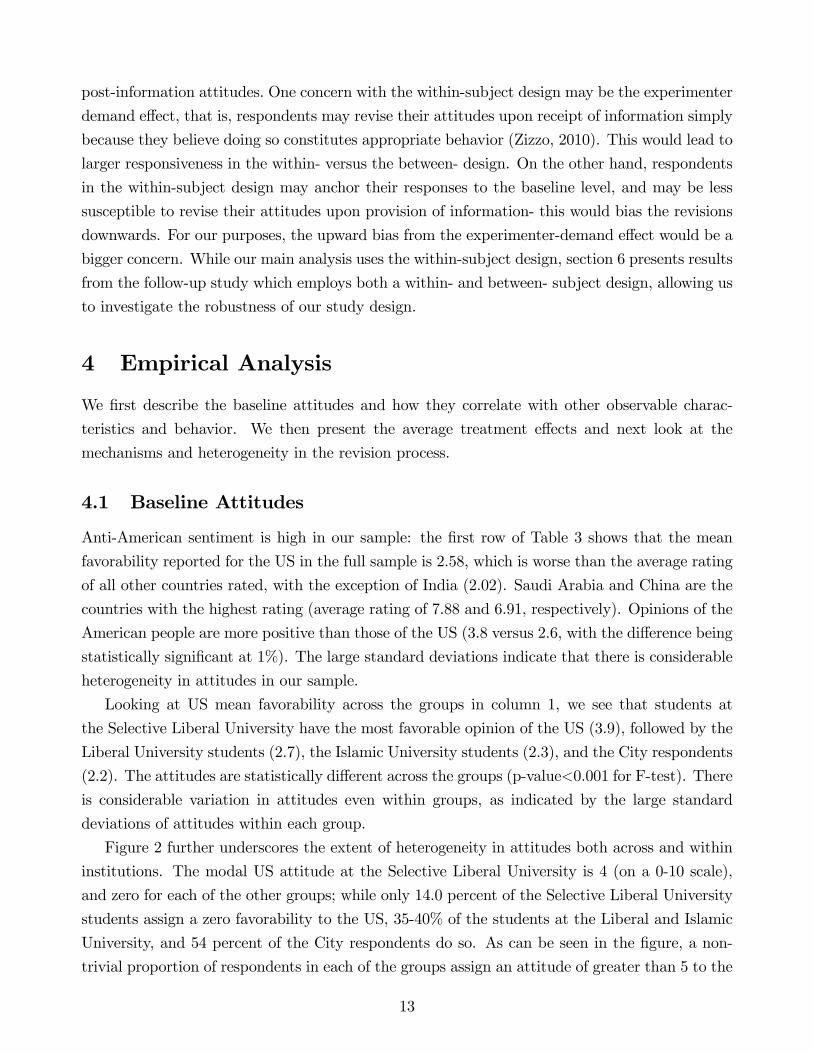
Anti-American sentiment is high in our sample: the first row of Table 3 shows that the mean
favorability reported for the US in the full sample is 2.58, which is worse than the average rating
of all other countries rated, with the exception of India (2.02). Saudi Arabia and China are the
countries with the highest rating (average rating of 7.88 and 6.91, respectively). Opinions of the
American people are more positive than those of the US (3.8 versus 2.6, with the difference being
statistically significant at 1%). The large standard deviations indicate that there is considerable
heterogeneity in attitudes in our sample.
Looking at US mean favorability across the groups in column 1, we see that students at
the Selective Liberal University have the most favorable opinion of the US (3.9), followed by the
Liberal University students (2.7), the Islamic University students (2.3), and the City respondents
(2.2). The attitudes are statistically different across the groups (p-value<0.001 for F-test). There
is considerable variation in attitudes even within groups, as indicated by the large standard
deviations of attitudes within each group.
Figure 2 further underscores the extent of heterogeneity in attitudes both across and within
institutions. The modal US attitude at the Selective Liberal University is 4 (on a 0-10 scale),
and zero for each of the other groups; while only 14.0 percent of the Selective Liberal University
students assign a zero favorability to the US, 35-40% of the students at the Liberal and Islamic
University, and 54 percent of the City respondents do so. As can be seen in the figure, a non-
trivial proportion of respondents in each of the groups assign an attitude of greater than 5 to the
13
US: 26.3% of Selective Liberal University students assign the US a favorability of greater than 5,
while the corresponding proportions are 19.2%, 14.6%, and 15.9% for respondents at the Liberal
University, Islamic University, and City sample, respectively.
4.1.1 Correlates of Attitudes
The large standard deviations of the attitudes in the full sample, as well as within each institution,
indicate that attitudes are quite heterogeneous. While there is no evidence of a definite link
between poverty, education, and terrorism in the existing literature (Krueger and Maleckova,
2003; Abadie, 2006; Berrebi, 2007; Krueger, 2007), particular educational systems may mediate
the political attitudes of their students (Gentzkow and Shapiro, 2004). As shown in Table 3,
students enrolled at institutions with more religious and conservative curricula view the US less
favorably. However, even at the most conservative institutions– the Islamic University– the
mean opinion is slightly higher than in the City sample. This suggests that education, regardless
of its content, is positively correlated with US favorability, at least in our sample.
However, since students select their schools, we cannot conclude that educational content leads
to differences in US favorability. Table 4 shows how some of these characteristics correlate with
public opinion towards the US and Americans. We see that income, parents’years of schooling,
and exposure to English-language media are positively associated with US favorability. On the
other hand, exposure to conservative media, religiosity and being influenced by a religious leader
are negatively associated with US favorability.11 It is noteworthy that we do not observe any
significant differences in US favorability by gender or by foreign affairs knowledge (as measured
by a battery of six questions).
These relationships generally hold in a multivariate regression framework, reported in the
first column of Appendix Table A1. Columns (2) and (3) of the table also include respondents’
perceived likelihood of US taking certain actions in the next five years as independent variables.
We see that nearly all these variables are significant and of the expected sign, indicative of atti-
tudes not merely being a cultural construct but being systematically associated with subjective
perceptions about future actions of the US. The coeffi cients on these variables are sizable: an
increase in the perceived likelihood from zero to absolute certainty (that is, 100 percent) of the
US having a balanced approach to the Palestinian conflict in the next five years is associated
with a 2 point increase (on a 0-10 scale), on average, in the attitude towards the US. Likewise an
increase in the likelihood from 0 to 100 of the US increasing its (military and civilian) presence
in Pakistan is associated with a 0.6 point decline, on average, in the US attitude.
11Blaydes and Linzer (2012), in their analysis of attitudes towards the US among Muslims in 21 countries, findsimilar correlations between anti-Americanism and religiosity and media exposure.
14
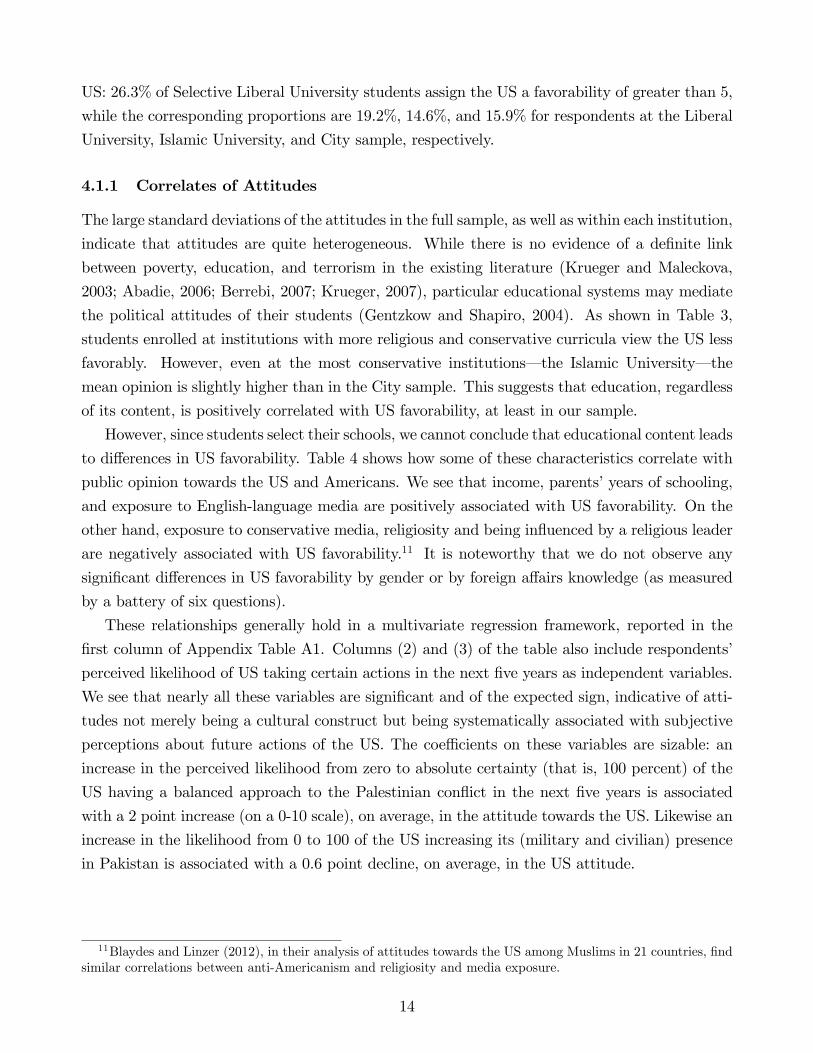
4.1.2 Link with Behavior
Anti-Americanism is cited as a concern because of the belief that it is linked with behavior
that could have adverse consequences for the US. The existing evidence on this (cited in the
introduction) is usually indirect and, at best, suggestive. Our survey included a few questions
that collected data on behavioral outcomes that allows us to investigate the link between attitudes
towards the US and behavior.
The first question elicits respondents’willingness to migrate to the US: "Now consider a
situation where, at the age of 30, you got a job offer that requires you to move to United States.
What is the percent chance (or chances out of 100) that you would move to United States and
take up this job offer if the job pays you X times the amount you expect to earn at age 30
[reported earlier in the survey]?", where X = 2, 5, 10. The average probability in the sample
for migrating to the US when the job pays two times as much is 38 percent, which jumps to
62 percent when the job pays ten times as much. The first three columns of Table 5 regress
the response to this question onto US attitudes and various demographic controls. Notably, the
coeffi cient on baseline US attitude is precisely estimated, positive and economically meaningful:
a one standard deviation increase in attitudes is associated with a 6.4 percentage point increase
in the likelihood of moving to the US when the job offer is twice as much as expected salary.
Students enrolled in the institutions are significantly more likely to report a higher likelihood of
moving to the US, relative to the City sample respondents. Within the institutions, students
enrolled at the more conservative schools assign a higher likelihood of moving to the US, especially
at higher levels of earnings.
The second outcome that we look at is an incentivized question where respondents decide
which charity to donate Rs. 50 (~0.60 USD) to. They are provided with a list of 15 charities,
and also have the option of not donating to any charity in which case no one, including the
respondent, gets Rs. 50. This was an incentivized question that was fielded in the universities
only, and payments were actually made to the charities. The charities range from secular charities
such as the UNICEF to conservative charities. About 5 percent of the sample chooses a secular
charity, and 2 percent chooses a conservative charity, with the remaining choosing local charities
associated with political parties and mainstream religious organizations. The dependent variable
in column 4 (5) of Table 5 is a dummy variable for whether the respondent donates to a secular
(conservative) charity. We see that baseline US attitude is negatively associated with donating
to a conservative charity, and positively related to donating to a secular charity (only the former
is statistically significant).
Overall, this indicates that attitudes towards the US are correlated with intended and actual
behavior.
15
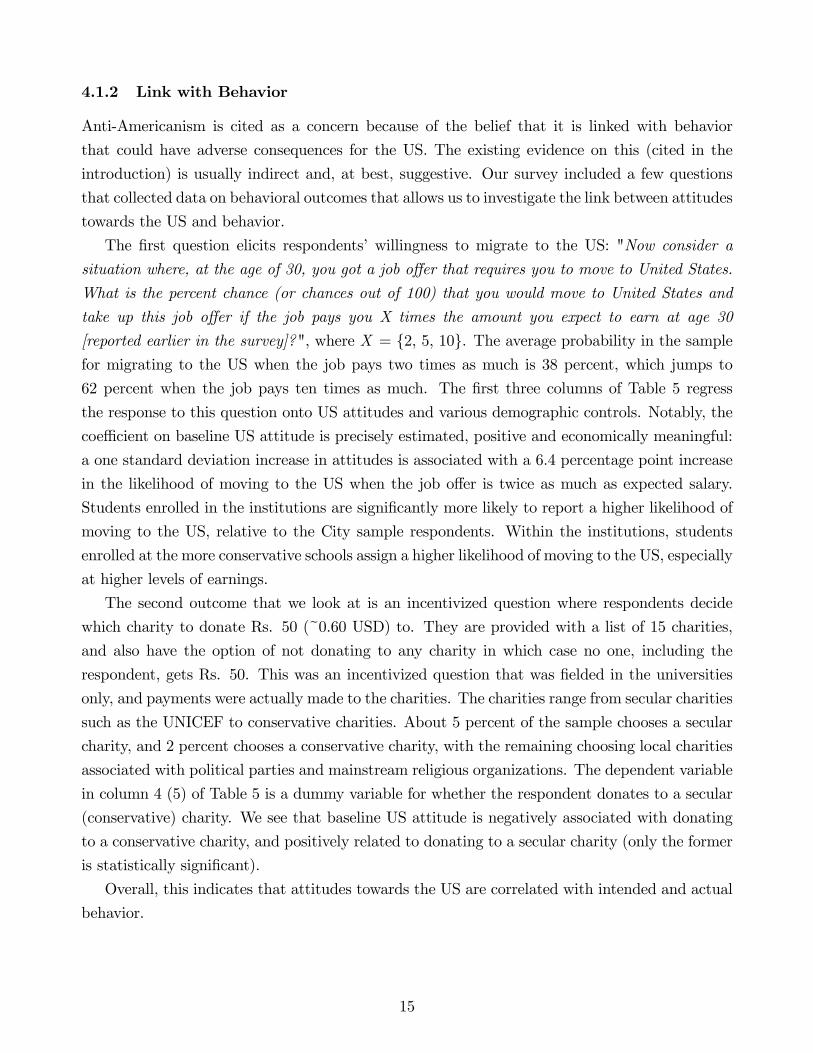
4.2 Treatment Effect
We next test if our information treatments had an effect on attitudes. As we explain in Section 2,
our treatments should lead to systematic revisions in attitudes if respondents find the information
relevant (that is, m ∈ Ωit) and if any of the three cases outlined in that section apply. The
mechanisms that may lead to revision are investigated in the next section. In the analysis that
follows, we drop observations where respondents revise their US attitudes by 9 points or more
(on a 0-10 scale), under the assumption that in such instances respondents either did not answer
the questions seriously, made errors in answering, or did not understand the instructions. This
drops 70 of the 2,386 observations (that is, 2.9% of the observations). Keeping them in the
analysis has little impact on the results.
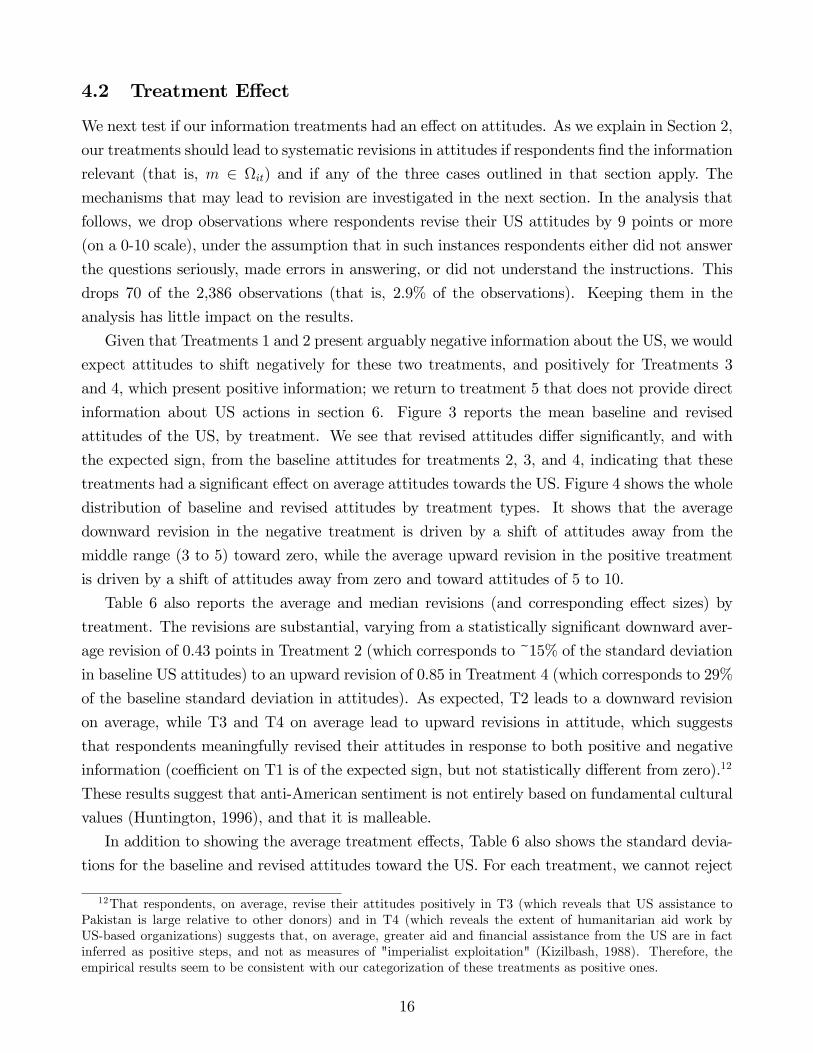
Given that Treatments 1 and 2 present arguably negative information about the US, we would
expect attitudes to shift negatively for these two treatments, and positively for Treatments 3
and 4, which present positive information; we return to treatment 5 that does not provide direct
information about US actions in section 6. Figure 3 reports the mean baseline and revised
attitudes of the US, by treatment. We see that revised attitudes differ significantly, and with
the expected sign, from the baseline attitudes for treatments 2, 3, and 4, indicating that these
treatments had a significant effect on average attitudes towards the US. Figure 4 shows the whole
distribution of baseline and revised attitudes by treatment types. It shows that the average
downward revision in the negative treatment is driven by a shift of attitudes away from the
middle range (3 to 5) toward zero, while the average upward revision in the positive treatment
is driven by a shift of attitudes away from zero and toward attitudes of 5 to 10.
Table 6 also reports the average and median revisions (and corresponding effect sizes) by
treatment. The revisions are substantial, varying from a statistically significant downward aver-
age revision of 0.43 points in Treatment 2 (which corresponds to ~15% of the standard deviation
in baseline US attitudes) to an upward revision of 0.85 in Treatment 4 (which corresponds to 29%
of the baseline standard deviation in attitudes). As expected, T2 leads to a downward revision
on average, while T3 and T4 on average lead to upward revisions in attitude, which suggests
that respondents meaningfully revised their attitudes in response to both positive and negative
information (coeffi cient on T1 is of the expected sign, but not statistically different from zero).12
These results suggest that anti-American sentiment is not entirely based on fundamental cultural
values (Huntington, 1996), and that it is malleable.
In addition to showing the average treatment effects, Table 6 also shows the standard devia-
tions for the baseline and revised attitudes toward the US. For each treatment, we cannot reject
12That respondents, on average, revise their attitudes positively in T3 (which reveals that US assistance toPakistan is large relative to other donors) and in T4 (which reveals the extent of humanitarian aid work byUS-based organizations) suggests that, on average, greater aid and financial assistance from the US are in factinferred as positive steps, and not as measures of "imperialist exploitation" (Kizilbash, 1988). Therefore, theempirical results seem to be consistent with our categorization of these treatments as positive ones.
16
equality of baseline and revised standard deviations, suggesting that attitudes do not converge
upon receipt of information. This could possibly be a result of heterogeneity in the revision
process, which we investigate in the next section.
Revision of attitudes for other countries Our focus has been on attitudes toward the US
but one may wonder if attitudes toward other countries are similarly malleable. Treatment 5 in
the initial study provides negative information about Saudi Arabia and China, two countries that
are considered close allies of Pakistan. Indeed, Table 3 shows that the average attitude is high
for those two countries: 7.9 for Saudi Arabia and 6.9 for China. The first piece of information
of Treatment 5 emphasizes that the amount of funds Saudi Arabia disbursed to Pakistan were
quite low compared to those Pakistan received from the US, while the second piece of information
mentions restrictions imposed on Muslims in China. Table A2 shows a significant decrease, on
average, in attitudes for both China (of 1.8) and Saudi Arabia (of 0.5) for respondents allocated to
Treatment 5. This suggests again that respondents’attitudes are malleable: they are responsive
to negative information about countries which are positively viewed. This information treatment
had a small positive impact on the attitudes toward the US (of 0.16, statistically significant at
12%).
5 Mechanisms and Heterogeneity in Treatment Effect
The previous section shows interesting and sizable average treatment effects. The within-subject
design and the elicitation of information priors allow us to investigate more precisely the hetero-
geneity in the revision process and the drivers of it. In an unbiased revision framework, attitudes’
revision depends on priors about the information: we should see upward revisions for individuals
with negative priors for events that enter with a positive weight in the attitude function (i.e., the
weight α > 0), downward revisions for individuals with positive priors (for events with a positive
weight in the attitude function), and no revisions for people who already knew the information we
provided them. Before looking at the heterogeneity in revision processes, we start by describing
respondents’information priors.
5.1 Information Priors
As explained in Section 3.2, we collected data from respondents about their prior knowledge
of the information, i.e., we asked the respondent if each piece of information that we provided
to them was already known, or whether it was a positive or negative surprise for them. Note
that what is "positive" or "negative" is potentially individual-specific and depends on the sign of
the weight associated with the action in the attitude function. For example, some respondents
may view greater US assistance to Pakistan as a positive action, while others may view that
17
as a negative action. We do not have information to characterize each information treatment
as positive or negative at the individual level, and hence use the average treatment effect to
qualify the actions described in Treatments 1 and 2 as "negative," and the actions described in
Treatments 3 and 4 as "positive". To illustrate this, consider Treatment 1 which consists of the
following two pieces of information: (1) the financial assistance that the US provided to Israel in
2008 was three times as much as the assistance the US provided to Pakistan, and (2) the military
aid that Pakistan had received from the US since 2001 came to half of Pakistan’s costs of war
on terror. A respondent assigned to Treatment 1 is categorized as having a positive prior for the
first piece of information if he reported that he thought Israel had received less than three times
as much assistance from the US than Pakistan. Similarly, he has a positive prior associated with
the second piece of information if he thought that Pakistan’s military aid from US covered more
than half of its costs. Respondents who report that they knew the information are classified as
having neutral prior.
Table 7 presents the distribution of priors for each piece of information in each treatment;
the corresponding questions that were used to elicit priors are presented in the Appendix. We
see that negative priors are much more prevalent than positive priors in this sample, ranging
from 32% to 81% compared to 6% to 32% respectively, i.e., respondents ex-ante are more likely
to have negative beliefs about values of the actions of the US than is warranted by the facts.
These systematically erroneous beliefs about actions of the US are consistent with the local
media practices of slanted news coverage and prominence to selective (negative) actions of the
US (Reetz, 2006; Fair, 2010). Neutral priors range between 14 and 42%.
For the purpose of investigating how updating varies by information prior, we need to aggre-
gate the respondents’prior for each treatment. We define a respondent as having, for a given
treatment, an "Overall Positive Prior" ("Overall Negative Prior") if the respondent had a pos-
itive (negative) prior for at least one piece of information, and a positive (negative) or neutral
prior for the remaining pieces of information. A respondent is categorized as having an "Overall
Neutral Prior" if he had neutral priors for all the pieces of information. Finally, we categorize
respondents as having "Mixed Priors" if they cannot be classified as having overall positive,
overall negative, or neutral priors. For example, this would be the case when the respondent has
a positive prior about one piece of information, and negative priors about the other pieces of
information in the treatment.
The first row in Panel A of Table 8 shows the distribution of information priors in our
sample, pooled across the treatments. About 14% of the respondents have overall positive
priors, 53% have overall negative priors, 9% have neutral priors, and the remaining 24% have
mixed priors. There is, however, substantial heterogeneity in information priors across groups.
Information priors are generally more negative (or less positive) as the institutions become more
conservative. For example, about 45% of Selective Liberal University students have negative
18
priors, compared to 59% of Islamic University students. It is interesting to note that students in
the more conservative institutions are more likely to have negatively-biased beliefs about actions
of the US than a random sample of the cities’populations. One possible explanation for these
cross-group patterns is the differential exposure of these groups to different news sources (as
shown in Table 1). The low p-values of the F-tests for the equality of proportions across the
groups indicate that the differences in the distribution of priors across the groups is statistically
significant. The last three rows in Panel A of Table 8 show that the distribution of overall
negative, positive or neutral priors is generally similar across positive and negative treatments.
Appendix Table A3 shows the correlates of having a positive prior. The only covariate
that is significant is parent’s income (which has a positive relationship with having a positive
prior). Conditional on demographic controls, there are no differences across institutions in the
likelihood of having a positive prior. Importantly, the low R-squared of the regression indicates
that covariates explain a very small amount of the variation in priors across respondents.
5.2 Heterogeneity in the Revision Process
Panel B of Table 8 shows the baseline and revised attitude toward the US, as well as the revision
by information prior. If belief updating is unbiased, we would observe downward revisions of
attitude for those with overall positive priors, upward revisions for those with overall negative
priors, and no revision for those with neutral priors. The last row shows a downward average
revision for those with overall positive priors (though it is not statistically significantly different
from zero), upward average revision for those with overall negative priors (statistically signifi-
cantly different from zero at 1%), and upward average revision for those with neutral priors (of
similar magnitude as those for negative prior, and statistically significant at 10%). This shows
that the revision process is not fully unbiased. Another point to note is that the median revision
for all prior types is zero: indeed, 51% of the respondents do not revise their attitude following
the information treatment.
We look further at the substantial heterogeneity in revision processes in Table 9 in which we
present the proportion of respondents who did not revise, revised upward or downward by prior
type. The last column shows respondents who did not revise and were possibly "constrained" in
their revision process by having answered 0 or 10 for their baseline attitude, and so may have
been unable to revise upward or downward (30.6%). The heterogeneity is quite striking. Among
those with overall positive priors, downward revision and upward revision are similarly prevalent.
Among those with overall negative priors, upward revision (14%) is slightly more prevalent than
downward revision (12%). Among those with neutral priors, non-revision is not more prevalent.
Again, this shows that unbiased belief updating cannot be the only source of revision.13 Table 9
13Note that this is also consistent with heterogeneity in the weight attributed to various actions in the attitudefunction. Remember that we assume here that the weight is homogenous and is of the same sign as described by
19
also shows that some respondents have non-malleable attitudes. A lower bound for the proportion
of those with non-malleable attitudes is given by the proportion of those who had negative or
positive priors and did not revise their attitude: 13.4%. The upper-bound is given by the overall
proportion of respondents who did not revise (i.e., 51%).
The next two rows of Table 9 show the distribution for positive and negative treatments. For
all prior types, upward revisions are more common under a positive treatment while downward
revision is more common under a negative treatment. This is consistent with saliency bias
and some respondents being responsive to the inherent nature of the information they receive,
irrespective of their prior.
Propensity to revise attitudes We now turn to regression analysis to describe the propensity
to revise one’s attitude given the fact that only about half of the respondents do so. Table 10
presents marginal effects from two probit specifications, which use a dummy for having revised
the attitude as the dependent variable. Column 1 uses the entire sample, while the second column
restricts the sample to those respondents whose baseline attitude was not 0 and 10, and so were
unconstrained for sure (that is, had the margin to revise). This is our preferred sample, out of
whom 65% revise their attitude. The estimates in the second column indicate that those with
positive, negative, or mixed priors are all more likely to revise their attitude compared to those
with neutral priors, and the magnitude is similar across prior type (10-11 percentage points).
The coeffi cient associated with a positive treatment dummy is not statistically different from
zero, suggesting that those exposed to a positive treatment are as likely to revise their attitude
as those exposed to a negative treatment. Students from the Selective Liberal University and
respondents proficient in English are also more likely to revise than their counterparts.
5.3 Mechanisms
We next investigate the mechanisms underlying the revision process. The last two columns of
Table 10 present a tobit specification where the dependent variable is the change in attitude
(revised attitude minus baseline attitude). We use a censored model because the revision is
constrained to be between -10 and 10. The specification does not include a constant, so the
estimates in column 3 simply show the mean revision conditional on each prior and treatment
type. We see that respondents with positive priors revise their attitudes, on average, downward
by a significant 0.41 points. This is consistent with unbiased belief updating. The fact that the
coeffi cient associated with having a neutral prior is not statistically different from zero is also
consistent with unbiased belief updating, as those respondents should not revise their beliefs.
However, the coeffi cient associated with having a negative prior is not different from zero, when
in fact we would have expected a positive estimate if updating were unbiased.
the average treatment effect.
20
Column 3 also shows evidence of saliency bias, as those exposed to a positive treatment
on average revise their attitude upward compared to those exposed to a negative treatment
(even after conditioning on priors). The magnitude of the coeffi cient associated with a positive
treatment is relatively large (0.82), more than twice the absolute coeffi cient associated with
having a positive prior. The last column of Table 10 adds demographic controls. This decreases
the precision of the coeffi cient associated with having positive prior; this is expected since priors
are correlated with observables.
To summarize, the data suggest a plethora of mechanisms underlying the observed revision
process. At least 13% of the respondents appear to have non-malleable attitudes as they do
not respond to ex-ante unknown information. Saliency bias leads to sizable average revision in
attitudes. We find evidence of unbiased belief updating, but only for those with positive priors.
In analysis not reported here, we also investigate whether certain observable characteristics have
any predictive power in the revision process: we find no evidence of observable characteristics
capturing any meaningful heterogeneity in the revision process.14
6 Robustness Checks
To test the robustness of specific features of the study design used in the first survey, we conducted
a follow-up study in April 2013 at the Liberal University. This section presents analysis from this
follow-up survey. Specifically, we analyze whether: (1) our method of eliciting information priors
after the provision of information yields biased responses; (2) the experimenter demand effect
is driving updating in the within-subject design; (3) credibility of information and tendency to
revise attitudes are related, and (4) the impact of information is persistent.
The follow-up study was conducted in 21 classes randomly provided by the registrar’s offi ce.
Classes were randomly assigned to one of three groups:
• Control group: students were first asked about their attitudes towards various countriesincluding the US, those countries’people, and various Pakistani institutions. Demographic
information and information priors about two specific pieces of information were then
collected from respondents. These students constitute the "control" (C) group as they do
not receive any information treatment.
• Within-subject Treatment group: students were first asked about their "baseline" attitudes,followed by basic demographic information. They were then provided with two pieces
of information about past actions of the US regarding drone attacks in Pakistan; the
14Specifically, to the specifications reported in column (3) of Table 10, we added interactions of the covariates:positive prior, negative prior, neutral prior and positive information treatment, with each the following variablesone at a time: female, institution dummy, city sample dummy, income (below sample median), parental education,and foreign affair knowledge. However, no systematic patterns emerge.
21
information was inherently of a nature that cast the US in a negative light to Pakistanis.15
Attitudes towards the US and the other entities were re-elicited, followed by elicitation of
respondents’priors about the two pieces of information. Up to this point, this design closely
follows the study design in the main study. We concluded by asking respondents about the
credibility of each piece of information on a 0-10 scale (with 10 being fully credible). We
refer to this group as the "within-subject treatment" (WT) group.
• Treatment group: basic demographic information was collected from students first. They
were then provided with the same pieces of information as for the WT group. This was
then followed by elicitation of respondents’attitudes towards the US and other entities,
their information priors, and perceived credibility of the information. The "treatment" (T)
group design is very similar to that of the WT group, except that baseline attitudes are
never elicited from the respondents.
The assignment of students to the groups (C; WT; T) was randomized at the classroom level.
We were also interested in the medium-term impacts of information, and re-surveyed classes
about a month after the first survey. This second survey simply elicited students’ attitudes
towards the US and other entities.
Appendix Table A4 shows that the characteristics of students across the three groups are
generally balanced. Two exceptions are gender and age, which seem to differ across these groups.
This is primarily a consequence of the randomization being done at the classroom level, and hence
the gender or age composition being impacted by either the area of study or level of advancement
of the course. Note that we did not find that those characteristics influenced the revision process.
While the Control and Treatment groups have similar sizes, we assigned a larger sample to the
Within-subject group since most of the robustness checks pertain specifically to within-subject
updating.
6.1 Priors’elicitation
In the main study design, information priors were elicited after respondents had seen the objective
information. One concern could be that this may yield biased information priors. Using the
follow-up study, a comparison of the distribution of information priors of the C group (which
was not provided with information) with the combined treatment groups (T and WT combined)
would allow us to investigate if our prior elicitation method is robust.
15Specifically that: (1) The number of US drone attacks in Pakistan in 2011 was about 2 times (double) thenumber of US drone attacks in Pakistan in 2008 (Source: New America Foundation). (2) During June 2004-September 2012, as many as 34% of the casualties from U.S. drone attacks in Pakistan were civilians (Source:The Bureau of Investigative Journalism, London; Dawn, 2 July, 2012).
22
Table 11 shows the distribution of information priors for the control and pooled treatment
groups. Students were asked two questions.16 We see that the distribution of priors for both
questions is remarkably similar for the two groups. For example, it is not the case that more
students in the treatment group report ex-ante knowing the information (that is, having neutral
priors). We take this as evidence of our method of prior elicitation being robust.
6.2 Credibility of information
One potential explanation for the fact that half of the respondents do not respond to the in-
formation treatment in our main results is that they simply do not trust the information we
provided. Our initial study did not collect information regarding students’perceived credibility
of the revealed information. In the follow-up study, we investigate this possibility by asking
respondents how believable the information is. The question was worded as follows: "We would
now like to ask you how believable you find each of the following pieces of information, on a
scale of 0 to 10, where 0 means “I do not believe this information at all”, and 10 means “I fully
believe this information"." Table 12 shows high credibility rating for both pieces of information,
with a median of 7 and a mean of 6.8-6.9. Moreover, the distribution of credibility rating is
similar for respondents who revise and those who do not revise their attitudes, and notably also
across the distribution of prior types. This suggests that non-revision in attitudes cannot be
solely the result of respondents not finding the information credible, but rather a result of such
respondents’attitudes being non-malleable.
6.3 Within-subject versus between-subject design
One potential concern is that the revision of attitude in our within-subject design is driven by
an experimenter-demand effect. There is little reason to believe that this would be a factor since
the surveys are anonymous and paper-based. The fact that half of the respondents do not revise
their attitude also suggests that this cannot be a dominant factor. However, we obviously cannot
rule this factor out.
The follow-up study allows us to investigate this. A between-subject treatment effect can be
obtained from a comparison of the attitudes of the T and C groups. We can then compare it
with the within-subject treatment effect (from the WT group) to investigate if the experimenter
16The two questions were asked as follows:1. What was your best guess of how the number of US drone attacks in Pakistan during 2011 compared to the
number of US drone attacks in Pakistan during 2008? (mark one)less than 2 times the number of US drone attacks during 2008; about 2 times. . . ; more than 2 times. . . ; I did
not think the US had conducted any drone attacks in Pakistan since 2008.2. Before we gave you this information, what was your best guess of the proportion of casualties from U.S.
drone attacks in Pakistan that were civilians during 2004-2012? (mark one)less than 34%; about 34%; more than 34%; I did not think that there had been any civilian casualties from
U.S. drone attacks in Pakistan during 2004-2012.
23
demand effect is an issue in our context. Given the negative nature of the information, we expect
the average effects to be negative.
Table 13 presents the mean attitudes for the various groups. In the between-subject design,
the information treatment significantly reduces the attitude toward the US: the difference in
the mean attitude between the control and treatment group is -1.5. Similarly, in the within-
subject design, the information treatment reduces the average attitude toward the US, but by 0.6
points only. The difference in average revisions across the two designs is statistically significantly
different from each other (p-value = 0.014), suggesting that the design does matter. But the
revision in the within-subject design is smaller in magnitude than the revision in the between-
subject design, suggesting that anchoring toward baseline attitudes in the within-subject design
(and not an experimenter demand effect, which would have led to larger revisions in the within-
subject design) is a dominant factor. This suggests that our main results do not over-estimate
how responsive attitudes are to information. Rather, they represent a lower-bound and we may
expect greater revision of attitudes outside of the experimental set-up. Note that we favor the
within-subject design since analyzing individual-level revisions is the only way to gain insight
into the mechanisms underlying the revision process.
6.4 Medium-term effect of information treatment
We find sizable impacts of the intervention in our main study design as well as in the first survey
of the follow-up study. A natural question is whether these impacts persist beyond the horizon of
the survey. The follow-up study consisted of two surveys, with the second survey being conducted
about a month after the first. No identifying information was collected from students, and so
we cannot link the surveys at the individual level. Instead, since assignment to the groups was
randomized at the classroom level, we investigate the persistence of information at the classroom
level by comparing medium-term attitudes of classes in the T and WT groups with those in the
C group. We were unable to conduct the follow-up survey in one of the treatment classrooms
since the course had been completed by mid-semester.
The first row in Table 14 shows the average (baseline) attitude for the control group from
the first survey, and the average attitude in the second survey. We see that mean attitudes for
the control group declined by 1.45 points over the course of a month. The second row shows the
revised attitude for the pooled treatment group in the first survey. We see the average of 3.6 is
substantially lower than the average baseline attitude of 4.3 for the control group. Notably, we
see that the mean attitude for the treatment group in the second survey of 2.83 is remarkably
similar to that of the control group. This sharp drop for both the control and treatment groups
may initially seem surprising. However, the second survey was conducted in April 2013, less than
three weeks prior to the national elections in Pakistan, close to which the anti-America rhetoric
espoused by the mainstream parties increased substantially. We believe this is the factor behind
24
the drop in attitudes between the two surveys. Our intervention seems to have been much softer
than the changes in the political environment between the surveys. We are unable to conclude
if the effects of the intervention would have persisted had the environment otherwise remained
the same between the two surveys.
7 Conclusion
Using an innovative information experiment embedded in a survey, this paper presents direct
evidence on the effects of new information on Pakistani youths’attitudes towards the US. We
find that respondents are responsive to the information and, on average, revise their attitudes
sensibly—attitudes about the US are revised upward (downward) when provided with positive
(negative) information about the US. Data collected on respondents’priors about the provided
information allow us to shed light on the mechanisms that lead to revisions. The distribution
of information priors in our sample is skewed, with respondents being much more likely to have
negative priors about actions of the US than having positive priors- a finding that is perhaps
not surprising given the context. We find evidence that attitudes are revised as a result of
both salience-based updating and information-based updating. The information-based updating
is found to be unbiased, at least for individuals with positive priors. Moreover, a substantial
proportion of respondents —at least 13% —have non-malleable attitudes. We do not find evidence
of attitudes converging upon receipt of information, underscoring the heterogenous underlying
mechanisms at play.
What are the implications of our findings? First, our results indicate that public opinions are
not purely a cultural phenomenon, and are in part shaped by understanding of recent events.
Second, attitudes are on average malleable in the face of new information. Third, the average
downward revisions of respondents with positive priors indicates that the tendency of individuals
to discount new information that is inconsistent with their priors can be overcome for some.
Fourth, the strong saliency effect suggests that news about the US may impact attitudes even
when it contains no information content. In a setting with an anti-US media slant, that can be
worrisome.
A limitation of our study is that our results are derived from a controlled environment.
Attitude revision when presented with new information in a survey/experiment may be very
different from instances where individuals acquire the information themselves (Hertwig et al.,
2004), and where new information may not be as salient as it is in our setup. In addition,
given that our sampling strategy focuses on primarily educated individuals, it is unclear how our
results would extend to less-educated populations. However, since these individuals are more
likely to rise to positions of policy decision-making and to dictate future policy, understanding
the determinants of their attitudes is of particular relevance. Our study is also silent about the
25
best way to disseminate objective facts about the US to the Pakistani public and the Muslim
world more generally. Since domestic elites and media may have incentives to advance anti-
American attitudes in settings with high competition (Gentzkow and Shapiro, 2010; Blaydes
and Linzer, 2012), an important question then is how to make a counter-narrative —based on
objective facts—available to respondents, especially when they do find such information useful.
The controlled nature of our experiment also means that we ignore general equilibrium effects:
increased dissemination of information by the US may also lead domestic media to respond in
ways that may counteract such campaigns.
Despite these limitations, our results demonstrate that dissemination of accurate information
about various aspects of the Pakistan-US relationship by directly reaching out to the Pakistani
public should be encouraged. There has been, in particular, a recent emphasis on improving
communication efforts to discredit extremist propaganda in the media and to alter misperceptions
regarding US policy (McHale, 2010).17 Our results suggest that this is a feasible and promising
strategy. In addition, the encouraging effects of our information experiment, in a setting where
US favorability is low compared to many other Muslim countries and where the media has a
particularly strong anti-West slant, make a case for similar information campaigns in the Muslim
World. At the same time, our finding that respondents studying in more conservative institutions
—groups which also have less favorable baseline attitudes towards the US —are less likely to
respond to any information presents a challenge for effective design of such communication and
information campaigns, and suggests that such campaigns would need a more sophisticated and
multi-pronged design if they were to affect more of the population.
Finally, the medium-term effects of new information on respondents’attitudes remain un-
clear. While we conducted a medium-term survey in the follow-up study, the results remain
inconclusive and warrant further research. A challenge with providing information to respon-
dents and then re-surveying them after a few weeks is that the experimental information may
be diluted by changes in the respondents’environment, as seems to have been the case in our
follow-up study. An alternative to the approach used here is to instead generate an experimental
panel by re-surveying respondents over regular intervals separated by, say, a few weeks. Changes
in the geopolitical landscape in the Pakistan-US relationship would allow us to observe how
attitudes change. Challenges with such an approach include understanding how individuals self-
select their exposure to information, and measuring precisely the type of information individuals
were exposed to and their priors about the information. Note also that these alternatives require
longitudinal data, which to our knowledge remain unavailable. Until then, our study provides
17While historically most US aid to Pakistan has been military, there has been a recent paradigm shiftto more humanitarian aid intended to help ordinary Pakistanis and to improve America’s image: The En-hanced Partnership with Pakistan Act of 2009 authorizes $7.5 billion in assistance to Pakistan over the next5 years for these purposes. It specifically states: “The United States should have a coordinated, strategiccommunications strategy to engage the people of Pakistan. . . ”. The full text of the legislation is available at:http://www.gpo.gov/fdsys/pkg/BILLS-111s1707enr/pdf/BILLS-111s1707enr.pdf (accessed on April 17, 2012).
26
unique evidence to policy-makers, the research community and the general public on how atti-
tudes toward the US can be shaped with the provision of objective facts about the Pakistan-US
relationship.
References
[1] Abadie, Alberto. 2006. “Poverty, Political Freedom, and the Roots of Terrorism." American
Economic Review (Papers and Proceedings), 96(2): 50-56.
[2] Ajami, Fouad. 2001. What the MuslimWorld Is Watching. New York Times Mag., November
18.
[3] Ansolabehere, Stephen, and Shanto Iyengar. 1995. Going Negative. New York: The Free
Press.
[4] Bassi Vittorio and Imran Rasul. 2015. “Persuasion: A Case Study of Papal Influences on
Fertility Preferences and Behavior." UCL Working paper.
[5] Beath, Andrew and Christia, Fotini and Enikolopov, Ruben. 2012. “Winning Hearts and
Minds through Development: Evidence from a Field Experiment in Afghanistan." MIT
Political Science Department Research Paper No. 2011-14.
[6] Becker G, Murphy K, 1993. "A simple theory of advertising as a good or bad." Quarterly
Journal of Economics, 108(4): 941-964.
[7] Berman, Russell. 2006. “Anti-Americanism and the Pursuit of Politics." Working Paper,
Princeton Project on National Security.
[8] Berrebi, Claude. 2007. “Evidence about the Link between Education, Poverty and Terrorism
among Palestinians." Peace Economics, Peace Science and Public Policy, 13(1): 1-36.
[9] Blaydes, Lisa, and Drew Linzer. 2012. Competition, Religiosity, and Anti-Americanism in
the Islamic World." American Political Science Review, 106(2): 225-243.
[10] Bursztyn Leonardo, Michael Callen, Bruno Ferman, Syed Ali Hasanain, Noam Yuchtman.
2014. “A Revealed Preference Approach to the Elicitation of Political Attitudes: Experi-
mental Evidence on Anti-Americanism in Pakistan." NBER Working Paper No. 20153
[11] Cantoni, Davide, Yuyu Chen, David Y. Yang, Noam Yuchtman, Y. Jane Zhang. 2014.
“Curriculum and Ideology." NBER Working Paper No. 20112.
[12] Charney, Craig, and Nicole Yakatan. 2005. “A New Beginning: Strategies For a More Fruitful
Dialogue With the Muslim World," Council on Foreign Relations.
27
[13] Clots-Figueras, Irma and Paolo Masella. 2013 “Education, Language and Identity," Eco-
nomic Journal, 123 (570), F332—F357.
[14] Cole, Juan. 2006. “Anti-Americanism: It’s the Policies". The American Historical Review,
111(4): 1120-1129.
[15] Delavande, A., and B. Zafar. 2014. “University Choice: The Role of Expected Earnings,
Non-pecuniary Outcomes, and Financial Constraints." Mimeo.
[16] Delavande, A., and B. Zafar. Forthcoming. “Stereotypes and Madrassas: Experimental Ev-
idence from Pakistan." Journal of Economic Behavior and Organization, forthcoming.
[17] Dellavigna, Stefano. 2009. “Psychology and Economics: Evidence from the Field.”Journal
of Economic Literature, 47: 315-372.
[18] DellaVigna Stefano, Matthew Gentzkow. 2010. “Persuasion: Empirical Evidence.”Annual
Review of Economics 2, 643-669
[19] DellaVigna, Stefano, and Ethan Kaplan. 2007. “The Fox News Effect: Media Bias and
Voting.”Quarterly Journal of Economics, 122(3): 1187—1234.
[20] DeMarzo, Peter, Dimitri Vayanos and Jeffrey Zwiebel. 2003. “Persuasion Bias, Social Influ-
ence, and Unidimensional Opinions”Quarterly Journal of Economics, 118(3): 909-968.
[21] Druckman, James, and Arthur Lupia. 2000. “Preference Formation". Annual Review of
Political Science, 3:1-24.
[22] El-Gamal, Mahmoud, and David Grether. 1995. “Are People Bayesian? Uncovering Behav-
ioral Strategies.”Journal of the American Statistical Association, 90(432): 1137-1145.
[23] Esposito, John. 2007. “It’s the Policy, Stupid: Political Islam and US Foreign Policy".
Harvard International Review.
[24] Fair, Christine. 2010. “Drones Over Pakistan —Menace or Best Viable Option?" Huffi ngton
Post, August 2.
[25] Fisman, Raymond, Shachar Kariv, and Daniel Markovits. 2009. “Exposure to Ideology and
Distributional Preferences,”Unpublished, Columbia University.
[26] GallupWorld Poll, described at http://www.gallup.com/consulting/worldpoll/24046/About.aspx.
[27] Gentzkow, Matthew and Jesse Shapiro. 2004. “Media, Education and Anti-Americanism in
the Muslim World". Journal of Economic Perspectives, 18(3): 117-133.
28
[28] Gentzkow, Matthew, and Jesse Shapiro. 2006. “Media Bias and Reputation". Journal of
Political Economy, 114(2): 280-316.
[29] Gentzkow, Matthew, and Jesse Shapiro. 2010. “What Drives Media Slant? Evidence from
U.S. Daily Newspapers." Econometrica, 78(1): 35-71.
[30] Gerber Alan, Dean Karlan, and Daniel Bergan. 2009. “Does the Media Matter? A Field
Experiment Measuring the Effect of Newspapers on Voting Behavior and Political Opinions."
American Economic Journal: Applied Economics, 1(2): 35—52
[31] Glaeser, Edward. 2004. “Psychology and the Market". American Economic Review, Papers
and Proceedings, 94(2): 408-413.
[32] Glaeser, Edward. 2005. “The Political Economy of Hatred". The Quarterly Journal of Eco-
nomics, 120(1): 45-86.
[33] Hertwig, Ralph, Greg Barron, Elke Weber, and Ido Erev. 2004. “Decisions from Experience
and the Weighting of Rare Events." Psychological Science, 15 (8): 534-539.
[34] Hoffman, E., K. McCabe, and V. Smith, 1994. “Preferences, Property Rights, and
Anonymity in Bargaining Games". Games and Economic Behavior, 7(3): 346-380.
[35] Huntington, Samuel. 1996. The Clash of Civilizations and the Remaking of World Order.
New York: Simon and Schuster.
[36] Keohane, Robert and Peter Katzenstein. 2007. The Political Consequences of Anti-
Americanism. In Anti-Americanisms in World Politics, ed. Peter Katzenstein and Robert
Keohane. Ithaca: Cornell University Press: 273-305.
[37] Kizilbash, Hamid. 1988. “Anti-Americanism in Pakistan". Annals of the American Academy
of Political and Social Science, 497(1): 58-67.
[38] Kohut, Andrew and Bruce Stokes. 2006. “The Problem of American Exceptionalist.”Pew
Research Center.
[39] Krueger, Alan, and Jitka Maleckova. 2003. “Education, Poverty, and Terrorism: Is there a
Causal Connection?" Journal of Economic Perspectives, 17(4): 119-144.
[40] Krueger, Alan. 2007. What Makes a Terrorist. Princeton: Princeton University Press.
[41] Krueger, Alan and Jitka Maleckova. 2009. “Attitudes and Action: Public Opinion and the
Occurrence of International Terrorism." Science, 325: 1534-1536.
29
[42] Lindberg, Todd, and Suzanne Nossel. 2007. Report of the Working Group on Anti-
Americanism. The Princeton Project on National security.
[43] Lord, C., L. Ross, and M. Lepper. 1979. “Biased Assimilation and Attitude Polarization:
The Effects of Prior Theories on Subsequently Considered Evidence. ”Journal of Personality
and Social Psychology, 37 (11): 2098-2109.
[44] Marlowe, David, and Douglas P Crowne. 1964. The Approval Motive; Studies in Evaluative
Dependence. New York: Wiley.
[45] McHale, J. A. 2010. Future of US Public Diplomacy. SFRC Subcommittee on International
Operations and Organizations, Human Rights, Democracy, and Global Women’s Issues.
Washington, DC.
[46] Mullainathan, Sendhil. 2002. “A memory-based model of bounded rationality." Quarterly
Journal of Economics, 117(3):735-774.
[47] Mullainathan, Sendhil, and Andrei Shleifer. 2005. “The Market for News." American Eco-
nomic Review, 95(4): 1031—1053.
[48] Mullainathan, Sendhil and Ebonya Washington. 2009. “Sticking with your Vote: Cognitive
Dissonance and Political Attitudes." American Economic Journal: Applied Economics, 1(1):
86-111 .
[49] Pew Global Attitudes Project, described at http://pewglobal.org/.
[50] Pew Global Attitudes Project. 2011. “Arab Spring Fails to Improve US Image." Available
at http://pewglobal.org/files/2011/05/Pew-Global-Attitudes-Arab-Spring-FINAL-May-17-
2011.pdf/.
[51] Rabin Matthew and Joel Schrag. 1999. “First Impressions Matter: A model of Confirmatory
Bias" Quarterly Journal of Economics 114:37—82.
[52] Reetz, Dietrich. 2006. Pakistan. In Anti-Americanism in the Islamic World, ed. Sigrid Faath.
London: Hurst and Company, 182-196.
[53] Robichaud, Carl, and Rachel Goldbrenner. 2006. “Anti-Americanism and Violence." Work-
ing Paper, Princeton Project on National Security.
[54] Schwarz, N, and L. Vaughn. 2002. “The Availability Heuristic Revisited: Ease of Recall
and Content of Recall as Distinct Sources of Information", in Heuristics and Biases: The
Psychology of Intuitive Judgment, ed. T. Gilovich, D. Griffi n and D. Kahneman, 103-119.
New York: Cambridge University Press.
30
[55] Shapiro, JM. 2006. “A ’memory-jamming’ theory of advertising." University of Chicago
working paper.
[56] Tversky, A. and Kahneman, D. 1973. “Availability: a heuristic for judging frequency and
probability." Cognitive Psychology, 5 (2): 207—232.
[57] Tversky, A. and Kahneman, D. 1974. “Judgment under uncertainty: Heuristics and biases."
Science, 185: 1124-1131.
[58] US Census Bureau, International Data Base. 2011. Accessed at
http://www.census.gov/population/international/data/idb/informationGateway.php.
[59] Zirkhov, Kirill. 2014. “Development, Culture and Attitudes to America: Country-level Pre-
dictors of Anti-Americanism." Higher School of Economics Research Paper No. WP BRP
35/SOC/2014
[60] Zizzo, Daniel. 2010. “Experimenter demand effects in economic experiments." Experimental
Economics, 13(1): 75-98
31
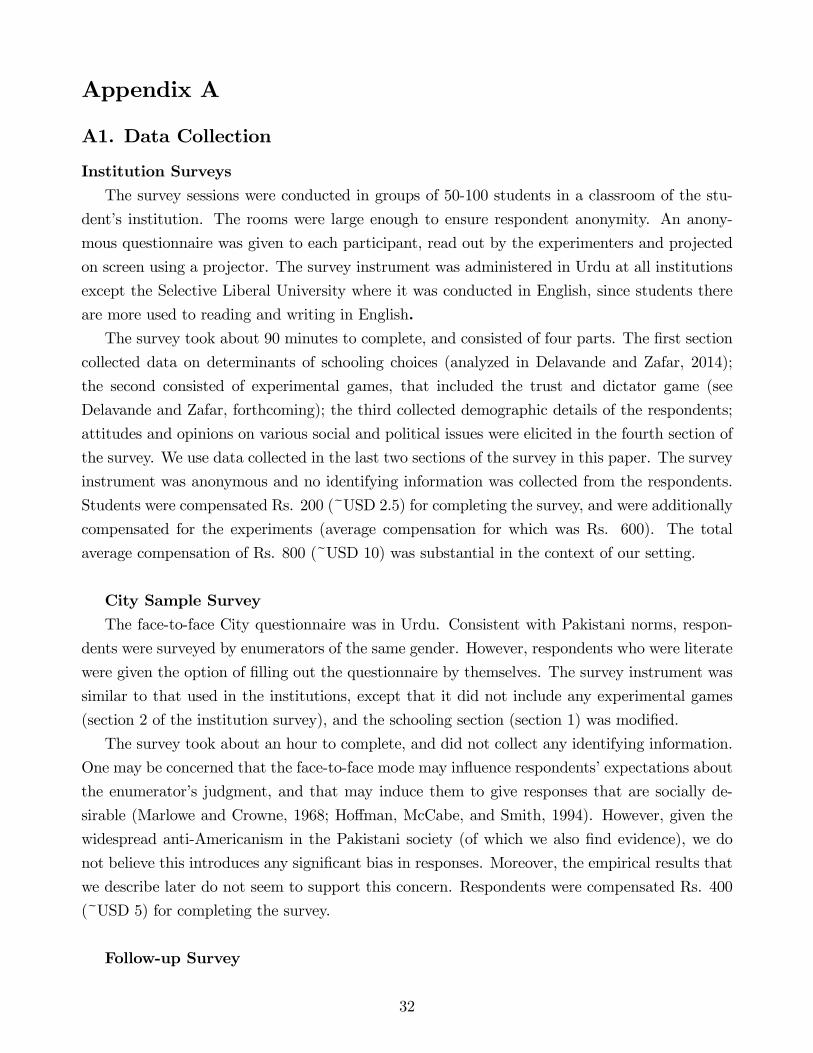
Appendix A
A1. Data Collection
Institution SurveysThe survey sessions were conducted in groups of 50-100 students in a classroom of the stu-
dent’s institution. The rooms were large enough to ensure respondent anonymity. An anony-
mous questionnaire was given to each participant, read out by the experimenters and projected
on screen using a projector. The survey instrument was administered in Urdu at all institutions
except the Selective Liberal University where it was conducted in English, since students there
are more used to reading and writing in English.The survey took about 90 minutes to complete, and consisted of four parts. The first section
collected data on determinants of schooling choices (analyzed in Delavande and Zafar, 2014);
the second consisted of experimental games, that included the trust and dictator game (see
Delavande and Zafar, forthcoming); the third collected demographic details of the respondents;
attitudes and opinions on various social and political issues were elicited in the fourth section of
the survey. We use data collected in the last two sections of the survey in this paper. The survey
instrument was anonymous and no identifying information was collected from the respondents.
Students were compensated Rs. 200 (~USD 2.5) for completing the survey, and were additionally
compensated for the experiments (average compensation for which was Rs. 600). The total
average compensation of Rs. 800 (~USD 10) was substantial in the context of our setting.
City Sample SurveyThe face-to-face City questionnaire was in Urdu. Consistent with Pakistani norms, respon-
dents were surveyed by enumerators of the same gender. However, respondents who were literate
were given the option of filling out the questionnaire by themselves. The survey instrument was
similar to that used in the institutions, except that it did not include any experimental games
(section 2 of the institution survey), and the schooling section (section 1) was modified.
The survey took about an hour to complete, and did not collect any identifying information.
One may be concerned that the face-to-face mode may influence respondents’expectations about
the enumerator’s judgment, and that may induce them to give responses that are socially de-
sirable (Marlowe and Crowne, 1968; Hoffman, McCabe, and Smith, 1994). However, given the
widespread anti-Americanism in the Pakistani society (of which we also find evidence), we do
not believe this introduces any significant bias in responses. Moreover, the empirical results that
we describe later do not seem to support this concern. Respondents were compensated Rs. 400
(~USD 5) for completing the survey.
Follow-up Survey
32
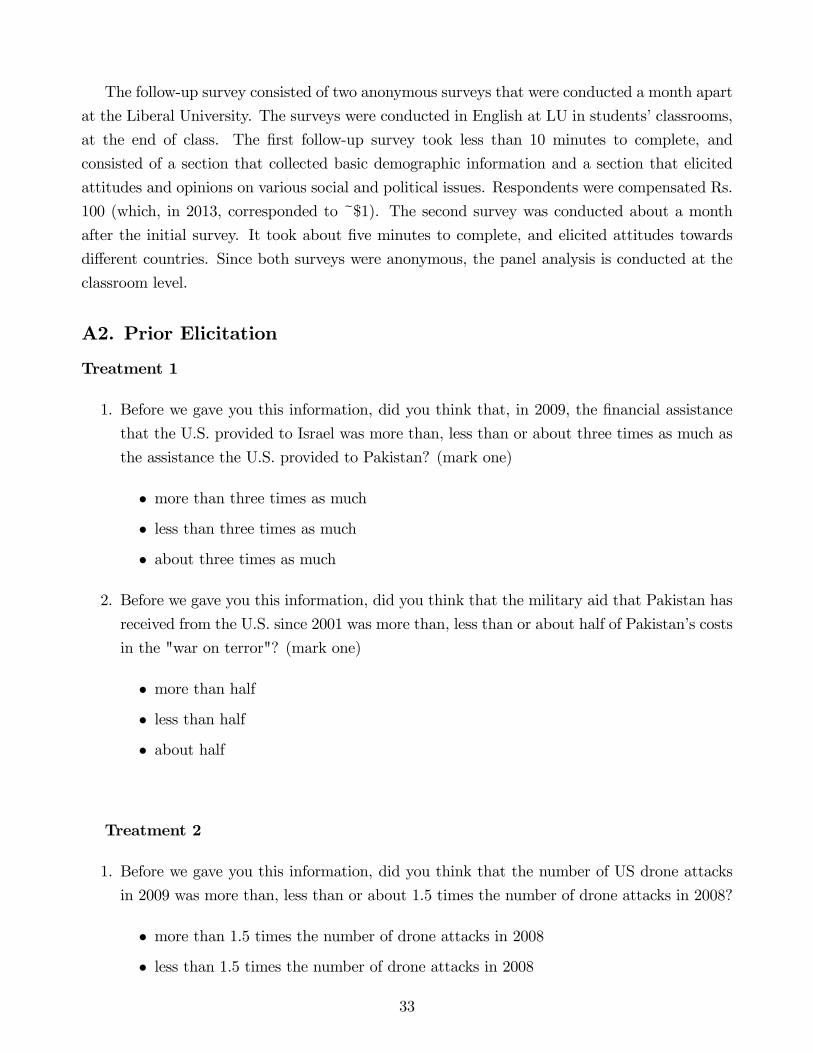
The follow-up survey consisted of two anonymous surveys that were conducted a month apart
at the Liberal University. The surveys were conducted in English at LU in students’classrooms,
at the end of class. The first follow-up survey took less than 10 minutes to complete, and
consisted of a section that collected basic demographic information and a section that elicited
attitudes and opinions on various social and political issues. Respondents were compensated Rs.
100 (which, in 2013, corresponded to ~$1). The second survey was conducted about a month
after the initial survey. It took about five minutes to complete, and elicited attitudes towards
different countries. Since both surveys were anonymous, the panel analysis is conducted at the
classroom level.
A2. Prior Elicitation
Treatment 1
1. Before we gave you this information, did you think that, in 2009, the financial assistance
that the U.S. provided to Israel was more than, less than or about three times as much as
the assistance the U.S. provided to Pakistan? (mark one)
• more than three times as much
• less than three times as much
• about three times as much
2. Before we gave you this information, did you think that the military aid that Pakistan has
received from the U.S. since 2001 was more than, less than or about half of Pakistan’s costs
in the "war on terror"? (mark one)
• more than half
• less than half
• about half
Treatment 2
1. Before we gave you this information, did you think that the number of US drone attacks
in 2009 was more than, less than or about 1.5 times the number of drone attacks in 2008?
• more than 1.5 times the number of drone attacks in 2008
• less than 1.5 times the number of drone attacks in 2008
33
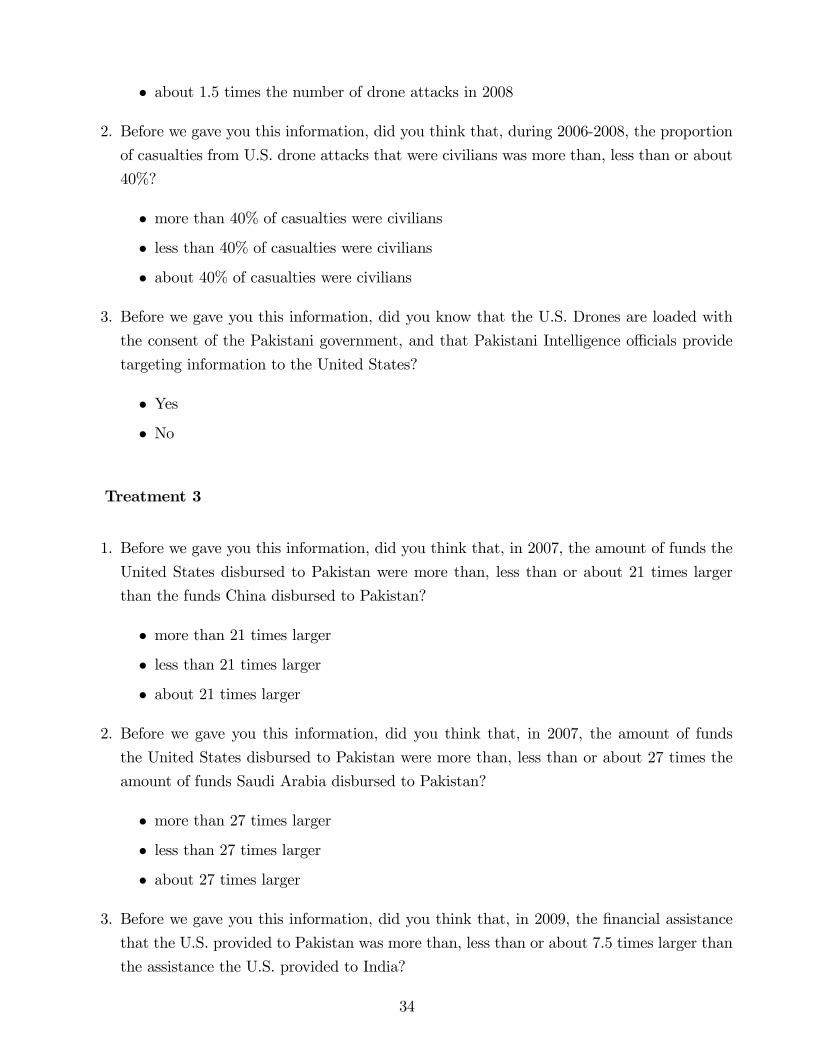
• about 1.5 times the number of drone attacks in 2008
2. Before we gave you this information, did you think that, during 2006-2008, the proportion
of casualties from U.S. drone attacks that were civilians was more than, less than or about
40%?
• more than 40% of casualties were civilians
• less than 40% of casualties were civilians
• about 40% of casualties were civilians
3. Before we gave you this information, did you know that the U.S. Drones are loaded with
the consent of the Pakistani government, and that Pakistani Intelligence offi cials provide
targeting information to the United States?
• Yes
• No
Treatment 3
1. Before we gave you this information, did you think that, in 2007, the amount of funds the
United States disbursed to Pakistan were more than, less than or about 21 times larger
than the funds China disbursed to Pakistan?
• more than 21 times larger
• less than 21 times larger
• about 21 times larger
2. Before we gave you this information, did you think that, in 2007, the amount of funds
the United States disbursed to Pakistan were more than, less than or about 27 times the
amount of funds Saudi Arabia disbursed to Pakistan?
• more than 27 times larger
• less than 27 times larger
• about 27 times larger
3. Before we gave you this information, did you think that, in 2009, the financial assistance
that the U.S. provided to Pakistan was more than, less than or about 7.5 times larger than
the assistance the U.S. provided to India?
34
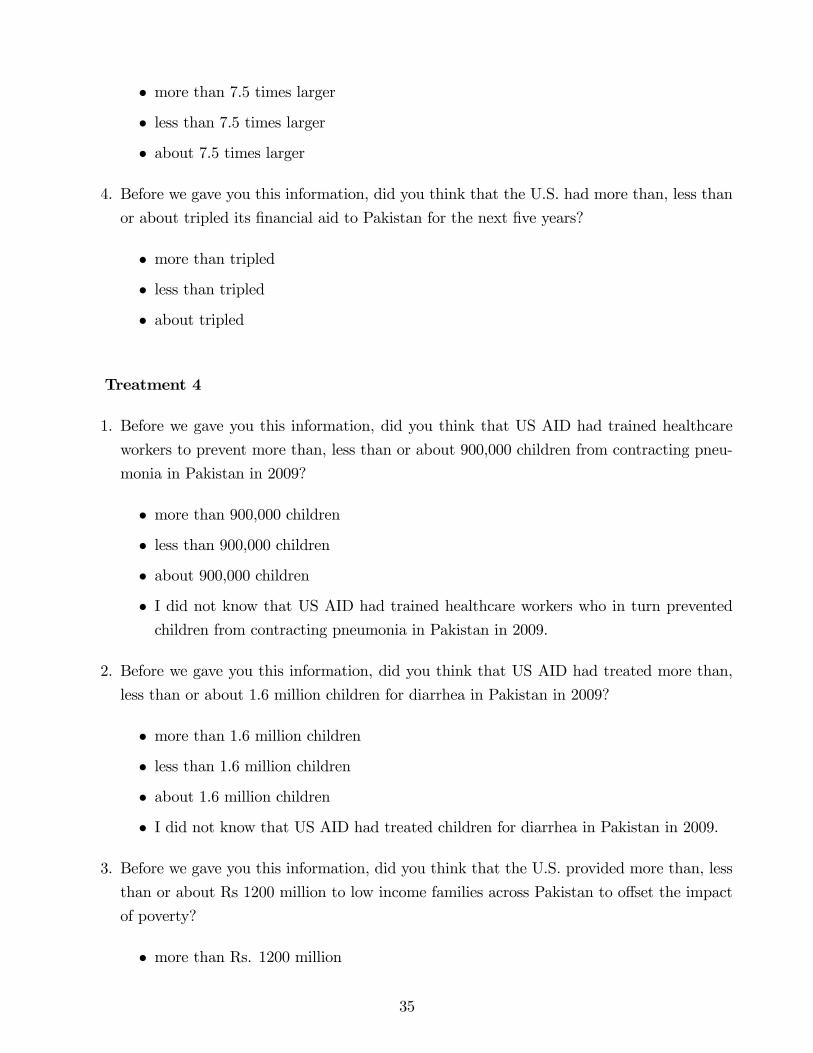
• more than 7.5 times larger
• less than 7.5 times larger
• about 7.5 times larger
4. Before we gave you this information, did you think that the U.S. had more than, less than
or about tripled its financial aid to Pakistan for the next five years?
• more than tripled
• less than tripled
• about tripled
Treatment 4
1. Before we gave you this information, did you think that US AID had trained healthcare
workers to prevent more than, less than or about 900,000 children from contracting pneu-
monia in Pakistan in 2009?
• more than 900,000 children
• less than 900,000 children
• about 900,000 children
• I did not know that US AID had trained healthcare workers who in turn preventedchildren from contracting pneumonia in Pakistan in 2009.
2. Before we gave you this information, did you think that US AID had treated more than,
less than or about 1.6 million children for diarrhea in Pakistan in 2009?
• more than 1.6 million children
• less than 1.6 million children
• about 1.6 million children
• I did not know that US AID had treated children for diarrhea in Pakistan in 2009.
3. Before we gave you this information, did you think that the U.S. provided more than, less
than or about Rs 1200 million to low income families across Pakistan to offset the impact
of poverty?
• more than Rs. 1200 million
35
• less than Rs. 1200 million
• about Rs. 1200 million
• I did not know that the U.S. provided money to low income families across Pakistan.
36
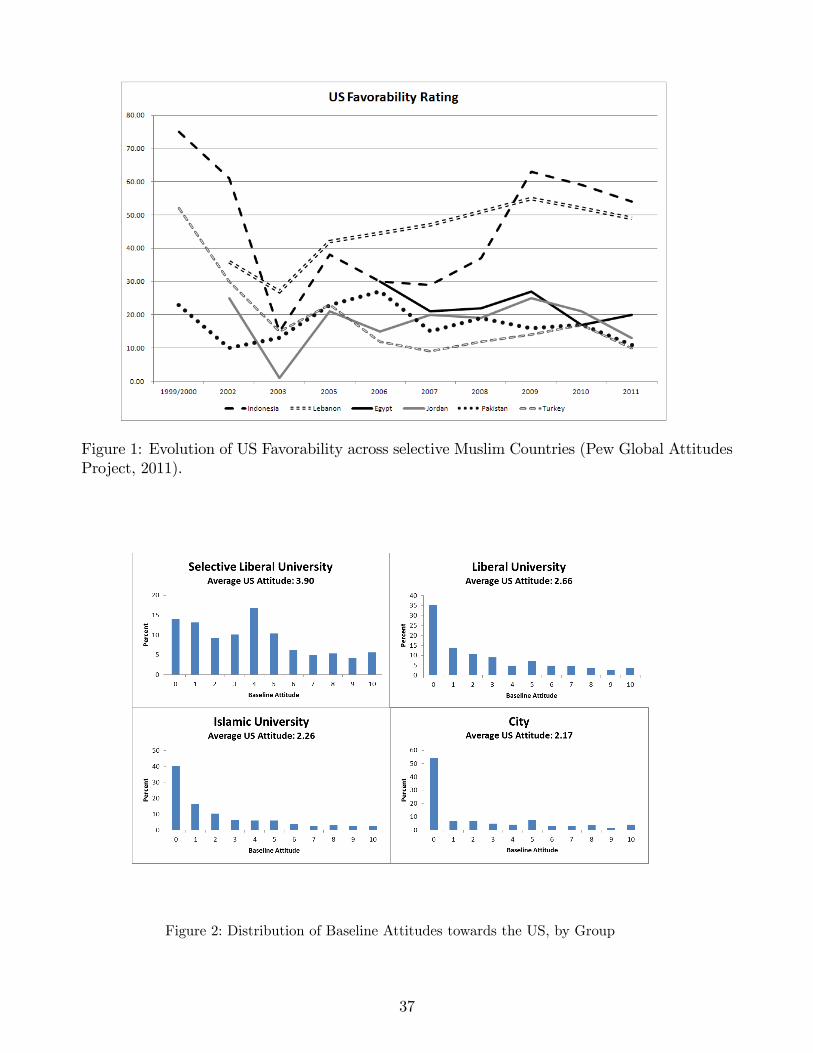
Figure 1: Evolution of US Favorability across selective Muslim Countries (Pew Global AttitudesProject, 2011).
Figure 2: Distribution of Baseline Attitudes towards the US, by Group
37
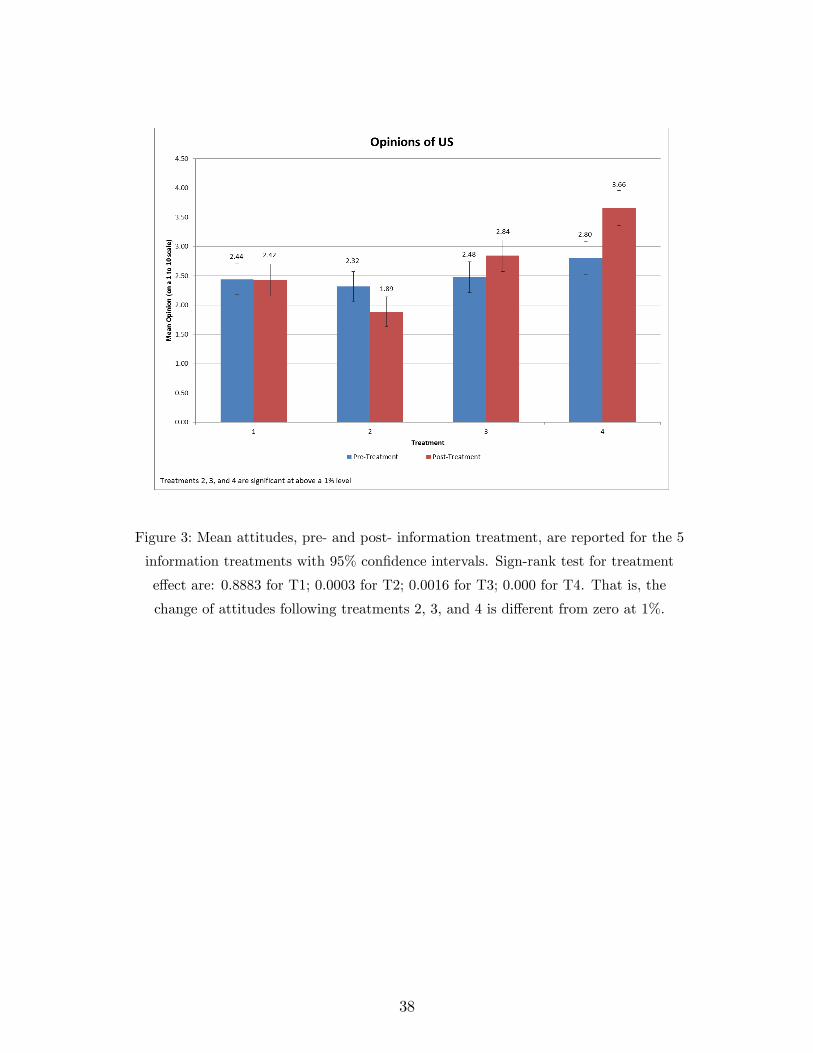
Figure 3: Mean attitudes, pre- and post- information treatment, are reported for the 5
information treatments with 95% confidence intervals. Sign-rank test for treatment
effect are: 0.8883 for T1; 0.0003 for T2; 0.0016 for T3; 0.000 for T4. That is, the
change of attitudes following treatments 2, 3, and 4 is different from zero at 1%.
38
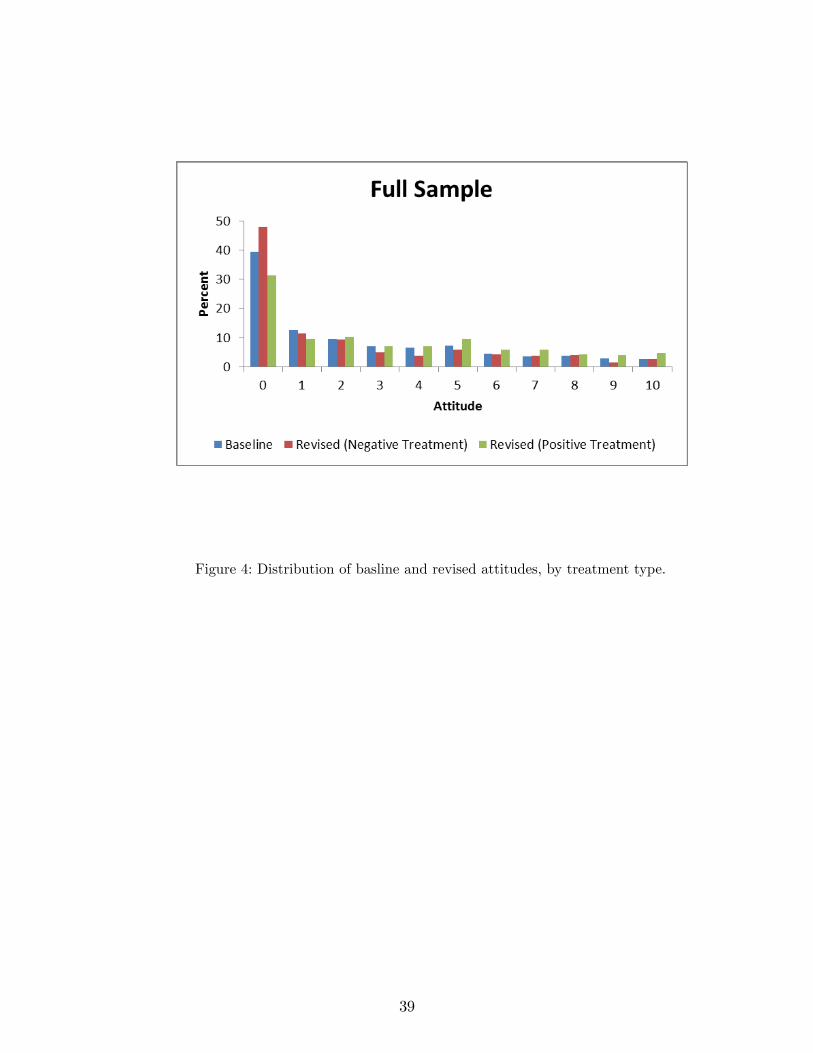
Figure 4: Distribution of basline and revised attitudes, by treatment type.
39
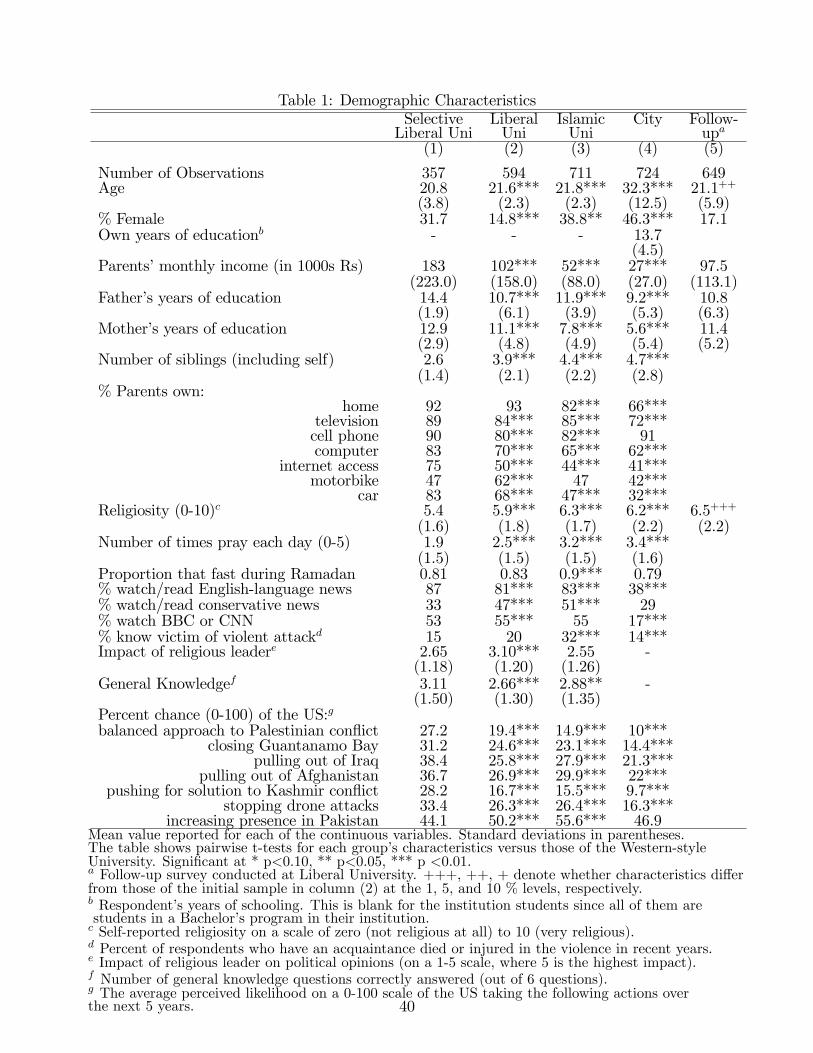
Table 1: Demographic CharacteristicsSelective Liberal Islamic City Follow-Liberal Uni Uni Uni upa
(1) (2) (3) (4) (5)
Number of Observations 357 594 711 724 649Age 20.8 21.6*** 21.8*** 32.3*** 21.1++
(3.8) (2.3) (2.3) (12.5) (5.9)% Female 31.7 14.8*** 38.8** 46.3*** 17.1Own years of educationb - - - 13.7
(4.5)Parents’monthly income (in 1000s Rs) 183 102*** 52*** 27*** 97.5
(223.0) (158.0) (88.0) (27.0) (113.1)Father’s years of education 14.4 10.7*** 11.9*** 9.2*** 10.8
(1.9) (6.1) (3.9) (5.3) (6.3)Mother’s years of education 12.9 11.1*** 7.8*** 5.6*** 11.4
(2.9) (4.8) (4.9) (5.4) (5.2)Number of siblings (including self) 2.6 3.9*** 4.4*** 4.7***
(1.4) (2.1) (2.2) (2.8)% Parents own:
home 92 93 82*** 66***television 89 84*** 85*** 72***cell phone 90 80*** 82*** 91computer 83 70*** 65*** 62***
internet access 75 50*** 44*** 41***motorbike 47 62*** 47 42***
car 83 68*** 47*** 32***Religiosity (0-10)c 5.4 5.9*** 6.3*** 6.2*** 6.5+++
(1.6) (1.8) (1.7) (2.2) (2.2)Number of times pray each day (0-5) 1.9 2.5*** 3.2*** 3.4***
(1.5) (1.5) (1.5) (1.6)Proportion that fast during Ramadan 0.81 0.83 0.9*** 0.79% watch/read English-language news 87 81*** 83*** 38***% watch/read conservative news 33 47*** 51*** 29% watch BBC or CNN 53 55*** 55 17***% know victim of violent attackd 15 20 32*** 14***Impact of religious leadere 2.65 3.10*** 2.55 -
(1.18) (1.20) (1.26)General Knowledgef 3.11 2.66*** 2.88** -
(1.50) (1.30) (1.35)Percent chance (0-100) of the US:gbalanced approach to Palestinian conflict 27.2 19.4*** 14.9*** 10***
closing Guantanamo Bay 31.2 24.6*** 23.1*** 14.4***pulling out of Iraq 38.4 25.8*** 27.9*** 21.3***
pulling out of Afghanistan 36.7 26.9*** 29.9*** 22***pushing for solution to Kashmir conflict 28.2 16.7*** 15.5*** 9.7***
stopping drone attacks 33.4 26.3*** 26.4*** 16.3***increasing presence in Pakistan 44.1 50.2*** 55.6*** 46.9
Mean value reported for each of the continuous variables. Standard deviations in parentheses.The table shows pairwise t-tests for each group’s characteristics versus those of the Western-styleUniversity. Significant at * p<0.10, ** p<0.05, *** p <0.01.a Follow-up survey conducted at Liberal University. +++, ++, + denote whether characteristics differfrom those of the initial sample in column (2) at the 1, 5, and 10 % levels, respectively.b Respondent’s years of schooling. This is blank for the institution students since all of them arestudents in a Bachelor’s program in their institution.c Self-reported religiosity on a scale of zero (not religious at all) to 10 (very religious).d Percent of respondents who have an acquaintance died or injured in the violence in recent years.e Impact of religious leader on political opinions (on a 1-5 scale, where 5 is the highest impact).f Number of general knowledge questions correctly answered (out of 6 questions).g The average perceived likelihood on a 0-100 scale of the US taking the following actions overthe next 5 years. 40
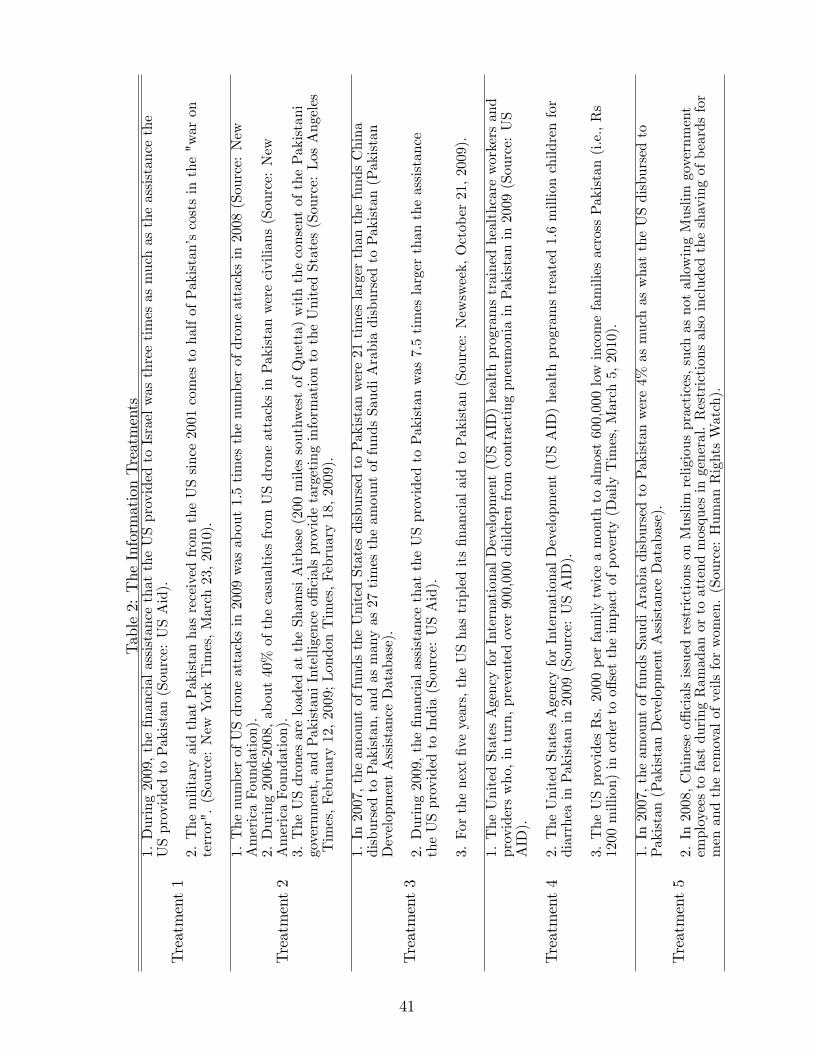
Table2:TheInformationTreatments
Treatment1
1.During2009,thefinancialassistancethattheUSprovidedtoIsraelwasthreetimesasmuchastheassistancethe
USprovidedtoPakistan(Source:USAid).
2.ThemilitaryaidthatPakistanhasreceivedfrom
theUSsince2001comestohalfofPakistan’scostsinthe"waron
terror".(Source:NewYorkTimes,March23,2010).
Treatment2
1.ThenumberofUSdroneattacksin2009wasabout1.5timesthenumberofdroneattacksin2008(Source:New
AmericaFoundation).
2.During2006-2008,about40%ofthecasualtiesfrom
USdroneattacksinPakistanwerecivilians(Source:New
AmericaFoundation).
3.TheUSdronesareloadedattheShamsiAirbase(200milessouthwestofQuetta)withtheconsentofthePakistani
government,andPakistaniIntelligenceofficialsprovidetargetinginformationtotheUnitedStates(Source:LosAngeles
Times,February12,2009;LondonTimes,February18,2009).
Treatment3
1.In2007,theamountoffundstheUnitedStatesdisbursedtoPakistanwere21timeslargerthanthefundsChina
disbursedtoPakistan,andasmanyas27timestheamountoffundsSaudiArabiadisbursedtoPakistan(Pakistan
DevelopmentAssistanceDatabase).
2.During2009,thefinancialassistancethattheUSprovidedtoPakistanwas7.5timeslargerthantheassistance
theUSprovidedtoIndia(Source:USAid).
3.Forthenextfiveyears,theUShastripleditsfinancialaidtoPakistan(Source:Newsweek,October21,2009).
Treatment4
1.TheUnitedStatesAgencyforInternationalDevelopment(USAID)healthprogramstrainedhealthcareworkersand
providerswho,inturn,preventedover900,000childrenfrom
contractingpneumoniainPakistanin2009(Source:US
AID).
2.TheUnitedStatesAgencyforInternationalDevelopment(USAID)healthprogramstreated1.6millionchildrenfor
diarrheainPakistanin2009(Source:USAID).
3.TheUSprovidesRs.2000perfamilytwiceamonthtoalmost600,000lowincomefamiliesacrossPakistan(i.e.,Rs
1200million)inordertooffsettheimpactofpoverty(DailyTimes,March5,2010).
Treatment5
1.In2007,theamountoffundsSaudiArabiadisbursedtoPakistanwere4%
asmuchaswhattheUSdisbursedto
Pakistan(PakistanDevelopmentAssistanceDatabase).
2.In2008,ChineseofficialsissuedrestrictionsonMuslim
religiouspractices,suchasnotallowingMuslim
government
employeestofastduringRamadanortoattendmosquesingeneral.Restrictionsalsoincludedtheshavingofbeardsfor
menandtheremovalofveilsforwomen.(Source:HumanRightsWatch).
41
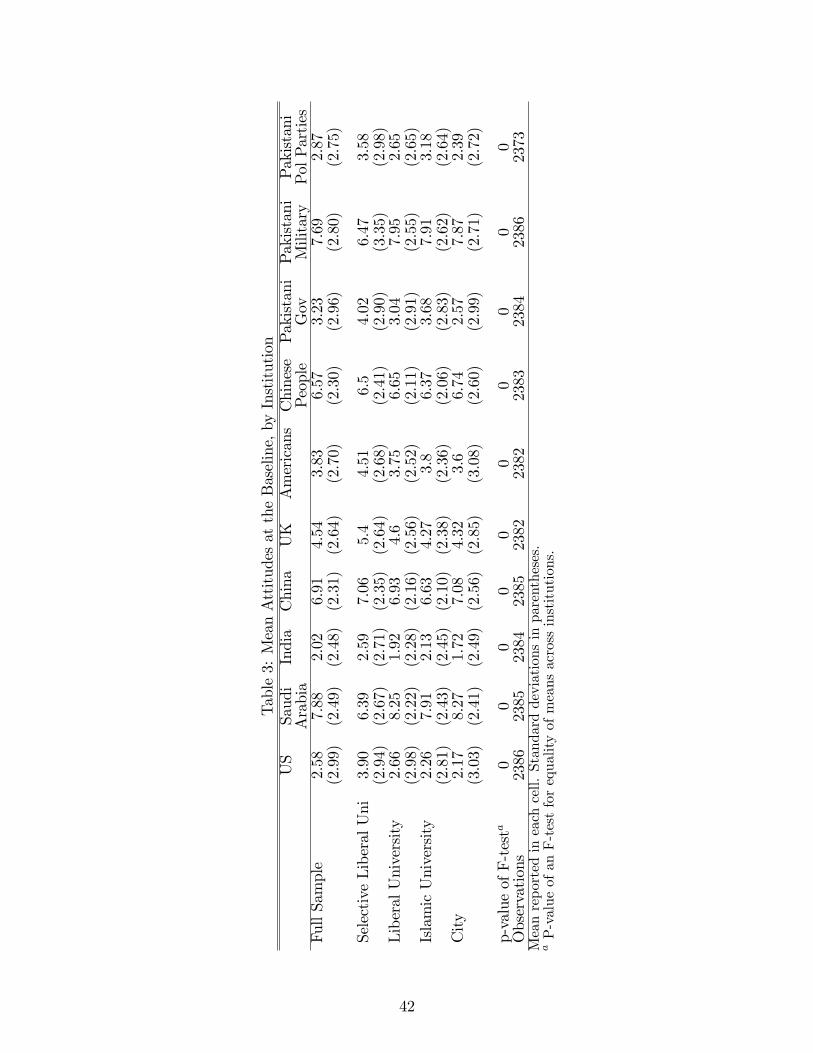
Table3:MeanAttitudesattheBaseline,byInstitution
US
Saudi
India
China
UK
AmericansChinese
Pakistani
Pakistani
Pakistani
Arabia
People
Gov
Military
PolParties
FullSample
2.58
7.88
2.02
6.91
4.54
3.83
6.57
3.23
7.69
2.87
(2.99)
(2.49)
(2.48)
(2.31)
(2.64)
(2.70)
(2.30)
(2.96)
(2.80)
(2.75)
SelectiveLiberalUni
3.90
6.39
2.59
7.06
5.4
4.51
6.5
4.02
6.47
3.58
(2.94)
(2.67)
(2.71)
(2.35)
(2.64)
(2.68)
(2.41)
(2.90)
(3.35)
(2.98)
LiberalUniversity
2.66
8.25
1.92
6.93
4.6
3.75
6.65
3.04
7.95
2.65
(2.98)
(2.22)
(2.28)
(2.16)
(2.56)
(2.52)
(2.11)
(2.91)
(2.55)
(2.65)
IslamicUniversity
2.26
7.91
2.13
6.63
4.27
3.8
6.37
3.68
7.91
3.18
(2.81)
(2.43)
(2.45)
(2.10)
(2.38)
(2.36)
(2.06)
(2.83)
(2.62)
(2.64)
City
2.17
8.27
1.72
7.08
4.32
3.6
6.74
2.57
7.87
2.39
(3.03)
(2.41)
(2.49)
(2.56)
(2.85)
(3.08)
(2.60)
(2.99)
(2.71)
(2.72)
p-valueofF-testa
00
00
00
00
00
Observations
2386
2385
2384
2385
2382
2382
2383
2384
2386
2373
Meanreportedineachcell.Standarddeviationsinparentheses.
aP-valueofanF-testforequalityofmeansacrossinstitutions.
42
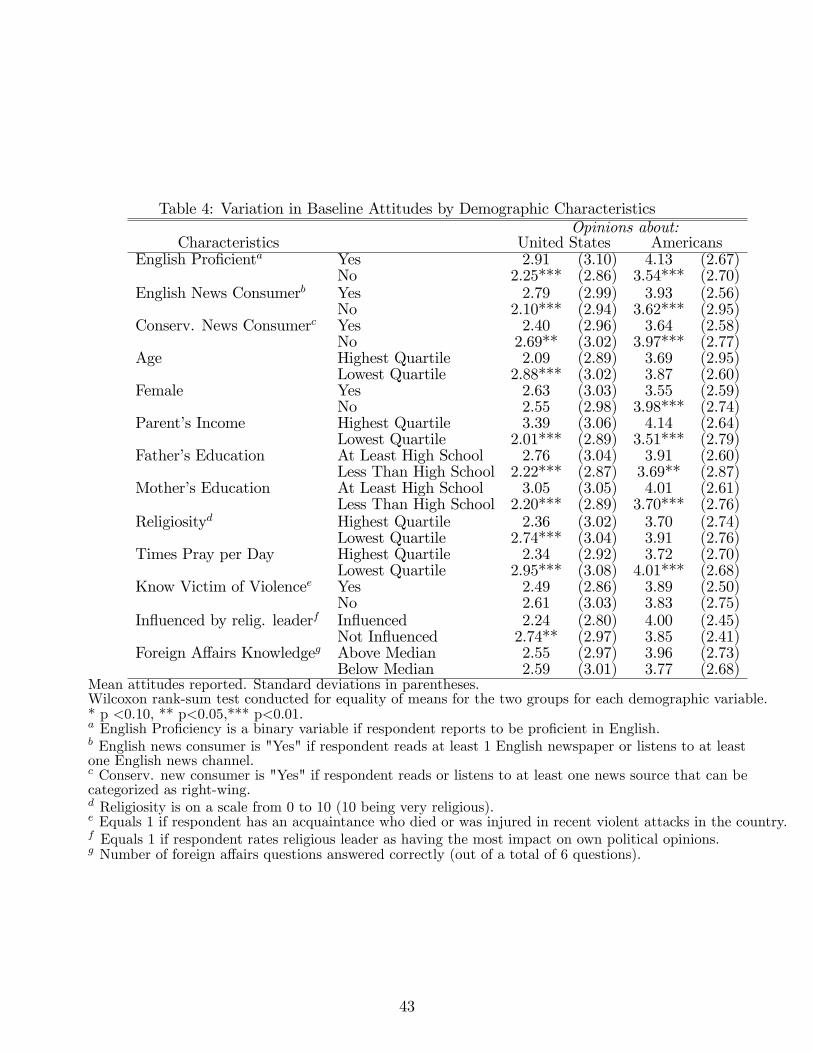
Table 4: Variation in Baseline Attitudes by Demographic CharacteristicsOpinions about:
Characteristics United States AmericansEnglish Proficienta Yes 2.91 (3.10) 4.13 (2.67)
No 2.25*** (2.86) 3.54*** (2.70)English News Consumerb Yes 2.79 (2.99) 3.93 (2.56)
No 2.10*** (2.94) 3.62*** (2.95)Conserv. News Consumerc Yes 2.40 (2.96) 3.64 (2.58)
No 2.69** (3.02) 3.97*** (2.77)Age Highest Quartile 2.09 (2.89) 3.69 (2.95)
Lowest Quartile 2.88*** (3.02) 3.87 (2.60)Female Yes 2.63 (3.03) 3.55 (2.59)
No 2.55 (2.98) 3.98*** (2.74)Parent’s Income Highest Quartile 3.39 (3.06) 4.14 (2.64)
Lowest Quartile 2.01*** (2.89) 3.51*** (2.79)Father’s Education At Least High School 2.76 (3.04) 3.91 (2.60)
Less Than High School 2.22*** (2.87) 3.69** (2.87)Mother’s Education At Least High School 3.05 (3.05) 4.01 (2.61)
Less Than High School 2.20*** (2.89) 3.70*** (2.76)Religiosityd Highest Quartile 2.36 (3.02) 3.70 (2.74)
Lowest Quartile 2.74*** (3.04) 3.91 (2.76)Times Pray per Day Highest Quartile 2.34 (2.92) 3.72 (2.70)
Lowest Quartile 2.95*** (3.08) 4.01*** (2.68)Know Victim of Violencee Yes 2.49 (2.86) 3.89 (2.50)
No 2.61 (3.03) 3.83 (2.75)Influenced by relig. leaderf Influenced 2.24 (2.80) 4.00 (2.45)
Not Influenced 2.74** (2.97) 3.85 (2.41)Foreign Affairs Knowledgeg Above Median 2.55 (2.97) 3.96 (2.73)
Below Median 2.59 (3.01) 3.77 (2.68)Mean attitudes reported. Standard deviations in parentheses.Wilcoxon rank-sum test conducted for equality of means for the two groups for each demographic variable.* p <0.10, ** p<0.05,*** p<0.01.a English Proficiency is a binary variable if respondent reports to be proficient in English.b English news consumer is "Yes" if respondent reads at least 1 English newspaper or listens to at leastone English news channel.c Conserv. new consumer is "Yes" if respondent reads or listens to at least one news source that can becategorized as right-wing.d Religiosity is on a scale from 0 to 10 (10 being very religious).e Equals 1 if respondent has an acquaintance who died or was injured in recent violent attacks in the country.f Equals 1 if respondent rates religious leader as having the most impact on own political opinions.g Number of foreign affairs questions answered correctly (out of a total of 6 questions).
43
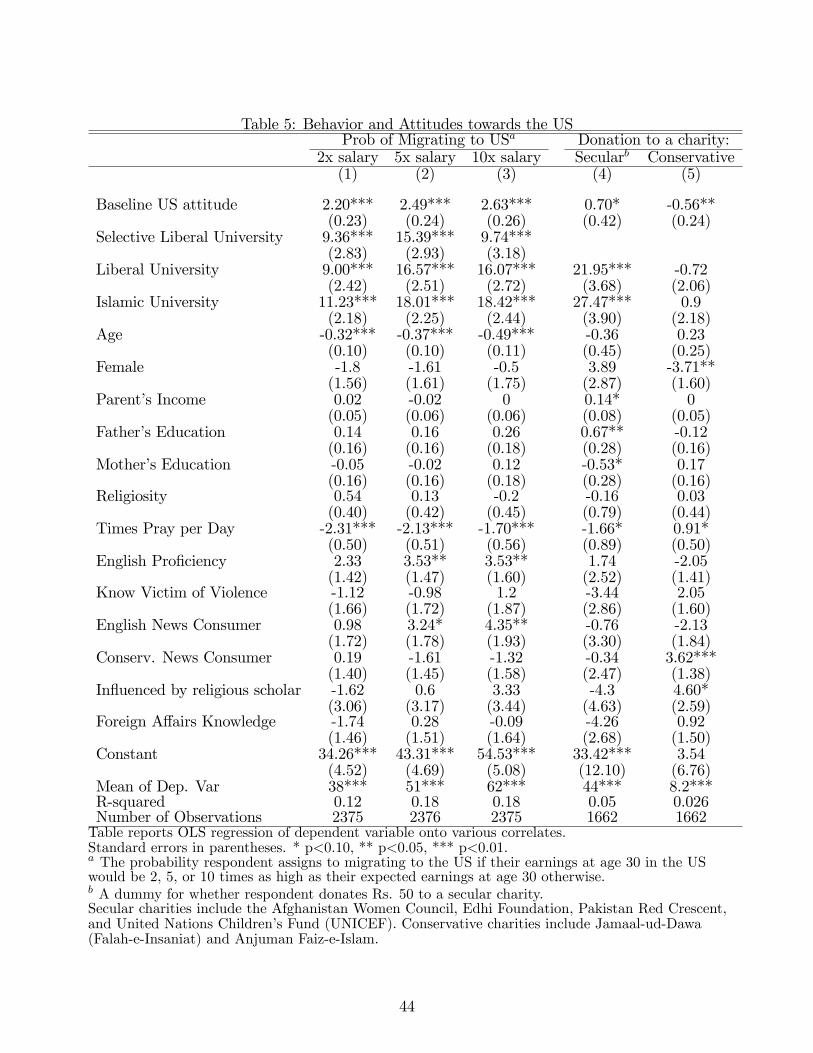
Table 5: Behavior and Attitudes towards the USProb of Migrating to USa Donation to a charity:
2x salary 5x salary 10x salary Secularb Conservative(1) (2) (3) (4) (5)
Baseline US attitude 2.20*** 2.49*** 2.63*** 0.70* -0.56**(0.23) (0.24) (0.26) (0.42) (0.24)
Selective Liberal University 9.36*** 15.39*** 9.74***(2.83) (2.93) (3.18)
Liberal University 9.00*** 16.57*** 16.07*** 21.95*** -0.72(2.42) (2.51) (2.72) (3.68) (2.06)
Islamic University 11.23*** 18.01*** 18.42*** 27.47*** 0.9(2.18) (2.25) (2.44) (3.90) (2.18)
Age -0.32*** -0.37*** -0.49*** -0.36 0.23(0.10) (0.10) (0.11) (0.45) (0.25)
Female -1.8 -1.61 -0.5 3.89 -3.71**(1.56) (1.61) (1.75) (2.87) (1.60)
Parent’s Income 0.02 -0.02 0 0.14* 0(0.05) (0.06) (0.06) (0.08) (0.05)
Father’s Education 0.14 0.16 0.26 0.67** -0.12(0.16) (0.16) (0.18) (0.28) (0.16)
Mother’s Education -0.05 -0.02 0.12 -0.53* 0.17(0.16) (0.16) (0.18) (0.28) (0.16)
Religiosity 0.54 0.13 -0.2 -0.16 0.03(0.40) (0.42) (0.45) (0.79) (0.44)
Times Pray per Day -2.31*** -2.13*** -1.70*** -1.66* 0.91*(0.50) (0.51) (0.56) (0.89) (0.50)
English Proficiency 2.33 3.53** 3.53** 1.74 -2.05(1.42) (1.47) (1.60) (2.52) (1.41)
Know Victim of Violence -1.12 -0.98 1.2 -3.44 2.05(1.66) (1.72) (1.87) (2.86) (1.60)
English News Consumer 0.98 3.24* 4.35** -0.76 -2.13(1.72) (1.78) (1.93) (3.30) (1.84)
Conserv. News Consumer 0.19 -1.61 -1.32 -0.34 3.62***(1.40) (1.45) (1.58) (2.47) (1.38)
Influenced by religious scholar -1.62 0.6 3.33 -4.3 4.60*(3.06) (3.17) (3.44) (4.63) (2.59)
Foreign Affairs Knowledge -1.74 0.28 -0.09 -4.26 0.92(1.46) (1.51) (1.64) (2.68) (1.50)
Constant 34.26*** 43.31*** 54.53*** 33.42*** 3.54(4.52) (4.69) (5.08) (12.10) (6.76)
Mean of Dep. Var 38*** 51*** 62*** 44*** 8.2***R-squared 0.12 0.18 0.18 0.05 0.026Number of Observations 2375 2376 2375 1662 1662Table reports OLS regression of dependent variable onto various correlates.Standard errors in parentheses. * p<0.10, ** p<0.05, *** p<0.01.a The probability respondent assigns to migrating to the US if their earnings at age 30 in the USwould be 2, 5, or 10 times as high as their expected earnings at age 30 otherwise.b A dummy for whether respondent donates Rs. 50 to a secular charity.Secular charities include the Afghanistan Women Council, Edhi Foundation, Pakistan Red Crescent,and United Nations Children’s Fund (UNICEF). Conservative charities include Jamaal-ud-Dawa(Falah-e-Insaniat) and Anjuman Faiz-e-Islam.
44
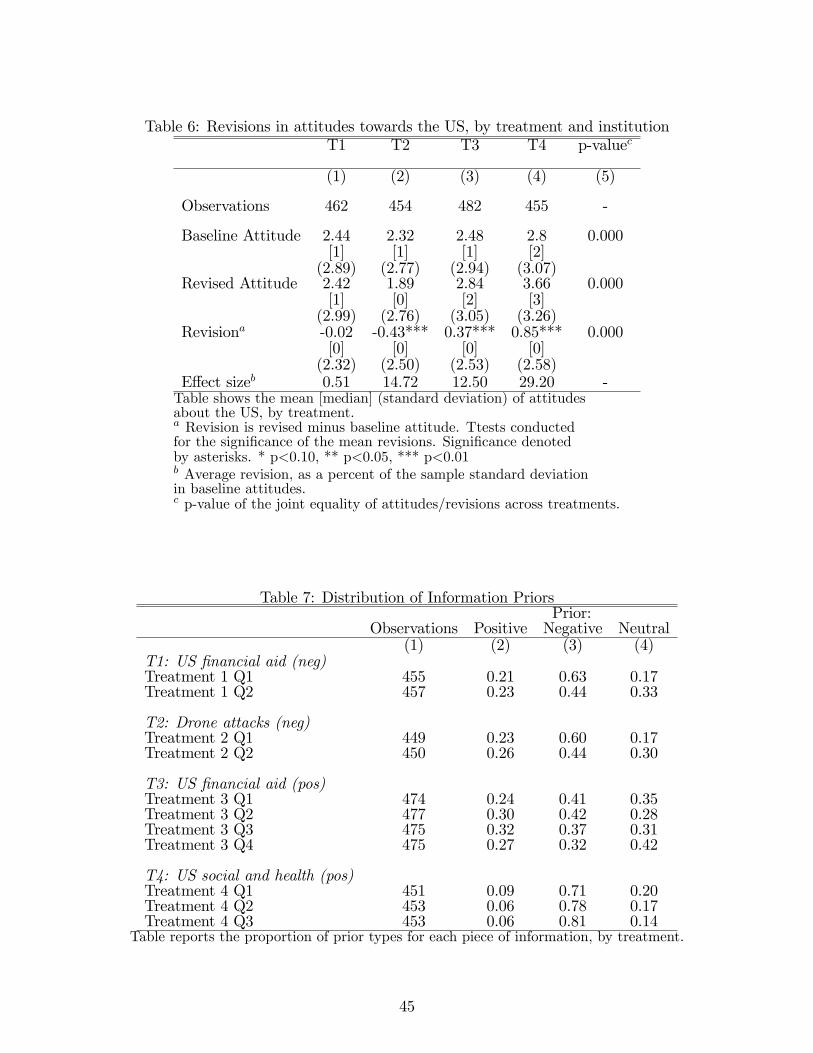
Table 6: Revisions in attitudes towards the US, by treatment and institutionT1 T2 T3 T4 p-valuec
(1) (2) (3) (4) (5)
Observations 462 454 482 455 -
Baseline Attitude 2.44 2.32 2.48 2.8 0.000[1] [1] [1] [2](2.89) (2.77) (2.94) (3.07)
Revised Attitude 2.42 1.89 2.84 3.66 0.000[1] [0] [2] [3](2.99) (2.76) (3.05) (3.26)
Revisiona -0.02 -0.43*** 0.37*** 0.85*** 0.000[0] [0] [0] [0](2.32) (2.50) (2.53) (2.58)
Effect sizeb 0.51 14.72 12.50 29.20 -Table shows the mean [median] (standard deviation) of attitudesabout the US, by treatment.a Revision is revised minus baseline attitude. Ttests conductedfor the significance of the mean revisions. Significance denotedby asterisks. * p<0.10, ** p<0.05, *** p<0.01b Average revision, as a percent of the sample standard deviationin baseline attitudes.c p-value of the joint equality of attitudes/revisions across treatments.
Table 7: Distribution of Information PriorsPrior:
Observations Positive Negative Neutral(1) (2) (3) (4)
T1: US financial aid (neg)Treatment 1 Q1 455 0.21 0.63 0.17Treatment 1 Q2 457 0.23 0.44 0.33
T2: Drone attacks (neg)Treatment 2 Q1 449 0.23 0.60 0.17Treatment 2 Q2 450 0.26 0.44 0.30
T3: US financial aid (pos)Treatment 3 Q1 474 0.24 0.41 0.35Treatment 3 Q2 477 0.30 0.42 0.28Treatment 3 Q3 475 0.32 0.37 0.31Treatment 3 Q4 475 0.27 0.32 0.42
T4: US social and health (pos)Treatment 4 Q1 451 0.09 0.71 0.20Treatment 4 Q2 453 0.06 0.78 0.17Treatment 4 Q3 453 0.06 0.81 0.14
Table reports the proportion of prior types for each piece of information, by treatment.
45
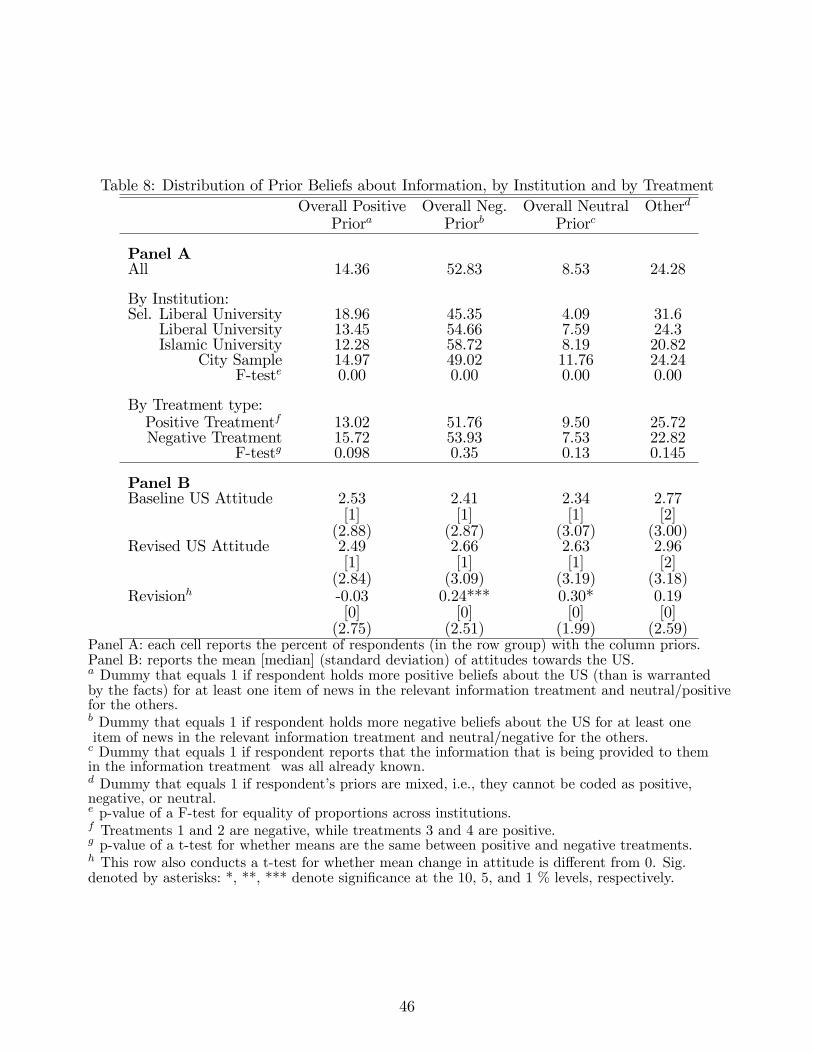
Table 8: Distribution of Prior Beliefs about Information, by Institution and by TreatmentOverall Positive Overall Neg. Overall Neutral Otherd
Priora Priorb Priorc
Panel AAll 14.36 52.83 8.53 24.28
By Institution:Sel. Liberal University 18.96 45.35 4.09 31.6
Liberal University 13.45 54.66 7.59 24.3Islamic University 12.28 58.72 8.19 20.82
City Sample 14.97 49.02 11.76 24.24F-teste 0.00 0.00 0.00 0.00
By Treatment type:Positive Treatmentf 13.02 51.76 9.50 25.72Negative Treatment 15.72 53.93 7.53 22.82
F-testg 0.098 0.35 0.13 0.145
Panel BBaseline US Attitude 2.53 2.41 2.34 2.77
[1] [1] [1] [2](2.88) (2.87) (3.07) (3.00)
Revised US Attitude 2.49 2.66 2.63 2.96[1] [1] [1] [2](2.84) (3.09) (3.19) (3.18)
Revisionh -0.03 0.24*** 0.30* 0.19[0] [0] [0] [0](2.75) (2.51) (1.99) (2.59)
Panel A: each cell reports the percent of respondents (in the row group) with the column priors.Panel B: reports the mean [median] (standard deviation) of attitudes towards the US.a Dummy that equals 1 if respondent holds more positive beliefs about the US (than is warrantedby the facts) for at least one item of news in the relevant information treatment and neutral/positivefor the others.b Dummy that equals 1 if respondent holds more negative beliefs about the US for at least oneitem of news in the relevant information treatment and neutral/negative for the others.c Dummy that equals 1 if respondent reports that the information that is being provided to themin the information treatment was all already known.d Dummy that equals 1 if respondent’s priors are mixed, i.e., they cannot be coded as positive,negative, or neutral.e p-value of a F-test for equality of proportions across institutions.f Treatments 1 and 2 are negative, while treatments 3 and 4 are positive.g p-value of a t-test for whether means are the same between positive and negative treatments.h This row also conducts a t-test for whether mean change in attitude is different from 0. Sig.denoted by asterisks: *, **, *** denote significance at the 10, 5, and 1 % levels, respectively.
46
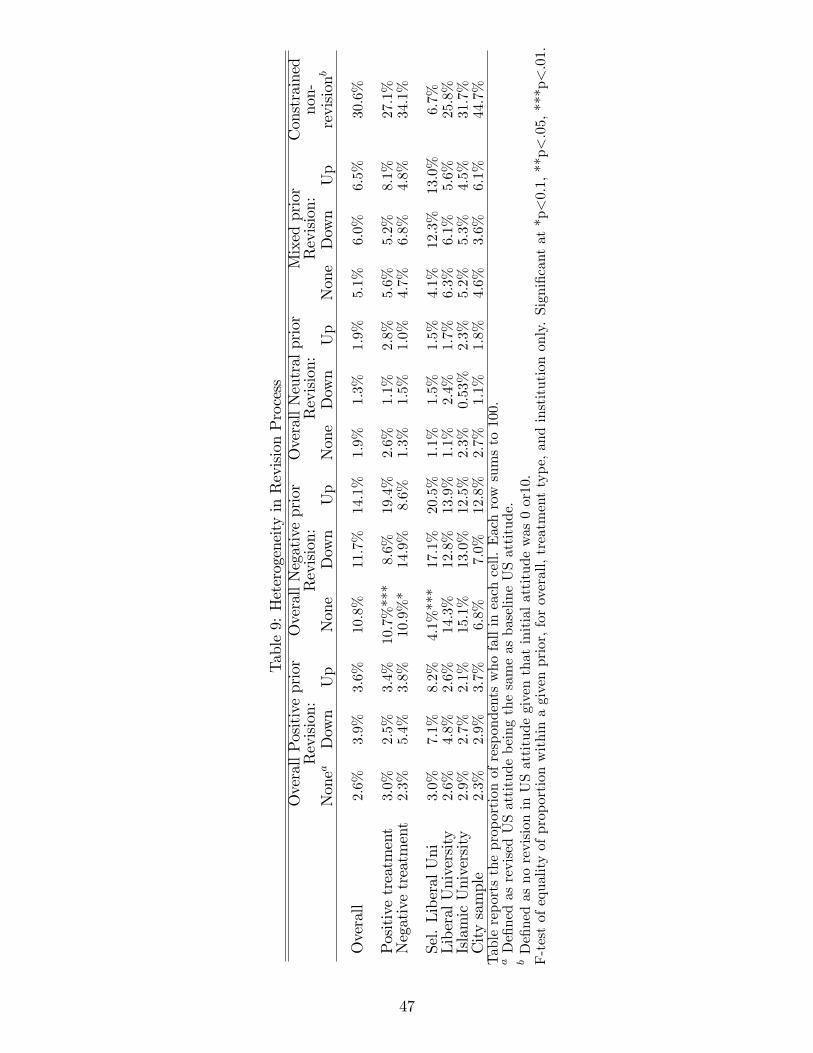
Table9:HeterogeneityinRevisionProcess
OverallPositiveprior
OverallNegativeprior
OverallNeutralprior
Mixedprior
Constrained
Revision:
Revision:
Revision:
Revision:
non-
Nonea
Down
Up
None
Down
Up
NoneDown
Up
NoneDown
Up
revision
b
Overall
2.6%
3.9%
3.6%
10.8%
11.7%
14.1%
1.9%
1.3%
1.9%
5.1%
6.0%
6.5%
30.6%
Positivetreatment
3.0%
2.5%
3.4%
10.7%***
8.6%
19.4%
2.6%
1.1%
2.8%
5.6%
5.2%
8.1%
27.1%
Negativetreatment
2.3%
5.4%
3.8%
10.9%*
14.9%
8.6%
1.3%
1.5%
1.0%
4.7%
6.8%
4.8%
34.1%
Sel.LiberalUni
3.0%
7.1%
8.2%
4.1%***
17.1%
20.5%
1.1%
1.5%
1.5%
4.1%
12.3%
13.0%
6.7%
LiberalUniversity
2.6%
4.8%
2.6%
14.3%
12.8%
13.9%
1.1%
2.4%
1.7%
6.3%
6.1%
5.6%
25.8%
IslamicUniversity
2.9%
2.7%
2.1%
15.1%
13.0%
12.5%
2.3%
0.53%
2.3%
5.2%
5.3%
4.5%
31.7%
Citysample
2.3%
2.9%
3.7%
6.8%
7.0%
12.8%
2.7%
1.1%
1.8%
4.6%
3.6%
6.1%
44.7%
Tablereportstheproportionofrespondentswhofallineachcell.Eachrowsumsto100.
aDefinedasrevisedUSattitudebeingthesameasbaselineUSattitude.
bDefinedasnorevisioninUSattitudegiventhatinitialattitudewas0or10.
F-testofequalityofproportionwithinagivenprior,foroverall,treatmenttype,andinstitutiononly.Significantat*p<0.1,**p<.05,***p<.01.
47
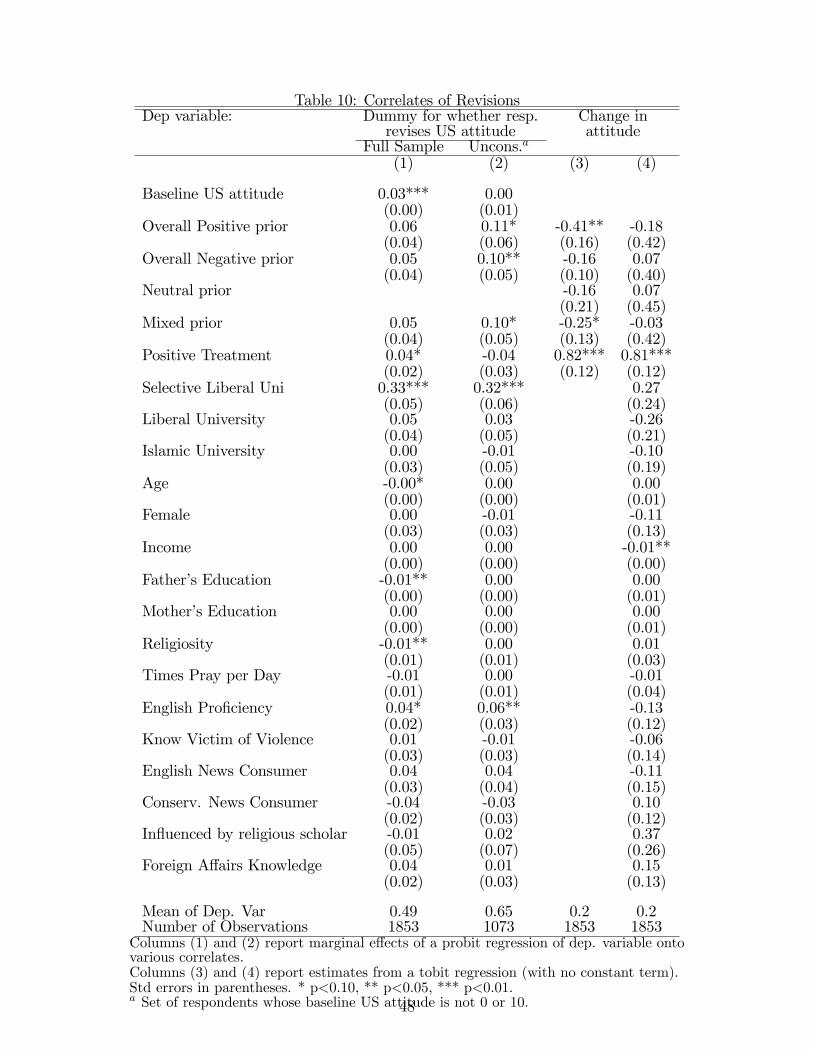
Table 10: Correlates of RevisionsDep variable: Dummy for whether resp. Change in
revises US attitude attitudeFull Sample Uncons.a
(1) (2) (3) (4)
Baseline US attitude 0.03*** 0.00(0.00) (0.01)
Overall Positive prior 0.06 0.11* -0.41** -0.18(0.04) (0.06) (0.16) (0.42)
Overall Negative prior 0.05 0.10** -0.16 0.07(0.04) (0.05) (0.10) (0.40)
Neutral prior -0.16 0.07(0.21) (0.45)
Mixed prior 0.05 0.10* -0.25* -0.03(0.04) (0.05) (0.13) (0.42)
Positive Treatment 0.04* -0.04 0.82*** 0.81***(0.02) (0.03) (0.12) (0.12)
Selective Liberal Uni 0.33*** 0.32*** 0.27(0.05) (0.06) (0.24)
Liberal University 0.05 0.03 -0.26(0.04) (0.05) (0.21)
Islamic University 0.00 -0.01 -0.10(0.03) (0.05) (0.19)
Age -0.00* 0.00 0.00(0.00) (0.00) (0.01)
Female 0.00 -0.01 -0.11(0.03) (0.03) (0.13)
Income 0.00 0.00 -0.01**(0.00) (0.00) (0.00)
Father’s Education -0.01** 0.00 0.00(0.00) (0.00) (0.01)
Mother’s Education 0.00 0.00 0.00(0.00) (0.00) (0.01)
Religiosity -0.01** 0.00 0.01(0.01) (0.01) (0.03)
Times Pray per Day -0.01 0.00 -0.01(0.01) (0.01) (0.04)
English Proficiency 0.04* 0.06** -0.13(0.02) (0.03) (0.12)
Know Victim of Violence 0.01 -0.01 -0.06(0.03) (0.03) (0.14)
English News Consumer 0.04 0.04 -0.11(0.03) (0.04) (0.15)
Conserv. News Consumer -0.04 -0.03 0.10(0.02) (0.03) (0.12)
Influenced by religious scholar -0.01 0.02 0.37(0.05) (0.07) (0.26)
Foreign Affairs Knowledge 0.04 0.01 0.15(0.02) (0.03) (0.13)
Mean of Dep. Var 0.49 0.65 0.2 0.2Number of Observations 1853 1073 1853 1853
Columns (1) and (2) report marginal effects of a probit regression of dep. variable ontovarious correlates.Columns (3) and (4) report estimates from a tobit regression (with no constant term).Std errors in parentheses. * p<0.10, ** p<0.05, *** p<0.01.a Set of respondents whose baseline US attitude is not 0 or 10.48
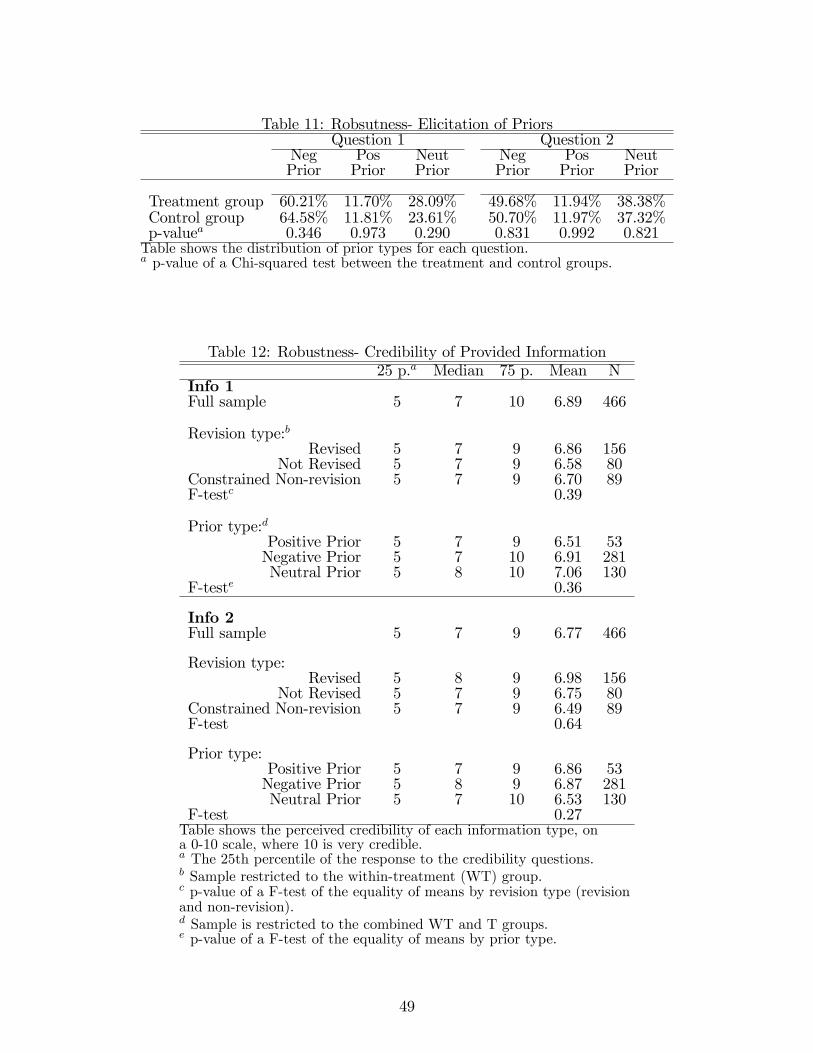
Table 11: Robsutness- Elicitation of PriorsQuestion 1 Question 2
Neg Pos Neut Neg Pos NeutPrior Prior Prior Prior Prior Prior
Treatment group 60.21% 11.70% 28.09% 49.68% 11.94% 38.38%Control group 64.58% 11.81% 23.61% 50.70% 11.97% 37.32%p-valuea 0.346 0.973 0.290 0.831 0.992 0.821Table shows the distribution of prior types for each question.a p-value of a Chi-squared test between the treatment and control groups.
Table 12: Robustness- Credibility of Provided Information25 p.a Median 75 p. Mean N
Info 1Full sample 5 7 10 6.89 466
Revision type:bRevised 5 7 9 6.86 156
Not Revised 5 7 9 6.58 80Constrained Non-revision 5 7 9 6.70 89F-testc 0.39
Prior type:dPositive Prior 5 7 9 6.51 53Negative Prior 5 7 10 6.91 281Neutral Prior 5 8 10 7.06 130
F-teste 0.36
Info 2Full sample 5 7 9 6.77 466
Revision type:Revised 5 8 9 6.98 156
Not Revised 5 7 9 6.75 80Constrained Non-revision 5 7 9 6.49 89F-test 0.64
Prior type:Positive Prior 5 7 9 6.86 53Negative Prior 5 8 9 6.87 281Neutral Prior 5 7 10 6.53 130
F-test 0.27Table shows the perceived credibility of each information type, ona 0-10 scale, where 10 is very credible.a The 25th percentile of the response to the credibility questions.b Sample restricted to the within-treatment (WT) group.c p-value of a F-test of the equality of means by revision type (revisionand non-revision).d Sample is restricted to the combined WT and T groups.e p-value of a F-test of the equality of means by prior type.
49
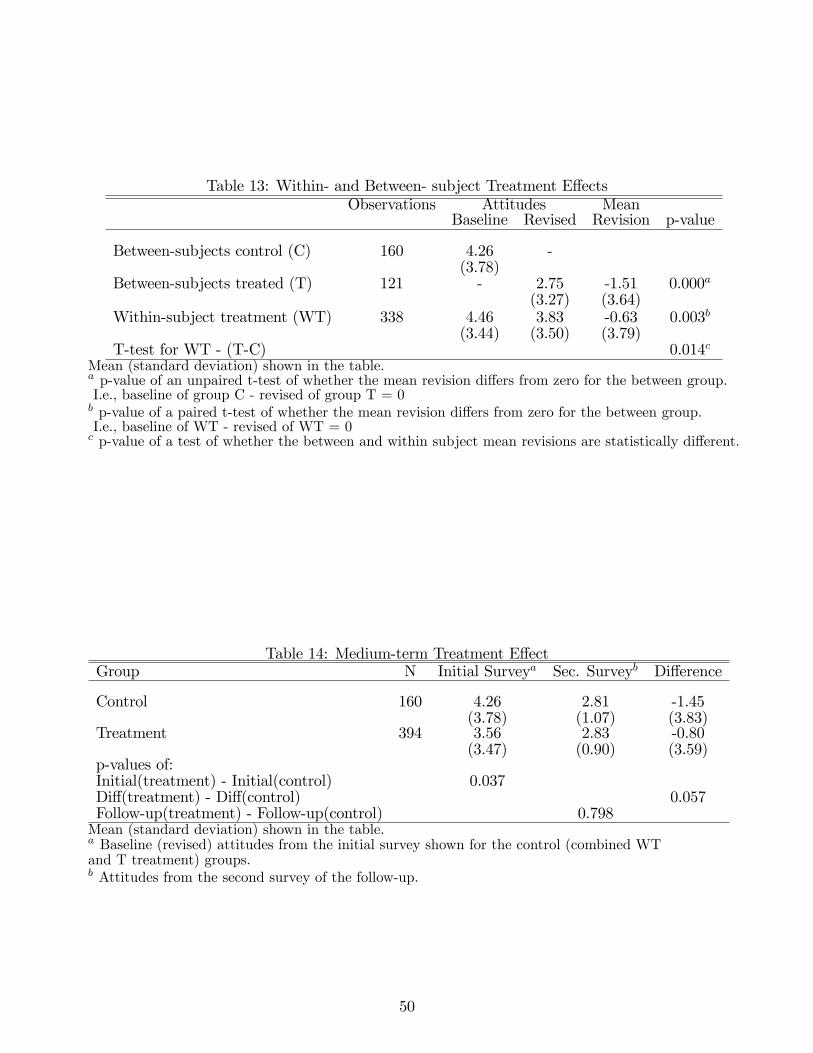
Table 13: Within- and Between- subject Treatment EffectsObservations Attitudes Mean
Baseline Revised Revision p-value
Between-subjects control (C) 160 4.26 -(3.78)
Between-subjects treated (T) 121 - 2.75 -1.51 0.000a(3.27) (3.64)
Within-subject treatment (WT) 338 4.46 3.83 -0.63 0.003b(3.44) (3.50) (3.79)
T-test for WT - (T-C) 0.014cMean (standard deviation) shown in the table.a p-value of an unpaired t-test of whether the mean revision differs from zero for the between group.I.e., baseline of group C - revised of group T = 0b p-value of a paired t-test of whether the mean revision differs from zero for the between group.I.e., baseline of WT - revised of WT = 0c p-value of a test of whether the between and within subject mean revisions are statistically different.
Table 14: Medium-term Treatment EffectGroup N Initial Surveya Sec. Surveyb Difference
Control 160 4.26 2.81 -1.45(3.78) (1.07) (3.83)
Treatment 394 3.56 2.83 -0.80(3.47) (0.90) (3.59)
p-values of:Initial(treatment) - Initial(control) 0.037Diff(treatment) - Diff(control) 0.057Follow-up(treatment) - Follow-up(control) 0.798Mean (standard deviation) shown in the table.a Baseline (revised) attitudes from the initial survey shown for the control (combined WTand T treatment) groups.b Attitudes from the second survey of the follow-up.
50
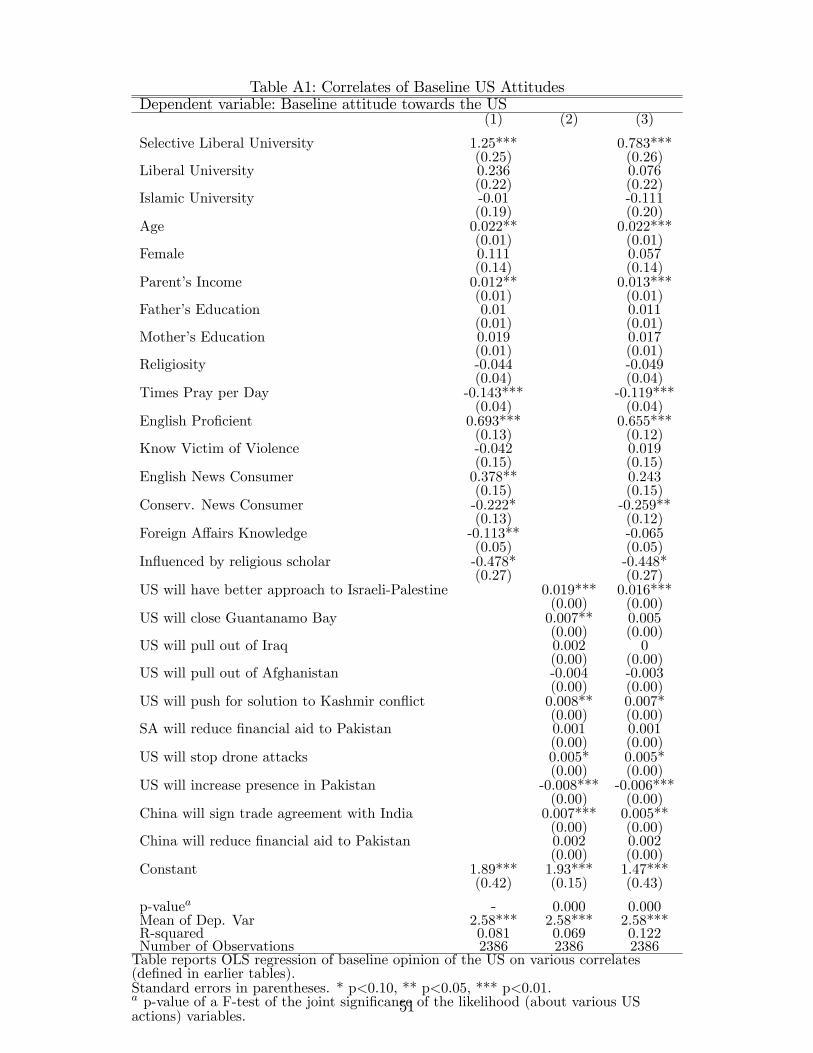
Table A1: Correlates of Baseline US AttitudesDependent variable: Baseline attitude towards the US
(1) (2) (3)
Selective Liberal University 1.25*** 0.783***(0.25) (0.26)
Liberal University 0.236 0.076(0.22) (0.22)
Islamic University -0.01 -0.111(0.19) (0.20)
Age 0.022** 0.022***(0.01) (0.01)
Female 0.111 0.057(0.14) (0.14)
Parent’s Income 0.012** 0.013***(0.01) (0.01)
Father’s Education 0.01 0.011(0.01) (0.01)
Mother’s Education 0.019 0.017(0.01) (0.01)
Religiosity -0.044 -0.049(0.04) (0.04)
Times Pray per Day -0.143*** -0.119***(0.04) (0.04)
English Proficient 0.693*** 0.655***(0.13) (0.12)
Know Victim of Violence -0.042 0.019(0.15) (0.15)
English News Consumer 0.378** 0.243(0.15) (0.15)
Conserv. News Consumer -0.222* -0.259**(0.13) (0.12)
Foreign Affairs Knowledge -0.113** -0.065(0.05) (0.05)
Influenced by religious scholar -0.478* -0.448*(0.27) (0.27)
US will have better approach to Israeli-Palestine 0.019*** 0.016***(0.00) (0.00)
US will close Guantanamo Bay 0.007** 0.005(0.00) (0.00)
US will pull out of Iraq 0.002 0(0.00) (0.00)
US will pull out of Afghanistan -0.004 -0.003(0.00) (0.00)
US will push for solution to Kashmir conflict 0.008** 0.007*(0.00) (0.00)
SA will reduce financial aid to Pakistan 0.001 0.001(0.00) (0.00)
US will stop drone attacks 0.005* 0.005*(0.00) (0.00)
US will increase presence in Pakistan -0.008*** -0.006***(0.00) (0.00)
China will sign trade agreement with India 0.007*** 0.005**(0.00) (0.00)
China will reduce financial aid to Pakistan 0.002 0.002(0.00) (0.00)
Constant 1.89*** 1.93*** 1.47***(0.42) (0.15) (0.43)
p-valuea - 0.000 0.000Mean of Dep. Var 2.58*** 2.58*** 2.58***R-squared 0.081 0.069 0.122Number of Observations 2386 2386 2386Table reports OLS regression of baseline opinion of the US on various correlates(defined in earlier tables).Standard errors in parentheses. * p<0.10, ** p<0.05, *** p<0.01.a p-value of a F-test of the joint significance of the likelihood (about various USactions) variables.
51
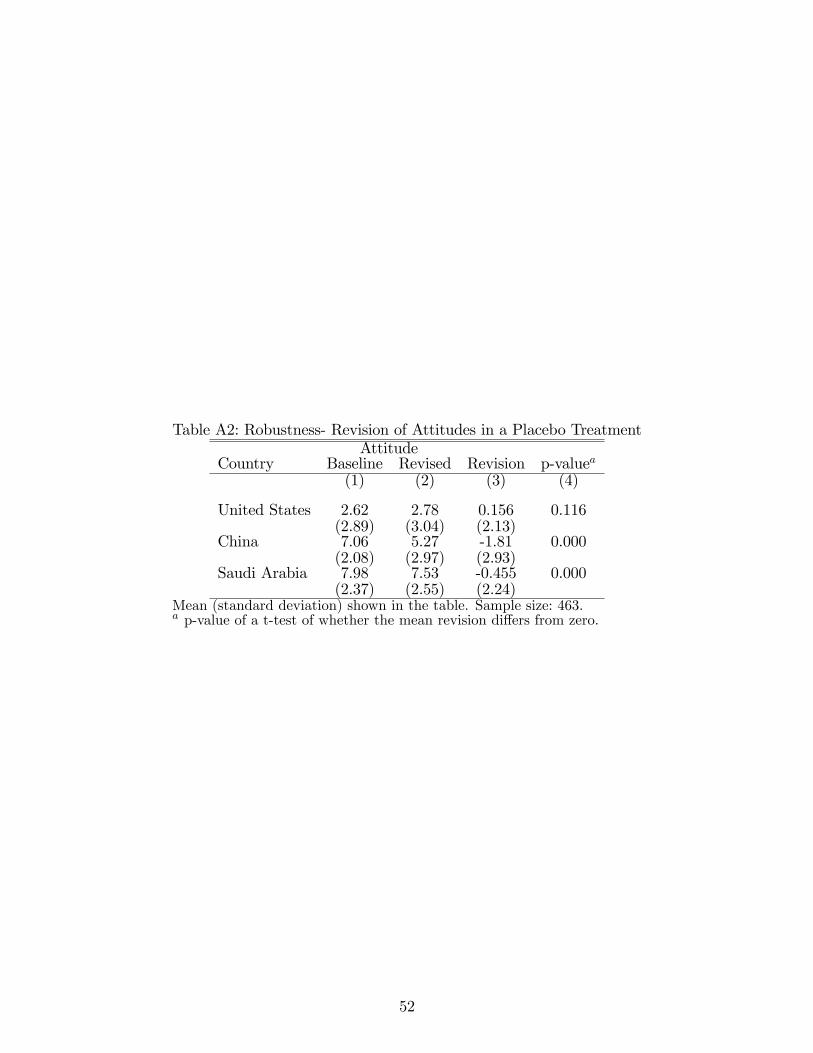
Table A2: Robustness- Revision of Attitudes in a Placebo TreatmentAttitude
Country Baseline Revised Revision p-valuea(1) (2) (3) (4)
United States 2.62 2.78 0.156 0.116(2.89) (3.04) (2.13)
China 7.06 5.27 -1.81 0.000(2.08) (2.97) (2.93)
Saudi Arabia 7.98 7.53 -0.455 0.000(2.37) (2.55) (2.24)
Mean (standard deviation) shown in the table. Sample size: 463.a p-value of a t-test of whether the mean revision differs from zero.
52
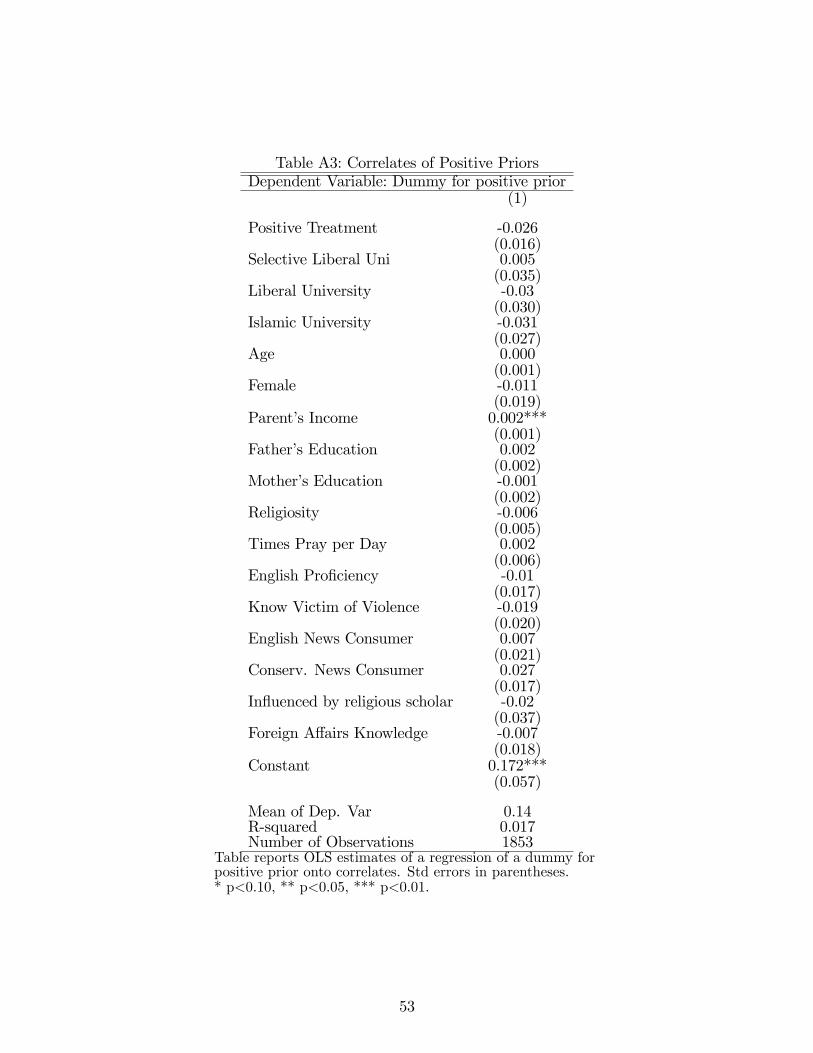
Table A3: Correlates of Positive PriorsDependent Variable: Dummy for positive prior
(1)
Positive Treatment -0.026(0.016)
Selective Liberal Uni 0.005(0.035)
Liberal University -0.03(0.030)
Islamic University -0.031(0.027)
Age 0.000(0.001)
Female -0.011(0.019)
Parent’s Income 0.002***(0.001)
Father’s Education 0.002(0.002)
Mother’s Education -0.001(0.002)
Religiosity -0.006(0.005)
Times Pray per Day 0.002(0.006)
English Proficiency -0.01(0.017)
Know Victim of Violence -0.019(0.020)
English News Consumer 0.007(0.021)
Conserv. News Consumer 0.027(0.017)
Influenced by religious scholar -0.02(0.037)
Foreign Affairs Knowledge -0.007(0.018)
Constant 0.172***(0.057)
Mean of Dep. Var 0.14R-squared 0.017Number of Observations 1853
Table reports OLS estimates of a regression of a dummy forpositive prior onto correlates. Std errors in parentheses.* p<0.10, ** p<0.05, *** p<0.01.
53
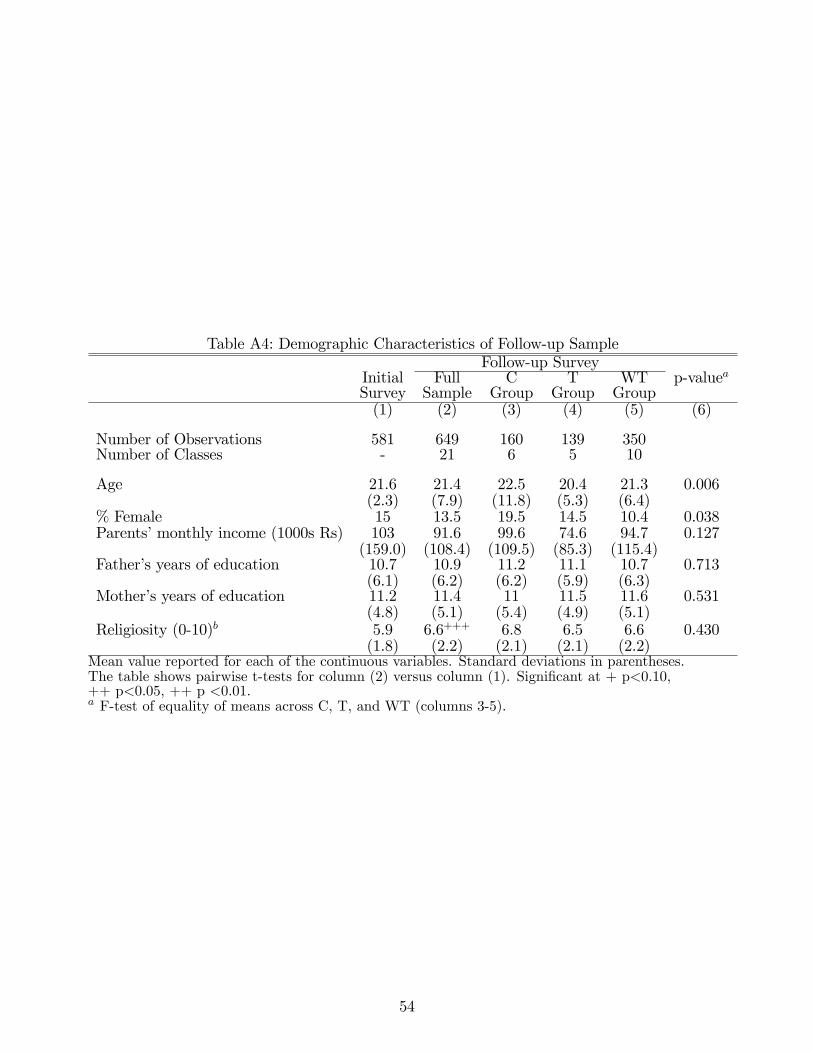
Table A4: Demographic Characteristics of Follow-up SampleFollow-up Survey
Initial Full C T WT p-valueaSurvey Sample Group Group Group(1) (2) (3) (4) (5) (6)
Number of Observations 581 649 160 139 350Number of Classes - 21 6 5 10
Age 21.6 21.4 22.5 20.4 21.3 0.006(2.3) (7.9) (11.8) (5.3) (6.4)
% Female 15 13.5 19.5 14.5 10.4 0.038Parents’monthly income (1000s Rs) 103 91.6 99.6 74.6 94.7 0.127
(159.0) (108.4) (109.5) (85.3) (115.4)Father’s years of education 10.7 10.9 11.2 11.1 10.7 0.713
(6.1) (6.2) (6.2) (5.9) (6.3)Mother’s years of education 11.2 11.4 11 11.5 11.6 0.531
(4.8) (5.1) (5.4) (4.9) (5.1)Religiosity (0-10)b 5.9 6.6+++ 6.8 6.5 6.6 0.430
(1.8) (2.2) (2.1) (2.1) (2.2)Mean value reported for each of the continuous variables. Standard deviations in parentheses.The table shows pairwise t-tests for column (2) versus column (1). Significant at + p<0.10,++ p<0.05, ++ p <0.01.a F-test of equality of means across C, T, and WT (columns 3-5).
54