Embed Size (px)
Citation preview
Information and Liquidity of Over-the-Counter Securities:
Evidence from Public Registration of Private Debt
Song Han
Federal Reserve Board
Alan G. Huang
University of Waterloo
Madhu Kalimipalli
Wilfrid Laurier University
Ke Wang
Federal Reserve Board
This version: June 10, 2017
Preliminary. Comments Welcome.
Abstract
The Rule 144A private debt represents a significant and growing segment of the U.S. bond market.
A large fraction of 144A bond issues carry registration rights and are subsequently publicly
registered. We examine the market liquidity effects of enhanced information induced by the public
registration of private debt. Using the regulatory version of TRACE data for the period 2002-2013,
we find that following public registration of 144A bond, liquidity cost of trading these bonds
measured by dealer-specific effective bid-ask spreads narrow. The spread reduction is larger for
issues with higher ex-ante information asymmetry. Our results are consistent with existing
theories that financial transparency reduces information risk and thus improves market
liquidity.
Keywords: Rule 144A bond, broker-dealers, public registration, liquidity, information disclosure
JEL Classifications: G12, G14
The views expressed herein are completely our own and do not necessarily reflect the views of the Federal Reserve
Board or its staff. We acknowledge discussants and participants at the Third Ontario Universities Accounting and
Finance Symposium, 2017 Annual Meeting of the Mid-West Finance Association, and 2017 Annual Fixed Income
and Financial Institutions Conference, University of South Carolina for their helpful comments. (Accepted for
presentation at the 2017 European Finance Association Meetings, Mannheim, and Summer School on Liquidity in Financial Markets and Institutions, Washington University in St. Louis)
2
1. Introduction
A wide range of corporate securities and derivatives are traded in the over-the-counter
(OTC) market, where market-makers and investors search for trading counterparties and bargain
over trade terms. Theories show that asymmetric information among traders about issuer’s
financial conditions is one of major factors contributing to search frictions and market liquidity in
trading these securities (e.g., Duffie 2012). In practice, the extreme cases of Iliquidity episodes
include trading halts of specific securities due to lack of information, for example, when a firm
fails tofile periodic public reports. Trading conditions may also deteriorate sharply across the broad
market when the information risk becomes too high, as occurred during the recent financial crisis.
In this paper, we provide a quantitative analysis of how asymmetric information in
corporate finance impacts the trading liquidity in the market for corporate bonds—an OTC market
that has received a great deal of attention in recent years. Our focus on the informational effect
contributes to this growing literature, because most existing studies examine the impact on bond
liquidity of opacity in trading activities and market fragmentation.1 Our premise is the following.
The standard OTC theory implies that greater public disclosures of an issuer’s financial conditions
should improve the market liquidity of the issuer’s bonds, because public disclosure reduces the
extent of information asymmetry among traders (see, for example, Diamond and Verrecchia, 1991,
Easley, Hvidkjaer, and O’Hara 2002, Greenstone, Oyer, and Vissing-Jorgensen 2006).
We examine the liquidity effect on OTC securities of information disclosure in the context
of the public registration of the Rule 144A corporate bonds. Adopted in 1990, the Rule 144A
provided a safe harbor from the public registration requirements of the Securities Act (1933) for
resales of restricted securities to “qualified institutional buyers” (or QIBs), which generally are
large financial institutions and other accredited investors.2 Interestingly, while the Rule 144A
bonds are issued at “dark exclusively to QIBs,” many of them carry registration rights and are
1 Typical for an OTC market, corporate bond trading is generally opaque. Several studies find that trading costs have
declined after increased post-trade transparency on transaction information (Bessembinder, Maxwell, and
Venkataraman (2006), Edwards, Harris and Piwowar (2007), Goldstein and Hotchkiss (2007), and Goldstein,
Hotchkiss and Sirri (2007)). A large literature has examined the role of information asymmetry among traders in the
market liquidity of equity trading. See, for example, Glosten and Milgrom (1985), Glosten and Harris (1988),
Madhavan, Richardson, and Roomans (1997), and Huang and Stoll (1997). 2 Specifically, QIBs are the following financial entities: 1) an institution (e.g., an insurance company, investment
company or pension plan) that owns or invests at least $100 million in securities of non-affiliates; 2) a bank or savings
and loan (S&L) association that meets condition 1) and also has an audited net worth of at least $25 million; 3) a
broker or dealer registered under the Exchange Act, acting for its own account or for that of QIBs that own and invest
at least $10 million in securities of non-affiliates; or 4) an entity whose equity holders are all QIBs.
3
subsequently publicly registered.3 As required by the securities law, issuers need to disclose their
financial conditions as part of the public registration. Importantly, public registrations generally
entail an offer of new public bonds to exchange for the target Rule 144A bonds, where the terms
of the new bonds are mostly identical to those of the exchanged ones. As such, the 144A public
registrations don’t accompany changes in the issuer’s fundamentals such as leverage, allowing us
to better identify the informational effects on OTC trading liquidity.
Assessing the liquidity effect of the Rule 144A public registration can help shed light on
the informational effects for the broad bond markets. First, since its inception, Rule 144A corporate
bonds have quickly become an important source of corporate financing. For example, according
to the Fixed Income Securities Database (FISD), between 1990 and 2013, Rule 144A bonds
account for 20 percent of the total corporate bonds issued by U.S. firms, with the growth
particularly strong since the recent financial crisis.4 Second, secondary market volumes of 144A
bonds are also sizable, representing nearly 20 percent of the average trading volumes of all
corporate bonds (FINRA,,2014).5 To the best of our knowledge, we provide a first comprehensive
study on the market liquidity effects of Rule 144A public registration, which sheds light on the
general issue of the information effects on OTC trading.
We find that liquidity improves following public registration of 144A bonds and that the
improvement is larger for issues with higher ex-ante information asymmetry. Our analysis takes
advantage of the comprehensive version of the Trade Reporting and Compliance Engine (TRACE)
data for the period 2002-2013. The data contain transactions of all bonds reported to the Finance
Industry Regulatory Authority (FINRA), including those that previously were not disseminated to
the public, among which are Rule 144A bonds.6
To begin, we examine the change of trading costs following the public registration. Our
main measure for trading costs is the round-trip costs of trading (RTC). Following, for example,
3 Extant literature provides a wide range of estimates on the extent of exercises of these registration rights. Depending
on the sample used, over 30-90% of the 144A bonds are publicly registered in the few months following issuance.
See, e.g., Livingston and Zhou (2002), Huang and Ramirez (2010), and Craig (2012). 4 Specifically, out of the total $20.7 trillion of corporate debt issued during 1990-2013, $4.1 trillion was Rule 144A
debt. Also, 144A bond issuance as a share of total U.S. corporate bond issuance rose from 23.40 percent during pre-
crisis period ( 1999-2006) to 37.62 percent in post-crisis period (2010-2013). 5 Dan Caplinger, “How Rule 144A Created a Shadow Financial Market.” Motley Fool, 7/3/2015
(https://www.fool.com/investing/brokerage/2015/07/03/how-rule-144a-created-a-shadow-financial-market.aspx). 6 This regulatory data for this study is provided by FINRA to the Federal Reserve Board under a data sharing
agreement. Note that FINRA phased in public disseminations of non-Rule 144A from July 2002 to February 2005,
and started to disseminate Rule 144A transactions to the public on June 30, 2014, with 18 months of time lag.
4
Goldstein, Hotchkiss, and Sirri (2007), the RTC measure is the difference of transaction prices
between a dealer’s sale to a customer and a dealer’s purchase from another customer for the same
security on the same day. Since we observe the identification of the broker-dealers intermediating
each trade, we are able to compute dealer-bond specific RTC, which is closer to the true dealer-
specific effective bid-ask spread. OTC markets such as the Rule 144A market are often
characterized by sporadic trading and traders’ specific portfolio needs, making trade size-based
measures such as Amihud’s (1989) price impact measure less desirable. Using RTC as the liquidity
measure avoids such pitfall.
We search 144A bond registrations by matching bond specific attributes, combined with
validation of registration-key words in bond prospectuses. A Rule 144A bond becomes registered
mostly through an exchange offer in which the debtor issues registered public securities to tender
for the 144A bond. For every 144A bond, we search the FISD database to locate a public bond
subsequently issued that matches key characteristics of the 144A bond. We then validate the
matching by searching exchange offer-related key words in the prospectus of the public bond. Our
results show that on average, registration reduces RTC by 3.3 (5.0) basis points 100 (30) days
around the registration, or about 12 (19) percent of its pre-registration level.
We then conduct three sets of difference-in-difference (DID) analysis to address the
identification concern that the changes in trading liquidity around the public registration may be
attributable to factors other than changes in information environment regarding the 144A issuer’s
financial conditions. We take comfort in that 144A public registrations are not associated with
capital structure and funding changes, because the new public bond offered to replace the existing
144A bonds is identical to the tendered bond except the security legend. Even so, other factors, such
as market conditions, may change around the registrations and in turn affect bond liquidity.
Addressing this concern, we contrast the change in trading liquidity of bonds that are more likely
to experience changes in information environment with that of other control bonds. The premise is
that if the information disclosure matters for trading liquidity, then the public registration effects
should be stronger among issuers with greater information risk pre-registration.
The three sets of DID analysis are as follows. Firstly, focusing on the 144A bonds
experiencing public registrations, we contrast those issued by firms with public equities with those
by private firms. Because public firms disclose regularly their financial conditions, public
registration of their 144A bonds may have relatively less information content, when compared to
5
to 144A registrations of private firms. Secondly, we use an issue-specific proxy for the extent of
possible changes in information risk. Specifically, following the recent literature of SEC filing
analysis (e.g., Li 2008, Loughran and McDonald 2013, Ertugrul et al. 2015), we use three metrics
from bond prospectus to measure ex-ante information asymmetry of a public issue: total word
count, count of uncertainty words, and file size. This school of literature finds evidence for
“information obfuscation,” where issuers tend to hide adverse information through lengthy filings
(Bloomfield 2002). Lastly, we construct a matched sample of public (non-144A) bonds as our
control group. We expect the 144A debt registration for public firms to informationally less
prominent. For each 144A bonds experiencing public registration, we find a set of public bonds
with same industry, credit rating, callability, remaining bond maturity, and bond issue size. We
compare the changes in RTC between the 144A bond and its matched public bond around the
registration event. Overall, these three sets of DID analysis find that the RTC measure of bid-ask
spreads decreases post registration, and it is more so for firms with high information asymmetry
pre-public registrations. These findings suggest that increased corporate information disclosure
associated with public registration improve the market liquidity of OTC securities.
Measuring the impact of registration on bond pricing, we find that yields on average
decrease by 16 basis points and daily returns decrease by 3 basis points following registration,
consistent with previous empirical studies on 144A bonds. We also find that trading activities are
subdued following public registration, based on both trading volume and frequency of trading,
regardless of more retail investors entering the market; and that bond dealers tend to reduce their
net positions following public registration of 144A bonds. Since registration is an expected event,
some institutional traders may have reasons to trade 144A bonds ahead of registration time more
actively. Although post- registration, retail investors can enter the market, as they might behave
more like “busy-and-hold” investors, we tend to observe less active trading activity. However, if
we measure liquidity in terms of trading costs such as effective bid-ask spread, we still conclude
liquidity improves after registration. In a public bond market setting, Goldstein, Hotchkiss and
Sirri (2007) finds that enhanced transparency is not associated with greater trading volume, which
is consistent with our findings.
Overall, this paper contributes to the empirical literature showing that public disclosure
reduces liquidity costs for OTC securities. Following public registration of 144A bond, bid-ask
spreads narrow, and more so for firms with higher ex-ante information asymmetry. We believe

6
our paper is the first to identify the relationship between financial information asymmetry and
liquidity cost based on bond transaction data. It also complements empirical studies on bond
liquidity with detailed examination on Rule 144A bonds, which are often omitted in earlier
literature using TRACE database since the dissemination of this type of bonds is only recent
and our regulatory version of data contains all 144A bond transactions reported in TRACE but
not disseminated before.7 The rest of the paper is organized as follows. Section 2 discusses our
contributions to the literature. Section 3 describes our data, sample construction, and liquidity
measures. Section 4 presents our main empirical results on the impact of registration to liquidity
and trading activity. Section 5 provides additional robustness tests and other findings regarding to
yields and trading activities. Section 6 concludes.
2. Related Work
Our paper contributes to three related strands of literature that are summarized below.
2.1 Studies on Public Disclosure, Liquidity and Asset Pricing in OTC Markets
Our paper contributes to the broad literature on the effect of corporate information
disclosure on market liquidity and asset prices. A key insight of this literature, including standard
market microstructure theory, is that the market liquidity of traded securities reflects the risk of
asymmetric information about the issuer’s financial health (e.g., Glosten and Milgram 1985,
Diamond and Verrecchia 1991, and many others).
More specifically, our paper is more closely related to the strand of literature of how public
disclosure of corporate information in OTC markets affects liquidity and asset prices. Most of these
studies focus on OTC stocks. In particular, studies have found that market liquidity and asset prices
in the OTC stocks improve following mandatory disclosure requirements, because higher quality
financial reporting and better disclosure can reduce information asymmetry (e.g., Healy, Hutton,
and Palepu 1999, and Leuz and Verrecchia 2000, Easley, Hvidkjaer, and O’Hara 2002, Greenstone,
Oyer, and Vissing-Jorgensen 2006, Brüggemann, Kaul, Leuz, and Werner 2016).8 White (2016)
7 As of June 2014, FINRA (Financial Industry Regulatory Authority) started releasing 144A transaction data on
TRACE . 8 For example, Greenstone, Oyer, and Vissing-Jorgensen (2006) analyze the effects of mandatory disclosure
requirement using 1964 Securities Acts Amendments in U. S. equity markets and find the Amendments created $3.2
7
using a proprietary database of transaction-level OTC shows that the typical OTC investment
return is severely negative and that investor outcomes worsen for OTC stocks that have weaker
disclosure-related eligibility requirements. A number of recent studies also examine liquidity of
OTC equities per se and have similar findings on information effects. For example, different market
tiers of information disclosure are related to liquidity in both the OTC markets (Davis, Van Ness
and Van Ness 2016) and the Pink Sheet markets (Jiang, Petroni and Wang 2016). Ang, Shatuber
and Tetlock (2013) find that there is an illiquidity premium among OTC stocks and that the
premium is largest among stocks held predominantly by retail investors and those not disclosing
financial information in the OTC stocks.
Our paper is also related to the impact of corporate disclosure in the bond market. Duffie
and Lando (2001) theorize that imperfect accounting information due to infrequent accounting
disclosure contributes to the relatively elevated yield spreads of short-term corporate bonds, an
aspect that has been found puzzling for some time in studies of the term structure of corporate bond
yield spreads. Examining only corporate bond prices, Yu (2005) empirically verifies the prediction
of Duffie and Lando (2001) that firms with better information disclosure rankings tend to have
lower credit spreads, and that the transparency effect is especially large among short-term bonds.
Tang (2012) examines how proprietary costs of mandatory disclosure influence the decision to
exclude registration rights in private debt placements, and finds that, at the industry level,
industries dominated by players with “product differentiation strategy” have a larger proportion of
private placements without registration rights than product markets dominated by players with
“low cost strategy.”
A number of studies, also mostly on equity trading, assess the quantitative importance of
information risk on market liquidity by estimating the information component in bid-ask spreads—
a common measure for trading cost. For example, it is documented that the adverse selection risk
associated with information asymmetry among market participants about issuers’ financial
conditions leads to higher bid-ask spread (e.g., Huang and Stoll, 1987; Glosten and Harris, 1988;
Madhavan, Richardson, and Roomans,1997). An exception to these equity studies, Han and Zhou
(2014) estimate the information asymmetric components of corporate bond trading bid-ask spreads
to $6.2 billion of value for shareholders of the OTC firms in their sample. Brüggemann, Kaul, Leuz, and Werner
(2016) analyze a comprehensive sample of more than 10,000 U.S. OTC stocks and find that OTC firms that are subject
to stricter regulatory regimes and disclosure requirements have higher market quality (higher liquidity and lower crash
risk).
8
and examine the pricing implications of informed trading and its ability to predict corporate
defaults. They find that microstructure measures of information asymmetry seem to capture adverse
selection in corporate bond trading reasonably well.
Rule 144A debt has peculiarities. Bolton, Santos, and Scheinkman (2012) argue that the
disclosure exemption in the “dark” markets such as 144A allows informed “qualified” institutional
investors to exploit their information advantage. They explain that shadow financial sector exists
because they prevent dissemination of valuable information about asset values, and hence cream-
skim most valuable assets away from public, transparent, exchanges in turn leading to reduced
access of retail investors to the most lucrative investments. In terms of improving the post-
registration transparency, 144A debt registration can also be resemble “going public” exercise
using debt. However, the major difference of the 144A registration is that it doesn’t involve any
effective changes in firm’s funding or leverage. This factor helps our identification, separating our
study from previous studies on the information effects of bond IPOs (e.g., Datta, Datta and Patel
1997, 1999, 2000; Cai, Helwege and Warga 2007; Datta, Datta and Raman 2000).
Overall, our finding of positive effects of public disclosure on the corporate bond liquidity
is consistent with previous empirical evidence that information transparency generally improves
market liquidity.
2.2 Studies on Corporate Bond Market Liquidity
Our study also brings a new empirical angle toward the understanding of the corporate
bond market liquidity, a research area that has drawn growing attention in recent years. Previous
studies have examined the role of trading opacity and market fragmentation in the corporate bond
market liquidity. For example, in terms of trading opacity, studies find that TRACE dissemination
of transaction information results in lower transaction costs (e.g., Bessembinder, Maxwell, and
Venkataraman 2006, Edwards, Harris and Piwowar 2007, Goldstein and Hotchkiss 2007, and
Goldstein, Hotchkiss and Sirri 2007).9 Similarly, Green, Hollifield, and Schurhoff (2007a, 2007b)
and Green, Li and Schurhoff (2011) find positive effects of trade dissemination on transaction
9 Specifically, Bessembinder, Maxwell and Venkataraman (2006) report a 50% reduction in institutional trade
execution costs upon introduction of TRACE for bonds eligible for TRACE transaction reporting, in addition to a
liquidity externality of another 20% reduction of trade execution costs for non-TRACE bonds. Goldstein, Hotchkiss
and Sirri (2007) finds that enhanced transparency is not associated with greater trading volume, which is consistent
with our findings.
9
information in the municipal bond market. In terms of market fragmentation, Huang, Sun, Yao
and Yu (2015) show that liquidity clienteles affect corporate bond prices, and specifically, both
the level and volatility of liquidity premia are substantially attenuated among corporate bonds
heavily held by investors with a weak preference for liquidity. Recent studies also debate on
whether bond market liquidity increases or not in recent years following the recent financial crisis
and post-crisis regulations including the Volcker Rule and Dodd-Frank Act (e.g., Adrian, Fleming,
Shachar and Vogt 2105, Trebbi and Xiao 2015, Bao, O’Hara and Zhou 2016, Dick-Nielsen and
Rossi 2016, Anderson and Stulz 2017).
2.3 Studies on 144A securities
Our paper also complements existing studies on 144A securities by focusing on the
liquidity effects of information transparency on corporate financial conditions brought by public
registration of private debt. Previous studies on 144A corporate bonds generally examine their
yield premium compared to public bonds. For example, in an earlier study, Fenn (2000) documents
that among high-yield issuers between 1996 and 1997, yield premium for 144A bonds relative to
their public counterparts vanishes over time before registration so that registration does not have
much information value. Follow-up studies expand the data to include investment-grade issues and
draw different conclusions regarding yield premium of private issues. These studies find that Rule
144A debt on average has higher yield than their public counterparts (e.g., Livingston and Zhou
2002, Chaplinsky and Ramchand 2004, Craig 2012).
The majority of above studies conjecture that investors in 144A bonds generally require
higher yield because of lower liquidity and higher degree of information opaqueness in the private
debt market. Our paper is the first to provide direct evidence on the liquidity factor. Because our
liquidity measure is based on intra-day transaction data at the dealer-bond level, we provide a more
accurate proxy for trading cost. In addition, our DID approach better helps identify the information
disclosure effects from other factors that may potentially be associated with the changes in
liquidity conditions.
Our paper also relates to corporate finance studies on the 144A securities market examining
the choice between public bonds and 144A private issuance. These include, for example, the 144A
debt issuance by foreign firms where 144A market is fast replacing the public debt market for high
yield and non-rated international issues (e.g., Miller and Puthenpurackal 2002, Huang and Ramirez
10
2010, Gao 2011, Huang, Kalimipalli, Nayak and Ramchand 2016), and the role of corporate
governance, market timing, and market competition in the decision of public vs. private debt or
equity financing (Arena and Howe 2009, Barry, Mann, Mihov, and Rodríguez 2008). The
empirical evidence is broadly consistent with the notion that costs associated with mandatory
disclosure regulation have an economically significant impact on the financing choice between
public and private financing.
Our paper complements a recent study on 144A securitized (collateralized) securities by
Hollifield, Neklyudov and Spatt (2014), who also examine market liquidity using transaction data.
Their focus is the role of dealers in a network setting in liquidity provision, and they find that
central dealers receive relatively lower spreads than peripheral dealers, with the centrality discount
stronger for 144A securitizations.
3. Data and Sampling
3.1 Rule 144A Bonds in TRACE and FISD
Our study focuses on the 144A bond issues that are subsequently registered as public
bonds. We use Mergent’s Fixed Income Securities Database (FISD) and the Trade Reporting and
Compliance Engine (TRACE) to construct our initial sample. To start, we use FISD’s 144A
indicator to extract the corporate 144A bonds issued from 1990 (the inception of Rule 144A bonds)
to 2013. We then examine 144A bond trading using transaction level data provided by the FINRA
using the regulatory version of the TRACE data. Our TRACE data covers the period of July, 2002
to February, 2013, and contains corporate bond transactions for both publicly and non-publicly
disseminated bonds; the latter include144A bonds which were issued to QIBs.10
We follow Dick-Nielsen (2009) and Dick-Nielsen et al. (2012) to filter the raw TRACE
data for cancelled trades, erroneous entries, reversals, duplicated reports, as well as trades with
non-positive prices or non-positive volumes. We present the summary statistics of the final 144A
TRACE data in Table 1. Panel A of Table I lists the number of bond issues classified into 144A
10 FINRA began to release to the public Rule 144A transactions on June 30, 2014. However, the public version of
TRACE has a very limited coverage of Rule 144A transactions for earlier years as of 2015. In addition, the regulatory
version of TRACE contains dealer ids which are necessary to construct our liquidity measures. To ensure accuracy,
we double check the TRACE 144A bonds with those from FISD.
11
and non-144A categories using the 144A flag in the TRACE data. We observe that during the 2002
to 2013 sample period, 12% to 23% of bonds traded each year in the market are 144A bonds. In
our entire secondary trading sample of TRACE data, there are 26,716 unique issues, or 16% of all
bonds, that are issued as 144A bonds. Panel A of Table 1 indicates that 144A bonds is a significant
portion of the bond universe in TRACE.
[Table I about here.]
We rely on FISD for bond characteristics. Intersecting FISD with TRACE bonds in Panel
A of Table I based on issue CUSIP and restricting bond issuers to be corporations domiciling in
U.S. leaves us with 11,443 Rule 144A bond issues from 3,528 issuers. Panel B of Table I lists the
number of these bonds by their origination year. We observe that 144A bonds with reported trades
in TRACE during 2002-2013 are mostly issued during those years or slightly prior to year 2002.
Panel C of Table I shows the primary market bond characteristics of the TRACE-FISD
Rule 144A bonds. While most bonds are non-convertible, non-puttable and non-secured, more
than half of the issues are callable. The average offering maturity of these bonds is 7.57 years, or
medium to long-term.
3.2 Public Registration of Ru1e 144A Bonds
Previous studies, such as Livingston and Zhou (2002) and Huang and Ramirez (2010),
search company filings in EDGAR to identify subsequent registration of 144A bonds. We instead
mainly use a matching sample approach to identify 144A registration events. The information on
the 144A registration rights clause or the exercise of the rights is not readily available. However,
Rule 144A securities become registered mostly through an exchange offer in which the debtor
issues registered public securities (with a new CUSIP) to tender for the 144A securities.11 The
prospectus for the 144A issues typically states that the new bonds issued pursuant to such an offer
will be substantially identical to the 144A bonds for which they may be exchanged in several
attributes, such as coupon rate, maturity date, security (collateral), and restrictive covenants.
Therefore, for every 144A bond, we search the FISD database to see if we can find a public bond
that matches key characteristics of the 144A bond, and we treat the matched bond as the
11 An alternative, but seldom used, procedure is to register the 144A bonds using a shelf registration. Comparing to
the exchange offer approach, the shelf registration can be more burdensome to the issuers because the likely holders
of securities at the future date of the registration must be included in the prospectus—a requirement that makes it
onerous for a broader investor base in the longer run.

12
corresponding registered bonds and its issuance date as the registration date.
Specifically, our matching criteria are as follows: (i) the public bond is issued by the same
borrower zero day to five years (inclusive) after the date of the 144A issuance; (ii) the difference
in the dates of maturity of the two bonds is no greater than 30 days; iii) the difference in the offering
amount of the two bonds is no greater than 5 percent; (iv) the two bonds have the same coupon
rate and same coupon type (fixed or variable);12 (v) the two bonds have the same security condition
(secured or not); and (vi) the two bonds have the same “straight” characteristic (straight bond or
not, where straight bond is defined as non-convertible, non-puttable, and non-callable). From Panel
C of Table I, we note that 10% of the 144A bonds are secured and 41% of the 144A bonds are
straight.
The matching process yields 2,749 bonds for the universe of 11,443 bonds in Panel B of
Table I, i.e., about 25% of the TRACE-FISD 144A bonds are subsequently registered. This
percentage is in line with 30% reported in Craig (2012) and 40% of investment grade bonds
reported in Livingston and Zhou (2002), who, unlike us, rely on Thompson SDC, EDGAR filings,
and Bloomberg data to identify registration.13
Panel A of Table II provides the characteristics of the registration. More than 99% of the
matched pairs have exactly the same maturity, and more than 75% (90%) of the matched pairs
have exactly the same (less than 0.1% difference in) the offering amount. The slight differences in
the offering amount in the right tail of the distribution may be due to early payment such as sinking
fund. More than half the registrations take place within half a year of 144A issuance, and more
than 95% of the registrations take place within a year. Even though we allow for five years to
search for potential registration, these results indicate that the registration, if any, takes place
quickly.
[Table II about here.]
Figure 1 shows the number of registrations by year. Before 1996, registrations were scant
(partly due to the lack of Rule 144A bonds). The number of registrations increased steadily since
12 We impose condition iv) because maintaining the same coupon rate is one motivation for Rule 144A bonds to be
registered. Livingston and Zhou (2002) document that for Rule 144A bonds with the registration-rights clause, a
failure to register would in most cases result in an increase in the coupon rate, and hence issuers are motivated to
register the bond to avoid the increase of coupon rate when a registration-rights clause exists. 13 Some authors report that for subsets of 144A bonds, the registration rate is much higher. For example, Huang and
Ramirez (2000) document that the registration rate for all 144A convertible debt issues is about 88% for the sample
period of 1996 to 2004. Note that in Panel C of Table I we identify that convertible debt issues only consists of 10%
of all domestic 144A debt issues for our sample period.
13
1996, only to peak in 2003 to reach 412 registrations. The recent financial crisis only deterred
registration briefly in 2008, and registration activities since 2009 returned to normal level
comparable with previous periods. We also note that there are far fewer registration events before
the TRACE availability year of 2002. There are 2,487 or 90% of the registrations on or after 2002.
Therefore, it is suitable to use TRACE data to examine the effect of registration.
[Figure 1 about here.]
We provide further validation of the registration events identified above by examining the
EDGAR filings of the registered bonds. Specifically, we employ machine searching of bond
prospectuses to ensure that the matched procedure that we used above indeed produces registered
bonds of 144As. In registering a public bond for the 144A bond, the issuer makes an exchange
offer. To prepare key words for machine reading, we first read a number of bond prospectuses. We
note that the following four phrases appear frequently in the exchange-offer prospectuses: “offer
to exchange”, “exchange offer”, “exchange note”, “to exchange.” We hence count the number of
appearance of these phrases in bond prospectuses to verify that the pairs that we identified in Table
II are indeed 144As and their exchange offers.
Out of the 2,749 matched bond pairs, we are able to download 1,150 prospectuses from the
SEC’s EDGAR website for those issues that we can calculate the bid-ask spread measure of round-
trip cost (to be elaborated in the next section).14 Panel B of Table II provides the summary statistics
of the above key words in these prospectuses. 98.2% (99.7%) of the prospectuses contains at least
fifty (five) occurrences of the aforementioned exchange-related phrases; and the minimum number
of occurrences of those key words in a prospectus is four times. Out of the four key phrases,
perhaps not surprisingly, “exchange offer” and “exchange note” make the most frequent
appearance, each appearing on average 100 or more times in a prospectus. These results suggest
that our filtering of 144A registration is highly effective. We keep all of the matched pairs in our
sample, but note that our results are robust to excluding the registered issues whose prospectuses
have fewer than fifty occurrences of the exchange-related phrases.
In untabulated results, we also investigate whether there is a change of registration
activities after 2008 (inclusive), since year 2008 witnessed not only the financial crisis, but also a
regulatory reform on Rule 144A debt. Prior to 2008, non-affiliate QIBs (i.e., QIBs that are not in
a relationship of control with the issuer) can freely trade 144As after a two-year holding period
14 These prospectuses appear in the form of 424 or S-4.

14
when the bond issuers meet certain public-information disclosure requirement. After 2008, the
SEC halved the holding period to one year, and all the disclosure requirements are lifted. In other
words, after 2008 non-affiliate QIBs only need to hold 144A bonds for a year before they can
freely resell the bond to anyone. Such regulatory change may also affect how market accepts 144A
bonds. In our sample, post 2008, there are 2,887 144A offerings; out of which, 855, or 29.6% of
144As are subsequently registered. Out of that sample, time to registration has a higher median
value of 0.56 years. Hence, there is no discernible difference in the registration rate before and
after 2008.
3.3 Liquidity Cost Measures
Our research goal is to investigate the impact of financial information disclosure of bond
issues on the liquidity cost of trading as these bonds transfer from 144A to public bonds. Among
the prevailing bond trading liquidity measures, the most relevant and suited to our empirical
enquiry is DRT (dealer round-trip) liquidity measure used in Goldstein et al. (2007). The DRT
metric is based on transaction prices of opposite sides of trades matched by the same dealer and
the same trading volume.Hence we construct a “round-trip cost” measure of liquidity (RTC) as
follows and develop our main results of liquidity cost comparison before and after 144A bonds’
public registration based on this RTC measure. We will discuss results using other bond trading
liquidity measures in Section 5 under further robustness checks.
For each bond in our sample, we search for matched trading pairs within the same day for
the same dealer15 and the same trading volume at the opposite trading sides, taking only dealer to
customer trades into consideration. That is, for each trade in which a customer sells (buys) a bond
to a dealer, we attempt to find a subsequent trade in which the same dealer sells (buys) the bond
with the same amount to another customer within the same day. If we find such a pair, we estimate
the bid-ask spread that the dealer charges to the customers as the difference between the pair of
buy-sell prices.16 Formally, we define this “round-trip cost” (RTC), for each pair of trades as:
𝑅𝑇𝐶 =𝑃𝑎𝑠𝑘 − 𝑃𝑏𝑖𝑑
100
15 To construct such dealer-specific liquidity cost measure, we need dealer ID information for each trades, which is
provided by FINRA to Federal Reserve as part of the regulatory version of TRACE data. 16 In case there are multiple trades that match the original trade in terms of trading volume, trading parties (dealer),
trading sides, and trading day, we select the trade with the closest transaction time.
15
where 𝑃𝑎𝑠𝑘 (𝑃𝑏𝑖𝑑) is the ask (bid) price per $100 par. We define normalized version of liquidity
cost RCT_pct as 𝑃𝑎𝑠𝑘−𝑃𝑏𝑖𝑑
(𝑃𝑎𝑠𝑘+𝑃𝑏𝑖𝑑)/2 . This round-trip cost measure is essentially the bid-ask spread
charged by the same dealer implied from the buy and sell transactions intermediated by the specific
dealer at a specific trading volume. Larger RTC indicates worse liquidity, or equivalently, larger
transaction cost for trading the bond.
We take simple average to aggregate the RTC measures by trading day, bond, and/or
dealer. For example, for each bond and dealer pair, we calculate daily RTC as the average of the
RTCs of all pairs of trades we could identify for the dealer. Daily RTC for each bond is then
averaged across dealers and used as the sample liquidity measure. Clearly, the availability of RTC
depends on whether there exist at least two opposite-side trades on the same bond with the same
volume intermediated by the same dealer on the same day. Although in calculating RTC we do not
cover all of the transactions by disregarding trades without following off-setting same-day trades
by the same dealer, it is known common practice in bond market that dealers do cover the trades
within a short-time period if they are pure market makers.17
Using RTC has advantages in our setting. One advantage of using RTC measure is that we
can separate transactions with different trading volumes while calculating liquidity costs of trade.
As well-documented in bond liquidity literature, unlike stock trading, large trading size is most
likely associated with small transaction cost. With 144A bonds’ public registration, retail investors
begin to trade these bonds, so naturally the average trading size will become smaller after
registration, causing larger transaction costs per trade, if we do not control away the trading size
change. Figure 2 shows histogram of trading size distribution before and after registration. Clearly
after registration, larger percentage of trades have transaction size lower than $1mil. We also
observe such change is more significant since 2010, may be due to some regulation changes that
affect bond trading. In contrast to RTC which requires two sides of trade must have the same
trading volume, some other common liquidity measures, such as Roll’s measure, and measures
based on price dispersion such as half-spreads or min-max spreads, all pool transactions with
different trading volumes together while calculating liquidity. The price impact measure of
liquidity, Amihud measure, although commonly used in equity market hasbeen criticized for
17 Roll’s measure, requiring at least three trades on the same bond within the day, is another widely used liquidity
measure. In contrast, RTC requires at minimum two trades.
16
measuring bond liquidity, as it employs trading size as the denominator. So these other measures
of liquidity have potential to overestimate the illiquidity costs post-registration due to subdued
trading activity arising from small transactions, rendering them less suitable for our study.
[Figure 2 about here.]
Another advantage of choosing RTC as the liquidity measure is that in general, it is less
contaminated by intra-day price volatility although during very volatile days, fundamental price
movements may also affect RTC. The impact of volatility on RTC measured is likely to be smaller
compared to other liquidity measures.
3.4 Sample Correlations
We use 100 trading days around registration as our primary event window. For the 2,487
matched registered bonds after 2002, we are able to calculate the round-trip-cost of 1,734 bond
pairs, or more than two thirds of the sample. Table III shows the correlations among the major
variables used in the paper. The registration indicator variable, post, which takes the value of zero
(one) for the transaction time before (post and including) registration, is negatively correlated with
RTC. The variable post is also negatively correlated with yield. The table also reports that,
consistent with conventional wisdom, RTC is negatively correlated with bond offering amount,
firm size, and whether the issuing firm is a public firm or not, and is positively correlated with
firm’s leverage and stock return volatility. These results suggest that dealers provide liquidity to
high information asymmetry issues.
[Table III about here.]
4. Empirical Analysis on 144A Bond Liquidity Around Registration
4.1 Overview of Liquidity Change around Registration
We first examine RTC changes around registration by applying traditional mean-of-mean
approach in event studies. For example, in the comparison of RTC liquidity measures, we take the
mean values of the RTC for each bond-pair, respectively, during specific window periods before
and after the registration, and then average over the mean values of all bonds. This way, each bond
has an equal weight regardless of its trading frequency. Panel A of Table IV offers the comparison
of RTC pre- and post-registration. It shows that RTC decreases after registration regardless of event
17
time window. From windows 30 to 100 days, the differences of RTC and RCT_pct pre- and post-
registration are all significant, and the reduction of RTC ranges from 12 to24%, which is
economically significant.
[Table IV about here.]
The last columns of Panel A of Table IV compares the trade size before and after the
registration, and shows that the average trade size drops after registration, echoing the trading size
distribution in Figure 2. This prompts us to examine the change in RTC conditional on trade size.
Based on trading volume and prevalent bond credit ratings, we partition transactions into three size
groups: Large, Medium, and Small. Transactions with par-value volume larger or equal to $5
million ($1 million) of an investment grade (high-yield or non-rated) bond belong to the “Large”
group; transactions with volume smaller than $100,000 belong to the “Small” group; and the rest
of the transactions are classified into the “Medium” group. After the partition, within each size
group, we re-calculate the RTC liquidity measures as we do for the full sample. Panel B of Table
IV shows that large trades dominate the sample, accounting for around two thirds of the trade
observations. Small trades account for less than 10% of the trades. Noticeably, the reduction of
RTC post-registration occurs mostly for the large trade-size group, and less conspicuously for the
medium trade-size group.
Figure 3 visualizes the decrease of RTC after registration by plotting the average RTC
measures across bonds along [-100,100] trading day window around the registration date, using
only the “Large” transactions in the sample. Plots of other liquidity measures that we checked,
such as Roll’s measure, half-spreads, also demonstrate similar patterns within the “Large”
transaction group, but no obvious change is identified for “Small” transaction group, as transaction
size may intervene with liquidity cost reduction.
[Figure 3 about here.]
4.2 Baseline Regressions of RTC
We then test the univariate results above in regressions that control for both bond cross-
sectional characteristics variables and time-varying macroeconomic variables. In examining the
change of RTC following the public registration, we employ the following baseline regression
specification based on the extant bond liquidity literature:
18
RTCi,t = α + β0 posti + β1 (issue-characteristics)i,t + β2 (firm-characteristics)i,t
+ β3 (aggregate variables)i,t +errori,t (1)
for a given bond issue i at day t. The dependent variables are either of two liquidity measures i.e.
RTC or RTC_pct, and that β1, β2, and β3 refer to regressions coefficients. Our main focus in
Equation (1) is post, the registration indicator. Other regression covariates consist of issue-specific
attributes (offering amount, time to registration, maturity, ratings, and callability dummy), issuer-
specific characteristics (whether the firm is a public firm or not, firm-size, leverage, idiosyncratic
stock return volatility), 18 and aggregate bond market credit and liquidity risk factors (term-
structure slope, default, funding liquidity, and VIX). We control for year fixed effects and
clustering effects by issuer and employ heteroscedasticy adjustments in all regressions. Equation
(1) is our baseline regression to evaluate the effects of registration.
Models (1) and (5) present the results for RTC and RTC_pct, respectively, using bond
transactions 100-days around registration. They first confirm the casual correlation results that we
reported earlier that RTC is negatively related to bond offering amount, firm size and credit rating,
and positively related to stock return volatility, reflecting the conventional wisdom that higher-
quality issue or issuer has better liquidity. Consistent with Table IV, we note that post is negatively
related to RTC and RTC_pct. After controlling for issue- and issuer-specific characteristics and the
macro variables, the effect of post on RTC is economically significant. Registration of 144A debt
reduces RTC by 0.02 (Models 5 and 7), or about 8% of its pre-registration level. The loading of
post on RTC_pct is however not significant. In untabulated results wefind that post is significantly
and negatively related to RTC_pct when we only control for the macro variables and issue- or
issuer-characteristics. Thus, it appears that the insignificance of post on RTC_pct in Table V is
caused by potential multicollinearity.
[Table V about here.]
4.3 DID Analysis: the Impact of Information Asymmetry to Bond Liquidity
The results above show that overall, there is a reduction of liquidity cost in trading after a
144A bond becomes public registered. However, these findings on the changes in trading liquidity
18 56% of the observations are from private firms and therefore will have missing values for issuer-specific
characteristics. To preserve observations, private issuer characteristics are set to zero. Results are qualitatively the
same otherwise.
19
around the public registration may be attributable to factors other than changes in information
environment regarding the 144A issuer’s financial conditions. We take comfort in that 144A public
registrations are not associated with capital structure and funding changes, because new public
bonds offered to tender the existing 144A bonds are identical to the tendered bonds except the
restricted securities legend. Even so, other factors, such as market conditions, trading information
transparency regulated by FINRA TRACE reporting requirement, may change around the
registrations and in turn affect bond liquidity.
To pin down the impact of financial information disclosure to liquidity cost, we use a
difference-in-differences (DID) approach to identify the liquidity change caused by enhanced
financial information disclosure. We conduct three sets of DID analysis in this section. In our first
two DID tests, we contrast the change in trading liquidity of bonds that more likely experience
changes in information environment with that of other control bonds. The premise is that if the
information disclosure matters for trading liquidity, then the public registration effects should be
stronger among issuers with greater information risk pre-registration. Our hypothesis is that the
RTC measure of bid-ask spread decreases more for firms with high information asymmetry pre-
public registrations. The findings would suggest that increased corporate information associated
with public registration improve the market liquidity of OTC securities.
First, focusing on the 144A bonds experiencing public registrations, we contrast those
issued by firms with public securities with those by private firms. Because public firms disclose
regularly their financial conditions, public registrations of their 144A bonds may have relatively
less information content, comparedto 144A registrations of private firms. Second, we use an issue-
specific proxy for the extent of possible changes in information risk. Specifically, we use word
count or file size of bond prospectus as alternative proxy for ex-ante information asymmetry
associated with public registration. The information obfuscation theory postulated by Bloomfield
(2002) states that issuers tend to hide adverse information through lengthy filings. Recent studies
on 10-K filings and debt and equity IPO prospectuses generally support this notion (e.g., Li 2008,
You and Zhang 2009, Loughran and McDonald 2013, and Ertugrul et al. 2015). Third, we construct
a matched sample of public (non-144A) bonds as our control group. For each 144A bond
experiencing public registration, we find a public bond with same industry, credit rating,
callability, remaining bond maturity, and bond issue size. We then compare the changes in their
trading liquidity around the registration event.Our third DID analysis employs a matched sample
20
approach to check if our identified changes is due to contemporaneous market changes rather than
the bond registration itself.
4.3.1 DID Results on Information Asymmetry: Public vs. Private Firms
Our focus is on the information asymmetry effects of the registration. As previously
discussed, we first differentiate bonds issued by public and private firms. Public firms, via their
SEC-mandated information disclosures, have less degree of information asymmetry to investors
relative to private firms. A large fraction of US 144A bonds are issued by private firms. Earlier we
showed that intersecting FISD with TRACE leaves us with 11,443 US 144A bond issues from
3,528 issuers (Table I); a further intersecting with Compustat reduces the universe to 3,835 issues
from 1,573 issuers. In other words, only about 35% of 144As are issued by public firms. In our
registration sample of 2,487 matched bond pairs, we find that only 55% are issued by public firms.
To examine whether information asymmetry is a channel for the effect of registration on
liquidity, we focus on the interaction term of post times one of our information asymmetry
measures. Models (2) and (6) of Table V present the results using public, our public firm dummy,
as the information asymmetry measure. We note that the interaction term, post_x_public, loads
positively on liquidity measures of RTC and RTC_pct. Recall our earlier results that bond
registration per se leads to reduction in RTC. Models (2) and (6) of Table V indicate that the
reduction in RTC through bond registration is weaker (stronger) in public (private) issuers. The
overall reduction in the bid-ask spread in the event of registration of RTC is moderated by public-
issuer—in fact, the net reduction of RTC via post for public-issuers, which equals the sum of
coefficients of post and post_x_public, is close to zero or slightly positive, suggesting that the
reduction in RTC takes place mostly in private issuers. We note similar results for RTC_pct. Hence,
Models (2) and (6) of Table V provide evidence for the role of information asymmetry via private
firm as a channel for the effect of 144A registration on liquidity.
4.3.2 DID results on Information Asymmetry: Bond Prospectuses
In the previous section, the measure public captures the issuer-level of information
asymmetry but not the granular issue level. The challenge of the latter lies in the fact that about
half of the bonds are issued by private issuers. One way to get information about the issuer and
issue by the private issuer is through bond prospectus. A growing literature examines how firms
21
disclose the information in their financial reports such as 10-Ks and prospectuses such as IPO
prospectuses. Li (2008) finds that 10-K reports are harder to read when earnings are lower; and
You and Zhang (2009) find that more complex 10-Ks have a delayed investor reaction to 10-K
filings over the 12 months following the filing date. Recently, Ertugrul et al. (2015) investigate the
impact of a firm’s 10-K readability and ambiguous tone on its borrowing costs of bank loans, and
find that firms with larger 10-K file sizes and a higher proportion of uncertain and weak modal
words in 10-Ks have stricter loan contract terms and greater future stock price crash risk. In the
equity IPO setting, Loughran and McDonald (2013) examine the tone of initial IPO prospectus
and find the uncertain language makes it more difficult for investors to precisely assimilate the
value-relevant information. The literature generally suggests that disclosure documents that are
longer or contain more uncertain words are more difficult to read and interpret. The inherent idea
is “information obfuscation,” where it is postulated that issuers tend to hide adverse information
through lengthy filings (Bloomfield, 2002).
Consistent with the above literature, we use the following three dimensions of prospectus
to measure ex-ante information asymmetry of a public issue: the logarithm of the total number of
word count of the prospectus (log_wc), the logarithm of the total number of “uncertainty” word
count of the prospectus (log_wc_unc), and the logarithm of file size (log_fsize). 19 Based on the
extant literature, larger values of these measures indicate higher degree of information asymmetry.
It should be noted that these prospectus metrics serve as information asymmetry gauge for firms
that are already in the disclosure category. They allow us to differentiate, in an ex ante sense, the
level of information asymmetry among the issuers. As discussed earlier, we downloaded 1,150
bond prospectuses for bonds that we can calculate RTC, and calculate these prospectus measures.
Models (3)-(4) and (7)-(8) of Table V present the information asymmetry results using
log_wc. We first verify in Models (3) and (7) that log_wc is positively related to RTC and RTC_pct;
that is, higher information asymmetry, as proxied by larger values of log_wc, induces larger bond
bid-ask spreads. For our focus of interaction variable between post and log_wc, we note that it
loads negatively on liquidity measures of RTC and RTC_pct. These results are consistent with
those with public, in that they both indicate that bid-ask spread decreases more for high-
information asymmetry issues. The coefficient estimates of the post and log_wc interaction term
19 The “uncertainty” word list is from Loughran and McDonald (2011). File size is in kilobytes. In measuring the file
size, all prospectuses are converted to text file.

22
(post_x_log_wc) is about the same as those of log_wc, indicating that the information asymmetry
effect of registration is about the same as the main information asymmetry effect itself. Thus, the
evidence suggests that the channel of information asymmetry is an important consideration in the
reduction of bid-ask spread in Rule 144A bond registrations.
4.3.3 DID Results Using a Matched-Sample Approach
Our results above refer to the same bond undergoing a registration event. However, these
results may be due to contemporaneous market changes rather than the bond registration itself. To
further identify that our results are indeed from the registration event, we construct a control
sample of non-event bond trades (trades from bonds that do not have a registration event) and
compare these to event bond trades. We call the sample used in the previous section the treatment
sample—it contains bond trades for all of registered bonds pre- and post-registration. We construct
the match sample based on the following procedure. First, we select only trades of non-144A-
transformed public bonds, and further restrict that the bond trades have a vintage life of at least
one year (trade date at least one year after the bond issuance date).20 Out of this sample, we then
we select a control bond-month for each treatment bond-month based on the following criteria: (i)
the control issue and the treatment issue must have at least one bond transaction during the same
month; (ii) they must have the same average rounded credit rating using the ratings from the three
rating agencies during the month; (iii) they must be matched on callability; (iv) the issuers of the
control and treatment issues must be from the same industry group (either industrial, finance, or
utility); and (iv) the control issue should be the most similar, in terms of bond maturity at
transaction time and offer amount, to the treatment issue, based on an aggregated decile rank for
each of these dimensions. We pick only the non-duplicate control bond-month. In summary, we
form a control sample that is matched on transaction month, current credit rating, callability,
industry, remaining bond maturity, and bond issue size.
Following the above procedure, we identify the control issue-month for each treatment
issue-month, where “treatment” refers to the 144A-registration sample used earlier. We then
aggregate variables of both treatment and control issues at the monthly level and evaluate the
20 The second condition ensures that even if, in the not-too-likely scenario, the public bond that we chose may be from
a Rule 144A exchange-issue that we failed to identify, the trade time has well passed the registration date, and the
effect of its registration should be sufficiently small.

23
differences of variables before and after the registration of the treatment issue. We employ a
standard difference-in-difference approach: the first level of difference is the value of the variable
of the treatment issue-month minus the value of the variable of the control issue-month, and the
second level of difference is the difference of the first level differences before and after the
registration event.
Panel A of Table VI reports the univariate statistics of liquidity differences for our baseline
sample. Prior to registration, we observe that RTC and RTC_pct differences tend to be negative,
indicating that Rule 144A issues have higher bid-ask spread than the match public bonds. These
results are consistent with the extant literature (e.g., Fenn 2000, Huang et al. 2017). After the
registration, the differences of the above variables all become smaller; RTC (RTC_pct) difference
decreases from -0.14 (-0.17) before registration to -0.17 (-0.22) after registration. Thus, compared
to a control group, registration leads to reduction in RTC. These results corroborate the patterns
that we identified in Table V.
[Table VI about here.]
Panel B of Table VI further reports the difference-in-difference regression results. We
regress the first-level difference of the variable of interest on the registration event variable post.
Consistent with Table V, we observe that post significantly and negatively loads on both RTC and
RTC_pct. Hence, the univariate results in Panel A are corroborated with multivariate controls of
issue- and issuer-traits and macro variables. In sum, Table VI further confirms the information
disclosure impact on liquidity in private debt registrations.
5 Robustness Checks and Discussion
5.1 Robustness Checks
We carry out a number of robustness checks. First, Panel A of Table VII uses the alternative
illiquidity measures of half spreads. The half spread measures break bid-ask spread into the bid
and ask sides. We define halfsprd_bid (halfsprd_ask) as the difference between the mean bond
prices from trades where customers sell (buy) the bond to (from) dealers and the mean bond prices
from interdealer trades, normalized by the mean price in interdealer trades. This measure does not
require transaction mapping to the same dealers or same trading volume, and is therefore less
restrictive. We also construct an Amihud’s (2002) price impact measure that is defined in our
24
context as the percentage change in bond price between two consecutive trades divided by the
dollar trading volume of the first transaction. The results show that for these alternative illiquidity
measures, the interaction term post_x_public remains significantly positive, while post_x_log_wc
remains significantly negative.21
[Table VII about here.]
Panel B of Table VII uses alternative prospectus measures of uncertainty word count and
file size in the regressions of RTC and RTC_pct. Again, we find that both measures load positively,
their interaction terms with post load negatively, and the coefficient estimates on the interaction
terms are about the same magnitude as those of the counterpart prospectus measures. These results
are highly consistent with those of log_wc, and confirm the information asymmetry effect on
liquidity during 144A registration.
Table VIII presents the results with different trade-size groups. We find that post_x_public
remains significantly positive for large and medium trade-size groups, but becomes insignificant
for small trade-size group. Similarly, post_x_log_wc remains significantly negative for large and
medium trade-size groups, but becomes insignificant for small trade-size group. These results echo
the patterns of RTC reduction in Table IV, where we found that the reduction in RTC cluster in
large and medium trade-size groups, which nonetheless account for 90% of all trades.
[Table VIII about here.]
Panel A of Table IX further uses alternative event windows. As suggested in Table IV, we
find trades closely around registration are scant. For example, using 10 days around registration
we are only able to identify 42 Rule 144A-registered bond pairs for our entire sample period;
widening this estimation window to 100 days increases the number of bond pairs to 1,734, or 40
times of more bonds. In untabulated results, we find that trading frequency ramps up to exhibit a
hump shape with the peak at around 50 days after registration. Since there is no “real” issuance of
a new bond, it is plausible that it takes time for public investors to become aware of the exchanged,
registered bond. To test whether the information asymmetry effect is robust to this ramping-up of
trade, we exclude the ramping-up period by using alternative estimation windows that exclude 10,
21 The sign of post on the Amihud price impact measure (Amihud) is significantly positive, which would inadvertently
indicate that liquidity deteriorates per se post registration. We, however, find that this is driven by the dominator of
trade size in Amihud -post registration, the decrease in trade size (documented earlier in Table IV) leads to higher
values of Amihud. Hence, size-related liquidity measures such as Amihud should be interpreted with caution in our
context.
25
20, 30, or 50 days around registration. Panel A of Table IX again confirms that both post_x_public
and post_x_log_wc retain the same significance for these alternative estimation windows.
[Table IX about here.]
Panel B of Table IX presents the results of a potential structural break in 2008. Prior to
2008, non-affiliate (affiliate) QIBs can freely trade 144As after a two- (one-) year holding period
when the bond issuers meet certain public-information disclosure requirement. After 2008, the
SEC halved the holding period to one year, and all the disclosure requirements are removed. We
use a dummy variable for the adoption of the new reform time of Feb. 29, 2008, and interact the
dummy variable with post_x_public and post_x_log_wc, respectively, to form a triple interaction
variable. Panel B shows that the significance of post_x_public and post_x_log_wc on RTC and
RTC_pct remain intact. The triple interaction term of post_x_public and post-2008 dummy is
insignificant; and while the triple interaction term of post_x_log_wc and post-2008 dummy is
significantly negative, as expected, the magnitude of its coefficient estimate is just about one
tenth of that of post_x_log_wc itself. Overall, the results suggest that the 2008 reform has no or
only weak effect to the information asymmetry impact on liquidity in private debt registrations.
5.2 The Effect of Registration on Yield and Bond Returns
We finally examine the pricing effect of registration. We use two proxies for bond pricing:
the bond yield-to-maturity reported by TRACE, and bond returns. Following the literature (e.g.,
Bessembinder, Kahle Maxwell and Xu 2009), we define bond returns as the daily average price
minus the previous daily average price, divided by the previous daily average price times 100; this
ratio is further divided by the number of calendar days between for the two price dates. The bond
return variable thus measures daily returns. The first two columns of Table X presents the
regression results of yield and returns regressed on post for the event windows 100 days, after
controlling for issue- and issuer-specific variables and macro variables. We’ve shown in previous
sections that registration leads to lower bid-ask spread and degree of information asymmetry, and
we hence expect yield and returns to decrease posted registration. As expected, Table X
unequivocally shows that post is significantly negatively related to both yield and returns. The
relation is economically significant too. For example, the registration of 144A debt reduces the
yield by 16 bps, or reduces daily returns by 3 bps. In untabulated results, we can report that the
reduction of yield increases notably as we shorten the estimation window. For example, the
26
reduction increases to 124 bps if we use 20-day estimation window. Also not tabulated, we find
that the yield results also hold for the difference-in-difference sample. Overall, these results
indicate that registration does achieve the desired effect of lowering the price paid by investors.
[Table X about here.]
5.3 Further Discussion: Trading Frequency and Size
Earlier we documented that there is a decrease in trade size post registration. This is
plausibly due to the change of investor base post-registration. Pre-registration traders of 144As
consist of largely QIBs (for short-vintage 144As the only traders are QIBs), which are relatively
large institutional investors. In contrast, post registration the investor base is expanded to include
all public investors. Retail and non-QIB investors likely trade in smaller amounts and less
frequently than do QIBs. While our RTC measures of liquidity only consider the round trip trades
between dealers and customers, retail and non-QIB investors likely account for a much larger part
of customers in the post- versus pre- registration.
The remaining columns in Table X shows the effect of registration in regards to trading
size and trading frequency. We consider two such measures of each bond for the period of 100
days before and after registration: the logarithm of average daily dollar trade size (in $1,000s), and
the percentage of non-zero trading days. We restrict the sample, as before, to one that we can
calculate RTC to main sample consistency, and calculate one value of each measure for the bond
pre- and post-registration, respectively. Table X shows that both measures experience a drop after
registration, consistent with the conjecture that the introduction of retail and non-QIB customers
post registration results in smaller and less frequent trades. These results are consistent with
Goldstein, Hotchkiss and Sirri (2007), who find that enhanced transparency is not associated with
greater trading volume.
6. Summary and Conclusions
Rule 144A debt represents a significant and growing segment of the total U.S. debt market,
and a large portion of 144A debt issues carry registration rights and hence are subsequently publicly
registered. Though 144A debt issuance market has grown substantially over time, little is however
known about the post-registration effects of that market. In this paper, we examine the post-
registration effects of private Rule 144A debt and shed light on how public registration affects the

27
underlying liquidity.
We use broker-dealer’s round-trip-cost (RTC) to measure the underlying liquidity of the
144A bond market. We find that the registration of Rule 144A bonds leads to decreasing trading
costs. Specifically, our results show that on average registration reduces RTC by about 12 percent
of its pre-registration level in 100 days around the registration. Registration lowers bid-ask spread
or equivalently, improves liquidity and lowers transaction costs of trades.
We examine the robustness of our results using a number of difference-in-difference
approaches, by contrasting registered bonds between public and private firms, and between high
and low ex-ante information asymmetry issues as embodied in bond offering prospectuses, and also
by a matched sample of purely public bonds. We find that the registration-related RTC reduction
is larger for issues with higher ex-ante information asymmetry. In addition, the reduction of RTC
is accompanied by reductions in bond yield and returns. Overall our findings suggest
information transparency on corporate financial conditions contributes to better market liquidity of
corporate bonds in the OTC markets.

28
REFERENCES
Adrian, Tobias, Michael Fleming, Or Shachar, and Vogt, Erik, (2015). Has U.S. Corporate Bond Market
Liquidity Deteriorated? Introduction to a Series on Market Liquidity: Part2, FRBNY Blog paper.
Anand, Amber, Paul Irvine, Andy Puckett, and Kumar Venkataraman, (2013). "Institutional Trading and
Stock Resiliency: Evidence from the 2007-2009 Financial Crisis." Journal of Financial
Economics, 108 (3): 773-97.
Anderson, Mike, and René M. Stulz, (2017). Is post-crisis bond liquidity lower? Fisher College of Business
Working Paper Series.
Ang, Andrew, Assaf A. Shtauber and Paul C. Tetlock, (2013). "Asset Pricing in the Dark: The Cross-Section
of OTC Stocks." Review of Financial Studies, 26 (12): 2985-3028.
Arena, Matteo P. and John S. Howe, (2009). "Takeover Exposure, Agency, and the Choice between Private
and Public Debt," Journal of Financial Research, 32(2): 1475-6803.
Barry, C., Mann, S., Mihov, V., Rodríguez, M., (2008). "Corporate debt issuance and the historical level of
interest rates". Financial Management 37, 413–430.
Bao, Jack, Maureen O’Hara, and Alex Zhou,(2016). The Volcker Rule and Market-Making in Times of Stress,
Federel Reserve Board Working paper.
Bessembinder, Hendrik, William Maxwell, and Kumar Venkataraman (2006). "Market Transparency,
Liquidity Externalities, and Institutional Trading Costs in Corporate Bonds." Journal of Financial
Economics, 82 (2): 251-88.
Bolton, Patrick, Tano Santos, and Jose A. Scheinkman, (2012). "Shadow Finance," Working paper, Princeton
University.
Bulsiewicz, James G., (2015). "Institutional Industrial Trades and the Cross-section of Returns." Working
Paper.
Bushee, Brian, and Christian Leuz,(2005). Economic Consequences of SEC Disclosure Regulation: Evidence
from the OTC Bulletin Board, Journal of Accounting and Economics, 39: 233 - 264.
Brüggemann, Ulf, Aditya Kaul, Christian Leuz, Ingrid M. Werner (2013). The Twilight Zone:
OTC Regulatory Regimes and Market Qquality, NBER working paper.
Cai, Fang, Song Han, and Dan Li, (2012). "Institutional herding in the corporate bond market." Working Paper.
Cai, Nianyun, Jean Helwege, Arthur Warga,(2007). "Underpricing in the Corporate Bond Market". Review of
Financial Studies; 20 (6): 2021-2046
Chaplinsky, S., and Ramchand, L. (2004). "The Impact of SEC Rule 144A on Corporate Debt Issuance by
International Firms." Journal of Business, 77, 1073-1098.
Chordia, Tarun, Richard Roll, and Avanidhar Subrahmanyam (2011). "Recent Trends in Trading Activity and
Market Quality." Journal of Financial Economics, 101 (2): 243-63.

29
Craig, Karen Ann (2012). "Liquidity in the 144A Debt Market." Trace: Tennessee Research and Creative
Exchange.
Das, Sanjiv, Madhu Kalimipalli, and Subhankar Nayak (2014). "Did CDS trading improve the market for
corporate bonds?" Journal of Financial Economics, 111 (2): 495-525.
Datta, S., M. Iskandar-Datta, and A. Patel. (1997). The Pricing of Initial Public Offers of Corporate Straight
Debt. Journal of Finance 52:379–96.
Datta, S., Iskandar-Datta, M. and Patel, A.,(1999). The Market's Pricing of Debt IPOs. Journal of Applied
Corporate Finance, 12: 86–91
Datta, S., Iskandar-Datta, M., Patel, A., (2000). "Some evidence on the uniqueness of initial public debt
offerings". Journal of Finance 55 (2).715–743.
Datta, S., Iskandar-Datta, M., Raman K, (2000). "Adjustments and Long-Run Stock Price Performance",
Journal of Financial Intermediation 9, 427–453.
Davis, Ryan L., Bonnie Van Ness and Robert Van Ness 2016, Information and Liquidity in the
Modern OTC Marketplace, SSRN working paper.
Diamond, D. W., and R. E. Verrechia (1991). “Disclosure, Liquidity, and Cost of Capital.” Journal of Finance,
46: 1325–59.
Dick-Nielsen, Jens and Marco Rossi, (2016). The cost of immediacy for corporate bonds, SSRN working
paper.
Duffie, D., D. Lando (2001). “Term Structure of Credit Spreads with Incomplete Accounting Information,”
Econometrica, 69, 633–64.
Duffie, D. (2012). Dark Markets: Asset Pricing and Information Transmission in Over-the-Counter Markets.
Princeton Lectures in Finance.
Easley, David, Soeren Hvidkjaer, and Maureen O'Hara (2002). "Is Information Risk a Determinant of Asset
Returns?" Journal of Finance 57(5): 1540-6261
Ederington, Louis, Wei Guan, and Pradeep K. Yadav (2014). "Dealer Spreads in the Corporate Bond Market:
Agent vs. Market-Making Roles."
Edwards, Amy K., Lawrence E. Harris, And Michael S.Piwowar (2007). "Corporate Bond Market Transaction
Costs and Transparency", Journal of Finance, 62(3): 1540-6261
Fenn, George W. (2000). "Speed of Issuance and the Adequacy of Disclosure in the 144A High-Yield Debt
Market." Journal of Financial Economics, 56 (3): 383-405.
Gao, Yu (2011). "The Sarbanes-Oxley Act and the Choice of Bond Market by Foreign Firms." Journal of
Accounting Research, 49, 933-968.
Glosten, L. and L. Harris (1988) "Estimating the components of the bid/ask spread". Journal of Financial
Economics. 21:123–142.

30
Glosten, L., P. Milgrom (1985). "Bid, ask and transaction prices in a specialist market with heterogeneously
informed traders", Journal of Financial Economics 14, 71–100.
Goldstein, Michael A., Edith S. Hotchkiss, (2007). Dealer behavior and the trading of newly issued corporate
bonds, SSRN Working paper.
Goldstein, Michael A., Edith S. Hotchkiss, and Erik R. Sirri (2007). "Transparency and Liquidity: A Controlled
Experiment on Corporate Bonds". Review of Financial Studies; 20 (2): 235-273.
Green, Richard C., Burton Hollifield, and Norman Schürhoff, (2007a). "Financial Intermediation and the Costs
of Trading in an Opaque Market". Review of Financial Studies, 20 (2): 275-314.
Green, Richard C., Burton Hollifield, and Norman Schurhoff, (2007b). "Dealer Intermediation And Price
Behavior In The Aftermarket For New Bond Issues", Journal of Financial Economics, 86 (3). 643-682.
Green, Richard C., Dan Li, and Norman Schürhoff, (2010). "Price Discovery In Illiquid Markets: Do Financial
Asset Prices Rise Faster Than They Fall?", Journal of Finance 65, 1669–1702.
Greenstone, Michael, Paul Oyer, and Annette Vissing-jorgensen (2006). "Mandated disclosure, stock returns,
and the 1964 Securities Acts Amendments," Quarterly Journal of Economics, 121 (2): 399-460.
Han, Song, and Xing Zhou (2014). "Informed Bond Trading, Corporate Yield Spreads, and Corporate Default
Prediction." Management Science, 60 (3): 675-94.
Harris, Lawrence E, and Michael S. Piwowar (2006). "Secondary Trading Costs in the Municipal Bond
Market." Journal of Finance, 61 (3): 1361-97.
Healy, Paul M., Amy P. Hutton, and Krishna G. Palepu, (1999). "Stock Performance and Intermediation
Changes Surrounding Sustained Increases in Disclosure." Contemporary Accounting Research 16(3).
Hollifield, Burton, Artem Neklyudov, and Chester Spatt (2014). "Bid-Ask Spreads, Trading Networks and the
Pricing of Securitizations: 144a vs. Registered Securitizations." Working Paper.
Huang, A., Kalimipalli, M., Nayak, S., Ramchand, L., (2015). "Pricing of international 144A debt: Evidence
from the U.S. secondary bond market". Unpublished working paper. Wilfrid Laurier University, Waterloo
and NYU–Salomon Research Center.
Huang, A., Kalimipalli, M., Nayak, S., Ramchand, L., (2016). "Private or Public Debt? Effect of Crisis on
Financial Intermediation". Unpublished working paper. Wilfrid Laurier University
Huang, Jing-Zhi, Zhenzhen Sun, Tong Yao, and Tong Yu (2014). "Liquidity Premium in the Eye of the
Beholder: An Analysis of the Clientele Effect in the Corporate Bond Market." SSRN Working Paper.
Huang, Kershen, and Alex Petkevich (2015). "Corporate Bond Pricing and Ownership Heterogeneity." Journal
of Corporate Finance, 36: 54-74.
Huang, Rongbing, and Gabriel G. Ramirez (2010). "Speed of Issuance, Lender Specialization, and the Rise of
the 144A Debt Market." Financial Management, 39 (2): 643-73.
Huang R., and H. Stoll, (1997). "The components of the bid–ask spread: A general approach." Review of

31
Financial Studies, 10:995–1034.
Jiang, J., Petroni, K. R. and Wang, I. Y., (2016). Private Intermediary Innovation and Market Liquidity:
Evidence from the Pink Sheets Market. Contemporary Account Research, 33: 920–948.
Levitt, A. (1998). “The Importance of Transparency in America’s Debt Market,” speech delivered at the Media
Studies Center, New York, September 9.
Leuz, Christian and Robert E. Verrecchia, (2000). "The Economic Consequences of Increased Disclosure",
Journal of Accounting Research, Vol. 38, pp. 91-124
Longstaff, F. A. (1995). "How Much Can Marketability Affect Security Values?" Journal of Finance 50, 1767-
1774
Livingston, Miles, and Zhou Lei (2002). "The Impact of Rule 144A Debt Offerings upon Bond Yields and
Underwriter Fees." Financial Management 31 (4): 5-27.
Madhavan A, Richardson M, Roomans M (1997) "Why do security prices change?" Review of Financial
Studies, 10:1035–1064
Mahanti, Striketan, Amrut Nashikkar, Marti G. Subrahmanyam, George Chacko, and Gaurav Mallik (2008).
"Latent Liquidity: A New Measure of Liquidity, with an Application to Corporate Bonds." Journal of
Financial Economics, 88: 272-98.
Miller, D., Puthenpurackal, J., (2002). "The costs, wealth effects, and determinants of international capital
raising: evidence from public Yankee bonds". Journal of Financial Intermediation 11, 455–485.
Miller, D., Puthenpurackal, J., (2005). "Security fungibility and the cost of capital: evidence from global
bonds." Journal of Financial and Quantitative Analysis 40, 849–872.
Pittman, Jeffrey A., and Steve Fortin (2004). "Auditor Choice and the Cost of Debt Capital for Newly Public
Firms." Journal of Accounting and Economics, 37 (1): 113-36.
Spiegel, Matthew (2008). "Patterns in Cross Market Liquidity." Finance Research Letters, 5 (1): 2-10.
The Impact of Revised Rule 144 on Registration Rights. New York: Cleary Gottlieb.
Tang, Vicki Wei (2012). "Proprietary Costs of Mandatory Disclosure & the Decision to
First Access the Public Market." McDonough School of Business Working Paper, Georgetown
University.
Trebbi, Francesco and Kairong Xiao, (2016). Regulation and Market Liquidity, SSRN working paper.
Zhu, Hui, and Kelly Cai (2014). "Cultural Distance and Bond Pricing: Evidence in the Yankee and Rule 144A
Bond Markets." Journal of Financial Research 37 (3): 357-83.
Yu, F. (2005). “Accounting Transparency and the Term Structure of Credit Spreads,” Journal of Financial
Economics, vol. 75, 53–84.
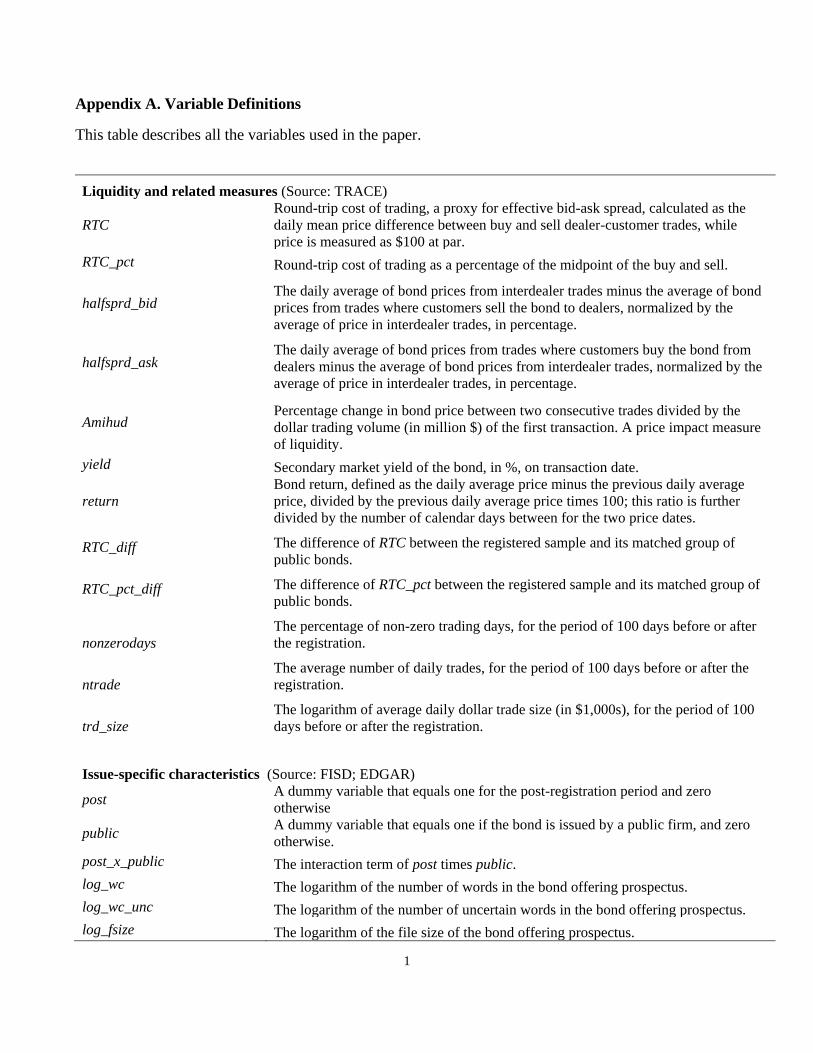
1
Appendix A. Variable Definitions
This table describes all the variables used in the paper.
Liquidity and related measures (Source: TRACE)
RTC
Round-trip cost of trading, a proxy for effective bid-ask spread, calculated as the
daily mean price difference between buy and sell dealer-customer trades, while
price is measured as $100 at par.
RTC_pct Round-trip cost of trading as a percentage of the midpoint of the buy and sell.
halfsprd_bid The daily average of bond prices from interdealer trades minus the average of bond
prices from trades where customers sell the bond to dealers, normalized by the
average of price in interdealer trades, in percentage.
halfsprd_ask The daily average of bond prices from trades where customers buy the bond from
dealers minus the average of bond prices from interdealer trades, normalized by the
average of price in interdealer trades, in percentage.
Amihud Percentage change in bond price between two consecutive trades divided by the
dollar trading volume (in million $) of the first transaction. A price impact measure
of liquidity.
yield Secondary market yield of the bond, in %, on transaction date.
return
Bond return, defined as the daily average price minus the previous daily average
price, divided by the previous daily average price times 100; this ratio is further
divided by the number of calendar days between for the two price dates.
RTC_diff The difference of RTC between the registered sample and its matched group of
public bonds.
RTC_pct_diff The difference of RTC_pct between the registered sample and its matched group of
public bonds.
nonzerodays
The percentage of non-zero trading days, for the period of 100 days before or after
the registration.
ntrade
The average number of daily trades, for the period of 100 days before or after the
registration.
trd_size
The logarithm of average daily dollar trade size (in $1,000s), for the period of 100
days before or after the registration.
Issue-specific characteristics (Source: FISD; EDGAR)
post A dummy variable that equals one for the post-registration period and zero
otherwise
public A dummy variable that equals one if the bond is issued by a public firm, and zero
otherwise.
post_x_public The interaction term of post times public.
log_wc The logarithm of the number of words in the bond offering prospectus.
log_wc_unc The logarithm of the number of uncertain words in the bond offering prospectus.
log_fsize The logarithm of the file size of the bond offering prospectus.

2
post_x_log_wc The interaction variable of post times log_wc.
offer_amt Offering amount of the bond, in millions. In regressions, the variable is
transformed into logarithm.
reg_time The time distance between the 144A bond issuance date and its subsequent
registration date (in years).
maturity Maturity of the bond, in years, either on bond issuance date or on transaction date.
callable A dummy variable that equals one if the bond is callable.
convertible A dummy variable that equals one if the bond is convertible.
puttable A dummy variable that equals one if the bond is puttable.
straight bond A bond that is non-convertible, non-puttable, and non-callable.
secured A dummy variable that equals one if the bond is secured by collateral.
BB
An indicator variable if the bond's credit rating is BB+, BB, and BB- on the
transaction date. Credit ratings by Moody’s, Standard and Poor’s, and Fitch are used
and averaged.
B
An indicator variable if the bond's credit rating is B+, B, and B- on the transaction
date. Credit ratings by Moody’s, Standard and Poor’s, and Fitch are used and
averaged.
CCC_n_below
An indicator variable if the bond's credit rating is CCC+ and below on the
transaction date. Credit ratings by Moody’s, Standard and Poor’s, and Fitch are used
and averaged.
post2008 An indicator variable that equals to one if the bond transaction time is after Feb. 29,
2008, and zero otherwise.
post_x_post2008 The interaction term of post times post2008.
post_x_public_x_post2008 The interaction term of post_x_public times post2008.
post_x_log_wc_x_post2008 The interaction term of post_x_log_wc times post2008.
Issuer-specific characteristics (Sources: COMPUSTAT,CRSP)
firm_size Logarithm of the issuing firm’s market capitalization of the previous three months,
obtained as the product of stock price and shares outstanding.
ltdebt_ratio Ratio of long-term debt to total book value of assets of the previous fiscal year.
iv Idiosyncratic return volatility, computed as standard deviation of residuals from the
application of Fama-French 3-factor model on six months of monthly stock returns
preceding the transaction date.
Aggregate risk variables (Source: Datastream)
term Term-structure factor, obtained as 10-year swap rate minus 2-year swap rate.
def Default factor, obtained as Moody’s BAA yield minus 10-year swap rate.
ted Aggregate liquidity factor, obtained as 30-day LIBOR rate minus 3-month Treasury-
Bill rate.
vix Equity market volatility factor, obtained as VIX index.
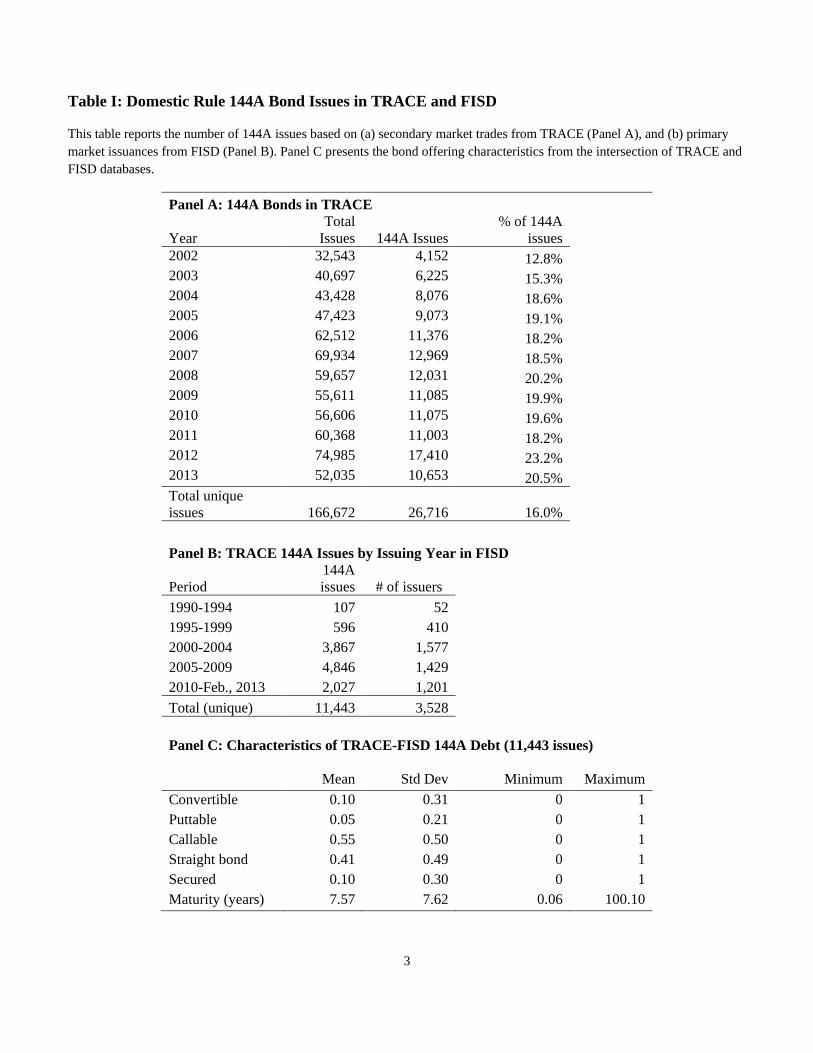
3
Table I: Domestic Rule 144A Bond Issues in TRACE and FISD
This table reports the number of 144A issues based on (a) secondary market trades from TRACE (Panel A), and (b) primary
market issuances from FISD (Panel B). Panel C presents the bond offering characteristics from the intersection of TRACE and
FISD databases.
Panel A: 144A Bonds in TRACE
Year
Total
Issues 144A Issues
% of 144A
issues
2002 32,543 4,152 12.8%
2003 40,697 6,225 15.3%
2004 43,428 8,076 18.6%
2005 47,423 9,073 19.1%
2006 62,512 11,376 18.2%
2007 69,934 12,969 18.5%
2008 59,657 12,031 20.2%
2009 55,611 11,085 19.9%
2010 56,606 11,075 19.6%
2011 60,368 11,003 18.2%
2012 74,985 17,410 23.2%
2013 52,035 10,653 20.5%
Total unique
issues 166,672 26,716 16.0%
Panel B: TRACE 144A Issues by Issuing Year in FISD
Period
144A
issues # of issuers
1990-1994 107 52
1995-1999 596 410
2000-2004 3,867 1,577
2005-2009 4,846 1,429
2010-Feb., 2013 2,027 1,201
Total (unique) 11,443 3,528
Panel C: Characteristics of TRACE-FISD 144A Debt (11,443 issues)
Mean Std Dev Minimum Maximum
Convertible 0.10 0.31 0 1
Puttable 0.05 0.21 0 1
Callable 0.55 0.50 0 1
Straight bond 0.41 0.49 0 1
Secured 0.10 0.30 0 1
Maturity (years) 7.57 7.62 0.06 100.10
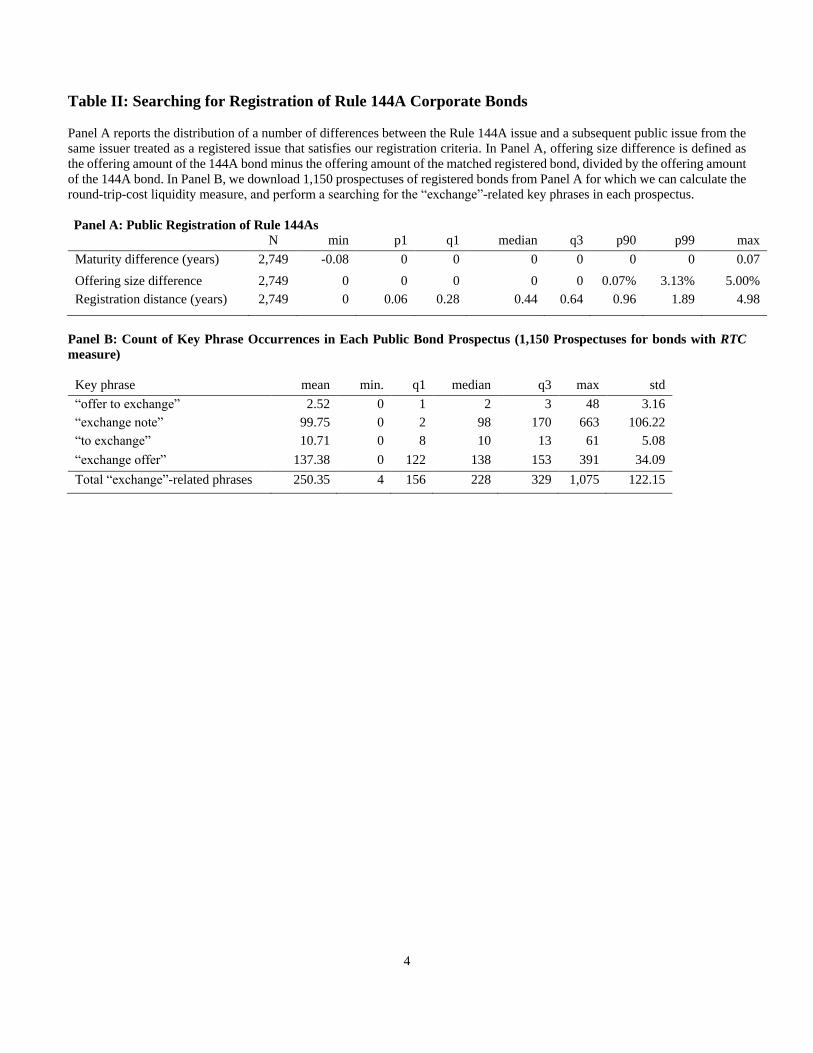
4
Table II: Searching for Registration of Rule 144A Corporate Bonds
Panel A reports the distribution of a number of differences between the Rule 144A issue and a subsequent public issue from the
same issuer treated as a registered issue that satisfies our registration criteria. In Panel A, offering size difference is defined as
the offering amount of the 144A bond minus the offering amount of the matched registered bond, divided by the offering amount
of the 144A bond. In Panel B, we download 1,150 prospectuses of registered bonds from Panel A for which we can calculate the
round-trip-cost liquidity measure, and perform a searching for the “exchange”-related key phrases in each prospectus.
Panel A: Public Registration of Rule 144As N min p1 q1 median q3 p90 p99 max
Maturity difference (years) 2,749 -0.08 0 0 0 0 0 0 0.07
Offering size difference 2,749 0 0 0 0 0 0.07% 3.13% 5.00%
Registration distance (years) 2,749 0 0.06 0.28 0.44 0.64 0.96 1.89 4.98
Panel B: Count of Key Phrase Occurrences in Each Public Bond Prospectus (1,150 Prospectuses for bonds with RTC
measure)
Key phrase mean min. q1 median q3 max std
“offer to exchange” 2.52 0 1 2 3 48 3.16
“exchange note” 99.75 0 2 98 170 663 106.22
“to exchange” 10.71 0 8 10 13 61 5.08
“exchange offer” 137.38 0 122 138 153 391 34.09
Total “exchange”-related phrases 250.35 4 156 228 329 1,075 122.15
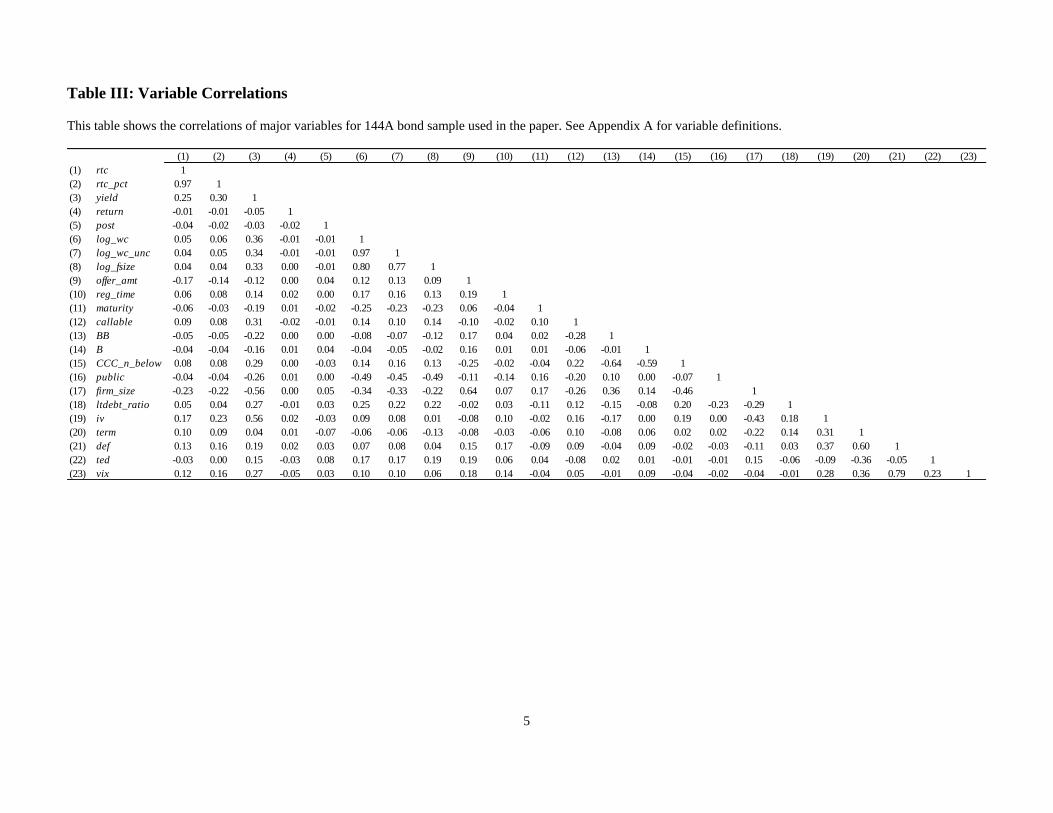
5
Table III: Variable Correlations
This table shows the correlations of major variables for 144A bond sample used in the paper. See Appendix A for variable definitions.
(1) (2) (3) (4) (5) (6) (7) (8) (9) (10) (11) (12) (13) (14) (15) (16) (17) (18) (19) (20) (21) (22) (23)
(1) rtc 1
(2) rtc_pct 0.97 1
(3) yield 0.25 0.30 1
(4) return -0.01 -0.01 -0.05 1
(5) post -0.04 -0.02 -0.03 -0.02 1
(6) log_wc 0.05 0.06 0.36 -0.01 -0.01 1
(7) log_wc_unc 0.04 0.05 0.34 -0.01 -0.01 0.97 1
(8) log_fsize 0.04 0.04 0.33 0.00 -0.01 0.80 0.77 1
(9) offer_amt -0.17 -0.14 -0.12 0.00 0.04 0.12 0.13 0.09 1
(10) reg_time 0.06 0.08 0.14 0.02 0.00 0.17 0.16 0.13 0.19 1
(11) maturity -0.06 -0.03 -0.19 0.01 -0.02 -0.25 -0.23 -0.23 0.06 -0.04 1
(12) callable 0.09 0.08 0.31 -0.02 -0.01 0.14 0.10 0.14 -0.10 -0.02 0.10 1
(13) BB -0.05 -0.05 -0.22 0.00 0.00 -0.08 -0.07 -0.12 0.17 0.04 0.02 -0.28 1
(14) B -0.04 -0.04 -0.16 0.01 0.04 -0.04 -0.05 -0.02 0.16 0.01 0.01 -0.06 -0.01 1
(15) CCC_n_below 0.08 0.08 0.29 0.00 -0.03 0.14 0.16 0.13 -0.25 -0.02 -0.04 0.22 -0.64 -0.59 1
(16) public -0.04 -0.04 -0.26 0.01 0.00 -0.49 -0.45 -0.49 -0.11 -0.14 0.16 -0.20 0.10 0.00 -0.07 1
(17) firm_size -0.23 -0.22 -0.56 0.00 0.05 -0.34 -0.33 -0.22 0.64 0.07 0.17 -0.26 0.36 0.14 -0.46 1
(18) ltdebt_ratio 0.05 0.04 0.27 -0.01 0.03 0.25 0.22 0.22 -0.02 0.03 -0.11 0.12 -0.15 -0.08 0.20 -0.23 -0.29 1
(19) iv 0.17 0.23 0.56 0.02 -0.03 0.09 0.08 0.01 -0.08 0.10 -0.02 0.16 -0.17 0.00 0.19 0.00 -0.43 0.18 1
(20) term 0.10 0.09 0.04 0.01 -0.07 -0.06 -0.06 -0.13 -0.08 -0.03 -0.06 0.10 -0.08 0.06 0.02 0.02 -0.22 0.14 0.31 1
(21) def 0.13 0.16 0.19 0.02 0.03 0.07 0.08 0.04 0.15 0.17 -0.09 0.09 -0.04 0.09 -0.02 -0.03 -0.11 0.03 0.37 0.60 1
(22) ted -0.03 0.00 0.15 -0.03 0.08 0.17 0.17 0.19 0.19 0.06 0.04 -0.08 0.02 0.01 -0.01 -0.01 0.15 -0.06 -0.09 -0.36 -0.05 1
(23) vix 0.12 0.16 0.27 -0.05 0.03 0.10 0.10 0.06 0.18 0.14 -0.04 0.05 -0.01 0.09 -0.04 -0.02 -0.04 -0.01 0.28 0.36 0.79 0.23 1
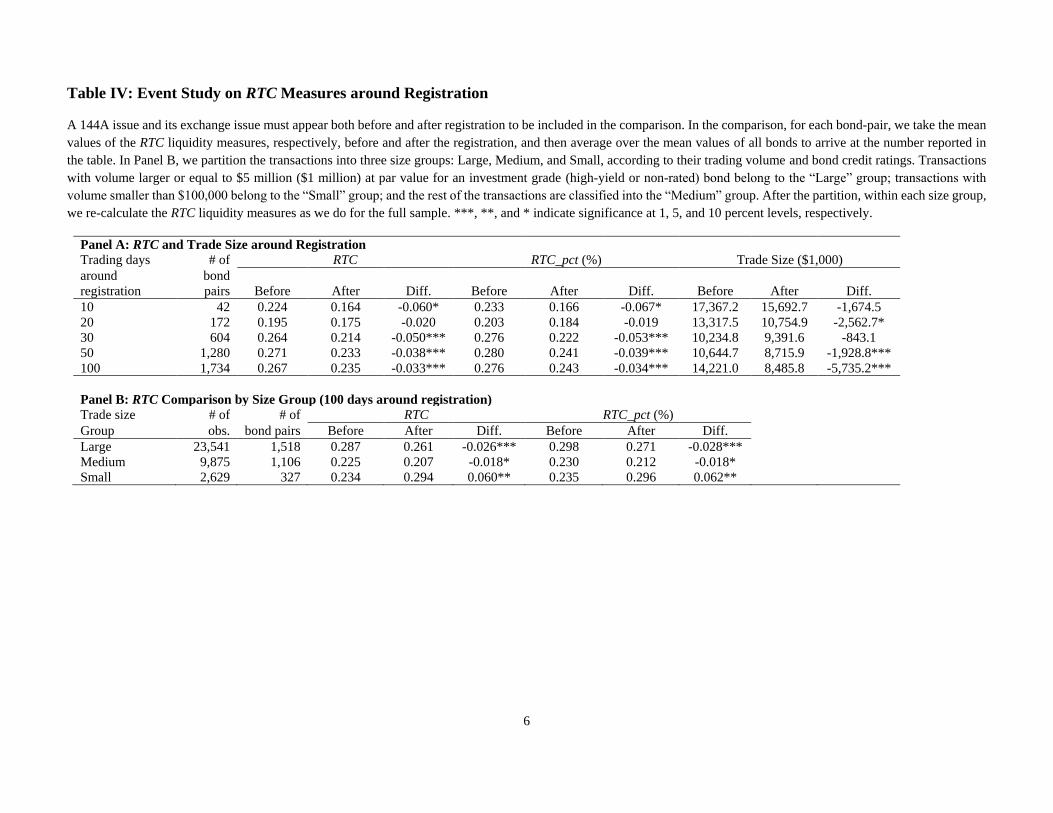
6
Table IV: Event Study on RTC Measures around Registration
A 144A issue and its exchange issue must appear both before and after registration to be included in the comparison. In the comparison, for each bond-pair, we take the mean
values of the RTC liquidity measures, respectively, before and after the registration, and then average over the mean values of all bonds to arrive at the number reported in
the table. In Panel B, we partition the transactions into three size groups: Large, Medium, and Small, according to their trading volume and bond credit ratings. Transactions
with volume larger or equal to $5 million ($1 million) at par value for an investment grade (high-yield or non-rated) bond belong to the “Large” group; transactions with
volume smaller than $100,000 belong to the “Small” group; and the rest of the transactions are classified into the “Medium” group. After the partition, within each size group,
we re-calculate the RTC liquidity measures as we do for the full sample. ***, **, and * indicate significance at 1, 5, and 10 percent levels, respectively.
Panel A: RTC and Trade Size around Registration
Trading days # of RTC RTC_pct (%) Trade Size ($1,000)
around
registration
bond
pairs Before After Diff. Before After Diff. Before After Diff.
10 42 0.224 0.164 -0.060* 0.233 0.166 -0.067* 17,367.2 15,692.7 -1,674.5
20 172 0.195 0.175 -0.020 0.203 0.184 -0.019 13,317.5 10,754.9 -2,562.7*
30 604 0.264 0.214 -0.050*** 0.276 0.222 -0.053*** 10,234.8 9,391.6 -843.1
50 1,280 0.271 0.233 -0.038*** 0.280 0.241 -0.039*** 10,644.7 8,715.9 -1,928.8***
100 1,734 0.267 0.235 -0.033*** 0.276 0.243 -0.034*** 14,221.0 8,485.8 -5,735.2***
Panel B: RTC Comparison by Size Group (100 days around registration)
Trade size # of # of RTC RTC_pct (%)
Group obs. bond pairs Before After Diff. Before After Diff.
Large 23,541 1,518 0.287 0.261 -0.026*** 0.298 0.271 -0.028***
Medium 9,875 1,106 0.225 0.207 -0.018* 0.230 0.212 -0.018*
Small 2,629 327 0.234 0.294 0.060** 0.235 0.296 0.062**
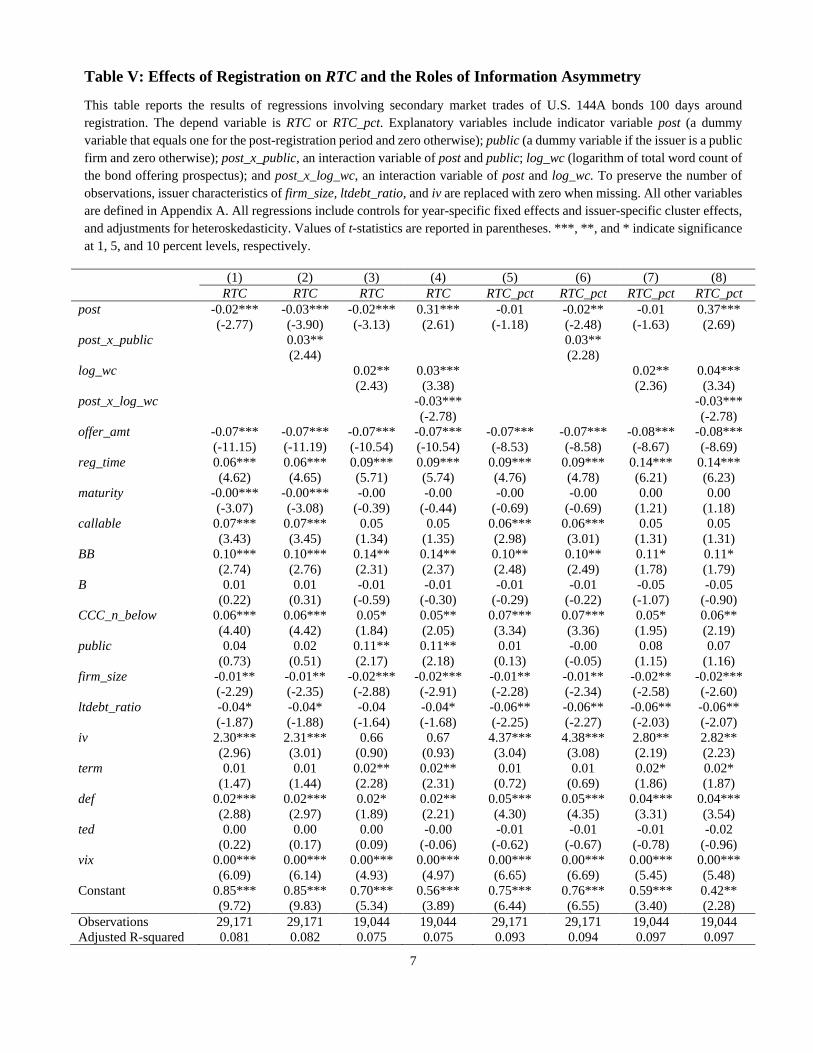
7
Table V: Effects of Registration on RTC and the Roles of Information Asymmetry
This table reports the results of regressions involving secondary market trades of U.S. 144A bonds 100 days around
registration. The depend variable is RTC or RTC_pct. Explanatory variables include indicator variable post (a dummy
variable that equals one for the post-registration period and zero otherwise); public (a dummy variable if the issuer is a public
firm and zero otherwise); post_x_public, an interaction variable of post and public; log_wc (logarithm of total word count of
the bond offering prospectus); and post_x_log_wc, an interaction variable of post and log_wc. To preserve the number of
observations, issuer characteristics of firm_size, ltdebt_ratio, and iv are replaced with zero when missing. All other variables
are defined in Appendix A. All regressions include controls for year-specific fixed effects and issuer-specific cluster effects,
and adjustments for heteroskedasticity. Values of t-statistics are reported in parentheses. ***, **, and * indicate significance
at 1, 5, and 10 percent levels, respectively.
(1) (2) (3) (4) (5) (6) (7) (8)
RTC RTC RTC RTC RTC_pct RTC_pct RTC_pct RTC_pct
post -0.02*** -0.03*** -0.02*** 0.31*** -0.01 -0.02** -0.01 0.37***
(-2.77) (-3.90) (-3.13) (2.61) (-1.18) (-2.48) (-1.63) (2.69)
post_x_public 0.03** 0.03**
(2.44) (2.28)
log_wc 0.02** 0.03*** 0.02** 0.04***
(2.43) (3.38) (2.36) (3.34)
post_x_log_wc -0.03*** -0.03***
(-2.78) (-2.78)
offer_amt -0.07*** -0.07*** -0.07*** -0.07*** -0.07*** -0.07*** -0.08*** -0.08***
(-11.15) (-11.19) (-10.54) (-10.54) (-8.53) (-8.58) (-8.67) (-8.69)
reg_time 0.06*** 0.06*** 0.09*** 0.09*** 0.09*** 0.09*** 0.14*** 0.14***
(4.62) (4.65) (5.71) (5.74) (4.76) (4.78) (6.21) (6.23)
maturity -0.00*** -0.00*** -0.00 -0.00 -0.00 -0.00 0.00 0.00
(-3.07) (-3.08) (-0.39) (-0.44) (-0.69) (-0.69) (1.21) (1.18)
callable 0.07*** 0.07*** 0.05 0.05 0.06*** 0.06*** 0.05 0.05
(3.43) (3.45) (1.34) (1.35) (2.98) (3.01) (1.31) (1.31)
BB 0.10*** 0.10*** 0.14** 0.14** 0.10** 0.10** 0.11* 0.11*
(2.74) (2.76) (2.31) (2.37) (2.48) (2.49) (1.78) (1.79)
B 0.01 0.01 -0.01 -0.01 -0.01 -0.01 -0.05 -0.05
(0.22) (0.31) (-0.59) (-0.30) (-0.29) (-0.22) (-1.07) (-0.90)
CCC_n_below 0.06*** 0.06*** 0.05* 0.05** 0.07*** 0.07*** 0.05* 0.06**
(4.40) (4.42) (1.84) (2.05) (3.34) (3.36) (1.95) (2.19)
public 0.04 0.02 0.11** 0.11** 0.01 -0.00 0.08 0.07
(0.73) (0.51) (2.17) (2.18) (0.13) (-0.05) (1.15) (1.16)
firm_size -0.01** -0.01** -0.02*** -0.02*** -0.01** -0.01** -0.02** -0.02***
(-2.29) (-2.35) (-2.88) (-2.91) (-2.28) (-2.34) (-2.58) (-2.60)
ltdebt_ratio -0.04* -0.04* -0.04 -0.04* -0.06** -0.06** -0.06** -0.06**
(-1.87) (-1.88) (-1.64) (-1.68) (-2.25) (-2.27) (-2.03) (-2.07)
iv 2.30*** 2.31*** 0.66 0.67 4.37*** 4.38*** 2.80** 2.82**
(2.96) (3.01) (0.90) (0.93) (3.04) (3.08) (2.19) (2.23)
term 0.01 0.01 0.02** 0.02** 0.01 0.01 0.02* 0.02*
(1.47) (1.44) (2.28) (2.31) (0.72) (0.69) (1.86) (1.87)
def 0.02*** 0.02*** 0.02* 0.02** 0.05*** 0.05*** 0.04*** 0.04***
(2.88) (2.97) (1.89) (2.21) (4.30) (4.35) (3.31) (3.54)
ted 0.00 0.00 0.00 -0.00 -0.01 -0.01 -0.01 -0.02
(0.22) (0.17) (0.09) (-0.06) (-0.62) (-0.67) (-0.78) (-0.96)
vix 0.00*** 0.00*** 0.00*** 0.00*** 0.00*** 0.00*** 0.00*** 0.00***
(6.09) (6.14) (4.93) (4.97) (6.65) (6.69) (5.45) (5.48)
Constant 0.85*** 0.85*** 0.70*** 0.56*** 0.75*** 0.76*** 0.59*** 0.42**
(9.72) (9.83) (5.34) (3.89) (6.44) (6.55) (3.40) (2.28)
Observations 29,171 29,171 19,044 19,044 29,171 29,171 19,044 19,044
Adjusted R-squared 0.081 0.082 0.075 0.075 0.093 0.094 0.097 0.097
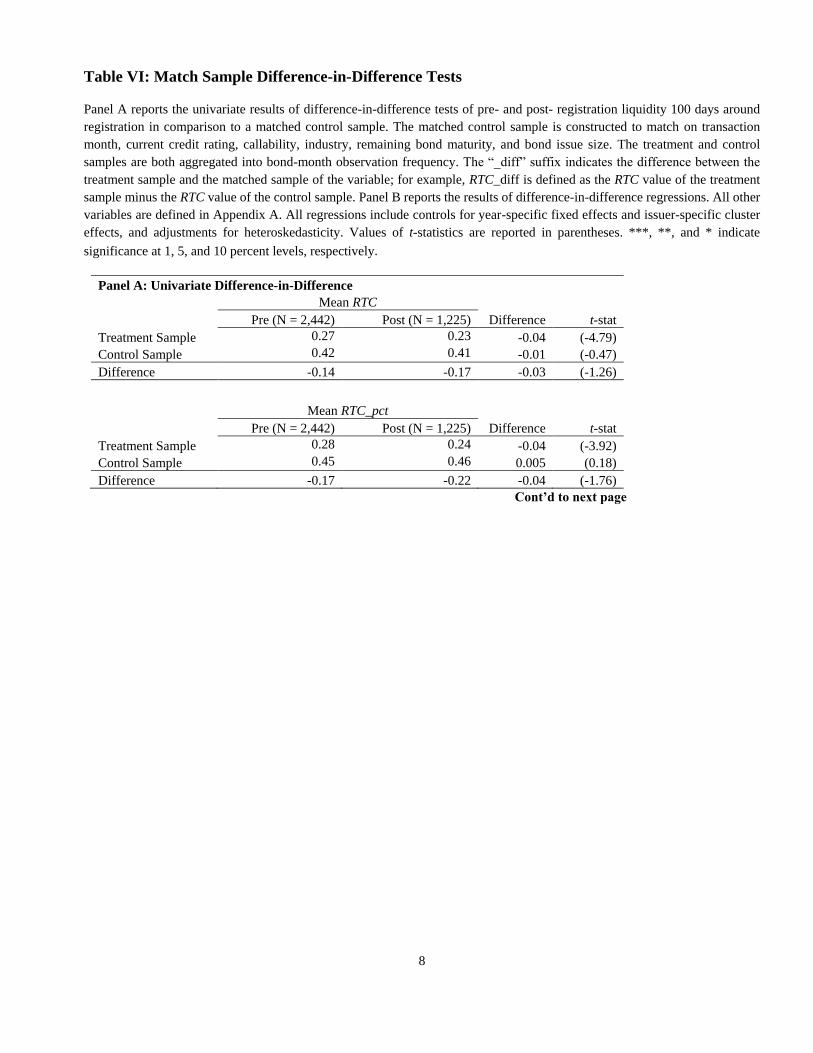
8
Table VI: Match Sample Difference-in-Difference Tests
Panel A reports the univariate results of difference-in-difference tests of pre- and post- registration liquidity 100 days around
registration in comparison to a matched control sample. The matched control sample is constructed to match on transaction
month, current credit rating, callability, industry, remaining bond maturity, and bond issue size. The treatment and control
samples are both aggregated into bond-month observation frequency. The “_diff” suffix indicates the difference between the
treatment sample and the matched sample of the variable; for example, RTC_diff is defined as the RTC value of the treatment
sample minus the RTC value of the control sample. Panel B reports the results of difference-in-difference regressions. All other
variables are defined in Appendix A. All regressions include controls for year-specific fixed effects and issuer-specific cluster
effects, and adjustments for heteroskedasticity. Values of t-statistics are reported in parentheses. ***, **, and * indicate
significance at 1, 5, and 10 percent levels, respectively.
Panel A: Univariate Difference-in-Difference
Mean RTC
Pre (N = 2,442) Post (N = 1,225) Difference t-stat
Treatment Sample 0.27 0.23 -0.04 (-4.79)
Control Sample 0.42 0.41 -0.01 (-0.47)
Difference -0.14 -0.17 -0.03 (-1.26)
Mean RTC_pct
Pre (N = 2,442) Post (N = 1,225) Difference t-stat
Treatment Sample 0.28 0.24 -0.04 (-3.92)
Control Sample 0.45 0.46 0.005 (0.18)
Difference -0.17 -0.22 -0.04 (-1.76)
Cont’d to next page
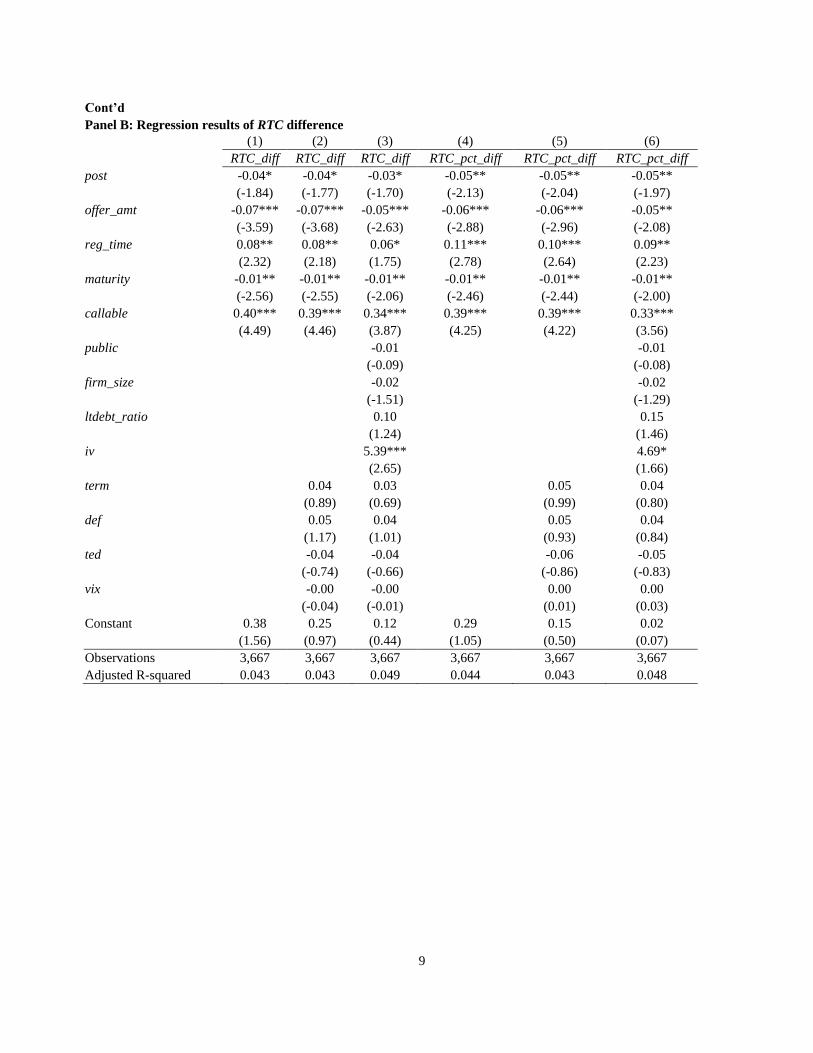
9
Cont’d
Panel B: Regression results of RTC difference
(1) (2) (3) (4) (5) (6)
RTC_diff RTC_diff RTC_diff RTC_pct_diff RTC_pct_diff RTC_pct_diff
post -0.04* -0.04* -0.03* -0.05** -0.05** -0.05**
(-1.84) (-1.77) (-1.70) (-2.13) (-2.04) (-1.97)
offer_amt -0.07*** -0.07*** -0.05*** -0.06*** -0.06*** -0.05**
(-3.59) (-3.68) (-2.63) (-2.88) (-2.96) (-2.08)
reg_time 0.08** 0.08** 0.06* 0.11*** 0.10*** 0.09**
(2.32) (2.18) (1.75) (2.78) (2.64) (2.23)
maturity -0.01** -0.01** -0.01** -0.01** -0.01** -0.01**
(-2.56) (-2.55) (-2.06) (-2.46) (-2.44) (-2.00)
callable 0.40*** 0.39*** 0.34*** 0.39*** 0.39*** 0.33***
(4.49) (4.46) (3.87) (4.25) (4.22) (3.56)
public -0.01 -0.01
(-0.09) (-0.08)
firm_size -0.02 -0.02
(-1.51) (-1.29)
ltdebt_ratio 0.10 0.15
(1.24) (1.46)
iv 5.39*** 4.69*
(2.65) (1.66)
term 0.04 0.03 0.05 0.04
(0.89) (0.69) (0.99) (0.80)
def 0.05 0.04 0.05 0.04
(1.17) (1.01) (0.93) (0.84)
ted -0.04 -0.04 -0.06 -0.05
(-0.74) (-0.66) (-0.86) (-0.83)
vix -0.00 -0.00 0.00 0.00
(-0.04) (-0.01) (0.01) (0.03)
Constant 0.38 0.25 0.12 0.29 0.15 0.02
(1.56) (0.97) (0.44) (1.05) (0.50) (0.07)
Observations 3,667 3,667 3,667 3,667 3,667 3,667
Adjusted R-squared 0.043 0.043 0.049 0.044 0.043 0.048
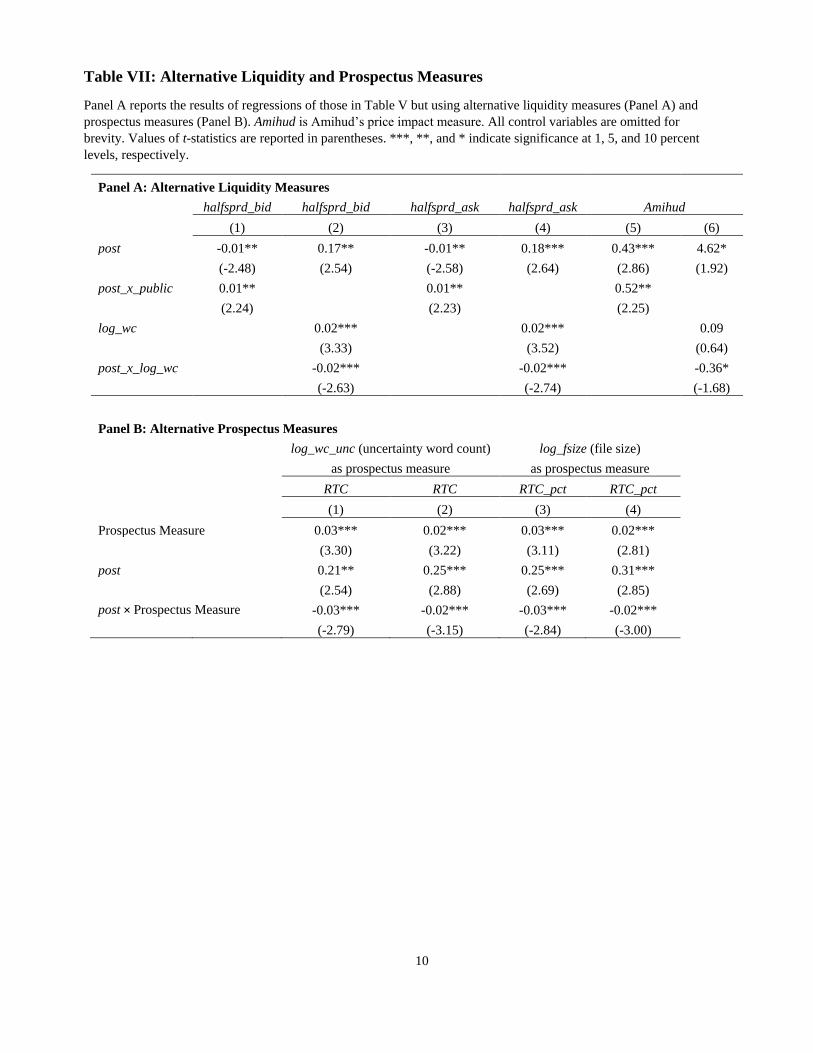
10
Table VII: Alternative Liquidity and Prospectus Measures
Panel A reports the results of regressions of those in Table V but using alternative liquidity measures (Panel A) and
prospectus measures (Panel B). Amihud is Amihud’s price impact measure. All control variables are omitted for
brevity. Values of t-statistics are reported in parentheses. ***, **, and * indicate significance at 1, 5, and 10 percent
levels, respectively.
Panel A: Alternative Liquidity Measures
halfsprd_bid halfsprd_bid halfsprd_ask halfsprd_ask Amihud
(1) (2) (3) (4) (5) (6)
post -0.01** 0.17** -0.01** 0.18*** 0.43*** 4.62*
(-2.48) (2.54) (-2.58) (2.64) (2.86) (1.92)
post_x_public 0.01** 0.01** 0.52**
(2.24) (2.23) (2.25)
log_wc 0.02*** 0.02*** 0.09
(3.33) (3.52) (0.64)
post_x_log_wc -0.02*** -0.02*** -0.36*
(-2.63) (-2.74) (-1.68)
Panel B: Alternative Prospectus Measures
log_wc_unc (uncertainty word count) log_fsize (file size)
as prospectus measure as prospectus measure
RTC RTC RTC_pct RTC_pct
(1) (2) (3) (4)
Prospectus Measure 0.03*** 0.02*** 0.03*** 0.02***
(3.30) (3.22) (3.11) (2.81)
post 0.21** 0.25*** 0.25*** 0.31***
(2.54) (2.88) (2.69) (2.85)
post × Prospectus Measure -0.03*** -0.02*** -0.03*** -0.02***
(-2.79) (-3.15) (-2.84) (-3.00)
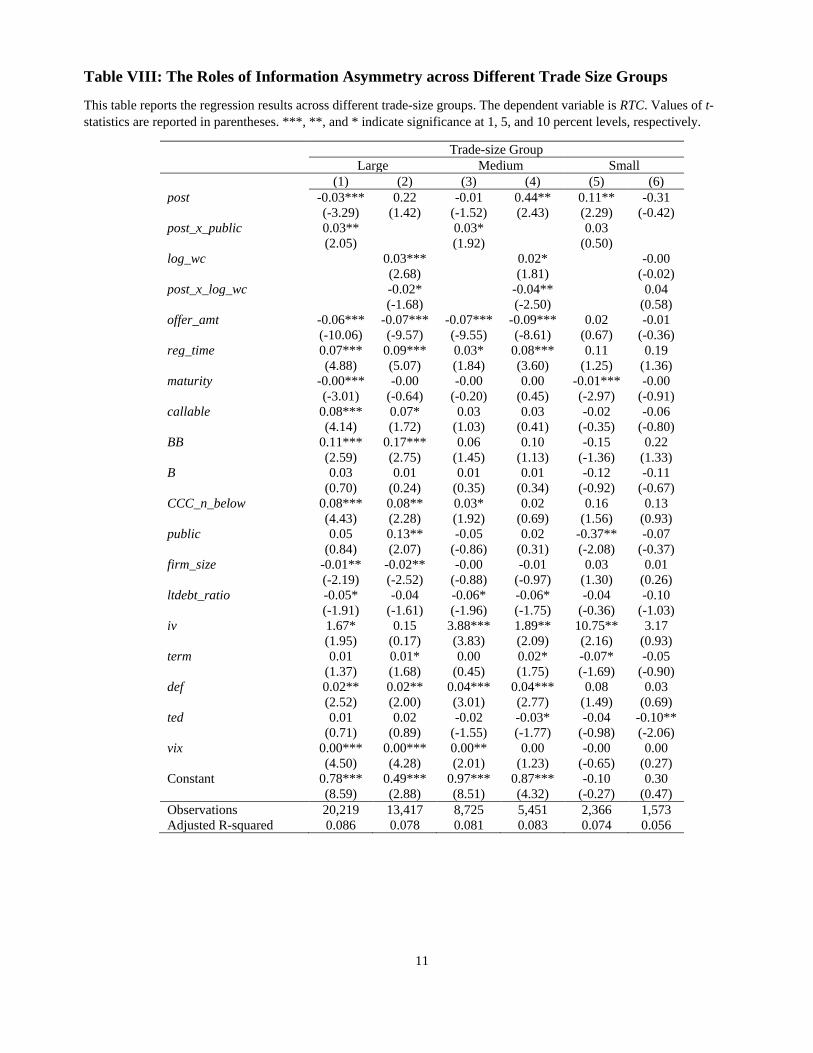
11
Table VIII: The Roles of Information Asymmetry across Different Trade Size Groups
This table reports the regression results across different trade-size groups. The dependent variable is RTC. Values of t-
statistics are reported in parentheses. ***, **, and * indicate significance at 1, 5, and 10 percent levels, respectively.
Trade-size Group
Large Medium Small
(1) (2) (3) (4) (5) (6)
post -0.03*** 0.22 -0.01 0.44** 0.11** -0.31
(-3.29) (1.42) (-1.52) (2.43) (2.29) (-0.42)
post_x_public 0.03** 0.03* 0.03
(2.05) (1.92) (0.50)
log_wc 0.03*** 0.02* -0.00
(2.68) (1.81) (-0.02)
post_x_log_wc -0.02* -0.04** 0.04
(-1.68) (-2.50) (0.58)
offer_amt -0.06*** -0.07*** -0.07*** -0.09*** 0.02 -0.01
(-10.06) (-9.57) (-9.55) (-8.61) (0.67) (-0.36)
reg_time 0.07*** 0.09*** 0.03* 0.08*** 0.11 0.19
(4.88) (5.07) (1.84) (3.60) (1.25) (1.36)
maturity -0.00*** -0.00 -0.00 0.00 -0.01*** -0.00
(-3.01) (-0.64) (-0.20) (0.45) (-2.97) (-0.91)
callable 0.08*** 0.07* 0.03 0.03 -0.02 -0.06
(4.14) (1.72) (1.03) (0.41) (-0.35) (-0.80)
BB 0.11*** 0.17*** 0.06 0.10 -0.15 0.22
(2.59) (2.75) (1.45) (1.13) (-1.36) (1.33)
B 0.03 0.01 0.01 0.01 -0.12 -0.11
(0.70) (0.24) (0.35) (0.34) (-0.92) (-0.67)
CCC_n_below 0.08*** 0.08** 0.03* 0.02 0.16 0.13
(4.43) (2.28) (1.92) (0.69) (1.56) (0.93)
public 0.05 0.13** -0.05 0.02 -0.37** -0.07
(0.84) (2.07) (-0.86) (0.31) (-2.08) (-0.37)
firm_size -0.01** -0.02** -0.00 -0.01 0.03 0.01
(-2.19) (-2.52) (-0.88) (-0.97) (1.30) (0.26)
ltdebt_ratio -0.05* -0.04 -0.06* -0.06* -0.04 -0.10
(-1.91) (-1.61) (-1.96) (-1.75) (-0.36) (-1.03)
iv 1.67* 0.15 3.88*** 1.89** 10.75** 3.17
(1.95) (0.17) (3.83) (2.09) (2.16) (0.93)
term 0.01 0.01* 0.00 0.02* -0.07* -0.05
(1.37) (1.68) (0.45) (1.75) (-1.69) (-0.90)
def 0.02** 0.02** 0.04*** 0.04*** 0.08 0.03
(2.52) (2.00) (3.01) (2.77) (1.49) (0.69)
ted 0.01 0.02 -0.02 -0.03* -0.04 -0.10**
(0.71) (0.89) (-1.55) (-1.77) (-0.98) (-2.06)
vix 0.00*** 0.00*** 0.00** 0.00 -0.00 0.00
(4.50) (4.28) (2.01) (1.23) (-0.65) (0.27)
Constant 0.78*** 0.49*** 0.97*** 0.87*** -0.10 0.30
(8.59) (2.88) (8.51) (4.32) (-0.27) (0.47)
Observations 20,219 13,417 8,725 5,451 2,366 1,573
Adjusted R-squared 0.086 0.078 0.081 0.083 0.074 0.056
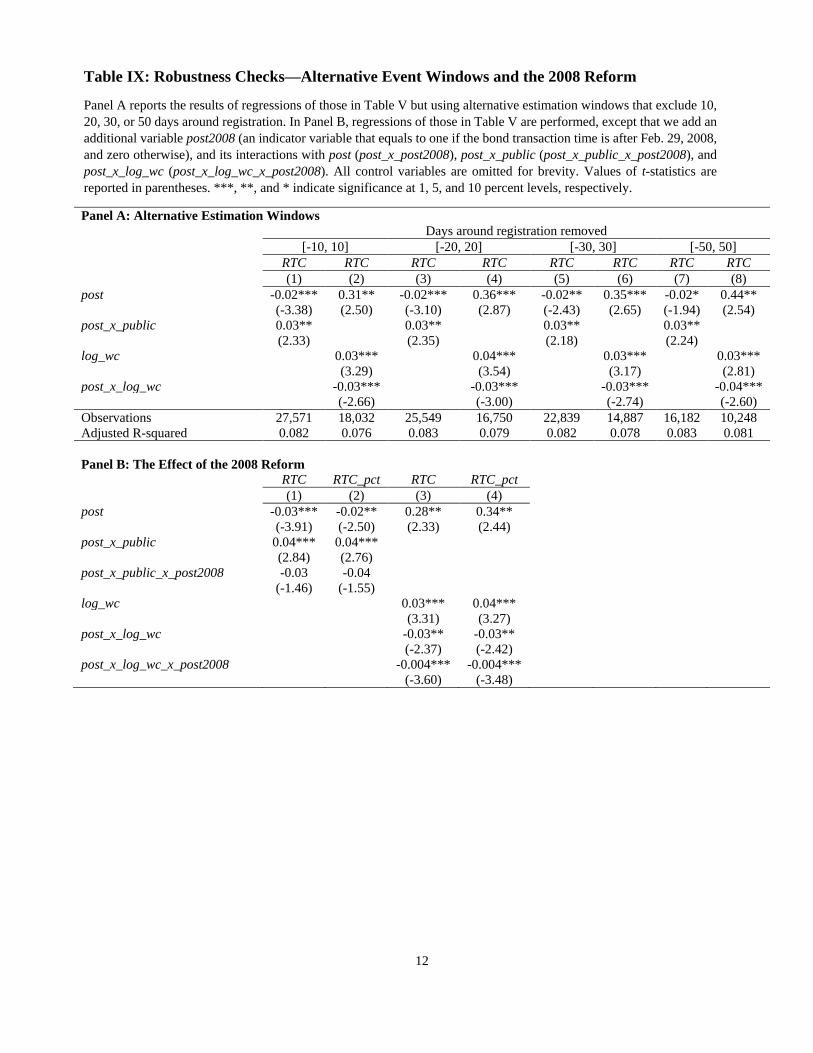
12
Table IX: Robustness Checks—Alternative Event Windows and the 2008 Reform
Panel A reports the results of regressions of those in Table V but using alternative estimation windows that exclude 10,
20, 30, or 50 days around registration. In Panel B, regressions of those in Table V are performed, except that we add an
additional variable post2008 (an indicator variable that equals to one if the bond transaction time is after Feb. 29, 2008,
and zero otherwise), and its interactions with post (post_x_post2008), post_x_public (post_x_public_x_post2008), and
post_x_log_wc (post_x_log_wc_x_post2008). All control variables are omitted for brevity. Values of t-statistics are
reported in parentheses. ***, **, and * indicate significance at 1, 5, and 10 percent levels, respectively.
Panel A: Alternative Estimation Windows
Days around registration removed
[-10, 10] [-20, 20] [-30, 30] [-50, 50]
RTC RTC RTC RTC RTC RTC RTC RTC
(1) (2) (3) (4) (5) (6) (7) (8)
post -0.02*** 0.31** -0.02*** 0.36*** -0.02** 0.35*** -0.02* 0.44**
(-3.38) (2.50) (-3.10) (2.87) (-2.43) (2.65) (-1.94) (2.54)
post_x_public 0.03** 0.03** 0.03** 0.03**
(2.33) (2.35) (2.18) (2.24)
log_wc 0.03*** 0.04*** 0.03*** 0.03***
(3.29) (3.54) (3.17) (2.81)
post_x_log_wc -0.03*** -0.03*** -0.03*** -0.04***
(-2.66) (-3.00) (-2.74) (-2.60)
Observations 27,571 18,032 25,549 16,750 22,839 14,887 16,182 10,248
Adjusted R-squared 0.082 0.076 0.083 0.079 0.082 0.078 0.083 0.081
Panel B: The Effect of the 2008 Reform
RTC RTC_pct RTC RTC_pct
(1) (2) (3) (4)
post -0.03*** -0.02** 0.28** 0.34**
(-3.91) (-2.50) (2.33) (2.44)
post_x_public 0.04*** 0.04***
(2.84) (2.76)
post_x_public_x_post2008 -0.03 -0.04
(-1.46) (-1.55)
log_wc 0.03*** 0.04***
(3.31) (3.27)
post_x_log_wc -0.03** -0.03**
(-2.37) (-2.42)
post_x_log_wc_x_post2008 -0.004*** -0.004***
(-3.60) (-3.48)
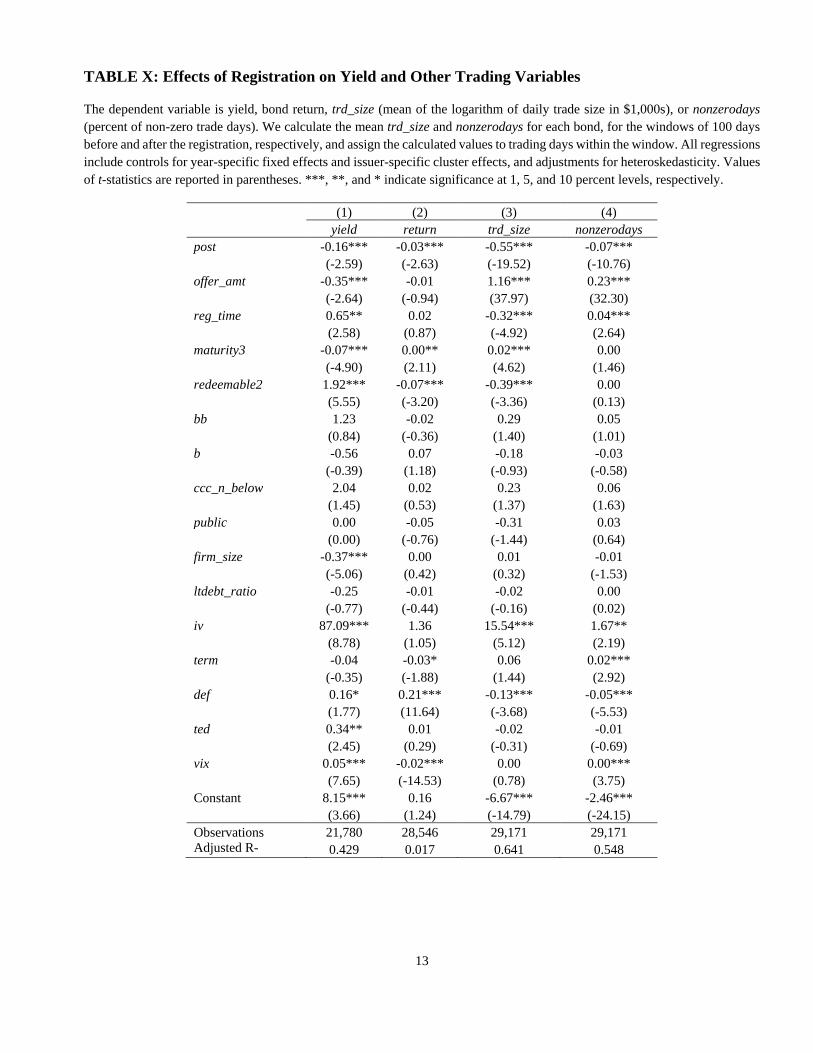
13
TABLE X: Effects of Registration on Yield and Other Trading Variables
The dependent variable is yield, bond return, trd_size (mean of the logarithm of daily trade size in $1,000s), or nonzerodays
(percent of non-zero trade days). We calculate the mean trd_size and nonzerodays for each bond, for the windows of 100 days
before and after the registration, respectively, and assign the calculated values to trading days within the window. All regressions
include controls for year-specific fixed effects and issuer-specific cluster effects, and adjustments for heteroskedasticity. Values
of t-statistics are reported in parentheses. ***, **, and * indicate significance at 1, 5, and 10 percent levels, respectively.
(1) (2) (3) (4)
yield return trd_size nonzerodays
post -0.16*** -0.03*** -0.55*** -0.07***
(-2.59) (-2.63) (-19.52) (-10.76)
offer_amt -0.35*** -0.01 1.16*** 0.23***
(-2.64) (-0.94) (37.97) (32.30)
reg_time 0.65** 0.02 -0.32*** 0.04***
(2.58) (0.87) (-4.92) (2.64)
maturity3 -0.07*** 0.00** 0.02*** 0.00
(-4.90) (2.11) (4.62) (1.46)
redeemable2 1.92*** -0.07*** -0.39*** 0.00
(5.55) (-3.20) (-3.36) (0.13)
bb 1.23 -0.02 0.29 0.05
(0.84) (-0.36) (1.40) (1.01)
b -0.56 0.07 -0.18 -0.03
(-0.39) (1.18) (-0.93) (-0.58)
ccc_n_below 2.04 0.02 0.23 0.06
(1.45) (0.53) (1.37) (1.63)
public 0.00 -0.05 -0.31 0.03
(0.00) (-0.76) (-1.44) (0.64)
firm_size -0.37*** 0.00 0.01 -0.01
(-5.06) (0.42) (0.32) (-1.53)
ltdebt_ratio -0.25 -0.01 -0.02 0.00
(-0.77) (-0.44) (-0.16) (0.02)
iv 87.09*** 1.36 15.54*** 1.67**
(8.78) (1.05) (5.12) (2.19)
term -0.04 -0.03* 0.06 0.02***
(-0.35) (-1.88) (1.44) (2.92)
def 0.16* 0.21*** -0.13*** -0.05***
(1.77) (11.64) (-3.68) (-5.53)
ted 0.34** 0.01 -0.02 -0.01
(2.45) (0.29) (-0.31) (-0.69)
vix 0.05*** -0.02*** 0.00 0.00***
(7.65) (-14.53) (0.78) (3.75)
Constant 8.15*** 0.16 -6.67*** -2.46***
(3.66) (1.24) (-14.79) (-24.15)
Observations 21,780 28,546 29,171 29,171
Adjusted R-
squared 0.429 0.017 0.641 0.548
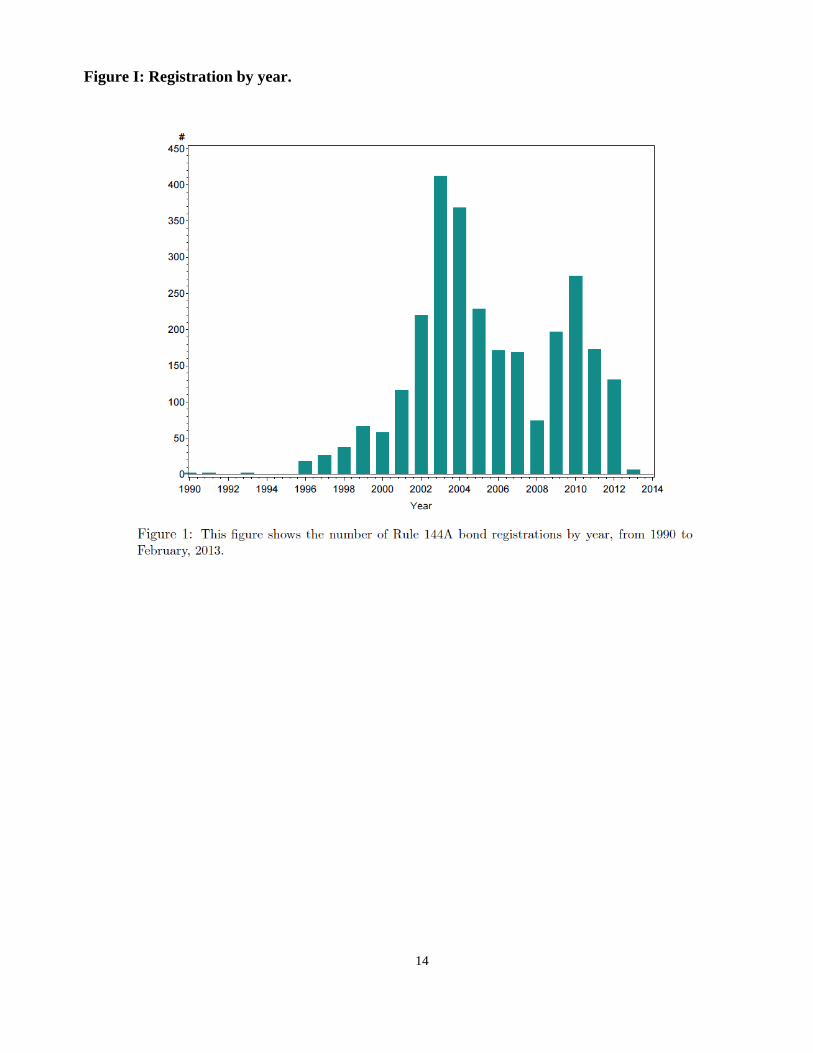
14
Figure I: Registration by year.
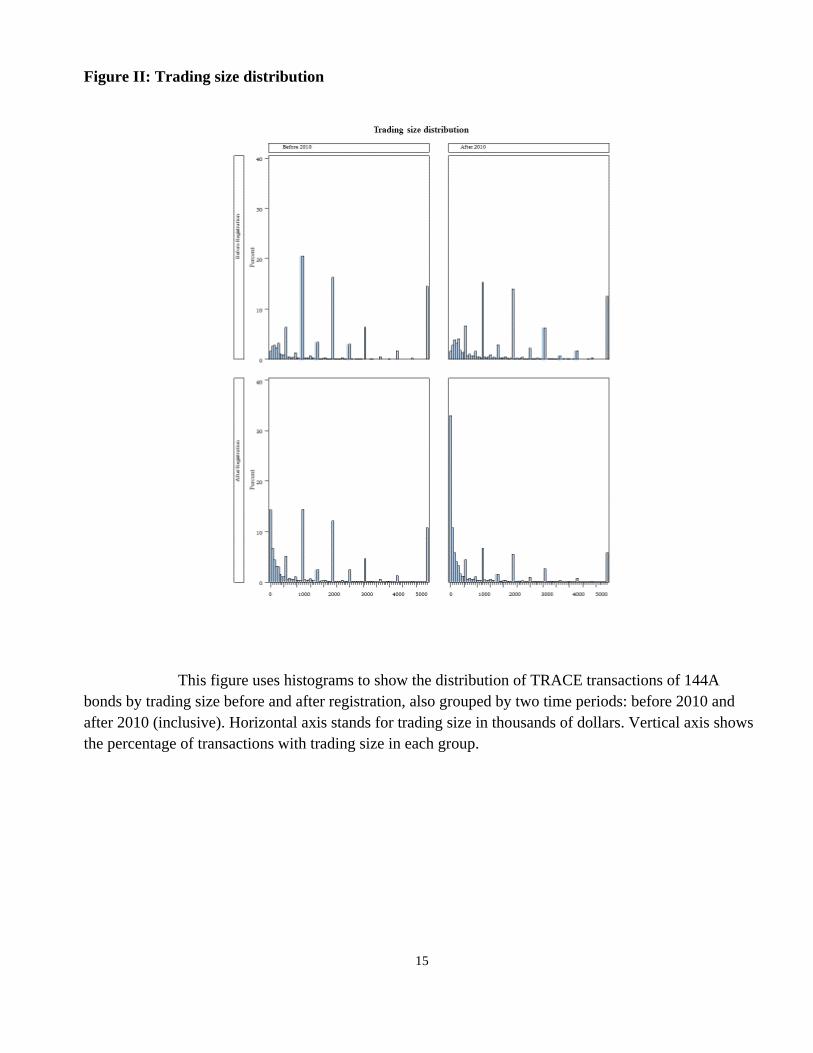
15
Figure II: Trading size distribution
This figure uses histograms to show the distribution of TRACE transactions of 144A
bonds by trading size before and after registration, also grouped by two time periods: before 2010 and
after 2010 (inclusive). Horizontal axis stands for trading size in thousands of dollars. Vertical axis shows
the percentage of transactions with trading size in each group.
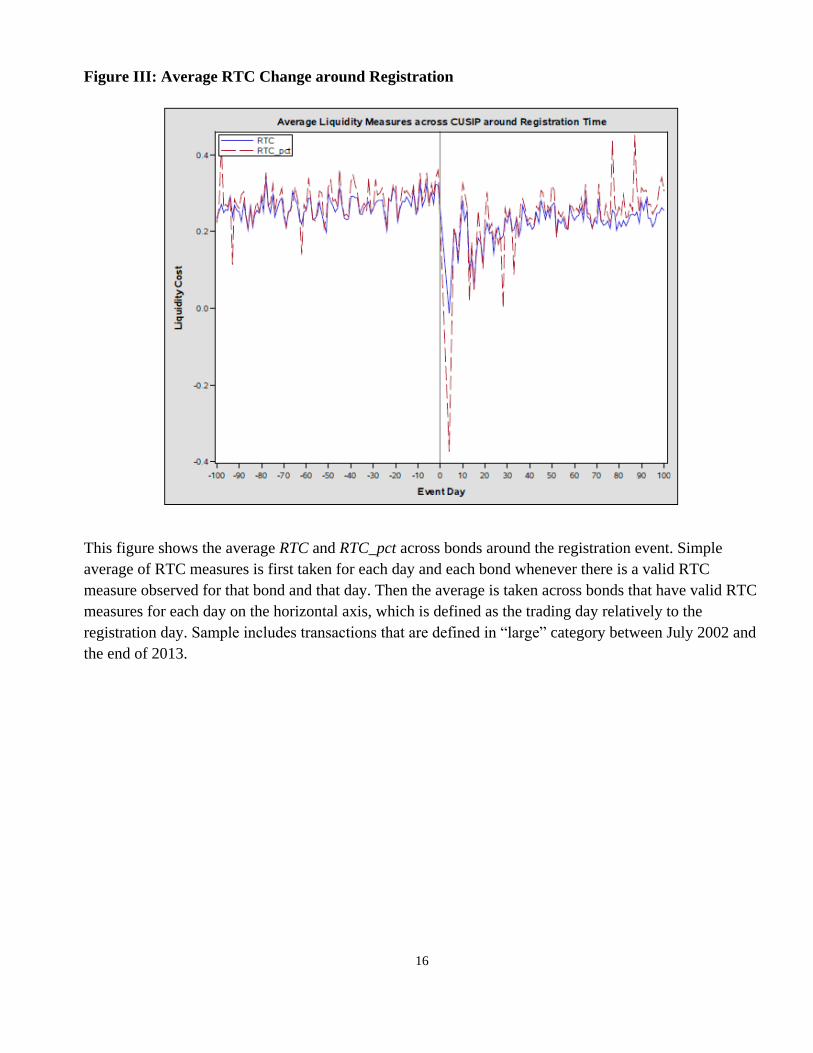
16
Figure III: Average RTC Change around Registration
This figure shows the average RTC and RTC_pct across bonds around the registration event. Simple
average of RTC measures is first taken for each day and each bond whenever there is a valid RTC
measure observed for that bond and that day. Then the average is taken across bonds that have valid RTC
measures for each day on the horizontal axis, which is defined as the trading day relatively to the
registration day. Sample includes transactions that are defined in “large” category between July 2002 and
the end of 2013.