Embed Size (px)
Citation preview
SOEPpaperson Multidisciplinary Panel Data Research
The GermanSocio-EconomicPanel study
Information Asymmetries Between Parents and Educators in German Childcare Institutions
Georg F. Camehl, Pia S. Schober, C. Katharina Spiess
939 201
7SOEP — The German Socio-Economic Panel study at DIW Berlin 939-2017
SOEPpapers on Multidisciplinary Panel Data Research at DIW Berlin This series presents research findings based either directly on data from the German Socio-Economic Panel study (SOEP) or using SOEP data as part of an internationally comparable data set (e.g. CNEF, ECHP, LIS, LWS, CHER/PACO). SOEP is a truly multidisciplinary household panel study covering a wide range of social and behavioral sciences: economics, sociology, psychology, survey methodology, econometrics and applied statistics, educational science, political science, public health, behavioral genetics, demography, geography, and sport science. The decision to publish a submission in SOEPpapers is made by a board of editors chosen by the DIW Berlin to represent the wide range of disciplines covered by SOEP. There is no external referee process and papers are either accepted or rejected without revision. Papers appear in this series as works in progress and may also appear elsewhere. They often represent preliminary studies and are circulated to encourage discussion. Citation of such a paper should account for its provisional character. A revised version may be requested from the author directly. Any opinions expressed in this series are those of the author(s) and not those of DIW Berlin. Research disseminated by DIW Berlin may include views on public policy issues, but the institute itself takes no institutional policy positions. The SOEPpapers are available at http://www.diw.de/soeppapers Editors: Jan Goebel (Spatial Economics) Martin Kroh (Political Science, Survey Methodology) Carsten Schröder (Public Economics) Jürgen Schupp (Sociology) Conchita D’Ambrosio (Public Economics, DIW Research Fellow) Denis Gerstorf (Psychology, DIW Research Director) Elke Holst (Gender Studies, DIW Research Director) Frauke Kreuter (Survey Methodology, DIW Research Fellow) Frieder R. Lang (Psychology, DIW Research Fellow) Jörg-Peter Schräpler (Survey Methodology, DIW Research Fellow) Thomas Siedler (Empirical Economics, DIW Research Fellow) C. Katharina Spieß (Education and Family Economics) Gert G. Wagner (Social Sciences)
ISSN: 1864-6689 (online)
German Socio-Economic Panel (SOEP) DIW Berlin Mohrenstrasse 58 10117 Berlin, Germany Contact: [email protected]
1
Information Asymmetries Between Parents and Educators in German Childcare Institutions
Georg F. Camehl*, DIW Berlin and Freie Universität Berlin
Email: [email protected]
Pia S. Schober, University of Tübingen and DIW Berlin
Email: [email protected]
C. Katharina Spiess, DIW Berlin and Freie Universität Berlin
Email: [email protected]
Address: DIW Berlin
Mohrenstr. 58
10117 Berlin
Germany
*Corresponding author, Phone: +493089789268, Fax: +493089789115
Acknowledgments: The authors would thank the Jacobs Foundation for supporting this
research as part of the “Early Childhood Education and Care Quality in the Socio-Economic
Panel (K2ID-SOEP, Project number 2013-1063)” project. We thank participants of the BIEN
Jahrestagung 2016, the LERN Jahrestagung 2016, the ESPE-2016 Conference and the SOEP-
User-Conference 2016 for helpful comments. We also thank Adam Lederer for very helpful
editorial assistance.
2
Abstract
Economic theory predicts market failure in the market for early childhood education and care (ECEC) due to information asymmetries. We empirically investigate information asymmetries between parents and ECEC professionals in Germany, making use of a unique extension of the German Socio-Economic Panel Study (SOEP). It allows us to compare quality perceptions by parents and pedagogic staff of 734 ECEC institutions which were attended by children in SOEP households. Parents and staff were asked to rate the same quality measures. We detect considerable information asymmetries between these groups which differ across quality measures but little by parental socio-economic background or center characteristics. Our findings imply that information is not readily available to parents, an issue that should be addressed by policy-makers.
Keywords: Child care; quality; information asymmetries; socio-economic differences;
Germany
3
1 Introduction
The quality of Early Childhood Education and Care (ECEC) services is important for
child development and well-being (for summaries see e.g. Auger 2014, Burger 2010, Camilli
et al. 2010 or Barnett 2011). In particular, many studies highlight the importance of ECEC
quality for children (for an overview, see e.g. Elango et al. 2015, Anders 2013). Parents usually
choose which ECEC center they would like their children to attend. To choose high quality
ECEC, parents need to be able to assess and monitor the quality of these services. As parents
can visit their children’s ECEC centers on a daily basis, they are assumed to be able to monitor
quality and take action if they are not satisfied. Furthermore, parents are expected to act as
advocates of their children, ensuring that their early care and education experiences are
adequate. ECEC professionals, including the center director and pedagogic staff, provide
another perspective on ECEC center quality. Their assessments are important in enabling
continuous internal monitoring of quality. Yet, parental assessments of the quality of a given
classroom may well diverge from evaluations by the ECEC professionals. Differences in
assessments between buyers and sellers of human services – in this case early childhood
education and care – can be conceptualized as information asymmetries. Such asymmetries are
likely to arise because these services are not experience goods and parents as consumers must
trust the ECEC professionals to some extent, as they cannot entirely assess the quality (e.g.
Mocan 2007).
From an economic point of view, information asymmetries may lead to low quality of
service provision in a market. If parents cannot distinguish between high- and low-quality
centers, they are less likely to be willing to pay higher fees (e.g. Herbst 2016). Under this
scenario, high quality centers will exit the market, average quality will fall, and eventually the
market will be filled primarily with mediocre quality centers (Akerlof 1970, Mocan 2007,
Artz/Welsh 2014, Herbst 2016). In Germany, as childcare fees are usually fixed, the theoretical
argument is slightly different: High quality child care is more costly for the providers and
requires more effort from staff at a given resource level. If parents do not observe and enforce
high quality, there is no apparent reason to increase quality above minimum standards.
Additionally, enforcement of minimum quality standards may not be perfect. So even in a
highly regulated market, information asymmetries can be a reason for low quality.
In addition to leading to market failure, information asymmetries between parents and
providers may be problematic per se, as they reflect a lack of communication and interaction
of pedagogic staff and parents. Several previous studies provide evidence of the benefits of
4
regular interaction between parents and centers for children’s wellbeing, e.g. through more
supportive parenting styles (Ansari and Gershoff 2015), greater opportunities for physical
activities (Froehlich Chow and Humbert 2014), and lower levels of corporal punishment in such
centers (Khoury-Kassabri et al. 2013). High levels of ECEC quality therefore require regular
and substantial interaction of ECEC professionals with parents, which can be assumed to reduce
the information deficit. Thus, significant information gaps between quality assessments of
parents and ECEC professionals might affect children`s well-being negatively.
To date, few empirical studies have examined these theoretical arguments on
information asymmetries between different actors systematically in the market for child care.1
The existing studies often focus on the US market, including an economic study by Mocan
(2007) and several studies by education scientists (Cryer and Burchinal 1997, Cryer et al. 2002;
for an overview see Torquati et al. 2011, Bassok et al. 2017). These studies focus on differences
in the quality rating by parents and experts. Only one study (Barros and Leal 2015) has taken
the quality rating of ECEC professionals into account explicitly. Their ratings seem highly
relevant, as they are the most important actors for providing parents with information about
quality. Moreover, it is plausible to assume that ECEC professionals are better informed about
the level of quality of their services than parents. We therefore focus on information
asymmetries between parents and ECEC professionals.
Our findings for the highly regulated German ECEC market point to considerable
information asymmetries concerning three groups of quality measures: (1) structural features;
(2) educational and playing activities; and (3) pedagogical focuses. In comparison to the
judgements of the ECEC professionals, parents underestimate quality more often than they
overestimate it. We derive our results from a unique data set, which allows us to compare
quality assessments from parents and ECEC professionals of the same centers. We measure the
information gap by comparing answers of parents with those of ECEC professionals with
respect to exactly the same questions. Additionally, we introduce a theoretical observability
rating of the quality measures used and verify the categorization based on our data. Indeed, the
results suggest that the information gap is larger for less observable quality measures on
average. Moreover, we analyze how the incidence of information gaps relates to parent and
provider characteristics. We find only a few significant correlations between characteristics of
parents and ECEC providers and information asymmetries.
1 For summaries, see e.g. Blau (2001), Helburn/Bergeman (2002) and Fenge/Wrede (2015).
5
2 The German ECEC system
In Germany, day-care centers are heavily state-subsidized, with income-dependent fees,
which are relatively low compared to most OECD countries. On average, ECEC fees per two-
year old amount to 21.5% of average wages in Germany, while the OECD average is 27.2%
(OECD 2015). Schröder et al. (2015) show that financial contributions by families vary
somewhat due to regional variation in subsidies and fee regulations. Around 18 percent of
families with children who attend ECEC are completely exempt from fees. In many states, fees
are regulated by the state – typically determined by family income and the number of children
in care (e.g. Spiess et al. 2008). In comparison to the US market, the German childcare market
is not very competitive (e.g. Artz/Welsh 2014), the share of for-profit providers is low at about
1% (Statistisches Bundesamt 2016) – with most ECEC institutions operated by non-profits or
municipalities.
Since 1996 children aged three years and older have been entitled to a slot in an ECEC
center in Germany (see e.g. Spiess 2008). Thus, from age three onward almost all children
attend formal ECEC services. The attendance rates for younger children are lower, but have
been increasing from 16 percent in 2007 to 33 percent in 2015 (Statistisches Bundesamt 2016).2
In the past, the availability of places for children under three years was restricted, especially in
Western Germany. However, two federal laws in 2005 and 2008 provided extra funding,
granted prioritised access for children with parents in employment or education, and stipulated
a legal right to a place in an ECEC institution for all children aged one year or older from
August 2013. As a result, parents are not as restricted anymore in their choice of ECEC
institutions. 91% of the parents in our data report that they had a choice between at least two
centers.
In Germany, each state has its own regulation for minimum standards of quality. Child-
teacher ratio is one of the few indicators that are precisely, albeit differently, regulated in all
states. There is a significant variation across states with respect to the level of regulation in
terms of other quality indicators, such as opening hours, parental fees, building requirements
and maintenance and group size (e.g. Bock-Famulla et al. 2015). Moreover, all German states
have implemented pedagogical guidelines (Bildungspläne). However, these plans vary by state
and are not mandatory in most states. Thus, ECEC quality varies across regions and centers.
Despite a relatively high overall degree of regulation, an empirical study of ECEC quality in
2 However, there are considerable social disparities for this group: Children under the age of three with migration background or from low income families are significantly less likely to attend child care (see Schober and Spiess 2013).
6
Germany shows that out of 188 evaluated ECEC centers for children below the age of three,
the majority offers a quality that can be classified as sufficient but no more. 10% of the centers
were assessed as good and another 10% as insufficient (Tietze et al. 2012).3 Furthermore, 44%
expressed concerns about the quality of ECEC centers.4
Thus, in Germany, given the relatively strict fee regulations in many states, fees are not
usually a signal of quality. There is also no overall national accreditation system like that
administered by the National Association for the Education of Young Children (NAEYC) in
the United States (e.g. Xiao 2010), which consumers can use as a source of information.
Furthermore, there are no Quality Rating and Improvement Systems as they exist for many US
states (e.g. Herbst 2016).
3 Previous studies and differences in information asymmetries
Most studies on information asymmetries in childcare markets focus on differences
between parents’ and experts` quality ratings. Among the studies which analyze differences
between parents and ECEC professionals, most look at differences in ideas and perceptions
about ECEC quality (e.g. ECCE Study Group 1997, Pierrehumbert et al. 2002, Weaven and
Grace 2010, Harris and Tinning 2012). To our knowledge, there is only one study which focuses
on reported quality levels and also considers the ECEC professionals’ assessments. The study
by Barros and Leal (2015) is based on a Portuguese sample and shows that parents and ECEC
professionals overestimate quality in comparison to experts but that there is a higher correlation
between professionals’ and experts’ ratings than between parents’ and professionals’ ratings.
Thus, they find information asymmetries but they do not analyze them more in-depth. Their
results imply that differences are lower for aspects which are relatively fixed such as the space
available for adults in the center. They further state that parents’ and teachers’ ratings may be
more based on what they would quality like to be than on actual observations and that parents
may lack suitable reference points for assessing high quality, that is, some experience of high
quality centers.
The majority of studies which investigate information asymmetries between the parents
and experts show that parental and experts’ assessments of various dimensions of the classroom
operation correlate, but that there are information asymmetries. Mocan (2007) demonstrates the
3 Surprisingly, several studies show that overall parents report a relatively high level of satisfaction with ECEC although this varies by quality aspects and is related to actual levels of quality as assessed by parents (Camehl et al. 2015a). 4 Own calculations based on the 2013 wave of the “Familien in Deutschland” (FiD-data), see below.
7
existence of such information asymmetries in the US childcare market, which provide an
explanation for low average quality. As in most studies of this type, the process quality of the
ECEC services is rated by experts using the Early Childhood Environment Rating Scale
(ECERS). An earlier study by Cryer and Burchinal (1997) for the US arrives at similar results
as Mocan (2007). In a more recent study, Cryer et al. (2002) use a sample of parents of
preschoolers in the US and compare this with a sample of parents in selected German states.
Their findings show that in both countries parents assign substantially higher quality scores to
their children’s classrooms than trained observers do and that parental quality assessments are
influenced by the relative importance they attribute to specific aspects of quality. The
representativeness of these results may be limited, as the respective samples only consider
children at specific age groups, and are limited to selected regions.5 A few other North
American studies with similar approaches are summarized in Torquati (2011), Howe et al.
(2013), Bassok et al. (2017).
Independent of the ECEC system, information asymmetries of all kinds - those between
parents and experts as those between parents and ECEC professionals - might be related to the
observability of different ECEC quality aspects and may be more prevalent among specific
groups of parents and providers. Firstly, the information gap may differ by the level of
observability of different quality aspects. Parents rarely have the opportunity to spend much
time in their children’s classrooms observing the various quality dimensions of daily care
practices. Studies indeed show that parents tend to spend relatively little time at a center –
typically limited to when they drop off or pick up their children, or attend parent meetings.
Most of the information that parents receive is second-hand based on other parents’ experiences,
reports of their own child, the teaching and administrative staff, as well as through the materials
that the child brings home, such as artwork (see Cryer et al. 2002, Artz and Welsh 2014). Even
if they do spend some time at the childcare centers, they might not have sufficient knowledge
to rate the quality in ways compared to trained raters. As a result, Mocan (2007) distinguishes
between aspects of services that are “easy to observe,” such as opening hours, and aspects that
are “difficult to observe,” such as the quality of teacher–child interaction. His results, and also
those by Cryer and Burchinal (1997), confirm that when parents and external experts rate the
5 For similar studies based on Greek data, see Grammatikopoulos et al. (2014) and Rentzou and Sakellariou (2013); for a study based on a Swedish sample, see Kärrby/Giota (1995). On a much smaller Canadian sample Lehrer et al. (2015) find some evidence that parents can discriminate child care quality.
8
quality of easy-to-monitor aspects of care, differences in scores between parents and experts
are smaller than when they rate aspects that are more difficult to monitor.6
Secondly, the information gap might differ by demand-side characteristics, such as
education, income and employment status of parents. There are several empirical studies
showing that there are socio-economic differences in the assessment of quality by parents (e.g.
Johansen et al. 1996, Hagy 1997, Blau and Hagy 1998). Higher educated parents might have
lower costs in searching for the right information, have better search strategies, or have better
informed networks (see e.g. Meyers and Jordan 2006). Parents working longer hours might
value quality more as their children use such services longer; however, they might also have
more time constraints when searching. Cryer et al. (2002) find that parents with lower
educational attainment tend to rate the importance of the ECEC quality characteristics
significantly higher than more highly educated respondents in both Germany and the US. Less
educated parents tend to rate the quality of their children’s classrooms slightly higher on the
ECERS Parent Questionnaire (ECERSPQ) than parents with higher levels of education.
Similarly, Mocan (2007) shows that parents with (at least some) college education assess
quality more accurately than less educated parents. Parents using full-day care are more
accurate in their predictions. Artz and Welsh (2014) assume that parents in high income
neighborhoods have better resources for evaluating the quality of ECEC services.
Thirdly, the levels of information asymmetries may vary by the supply side
characteristics of the ECEC providers. Parents might use center characteristics as predictors
for quality. Centers that are under market pressure may be less able or more willing to
communicate effectively with parents. Similarly, the size of the center might matter as small
centers may have fewer staff resources, thus limiting the amount of well-structured
communication processes with parents. Mocan (2007) shows that the provider type has an effect
on information asymmetry: parents rate the quality of public providers lower. In addition, the
proportion of white children at a center is associated with a perception of higher quality, while
the proportion of children whose parents receive childcare subsidies relates to lower parental
quality ratings.
We analyze these three types of information asymmetries using a unique German data
set. The quality aspects we analyze relate to structural features of quality for the most part as
6 The study by Cryer et al. (2002) also very clearly shows that the information gap differs between quality measures.
9
well as some aspects related to process quality.7 Structural features are usually defined as
comprising easily observable, quantifiable and regulatable features of the ECEC context, such
as group size and child-staff-ratio.8
We extend previous studies by measuring the incidence of an information gap regarding
various ECEC quality aspects between the buyers and the sellers as well as the size of such
asymmetries. Furthermore, we examine whether information asymmetries differ between
observable and unobservable aspects as well as how they relate to the socio-economic
background of parents and to specific characteristics of ECEC institutions. Such an analysis
allows us to investigate the extent to which consumers have difficulties in extracting
information from ECEC professionals due to limited observability of quality aspects, due to
socio-economic characteristics of the parents, or due to provider characteristics. Any such
difficulties may result in education inequalities for the children in care. We perform this
analysis for a German sample that is not restricted to particular states and we refer to a market
for ECEC services that is, in comparison to the US market, much more regulated and where
services for all children are subsidized.
4 Data and methods
Data. Our analyses are based on a subsample of the German Socio-Economic Panel (SOEP),
the SOEP-extension sample “Families in Germany” (FiD), and a SOEP-supplementary study
that includes additional information from both parents and ECEC centers. All studies belong to
the SOEP which is the largest and the longest running multidisciplinary longitudinal study in
Germany (Wagner et al. 2007). In 2013, 24,113 adult members of 14,170 households
participated in the study. We use the 2013 SOEP wave in conjunction with the 2013 FiD wave.
FiD is a dataset that specifically surveys families with young children and also targets families
that are typically under-sampled in general surveys: low income, single parents, and large
families. In 2013, a total of 6,853 individuals in 3,923 households participated (Schröder et al.
2013). The structure, content and thus the variables of these two data sets are virtually identical,
so they can be analyzed jointly using weighting factors.9 The 2013 SOEP supplementary K2ID
7 The pedagogical literature refers to various types of quality (e.g. Tietze, 1998 or Hayes et al. 1990) to better understand how the care and learning processes in these settings affect child development. 8 Process quality in ECEC institutions includes the entirety of pedagogical interactions with the child, and the child’s experience with the social and material environment. Process quality is assumed to (partly) mediate the relationship between structural quality and child development. 9 FiD only includes questions which are relevant for families. Here, we rely on the variables which are identical in both data sets.
10
study (see Camehl et al. 2015b) includes information on the quality of facilities attended by
children who lived in a SOEP or FiD household at that time.10 In a first step of the K2ID project
one parent of each child below school age was surveyed in order to gather information on the
ECEC facility their child or children attend. This includes the address of the facility and parent’s
assessment of a large number of indicators regarding the quality of the ECEC center.11 The
second step was to collect indicators of structural, orientation, and process quality directly from
the director of each facility and from the main group educator of the group attended by the
SOEP/FiD-child under study.12 In our analysis, we only consider quality measures where we
have information from both the parent and from the ECEC director/group educator. In this case,
the parents and the ECEC professionals were asked the same questions.13 Given the design of
our study, we thus only compare parents and ECEC centers which are linked via the attendance
of the children. Depending on the quality measure, we can compare the information from 346
to 725 parents and the ECEC institution that their child attends. This relatively broad range is
related to the fact that the FiD-questionnaire included a larger number of quality-related
questions. For a detailed description of the new SOEP-K2ID-study, which was conducted by
ourselves together with the SOEP, see Schober et al. (2017).
We compare the quality assessments of parents and ECEC professionals. We argue that
none of them has particularly high incentives to inflate their perceptions. Inflated ratings might
be due to parents not wanting to report that they have chosen an ECEC institution of low quality
for their child. ECEC professionals might not want to report low quality, as this implies that
their work is insufficient. However, as we designed the study ourselves, we tried to minimize
overreporting in both cases. Towards both actor groups, we emphasized that the study does not
aim to evaluate quality of particular institutions, but rather seeks to draw general conclusions
for policy makers and researchers which might improve the conditions for ECEC professionals
and children. Even if overly positive ratings occurred, the bias for both groups would go in the
10 For more information on this supplementary study see the project-homepage: www.k2id.de (accessed: September 2017). 11 The main SOEP and FiD surveys only ask about provider type every four years and include no further information on ECEC centers. 12 This was accomplished through postal questionnaires and telephone follow-ups and aimed at capturing the
quality of the learning environment, the interactions between children and teaching staff, activities, as well as the attitudes of ECEC professionals. If respondents were unable to complete the full questionnaire, they were given the option of answering a compressed questionnaire version and, toward the end of the survey period, we also performed a phone follow-up with an even shorter version. Sample sizes vary, as not all quality aspects were covered in the shorter questionnaires. 13 Appendix-B shows the wording of the questions which are relevant for our information gap measures (see below).
11
same direction. Moreover, we asked for perceptions with respect to many quality measures and
find large variations which does not point to stringent and systematic overreporting of quality.
Parents and ECEC institutions in most of our subsamples were surveyed between
October 2013 and November 2014. Our total sample includes 1870 parents and 680 ECEC
institutions. For 82% of children, the mother answered the parental questionnaire, for 18% the
father did. The response rate for the parental questionnaire is reasonably high at 74%, the
response rate of the institution questionnaire is also high for this type of survey at 55%. We use
survey as well as non-response weights to account for selective participation in the study. These
survey weights are generated using extensive information about non-respondents that is
available through the SOEP general survey for all individuals that were sent the additional
questionnaire (for more information on this weighting procedure, see Schober et al. 2017).
Definition of information gap. We measure the information gap via a binary variable that
indicates if there is any gap. Depending on measurement scales, we construct binary gap
indicators in two ways: (a) For categorical variables (existence of written pedagogical concept,
the activities and pedagogical focuses), the variable takes the value one if the answers from
parents and institutions match and zero otherwise ( stand for the center information, for
the parental information, the index I for children and j for groups):
0 1
For continuous variables (i.e. most structural features), the gap is defined based on a threshold:
0.1
The threshold is set at 10% of the information provided by the ECEC center. As part of
robustness checks, we also present results for the following other thresholds: exactly matching
information and thresholds of 5%, 15% and 20%.
Depending on the item, the information is either provided by the director of the
institution or by the group educator of the child. The institution director provides information
on opening times and pedagogical focuses, whereas the group educator provides all other
information.14 is the respective rating of the parent. A threshold value of 10% provides a
way to deal with random errors in the evaluation from either parents or institutions. In case
14 For the shortened institutional questionnaires, the institution director was asked about the child’s group, thus providing all the information.
12
parents indicate that they do not know the response to a specific question, the indicator is set to
zero, that is we count this as a mismatch between parent and institution answer regardless of
the institution answer. Alternatively, one may want to treat these answers as missing. In
robustness checks, we also run our models under this assumption.
Quality measures. As noted above, our quality measures mainly relate to structural features
and, to a smaller degree, to process quality. Table 1 lists the three groups of quality measures
that we look at. For each quality measure, we assign a degree of observability based on
theoretical considerations. This measure combines the narrowly defined observability of the
information and the amount of communication necessary for gaining information on a certain
aspect. For aspects that are typically not directly observable by parents, we consider how much
effort it likely takes for parents to acquire information regarding the respective quality aspect.
For instance, information regarding activities is more likely to be regularly volunteered by
children and educators than information on educational qualifications of all group educators.
Structural features cover easily observable aspects, such as the opening hours, overall
group size, and the existence of a written pedagogical concept, as well as slightly less
observable aspects, such as the children-per-educator ratio and the number of educators in the
group (categorized as medium observability). Finally, we consider the number of children with
non-German family language in the group and the number of educators without a professional
degree in ECEC as two structural aspects that can only be observed with some effort (low
observability).
Another set of aspects covers education and playing activities, including music
education, language activities, and outdoor activities. These are likely to differ in terms of
observability. On the one hand, foreign language activities as well as painting and arts activities
yield direct results that the children can show to their parents. Similarly, trips outside the center
are usually announced and parents know about them. We therefore categorize them as highly
observable. On the other hand, observing math, science, or other daily educational activities,
which are routine, is more difficult for parents and, therefore, these are categorized as medium
observable.
The third group covers the pedagogical focus on subjects such as language, math, motor
function or health. We consider most of these items as medium observable, as parents are likely
to ask about them when making their decisions about where to enroll their child. We make an
exception for the foreign language activities as these usually require special training for the
educators (or even cooperation with external staff) and label this aspect highly observable.
13
Parental and ECEC center characteristics. The demand side variables capture the socio-
economic background of the family, specifically maternal employment status, her educational
attainment, the household’s net income, as well as an indicator for migration background of the
mother.
The supply side variables include indicators of the size of the center, whether it is run
by a public provider, and the share of children exempt from fees. Furthermore, the models
include one scale on the frequency of communication between parents and the institution. This
variable is the mean of four items about how often certain types of communication take place,
including daily conversations or parent evenings.15
Moreover, our models control for the length of time the child attends the center with
respect to its daily hours and the overall period, as the information gap may decrease as parents
learn more about the center’s quality. We also control for the child’s gender and age, if the child
has a chronic disease, the number of children in the household, the gender of the parent
answering the survey, the time between parental and institutional interview in days, plus
regional indicators for East Germany and urban areas. We also control for the level of the
quality measure as reported by the ECEC director. We test for multicollinearity of the variables
and include only those that are not multicollinear. For descriptive statistics of additional
variables, see Table A-1.
Methods. A main contribution of this paper is the in-depth descriptive analysis of the
information gap between parents and ECEC staff. To examine how information gaps relate to
demand and supply side characteristics, we use logistic regression models.
The existence of an information gap is estimated as follows:
1
Where is the binary variable as specified above, is the vector of socio-economic and
center-specific background variables, is a vector of control variables including a constant
term and is the level of quality as reported by the respective person in the institution.16
is the idiosyncratic error term, which we cluster at the group level.17
15 The scales of the items range from 1 (lowest) to 6 (highest). 16 Controlling for the quality level reported by ECEC professionals can be interpreted as a baseline measure of the quality. This is not necessarily correlated to the dependent variable which measures if there is an information gap or not. 17 In the overall sample, there are 62 groups with more than one child, 53 of which have two children. We therefore use clustered standard errors to obtain correct standard errors. However, more sophisticated models such as fixed effects are not feasible.
14
5 Results
Information gaps and observability
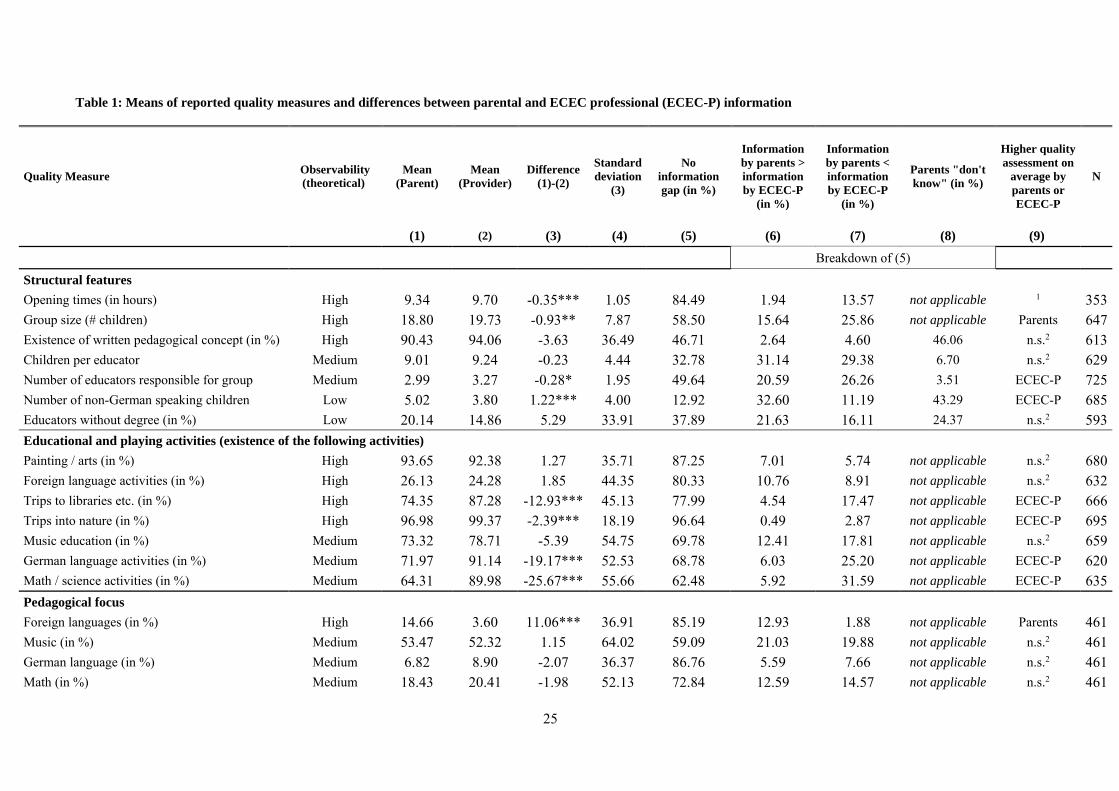
Initial bivariate results show that the parental and ECEC professionals’ assessments are
significantly different for a large share of the quality aspects (Table 1). We focus on structural
features first: With respect to opening hours, parents slightly underestimate the actual opening
hours; however, the difference is only about 20 minutes. Parents report smaller group sizes,
fewer educators for the group, and they report that there are more non-German speaking
children in the group than the ECEC professionals do. If we assume that, ceteris paribus, quality
increases with smaller groups, then in this respect parents report slightly higher levels of quality
than ECEC professionals. However, if we further assume that, ceteris paribus, fewer educators
per group and more children with a foreign family language may relate to a more difficult
learning environment, then parents underestimate the quality compared to ECEC professionals
(see Table 1, column 9). Moreover, as expected from our theoretical observability rating a large
percentage of parents report that they feel unable to provide any information on the number of
non-German speaking children and the share of educators without degree, the two aspects of
low observability. In addition, 46% of parents also indicate that they do not know if the centers
have a written pedagogical concept, which points to information problems, as its inherent
purpose is to inform parents.
When comparing the empirically measured information gaps with our theoretical
grouping by observability, the three aspects with the highest theoretical observability show very
high shares of no information gaps, which is what we expect (Table 1, column 5). However,
compared to the opening hours and the group-size, the degree of match for the existence of a
written pedagogical concept is low and relatively close to those aspects that we labeled as
“medium observable.” While parents tend to overestimate the quality concerning group size, a
highly observable item, they tend to underestimate quality in the cases of aspects with low
observability, such as the number of non-German speaking children in the group and the overall
share of educators without a degree. The incidence of no information gap is highest with respect
to the opening hours and lowest for the number of non-German speaking children, which seems
plausible given that information on opening hours is easy to observe whereas the number of
children with a non-German family language is not.
With respect to the education and playing activities, four out of seven differences are
statistically significant; the exceptions being “foreign language activities,” “painting/arts,” and
“music education.” It may be that these activities are especially important for the parental ECEC
15
selection processes and, thus, parents gather more information from the ECEC professionals
about them. Whenever there is a significant difference, parents tend to report fewer activities
than ECEC professionals, implying that they underestimate quality: While 72% of the parents
report that the center offers German language support activities, the share is higher among
ECEC professionals (91%). The incidence of no information gap is highest for activities such
as “trips into the nature” or “painting and art activities”, both easily observable activities, while
the share is lowest for less observable activities related to “math and science.” On average, 64%
of parents report that math or science activities are offered, while 90% of ECEC professionals
report that they offer these activities. Hence our theoretical observability grouping seems to fit
reasonably well with the observed information patterns for education and playing activities.
The overall level of information gaps for education and playing activities is lower than for the
structural features. In part, this may be explained by the fact that the activities were only
measured on a binary scale, while this was not the case for most of the structural features.
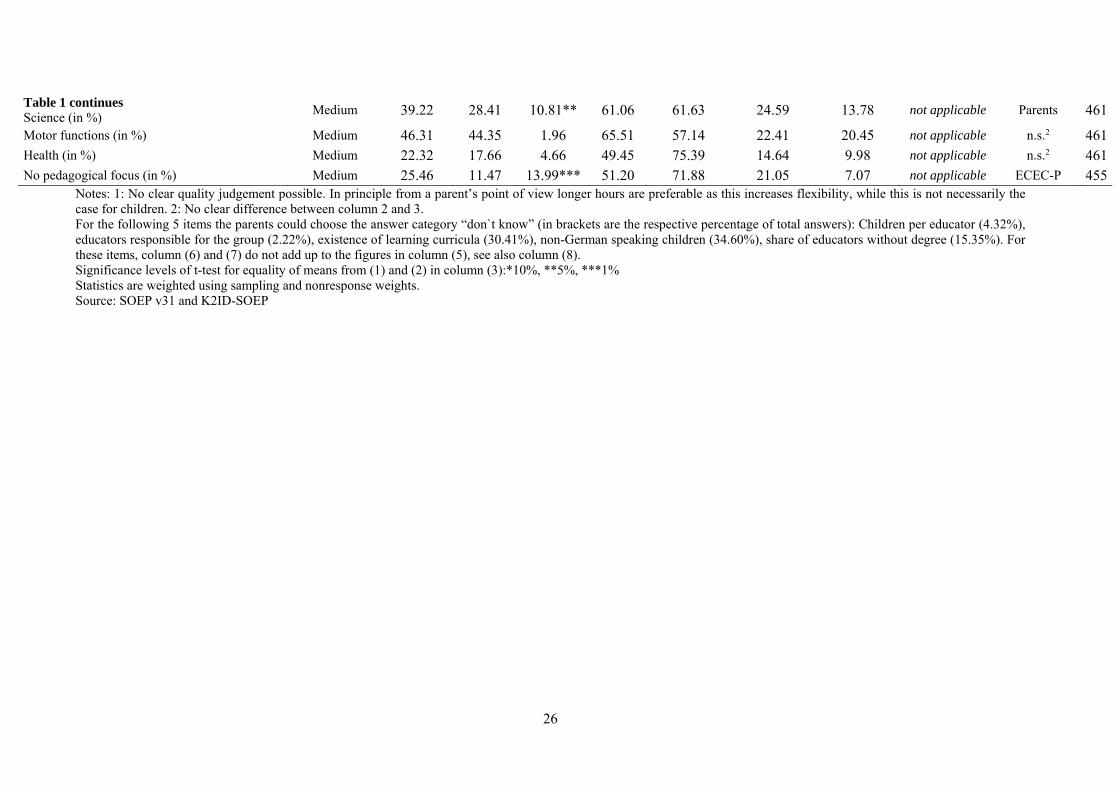
The incidence of no information gap is slightly lower with respect to the pedagogical
focus than for the shares for education and playing activities. One quarter of parents report that
there is no pedagogical focus as opposed to only 12% of the ECEC professionals. In line with
the observability grouping, the assessment of ECEC professionals and parents is mostly
identical with respect to a foreign language focus. Surprisingly, parent and ECEC professional
assessments also match well for a math focus. For all other types of activities, we observe
between 60 and 80 percent of cases with no information gap. However, for only three out of
eight aspects are the mean differences in the quality assessments statistically significant, as
over- and underestimations offset each other for the other aspects.
Parental and ECEC institution predictors of information gaps
Next we present results of our multivariate analyses, which investigate how the
existence of the various information gaps relates to characteristics of parents and ECEC centers.
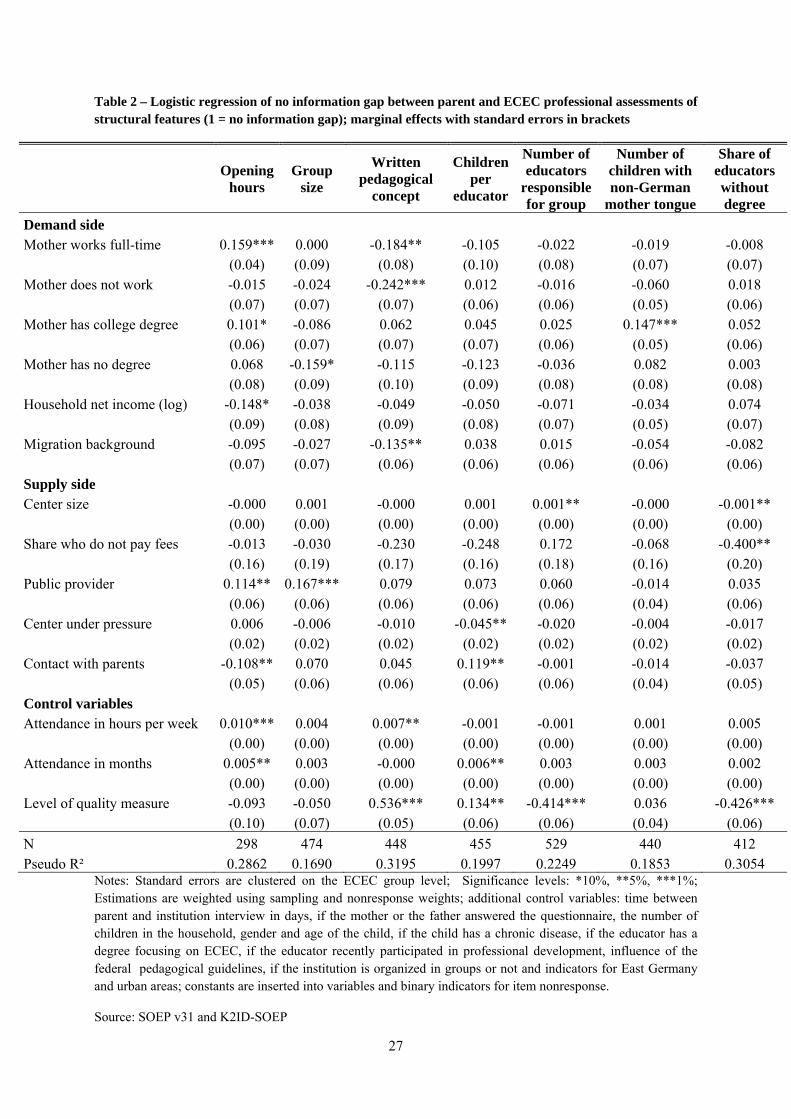
Table 2 reports the results for the structural features: With respect to the opening hours the
probability of no information gap is higher for mothers working full-time than for those working
part-time. Thus, mothers working longer hours seem to be better informed on this quality
measure, which is particularly important for them. However, full-time employed and non-
employed mothers are less informed about the existence of a pedagogical concept than mothers
working part-time. Parents with a migration background also appear to be less aware whether
the ECEC center has a written pedagogical concept. We observe few statistically significant
associations with respect to less observable quality characteristics with one exception:
Information gaps with respect to the number of children not speaking German at home are less
16
likely to be found among higher educated mothers. Overall, one can conclude that information
asymmetries for highly observable quality measures are more frequently related to parental
background than those for less observable characteristics.
We find few coherent significant associations of ECEC center characteristics with
information gaps in terms of structural features. The probability of no information gap with
respect to two of the most observable quality measures, opening hours and group size, is higher
for public than for non-profit providers. The share of children for which parents do not pay any
fees correlates negatively with the probability of no information gap with respect to the share
of educators without a degree. However, there is no clear pattern in terms of center
characteristics being more strongly associated with gaps for more or for less observable
characteristics.
Concerning other factors, as the number of hours a child spends in ECEC and the length
of tenure at a given center increase, the information gap regarding the ECEC’s quality
decreases. The latter is plausible as parents had more time to acquire information about quality.
Also, the levels of quality reported by the ECEC professionals are significantly related to the
probability of no information gap.18 Overall, demand and supply side factors appear to be of
similar importance with some statistically significant relationships for four and five out of seven
quality measures related to structural features, respectively.
For selected outcomes, we also show how these results vary when the threshold for
mismatch varies (see Table A 2.1 and A2.2 in the Appendix). The differences in thresholds only
matter for 3 out of six variables, namely the opening hours, the group size and the number of
children per educator. For the other three variables, the information gap does not significantly
vary by threshold levels. Thus table A 2.2 only presents the estimation results for the first three
quality measures. The results show that for smaller thresholds, results become less stable
compared to our main specification. Changing the threshold from 10% to 20% hardly affects
the results while changing them from 10% to an exact match leads to very different result. Most
associations which are strongly statistically significant in our main specification do not change
when using larger thresholds. We interpret this as an indicator that the results using very small
thresholds are more vulnerable to measurement error.
18 For the written pedagogical concept, which according to the ECEC professionals exists in 92% of the cases, the existence of such a concept is positively related to the probability of no information gap. This means that if such a concept exists, the likelihood that parents know about it is high, whereas if it does not exist, many parents still believe it does or answer that they do not know about it. In respect to the other quality levels, the interpretation is less intuitive.
17
As another robustness check, we test how the information gaps differ if we treat parents’
‘don’t know’ answers as missing values instead of a mismatch. The results are shown in Table
A-3 in the Appendix. The size of the information gap, only changes notably in the case of the
existence of a pedagogical concept, which is due to a particularly high share of parents
reporting to not know if a pedagogical concept exists. Moreover, we test if our estimations
change due to differences in the share of missing values. Overall, the new estimations result in
a loss of power and thus are difficult to compare with the main specification.19 Particularly, the
significant association between migration background and an information gap with respect to
the existence of a written pedagogical concept is affected, as many parents with migration
background report to not know if a pedagogical concept exists.
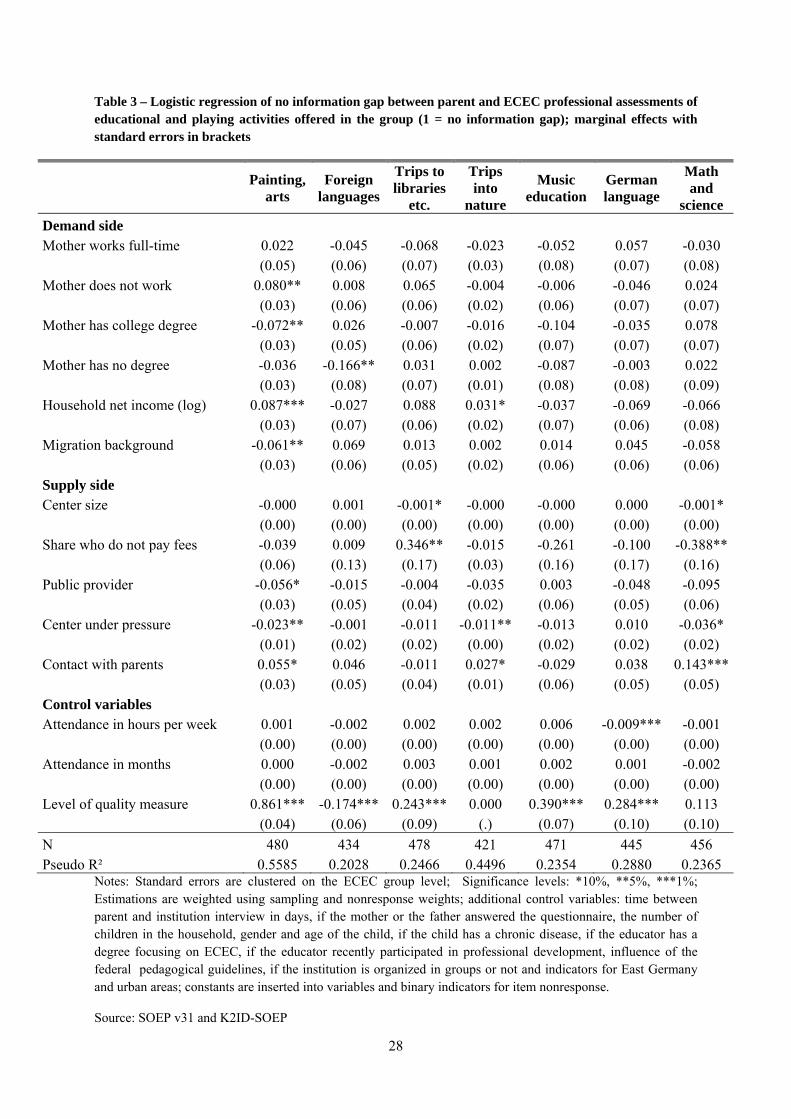
With respect to information gaps related to education and playing activities (Table 3),
parental background factors matter for three out of the four highly observable quality measures.
In particular, the knowledge of painting activities is highly influenced by demand side factors.
Demand side factors are not significantly related to medium observable quality measures. No
clear pattern emerges with respect to supply side factors and their relationship with high or
medium observable quality measures. If the center is smaller, if it is under pressure, or if more
frequent communication with parents takes place, the probability of no information gap is
greater in several cases. Very important as a predictor for information gaps related to these
measures is the reported level of quality: If an activity is offered at the center, the probability
of no information gap increases for almost all measures.
The information gap patterns are different with respect to the pedagogical focus –
independent of the observability of the quality measure, they appear to depend more on demand
side factors (Table 4). Household income correlates positively with no information gap with
respect to focuses on “foreign language,” “music,” “health,” and “motor functions.” The
employment status of the mother and her education also affect the existence of an information
gap. However, the direction of the associations differs by quality measures. Parents with a
migration background are more likely to report that their child’s ECEC center lacks a specific
focus than the center itself. The most remarkable supply side predictor of the probability of no
information gap is the center size. The larger the center, the more likely information gaps exist.
For all information gaps related to pedagogical focus, we find some statistically significant
relationships with parental characteristics. Although five out of eight measures of these
information gaps also related to center characteristics, only one characteristic shows consistent
patterns across various information gap measures.
19 These estimations are available from the authors upon request.
18
In a final step, we test how information gaps relate to the evaluation of the quality
measure by the ECEC-professionals. Figure 1 shows predicted probabilities of no information
gap depending on the quality level reported by the ECEC-professionals for selected outcomes20.
For these estimations, we rerun the multivariate logistic regression models (see Table 2-4). The
results can be interpreted as follows: When, for instance, the ECEC-professionals report that
no written pedagogical concept exists, less than 10% of the parents give the same answer.
Similarly, when the ECEC-professionals report that more educators are responsible for the
group or more have no degree, the information gap increases considerably. Similar patterns
emerge for some activities and pedagogical focuses. Thus, even if the ECEC professionals
report less favorable quality conditions, the parents do not seem to observe them. Possibly they
might have a standard ECEC center in mind with a written pedagogical concept, one,
professionally trained educator per group and a focus on certain activities.
6 Conclusion
In this paper we analyze information asymmetries between the parents and ECEC
professionals concerning various quality measures in the German ECEC market. We contribute
to the literature by investigating information asymmetries in a highly regulated childcare
system, by focusing on the perspectives of parents and ECEC professionals and by considering
structural quality indicators with varying levels of observability as opposed to focusing on
process quality, which is generally hard for parents to assess. The results of this study may be
transferable to other universal ECEC markets with low ECEC prices and without any rating
systems. We investigate how the probability of information asymmetries relates to three
dimensions: (i) theoretical observability of the respective quality aspects; (ii) parental socio-
economic background; and (iii) characteristics of the ECEC center. To do so, we exploit a rich
data set, with information regarding parents and ECEC professionals, as well as their respective
quality assessments based on identical quality measures.
With respect to structural features, information asymmetries are relatively high, ranging
between 42%21 and 87% mismatches between the information provided by parents and ECEC
professionals. Overall, information asymmetries are lower for the existence of education and
playing activities than for existence of a pedagogical focus. This indicates that parents are better
informed about day-to-day activities than about the relatively abstract concept of a pedagogical
20 Figures for the other quality measures are available from the authors upon request. 21 Not taking into account 16% for opening times, which are not really a quality aspect from a pedagogic point of view as discussed above.
19
focus. Remarkably, we find that for most aspects, where there are significant information
asymmetries, ECEC professionals report a higher level of quality than parents. This is in
contrast to studies that compare parental assessments with expert ratings, which usually found
parents to overestimate quality. To better understand the extent to which quality assessments
not only of parents but also of ECEC professionals may be subject to bias and may contribute
to inadequate information about ECEC quality for parents, future studies should further
examine potential sources of biases in ECEC professionals’ quality assessments of their own
ECEC institutions.
Our theoretical grouping of observability suits the data reasonably well. In particular
with respect to structural features and activities: information asymmetries are more likely to
occur for aspects that are difficult to observe or require parental enquiry. Our findings also
indicate that the socio-economic background of the parents and the characteristics of the centers
matter to some degree. For structural quality features as well as the education and playing
activities, we find that parental characteristics are more strongly associated with information
gaps regarding highly observable characteristics compared to less observable ones, which
seems plausible. Information gaps regarding the pedagogical focus also appear to be influenced
by parental background variables even though we considered them as medium observable.
Perhaps some, but not necessarily all, information about the pedagogical focus is frequently
accessible to parents and some groups of parents, therefore, feel they should know about this.
In addition, information gaps with respect to the pedagogical focus are also associated with
center characteristics suggesting that some institutions provide more information on this aspect
than others.
Interestingly the information gap frequently correlates strongly with the level of the
respective quality measure. Yet the direction of the relationship varies. If ECEC professionals
offer the respective education and playing activities, the probability that both parents and ECEC
professionals report this increases. However, if ECEC professionals report one or more types
of pedagogical focus, the probability of a match between parents’ and ECEC professionals’
reports decreases.
With respect to information asymmetries of households that are potentially less
privileged, the following findings are of particular interest: Parents with a migration
background are less likely to accurately know about the existence of a written pedagogical
concept and whether the ECEC centers have a pedagogical focus on German language support.
These results are important as these quality features relating to language competencies are likely
to be especially important for children with migration background. Thus one could argue that
20
children in minority households may particularly benefit from government-provided
information regarding childcare quality.
We find considerable information gaps for most quality features. This might be an
indication for a less than optimal interaction between parents and ECEC professionals, and thus
might influence child well-being. Yet, overall the gaps are only moderately related to parent
and center characteristics. One possible explanation may be that parents in Germany rely on
ECEC sector regulations and do not feel the need to inform themselves more thoroughly – this
might apply to all parents irrespective of their socio-economic background. Indeed, although
the quality in the German ECEC market is mediocre according to scientific standards (Tietze
et al. 2012), variation is also relatively low. Investing into gaining more information about
quality may, therefore, not be optimal for many groups. This is also in line with the fact that
prices are uninformative about quality and there is no external quality rating system. Yet one
may assume that more uniform quality assessments may benefit the daily interactions between
parents and ECEC professionals, who are not just parties to the exchange of a service good but
also actors both interested in the welfare of the children enrolled in ECEC services. In addition,
one could argue that parents should advocate for higher quality services if, on average, parents
asses the quality lower than the ECEC professionals.
To reduce the information gap on ECEC quality between parents and ECEC
professionals and thus to improve the quality of ECEC services and ultimately child well-being,
several possibilities may be considered: First, the government may set incentives for ECEC
centers to provide more information to parents before they make their ECEC decision and
regularly communicate thereafter. Second, a nationwide accreditation system might help to
improve the quality assessment of parents and ECEC professionals, as it helps to establish a
common basis of what good (minimum) quality standards are. Third, a rating system based
upon the nationwide quality accreditation system might further help overcome information
asymmetries between parents and ECEC professionals (see e.g. Spiess and Tietze 2003).
However, a rating system should be implemented carefully, as the US experience has shown
that they might increase inequalities in the use of high ECEC quality. If these ratings systems
increase ECEC costs it could be at the cost of some children from disadvantaged households
who may have to switch to informal care, while their advantaged counterparts are more likely
to use ECEC services of higher quality (see Herbst 2016). Thus, to promote children’s
wellbeing across socio-economic groups, it would be important to ensure that childcare fees for
children from disadvantaged families would not rise.
21
References
Akerlof, G. A. 1970. “The Market for Lemons: Quality Uncertainty and the Market Mechanism.” Quarterly Journal of Economics 84: 488-500.
Anders, Y. 2013. Stichwort: Auswirkungen frühkindlicher institutioneller Betreuung und Bildung. Paralleltitel: Keyword: Effects of centre-based early childhood education and care programmes. Zeitschrift für Erziehungswissenschaft 16 (2013) 2: 237-275.
Ansari, A. and E. Gershoff (2016): Parent Involvement in Head Start and Children’s Development: Indirect Effects Through Parenting. Journal of Marriage and Family 78(2): 562-579.
Araujo, M. C., P. Carneiro, Y. Cruz-Aguayo, and N. Schady 2016. Teacher Quality and Learning Outcomes in Kindergarten. The Quarterly Journal of Economics (7): 1415-1453.
Artz, B. and D. M. Welsch. 2014. “Childcare Quality and Pricing: Evidence from Wisconsin.” Applied Economics 46 (35): 4276-4289.
Auger, A., Farkas, G., Burchinal, M., Duncan, G., and Vandell, D. 2014. Preschool center care quality effects on academic achievement: An instrumental variables analysis. Developmental Psychology, 50, 2559-2571.
Barnett, W. S. 2011. "Effectiveness of Early Educational Intervention." Science 333: 975-978.
Barros, S., and Leal, T. B.. 2015. Parents’ and teachers’ perceptions of quality in Portuguese childcare classrooms. European Journal of Psychology of Education 30(2): 209–226. Bertelsmann Stiftung. 2008. Länderreport Frühkindliche Bildungssysteme. Gütersloh.
Bassok, Daphna, Anna J. Markowitz, Daniel Player and Michelle Zagardo (2017): Do Parents Know "High Quality" Preschool When They See It? EdPolicy Works Working Papers Series No. 54. January 2017.
Blau, D. M. 2001. The Child Care Problem: An Economic Analysis. New York: Russel Sage Foundation.
Blau, D. M. and Hagy, A. 1998. "The Demand for Quality in Child Care." Journal of Political Economy 106(1): 104-146.
Bock-Famulla, K., J. Lange and E. Strunz 2015. Länderreport Frühkindliche Bildungssysteme 2015. Bertelsmann Verlag, Bielefeld.
Burger, K. 2010. "How Does Early Childhood Care and Education Affect Cognitive Development? An International Review of the Effects of Early Intervention for Children From Different Social Backgrounds." Early Childhood Research Quarterly 25(2): 140-165.
Camilli, G., S. Vargas, S. Ryan, and W.S. Barnett. 2010. "Meta-Analysis of the Effects of Early Education Interventions on Cognitive and Social Development." Teachers College Record 112(3): 579-620.
Camehl, G., H.S. Stahl, P. S. Schober and C. K. Spiess. 2015a. "Höhere Qualität und geringere Kosten von Kindertageseinrichtungen – zufriedenere Eltern?" DIW Wochenbericht 82(46): 1105-1113.
Camehl, G., P. S. Schober and C. K. Spiess. 2015b. "A SOEP-Related Study: Early Childhood Education and Care Quality in the Socio-Economic Panel (K2ID-SOEP)." In: SOEP Wave Report 2014, edited by Gerstorf, S. and J. Schupp. Berlin.
22
Cryer, D. and Burchinal, M. 1997. "Parents as child care consumers." Early Childhood Research Quarterly 12: 35-58.
Cryer, D., W. Tietze and H. Wessels. 2002. "Parents’ Perceptions of Their Children’s Child Care: A Cross-national Comparison." Early Childhood Research Quarterly 17: 259–277.
Diskowski, D. 2009. "Zur Entwicklung der Kindertagesbetreuung – Die Qualitäts- und die Bildungsdebatte in der Kindertagesbetreuung." Recht der Jugend und des Bildungswesens 1: 93–113.
ECCE-Study Group 1997 = European Child Care and Education — Study Group (1997): European Child Care and Education Study. Cross national analyses of the quality and effects of early childhood programmes on children’s development. Berlin: Freie Universität Berlin
Elango, S., J.L. García, J. J. Heckman and A. Hojman. 2015. "Early Childhood Education." IZA Discussion Paper 9476. Bonn.
Fenge, R. and M. Wrede. 2015. "The Quality of Child Care: A Signaling Game with Incomplete Information." Beiträge zur Jahrestagung des Vereins für Socialpolitik 2015: Ökonomische Entwicklung - Theorie und Politik - Session: Children 1, No. E07-V1.
Froehlich Chow, A. and M. L. Humbert. 2014. “Perceptions on Early Childhood Educators: Factors Influencing the Promotion of Physical Activity Opportunities in Canadian Rural Care Centers”. Child Indicators Research 7: 57-73.
Grammatikopoulos, V., Gregoriadis, A., Tsigilis, N., and Zachopoulou, E. 2014. Parental conceptions of quality in Greek early childhood education. European Early Childhood Education Research Journal 22(1): 134–148.
Hagy, A. P. 1997. "The Demand for Child Care Quality: A Hedonic Price Theory Approach." Journal of Human Resources 33: 683-710.
Harris, N. and B. Tinning 2012. Hearing parents' and carers' voices: experiences of accessing quality long day care in northern regional Australia. Australasian Journal of Early Childhood 37(3): 14-21.
Helburn, S. and B.R. Bergmann. 2002. America`s Childcare Problem: The Way Out. New York: Palgrave Press.
Herbst, C. 2016. The Impact of Quality Rating and Improvement Systems on Families’ Child Care Choices and the Supply of Child Care Labor. IZA DP No. 10383, Bonn.
Howe, N., Jacobs, E., Vukelich, G., and Recchia, H. 2013. Canadian parents’ knowledge and satisfaction regarding their child's day-care experience. Journal of Early Childhood Research 11(2): 133–148.
Johansen, A. S., A. Leibowitz and L. J. Waite. 1996. "The Importance of Child-Care Characteristics to Choice of Care." Journal of Marriage and Family 58: 759-772.
Kärrby, G., and Giota, J. 1995. Parental conceptions of quality in daycare centers in relation to quality measured by the ECERS. Early Child Development and Care 110(1): 1–18.
Khoury-Kassabri, M.; Attar-Schwartz, S. and H. Zur. 2014. The Likelihood of Using Corporal Punishment by Kindergarten Teachers: The Role of Parent-Teacher Partnership, Attitudes, and Reliogisity. Child Indicators Research 7: 368-386.
23
Lehrer, J. S., Lemay, L., and Bigras, N. 2015. Parental Perceptions of Child Care Quality in Centre-Based and Home-Based Settings : Associations with External Quality Ratings. International Journal of Early Childhood 47(3): 481–497.
Meyers, M. K. and L. P. Jordan. 2006. "Choice and Accommodation in Parental Child Care Decisions." Community Development 37(2): 53-70.
Mocan, N. 2007. "Can Consumers Detect Lemons? An Empirical Analysis of Information Asymmetry in the Market for Child Care." Journal of Population Economics 20: 743-780.
OECD 2015. "Structural Policy Indicators." In: Economic Policy Reforms 2015 - Going for Growth. Paris: OECD publishing.
Pierrehumbert, B.; T. Ramstein; A. Karmaniola; R. Miljkovitch and O. Halfon (2002): Quality of child care in the preschool years: A comparison of the influence of home care and day care characteristics on child outcome. International Journal of Behavioral Development 26(5): 385-396.
Rentzou, K., and Sakellariou, M. 2013. Researcher’s and parents' perspectives on quality of care and education. Early Child Development and Care 183(2): 294–307.
Pia S. Schober, C. Katharina Spieß, Juliane F. Stahl, Gundula Zoch and Georg F. Camehl (2017): The Early childhood education and care quality in the Socio-Economic Panel (SOEP-ECEC Quality) study – K2ID-SOEP- Data. DIW Data Documentation No. 91, Berlin.
Schober, P. 2014. Early childhood education and care provision for children under three in Germany: en route to the legal entitlement, in Leon, M. (ed.) The Transformation of Care in European Societies. London: Palgrave, 208-232
Schober, P. S. and C. K. Spiess. 2013. Early Childhood Education Activities and Care Arrangements of Disadvataged Children in Germany. Child Indicators Research 6: 709-735.
Schröder, M., R. Siegers and C. K. Spiess. 2013. "Familien in Deutschland – FiD." Schmollers Jahrbuch. Journal of Applied Social Science Studies 133: 595-606.
Schröder, C., C. K. Spiess and J. Storck. 2015. “Private Spending on Children’s Education: Low-Income Families Pay Relatively More,” DIW Economic Bulletin (8: 113-123).
Spiess, C. K. 1998. Staatliche Eingriffe in Märkte für Kinderbetreuung. Analysen im deutsch-amerikanischen Vergleich. Frankfurt a.M./New York: Campus Verlag, Reihe Wirtschaftswissenschaften.
Spiess, C. K. and W. Tietze. 2002. "Qualitätssicherung in Kindertageseinrichtungen – Gründe, Anforderungen und Umsetzungsüberlegungen für ein Gütesiegel." Zeitschrift für Erziehungswissenschaften 1: 139-162.
Spiess, C. K. 2008. "Early Childhood Education and Care in Germany: The Status Quo and Reform Proposals." Zeitschrift für Betriebswirtschaftslehre 67: 1-20.
Spiess, C. K., E. M. Berger and O. Groh-Samberg. 2008. "Overcoming Disparities and Expanding Access to Early Childhood Services in Germany: Policy Considerations and Funding Options." UNICEF Innocenti Research Centre Working Paper IWP-2008-03.
Statistisches Bundesamt. 2016. Statistiken der Kinder- und Jugendhilfe. Kinder und tätige Personen in Tageseinrichtungen und in öffentlich geförderter Kindertagespflege am 01.03.2015. Wiesbaden.
24
Tietze, W., Becker-Stoll, F., Bensel, J., Eckhardt, A., Haug-Schnabel, G., Kalicki, B., Keller, H. and Leyendecker, B. 2012. NUBBEK. Nationale Untersuchung zur Bildung, Betreuung und Erziehung in der frühen Kindheit. Fragestellungen und Ergebnisse im Überblick, Berlin.
Torquati, J. C., Raikes, H. H., Huddleston-Casas, C. A., Bovaird, J. A., & Harris, B. A. 2011. Family income, parent education, and perceived constraints as predictors of observed program quality and parent rated program quality. Early Childhood Research Quarterly 26(4): 453–464.
Wagner, G. G., Frick, J. R. and Schupp, J. 2007. "The German Socio-Economic Panel Study (SOEP) - Scope, evolution, and enhancements." Schmollers Jahrbuch 127: 139-169.
Weaven, S. and D. Grace (2010): Examining Parental and Staff Perceptions of Childcare Service Quality across Competing Business Structure. Australasian Journal of Early Childhood 35(2): 54-62.
Wrohlich, K. 2008. "The excess demand for subsidized child care in Germany". Applied Economics 40: 1217-1228.
Xiao, M. 2010. “Is Quality Accreditation Effective? Evidence from the Childcare Market.” International Journal of Industrial Organization 28: 708–721.
25
Table 1: Means of reported quality measures and differences between parental and ECEC professional (ECEC-P) information
Quality Measure Observability (theoretical)
Mean (Parent)
Mean (Provider)
Difference (1)-(2)
Standard deviation
(3)
No information gap (in %)
Information by parents > information by ECEC-P
(in %)
Information by parents < information by ECEC-P
(in %)
Parents "don't know" (in %)
Higher quality assessment on
average by parents or ECEC-P
N
(1) (2) (3) (4) (5) (6) (7) (8) (9)
Breakdown of (5)
Structural features
Opening times (in hours) High 9.34 9.70 -0.35*** 1.05 84.49 1.94 13.57 not applicable 1 353
Group size (# children) High 18.80 19.73 -0.93** 7.87 58.50 15.64 25.86 not applicable Parents 647
Existence of written pedagogical concept (in %) High 90.43 94.06 -3.63 36.49 46.71 2.64 4.60 46.06 n.s.2 613
Children per educator Medium 9.01 9.24 -0.23 4.44 32.78 31.14 29.38 6.70 n.s.2 629
Number of educators responsible for group Medium 2.99 3.27 -0.28* 1.95 49.64 20.59 26.26 3.51 ECEC-P 725
Number of non-German speaking children Low 5.02 3.80 1.22*** 4.00 12.92 32.60 11.19 43.29 ECEC-P 685
Educators without degree (in %) Low 20.14 14.86 5.29 33.91 37.89 21.63 16.11 24.37 n.s.2 593
Educational and playing activities (existence of the following activities)
Painting / arts (in %) High 93.65 92.38 1.27 35.71 87.25 7.01 5.74 not applicable n.s.2 680
Foreign language activities (in %) High 26.13 24.28 1.85 44.35 80.33 10.76 8.91 not applicable n.s.2 632
Trips to libraries etc. (in %) High 74.35 87.28 -12.93*** 45.13 77.99 4.54 17.47 not applicable ECEC-P 666
Trips into nature (in %) High 96.98 99.37 -2.39*** 18.19 96.64 0.49 2.87 not applicable ECEC-P 695
Music education (in %) Medium 73.32 78.71 -5.39 54.75 69.78 12.41 17.81 not applicable n.s.2 659
German language activities (in %) Medium 71.97 91.14 -19.17*** 52.53 68.78 6.03 25.20 not applicable ECEC-P 620
Math / science activities (in %) Medium 64.31 89.98 -25.67*** 55.66 62.48 5.92 31.59 not applicable ECEC-P 635
Pedagogical focus
Foreign languages (in %) High 14.66 3.60 11.06*** 36.91 85.19 12.93 1.88 not applicable Parents 461
Music (in %) Medium 53.47 52.32 1.15 64.02 59.09 21.03 19.88 not applicable n.s.2 461
German language (in %) Medium 6.82 8.90 -2.07 36.37 86.76 5.59 7.66 not applicable n.s.2 461
Math (in %) Medium 18.43 20.41 -1.98 52.13 72.84 12.59 14.57 not applicable n.s.2 461
26
Table 1 continues Science (in %)
Medium 39.22 28.41 10.81** 61.06 61.63 24.59 13.78 not applicable Parents 461
Motor functions (in %) Medium 46.31 44.35 1.96 65.51 57.14 22.41 20.45 not applicable n.s.2 461
Health (in %) Medium 22.32 17.66 4.66 49.45 75.39 14.64 9.98 not applicable n.s.2 461
No pedagogical focus (in %) Medium 25.46 11.47 13.99*** 51.20 71.88 21.05 7.07 not applicable ECEC-P 455 Notes: 1: No clear quality judgement possible. In principle from a parent’s point of view longer hours are preferable as this increases flexibility, while this is not necessarily the case for children. 2: No clear difference between column 2 and 3. For the following 5 items the parents could choose the answer category “don`t know” (in brackets are the respective percentage of total answers): Children per educator (4.32%), educators responsible for the group (2.22%), existence of learning curricula (30.41%), non-German speaking children (34.60%), share of educators without degree (15.35%). For these items, column (6) and (7) do not add up to the figures in column (5), see also column (8). Significance levels of t-test for equality of means from (1) and (2) in column (3):*10%, **5%, ***1% Statistics are weighted using sampling and nonresponse weights. Source: SOEP v31 and K2ID-SOEP
27
Table 2 – Logistic regression of no information gap between parent and ECEC professional assessments of structural features (1 = no information gap); marginal effects with standard errors in brackets
Opening hours
Group size
Written pedagogical
concept
Children per
educator
Number of educators
responsible for group
Number of children with non-German
mother tongue
Share of educators without degree
Demand side Mother works full-time 0.159*** 0.000 -0.184** -0.105 -0.022 -0.019 -0.008 (0.04) (0.09) (0.08) (0.10) (0.08) (0.07) (0.07) Mother does not work -0.015 -0.024 -0.242*** 0.012 -0.016 -0.060 0.018 (0.07) (0.07) (0.07) (0.06) (0.06) (0.05) (0.06) Mother has college degree 0.101* -0.086 0.062 0.045 0.025 0.147*** 0.052 (0.06) (0.07) (0.07) (0.07) (0.06) (0.05) (0.06) Mother has no degree 0.068 -0.159* -0.115 -0.123 -0.036 0.082 0.003 (0.08) (0.09) (0.10) (0.09) (0.08) (0.08) (0.08) Household net income (log) -0.148* -0.038 -0.049 -0.050 -0.071 -0.034 0.074 (0.09) (0.08) (0.09) (0.08) (0.07) (0.05) (0.07) Migration background -0.095 -0.027 -0.135** 0.038 0.015 -0.054 -0.082 (0.07) (0.07) (0.06) (0.06) (0.06) (0.06) (0.06) Supply side Center size -0.000 0.001 -0.000 0.001 0.001** -0.000 -0.001** (0.00) (0.00) (0.00) (0.00) (0.00) (0.00) (0.00) Share who do not pay fees -0.013 -0.030 -0.230 -0.248 0.172 -0.068 -0.400** (0.16) (0.19) (0.17) (0.16) (0.18) (0.16) (0.20) Public provider 0.114** 0.167*** 0.079 0.073 0.060 -0.014 0.035 (0.06) (0.06) (0.06) (0.06) (0.06) (0.04) (0.06) Center under pressure 0.006 -0.006 -0.010 -0.045** -0.020 -0.004 -0.017 (0.02) (0.02) (0.02) (0.02) (0.02) (0.02) (0.02) Contact with parents -0.108** 0.070 0.045 0.119** -0.001 -0.014 -0.037 (0.05) (0.06) (0.06) (0.06) (0.06) (0.04) (0.05) Control variables Attendance in hours per week 0.010*** 0.004 0.007** -0.001 -0.001 0.001 0.005 (0.00) (0.00) (0.00) (0.00) (0.00) (0.00) (0.00) Attendance in months 0.005** 0.003 -0.000 0.006** 0.003 0.003 0.002 (0.00) (0.00) (0.00) (0.00) (0.00) (0.00) (0.00) Level of quality measure -0.093 -0.050 0.536*** 0.134** -0.414*** 0.036 -0.426*** (0.10) (0.07) (0.05) (0.06) (0.06) (0.04) (0.06)
N 298 474 448 455 529 440 412 Pseudo R² 0.2862 0.1690 0.3195 0.1997 0.2249 0.1853 0.3054
Notes: Standard errors are clustered on the ECEC group level; Significance levels: *10%, **5%, ***1%; Estimations are weighted using sampling and nonresponse weights; additional control variables: time between parent and institution interview in days, if the mother or the father answered the questionnaire, the number of children in the household, gender and age of the child, if the child has a chronic disease, if the educator has a degree focusing on ECEC, if the educator recently participated in professional development, influence of the federal pedagogical guidelines, if the institution is organized in groups or not and indicators for East Germany and urban areas; constants are inserted into variables and binary indicators for item nonresponse.
Source: SOEP v31 and K2ID-SOEP
28
Table 3 – Logistic regression of no information gap between parent and ECEC professional assessments of educational and playing activities offered in the group (1 = no information gap); marginal effects with standard errors in brackets
Painting, arts
Foreign languages
Trips to libraries
etc.
Trips into
nature
Music education
German language
Math and
science
Demand side Mother works full-time 0.022 -0.045 -0.068 -0.023 -0.052 0.057 -0.030 (0.05) (0.06) (0.07) (0.03) (0.08) (0.07) (0.08) Mother does not work 0.080** 0.008 0.065 -0.004 -0.006 -0.046 0.024 (0.03) (0.06) (0.06) (0.02) (0.06) (0.07) (0.07) Mother has college degree -0.072** 0.026 -0.007 -0.016 -0.104 -0.035 0.078 (0.03) (0.05) (0.06) (0.02) (0.07) (0.07) (0.07) Mother has no degree -0.036 -0.166** 0.031 0.002 -0.087 -0.003 0.022 (0.03) (0.08) (0.07) (0.01) (0.08) (0.08) (0.09) Household net income (log) 0.087*** -0.027 0.088 0.031* -0.037 -0.069 -0.066 (0.03) (0.07) (0.06) (0.02) (0.07) (0.06) (0.08) Migration background -0.061** 0.069 0.013 0.002 0.014 0.045 -0.058 (0.03) (0.06) (0.05) (0.02) (0.06) (0.06) (0.06) Supply side Center size -0.000 0.001 -0.001* -0.000 -0.000 0.000 -0.001* (0.00) (0.00) (0.00) (0.00) (0.00) (0.00) (0.00) Share who do not pay fees -0.039 0.009 0.346** -0.015 -0.261 -0.100 -0.388** (0.06) (0.13) (0.17) (0.03) (0.16) (0.17) (0.16) Public provider -0.056* -0.015 -0.004 -0.035 0.003 -0.048 -0.095 (0.03) (0.05) (0.04) (0.02) (0.06) (0.05) (0.06) Center under pressure -0.023** -0.001 -0.011 -0.011** -0.013 0.010 -0.036* (0.01) (0.02) (0.02) (0.00) (0.02) (0.02) (0.02) Contact with parents 0.055* 0.046 -0.011 0.027* -0.029 0.038 0.143*** (0.03) (0.05) (0.04) (0.01) (0.06) (0.05) (0.05) Control variables Attendance in hours per week 0.001 -0.002 0.002 0.002 0.006 -0.009*** -0.001 (0.00) (0.00) (0.00) (0.00) (0.00) (0.00) (0.00) Attendance in months 0.000 -0.002 0.003 0.001 0.002 0.001 -0.002 (0.00) (0.00) (0.00) (0.00) (0.00) (0.00) (0.00) Level of quality measure 0.861*** -0.174*** 0.243*** 0.000 0.390*** 0.284*** 0.113 (0.04) (0.06) (0.09) (.) (0.07) (0.10) (0.10)
N 480 434 478 421 471 445 456 Pseudo R² 0.5585 0.2028 0.2466 0.4496 0.2354 0.2880 0.2365
Notes: Standard errors are clustered on the ECEC group level; Significance levels: *10%, **5%, ***1%; Estimations are weighted using sampling and nonresponse weights; additional control variables: time between parent and institution interview in days, if the mother or the father answered the questionnaire, the number of children in the household, gender and age of the child, if the child has a chronic disease, if the educator has a degree focusing on ECEC, if the educator recently participated in professional development, influence of the federal pedagogical guidelines, if the institution is organized in groups or not and indicators for East Germany and urban areas; constants are inserted into variables and binary indicators for item nonresponse.
Source: SOEP v31 and K2ID-SOEP
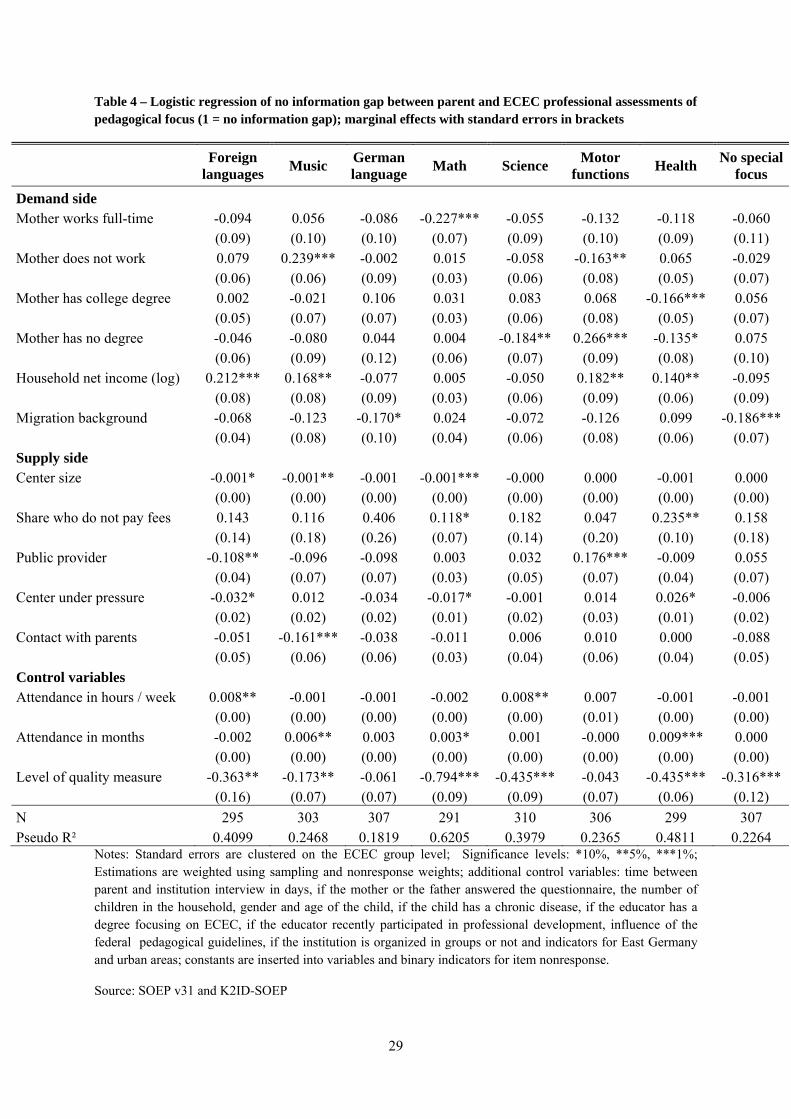
29
Table 4 – Logistic regression of no information gap between parent and ECEC professional assessments of pedagogical focus (1 = no information gap); marginal effects with standard errors in brackets
Foreign languages
Music German language
Math Science Motor
functions Health
No special focus
Demand side Mother works full-time -0.094 0.056 -0.086 -0.227*** -0.055 -0.132 -0.118 -0.060 (0.09) (0.10) (0.10) (0.07) (0.09) (0.10) (0.09) (0.11) Mother does not work 0.079 0.239*** -0.002 0.015 -0.058 -0.163** 0.065 -0.029 (0.06) (0.06) (0.09) (0.03) (0.06) (0.08) (0.05) (0.07) Mother has college degree 0.002 -0.021 0.106 0.031 0.083 0.068 -0.166*** 0.056 (0.05) (0.07) (0.07) (0.03) (0.06) (0.08) (0.05) (0.07) Mother has no degree -0.046 -0.080 0.044 0.004 -0.184** 0.266*** -0.135* 0.075 (0.06) (0.09) (0.12) (0.06) (0.07) (0.09) (0.08) (0.10) Household net income (log) 0.212*** 0.168** -0.077 0.005 -0.050 0.182** 0.140** -0.095 (0.08) (0.08) (0.09) (0.03) (0.06) (0.09) (0.06) (0.09) Migration background -0.068 -0.123 -0.170* 0.024 -0.072 -0.126 0.099 -0.186*** (0.04) (0.08) (0.10) (0.04) (0.06) (0.08) (0.06) (0.07) Supply side Center size -0.001* -0.001** -0.001 -0.001*** -0.000 0.000 -0.001 0.000 (0.00) (0.00) (0.00) (0.00) (0.00) (0.00) (0.00) (0.00) Share who do not pay fees 0.143 0.116 0.406 0.118* 0.182 0.047 0.235** 0.158 (0.14) (0.18) (0.26) (0.07) (0.14) (0.20) (0.10) (0.18) Public provider -0.108** -0.096 -0.098 0.003 0.032 0.176*** -0.009 0.055 (0.04) (0.07) (0.07) (0.03) (0.05) (0.07) (0.04) (0.07) Center under pressure -0.032* 0.012 -0.034 -0.017* -0.001 0.014 0.026* -0.006 (0.02) (0.02) (0.02) (0.01) (0.02) (0.03) (0.01) (0.02) Contact with parents -0.051 -0.161*** -0.038 -0.011 0.006 0.010 0.000 -0.088 (0.05) (0.06) (0.06) (0.03) (0.04) (0.06) (0.04) (0.05) Control variables Attendance in hours / week 0.008** -0.001 -0.001 -0.002 0.008** 0.007 -0.001 -0.001 (0.00) (0.00) (0.00) (0.00) (0.00) (0.01) (0.00) (0.00) Attendance in months -0.002 0.006** 0.003 0.003* 0.001 -0.000 0.009*** 0.000 (0.00) (0.00) (0.00) (0.00) (0.00) (0.00) (0.00) (0.00) Level of quality measure -0.363** -0.173** -0.061 -0.794*** -0.435*** -0.043 -0.435*** -0.316*** (0.16) (0.07) (0.07) (0.09) (0.09) (0.07) (0.06) (0.12)
N 295 303 307 291 310 306 299 307 Pseudo R² 0.4099 0.2468 0.1819 0.6205 0.3979 0.2365 0.4811 0.2264
Notes: Standard errors are clustered on the ECEC group level; Significance levels: *10%, **5%, ***1%; Estimations are weighted using sampling and nonresponse weights; additional control variables: time between parent and institution interview in days, if the mother or the father answered the questionnaire, the number of children in the household, gender and age of the child, if the child has a chronic disease, if the educator has a degree focusing on ECEC, if the educator recently participated in professional development, influence of the federal pedagogical guidelines, if the institution is organized in groups or not and indicators for East Germany and urban areas; constants are inserted into variables and binary indicators for item nonresponse.
Source: SOEP v31 and K2ID-SOEP
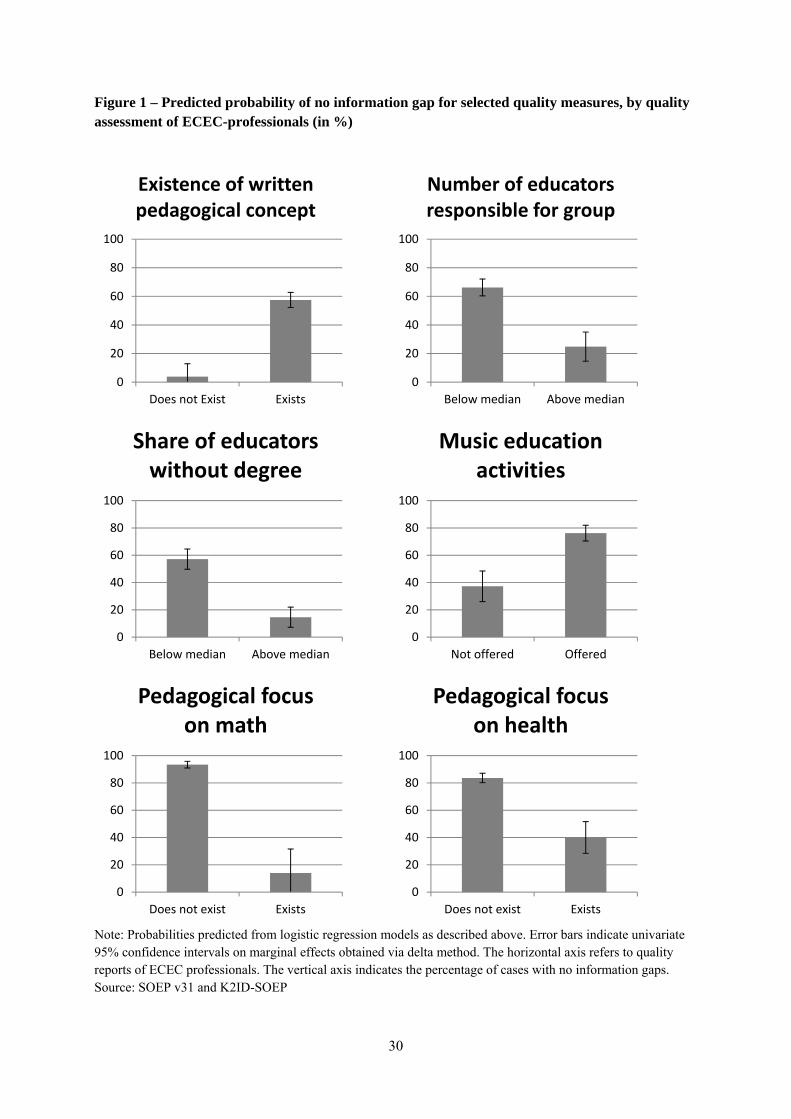
30
Figure 1 – Predicted probability of no information gap for selected quality measures, by quality assessment of ECEC-professionals (in %)
Note: Probabilities predicted from logistic regression models as described above. Error bars indicate univariate 95% confidence intervals on marginal effects obtained via delta method. The horizontal axis refers to quality reports of ECEC professionals. The vertical axis indicates the percentage of cases with no information gaps. Source: SOEP v31 and K2ID-SOEP
0
20
40
60
80
100
Does not Exist Exists
Existence of written pedagogical concept
0
20
40
60
80
100
Below median Above median
Share of educators without degree
0
20
40
60
80
100
Below median Above median
Number of educators responsible for group
0
20
40
60
80
100
Not offered Offered
Music education activities
0
20
40
60
80
100
Does not exist Exists
Pedagogical focus on health
0
20
40
60
80
100
Does not exist Exists
Pedagogical focus on math

31
Appendix A – Additional tables
Table A-1- Descriptive statistics of independent variables
Parental background variables N
Mother works full-time (%) 15.63 801
Mother works part-time (%) 44.51 801
Mother does not work (%) 39.86 801
Mother college degree (%) 28.62 801
Mother vocational degree (%) 57.41 801
Mother no degree (%) 13.84 801
Household net income (mean in €) 3489.74 774
Migration background of the mother (%) 28.51 801
ECEC center and staff characteristics
Center size (number of children) 83.87 761
Share who do not pay fees (%) 16.55 481
Public provider (%) 67.30 596
Center under pressure (mean, scale 1-6) 2.51 597
Contact with parents (mean, scale 1-6) 2.86 605
Educator has qualification focused on ECEC (%) 38.28 534
Educator took part in professional development on quality during last 12 months (%) 34.78 472
Educator took part in professional development on cooperation with parents during last 12 months (%) 20.94 472
Share of children under 3 years in institution (%) 19.61 732
Influence of the state learning curriculum (mean, scale 1-6) 4.69 564
Control variables
Attendance in hours per week (mean) 31.59 772
Attendance in months (mean) 20.53 798
Age of child in months (mean) 49.60 801
Mother answered parent questionnaire (%) 79.78 801
Female child (%) 43.26 801
Child had serious illness in the past (%) 41.27 634
Household in East Germany (%) 21.29 801
Household in urban area (%) 46.22 801
Days between parent and institution interviews (median) 189 801
Note: Statistics are weighted using sampling and nonresponse weights.
Source: SOEP v31 and K2ID-SOEP
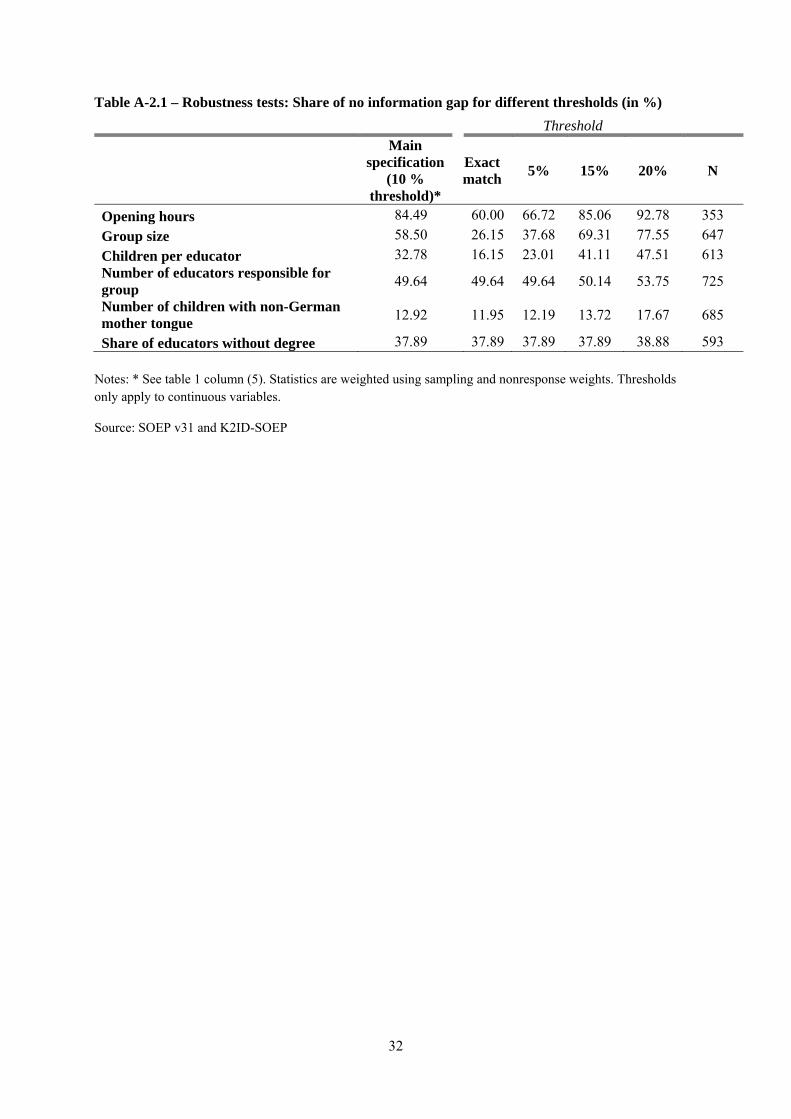
32
Table A-2.1 – Robustness tests: Share of no information gap for different thresholds (in %)
Threshold
Main specification
(10 % threshold)*
Exact match
5% 15% 20% N
Opening hours 84.49 60.00 66.72 85.06 92.78 353
Group size 58.50 26.15 37.68 69.31 77.55 647
Children per educator 32.78 16.15 23.01 41.11 47.51 613 Number of educators responsible for group
49.64 49.64 49.64 50.14 53.75 725
Number of children with non-German mother tongue
12.92 11.95 12.19 13.72 17.67 685
Share of educators without degree 37.89 37.89 37.89 37.89 38.88 593 Notes: * See table 1 column (5). Statistics are weighted using sampling and nonresponse weights. Thresholds only apply to continuous variables.
Source: SOEP v31 and K2ID-SOEP
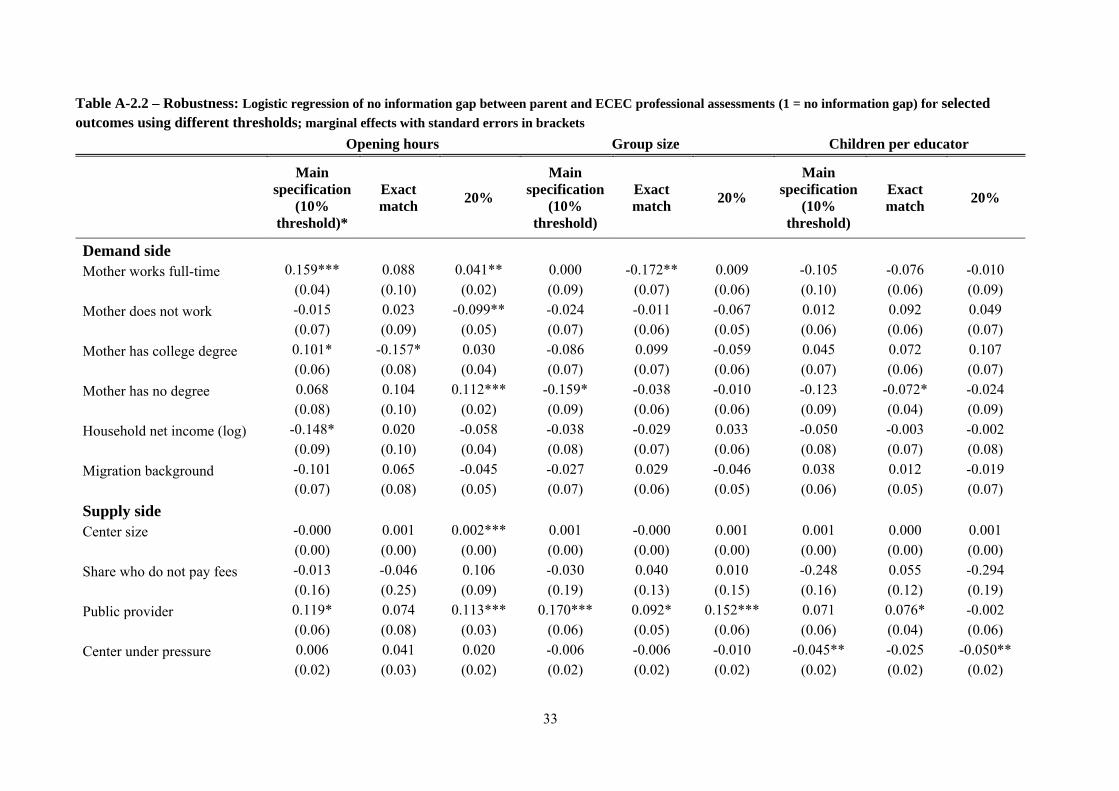
33
Table A-2.2 – Robustness: Logistic regression of no information gap between parent and ECEC professional assessments (1 = no information gap) for selected outcomes using different thresholds; marginal effects with standard errors in brackets
Opening hours Group size Children per educator
Main specification
(10% threshold)*
Exact match
20%
Main specification
(10% threshold)
Exact match
20%
Main specification
(10% threshold)
Exact match
20%
Demand side
Mother works full-time 0.159*** 0.088 0.041** 0.000 -0.172** 0.009 -0.105 -0.076 -0.010
(0.04) (0.10) (0.02) (0.09) (0.07) (0.06) (0.10) (0.06) (0.09)
Mother does not work -0.015 0.023 -0.099** -0.024 -0.011 -0.067 0.012 0.092 0.049
(0.07) (0.09) (0.05) (0.07) (0.06) (0.05) (0.06) (0.06) (0.07)
Mother has college degree 0.101* -0.157* 0.030 -0.086 0.099 -0.059 0.045 0.072 0.107
(0.06) (0.08) (0.04) (0.07) (0.07) (0.06) (0.07) (0.06) (0.07)
Mother has no degree 0.068 0.104 0.112*** -0.159* -0.038 -0.010 -0.123 -0.072* -0.024
(0.08) (0.10) (0.02) (0.09) (0.06) (0.06) (0.09) (0.04) (0.09)
Household net income (log) -0.148* 0.020 -0.058 -0.038 -0.029 0.033 -0.050 -0.003 -0.002
(0.09) (0.10) (0.04) (0.08) (0.07) (0.06) (0.08) (0.07) (0.08)
Migration background -0.101 0.065 -0.045 -0.027 0.029 -0.046 0.038 0.012 -0.019
(0.07) (0.08) (0.05) (0.07) (0.06) (0.05) (0.06) (0.05) (0.07)
Supply side
Center size -0.000 0.001 0.002*** 0.001 -0.000 0.001 0.001 0.000 0.001
(0.00) (0.00) (0.00) (0.00) (0.00) (0.00) (0.00) (0.00) (0.00)
Share who do not pay fees -0.013 -0.046 0.106 -0.030 0.040 0.010 -0.248 0.055 -0.294
(0.16) (0.25) (0.09) (0.19) (0.13) (0.15) (0.16) (0.12) (0.19)
Public provider 0.119* 0.074 0.113*** 0.170*** 0.092* 0.152*** 0.071 0.076* -0.002
(0.06) (0.08) (0.03) (0.06) (0.05) (0.06) (0.06) (0.04) (0.06)
Center under pressure 0.006 0.041 0.020 -0.006 -0.006 -0.010 -0.045** -0.025 -0.050**
(0.02) (0.03) (0.02) (0.02) (0.02) (0.02) (0.02) (0.02) (0.02)
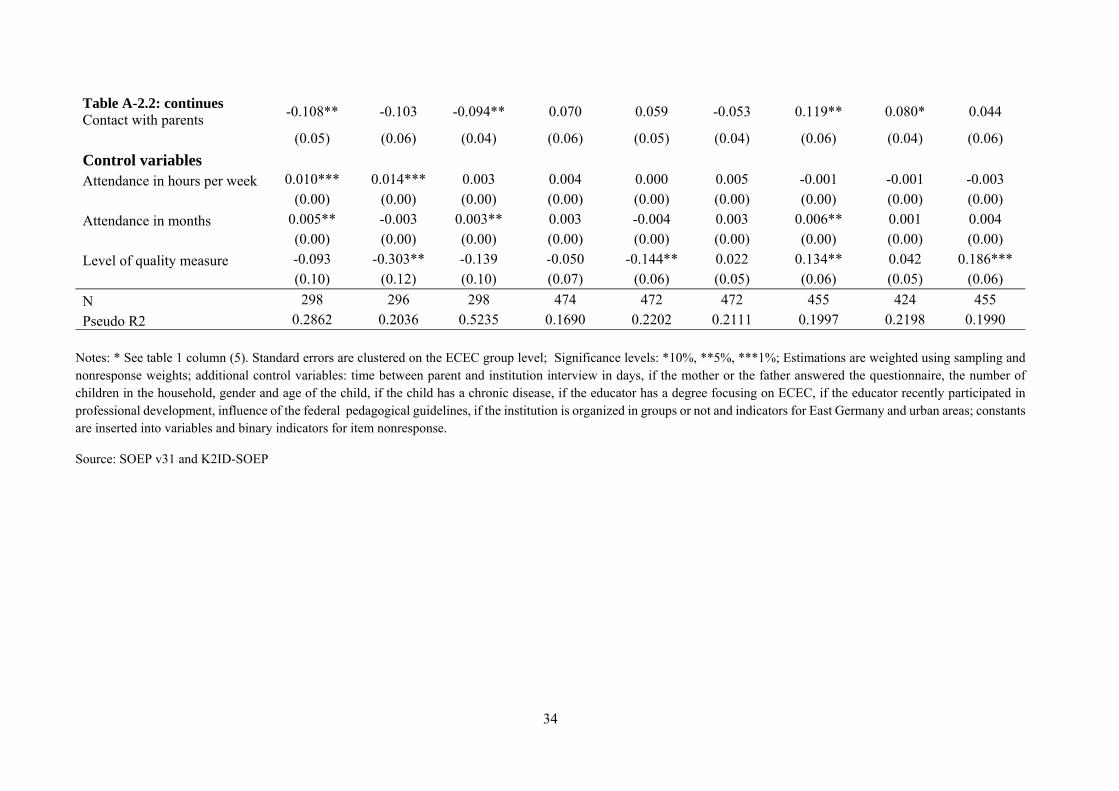
34
Table A-2.2: continues Contact with parents
-0.108** -0.103 -0.094** 0.070 0.059 -0.053 0.119** 0.080* 0.044
(0.05) (0.06) (0.04) (0.06) (0.05) (0.04) (0.06) (0.04) (0.06)
Control variables
Attendance in hours per week 0.010*** 0.014*** 0.003 0.004 0.000 0.005 -0.001 -0.001 -0.003
(0.00) (0.00) (0.00) (0.00) (0.00) (0.00) (0.00) (0.00) (0.00)
Attendance in months 0.005** -0.003 0.003** 0.003 -0.004 0.003 0.006** 0.001 0.004
(0.00) (0.00) (0.00) (0.00) (0.00) (0.00) (0.00) (0.00) (0.00)
Level of quality measure -0.093 -0.303** -0.139 -0.050 -0.144** 0.022 0.134** 0.042 0.186***
(0.10) (0.12) (0.10) (0.07) (0.06) (0.05) (0.06) (0.05) (0.06)
N 298 296 298 474 472 472 455 424 455
Pseudo R2 0.2862 0.2036 0.5235 0.1690 0.2202 0.2111 0.1997 0.2198 0.1990
Notes: * See table 1 column (5). Standard errors are clustered on the ECEC group level; Significance levels: *10%, **5%, ***1%; Estimations are weighted using sampling and nonresponse weights; additional control variables: time between parent and institution interview in days, if the mother or the father answered the questionnaire, the number of children in the household, gender and age of the child, if the child has a chronic disease, if the educator has a degree focusing on ECEC, if the educator recently participated in professional development, influence of the federal pedagogical guidelines, if the institution is organized in groups or not and indicators for East Germany and urban areas; constants are inserted into variables and binary indicators for item nonresponse.
Source: SOEP v31 and K2ID-SOEP
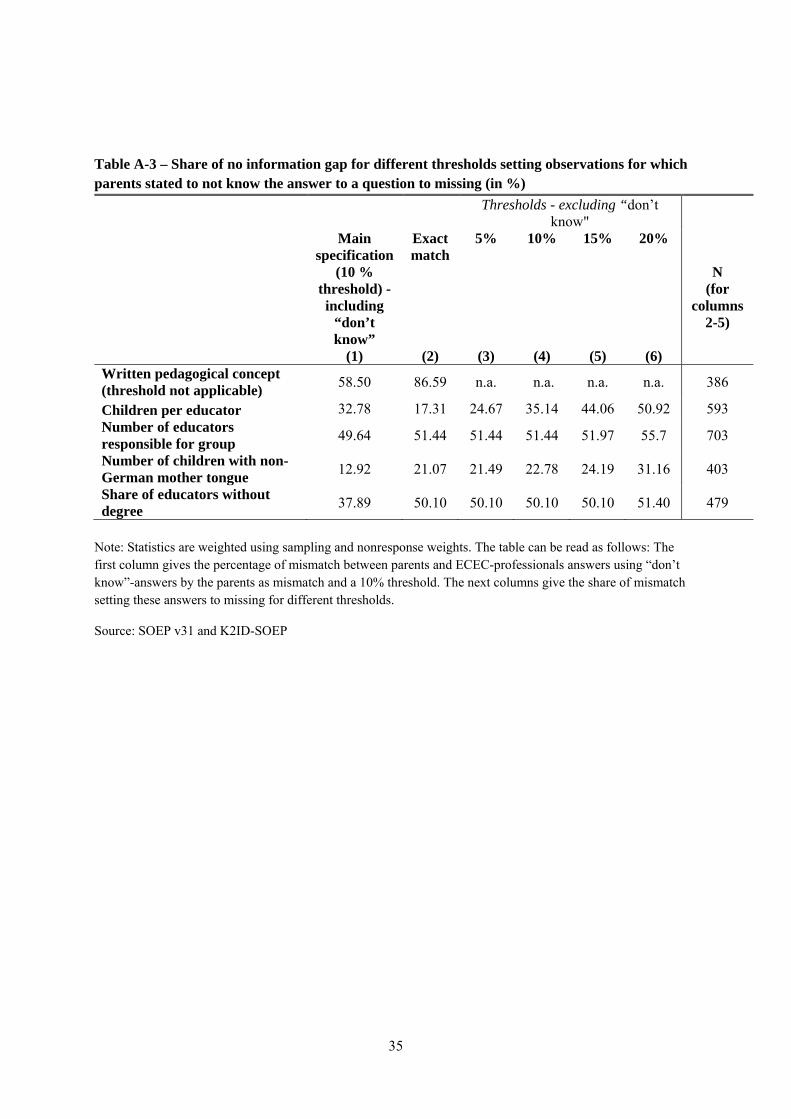
35
Table A-3 – Share of no information gap for different thresholds setting observations for which parents stated to not know the answer to a question to missing (in %)
Thresholds - excluding “don’t
know"
Main specification
(10 % threshold) - including
“don’t know”
(1)
Exact match
(2)
5%
(3)
10%
(4)
15%
(5)
20%
(6)
N (for
columns 2-5)
Written pedagogical concept (threshold not applicable)
58.50 86.59 n.a. n.a. n.a. n.a. 386
Children per educator 32.78 17.31 24.67 35.14 44.06 50.92 593 Number of educators responsible for group
49.64 51.44 51.44 51.44 51.97 55.7 703
Number of children with non-German mother tongue
12.92 21.07 21.49 22.78 24.19 31.16 403
Share of educators without degree
37.89 50.10 50.10 50.10 50.10 51.40 479
Note: Statistics are weighted using sampling and nonresponse weights. The table can be read as follows: The first column gives the percentage of mismatch between parents and ECEC-professionals answers using “don’t know”-answers by the parents as mismatch and a 10% threshold. The next columns give the share of mismatch setting these answers to missing for different thresholds.
Source: SOEP v31 and K2ID-SOEP

36
Appendix B - Wording of Questions on the Perception of Quality Measures
1. Questions related to structural features
1.1 Opening times
Identical versions for ECEC professionals and parents:
What are the daily opening hours of the establishment on most days of the week?
from _____ : _____ to _____ : _____
1.2 Existence of written pedagogical concept
ECEC-professional version:
Does your facility have a written pedagogical concept / a general orientation or profile? If so, please send us a print-out together with this questionnaire
Possible answers: yes, no
Parent version:
Does your facility have a written pedagogical concept / a general orientation or profile?
Possible answers: yes, no, do not know
1.3 Group size and number of non-German speaking children
ECEC-professional version:
Overall, how many children are currently enrolled in your group? Please also indicate how many girls, boys, children with a non-German mother tongue
Parent version:
How many children of what age are normally in the same group as your child?
Can you say approximately how many children in the same group as your child speak a language other than German at home?
1.3.3 Children per educator and educator without degree

37
Identical versions for ECEC professionals and parents (apart from the do not know option for parents):
We would now like to ask you a few questions about the approximate number of educators who are responsible for your core group.
How many educators are responsible for this group?
How many educators are generally present at the same time?
How many of them have (still) not completed their training (trainees, interns, or volunteers)
2. Questions related to educational and playing activities
ECEC professional version:
How often are the following activities offered to the children in your group?
These activities can be offered by educators of your institution or other persons who are not employed in your institution.
(Scale: several times a week; once a week; at least once a month; several times a year; at
least once a year; activity not offered)
Parent version:
How often does your child participate in the following activities in the center?
These activities can be offered by educators of your institution or other persons who are not employed in your institution.
(Scale: several times a week; once a week; at least once a month; several times a year; at
least once a year; never, even though activity is offered; activity not offered)
Identical items for ECEC professional and parents:
‐ Early musical education
‐ Painting and other artistic activities ‐ Development of the German language ‐ Opportunities to learn other languages
besides German (e.g., English or French) ‐ Support in development of mathematical
skills

38
‐ Trips to the library, museum, theater, cinema, or to a concert
‐ Trips into nature
To calculate the information gap we compare the answers of the ECEC professionals with the parents answers that the activities is offered (either used by the child or not) versus that it is not offered.
3. Questions related to the pedagogical focus
Identical versions for ECE professionals and parents:
Does your facility focus on one or several special fields of activity in addition to normal pedagogic work?
A special field of activity exists when an essential portion of the facility`s everyday life is used to promote this focus on a regular basis and the staff used for that purpose has the appropriate qualification. Please check where applicable. (ECEC professionals are asked to name up to three fields in maximum)
|_| No |_| Yes, namely:
|_| Speech promotion for all children (German) |_| Foreign languages |_| Mathematics |_| Motor skill activity/movement |_| Music |_| Natural sciences |_| Health