Embed Size (px)
Citation preview
Information Diversity and Market Efficiency Spirals
Itay Goldstein and Liyan Yang∗
June 2012
Abstract
We analyze a model where the value of a traded security is affected by two different
fundamentals, e.g., the quality of the firm’s technology and the demand for its prod-
ucts, and where there are two groups of informed traders, each one informed about
a different fundamental. We analyze the interaction between the informativeness of
the price about the two fundamentals and characterize when it leads to attenuation
and when it leads to amplification of shocks to market efficiency. Amplification occurs
because the informativeness about one fundamental reduces the uncertainty in trading
on information about the other fundamental and encourages traders to trade more
aggressively on such information. This effect is dominant when the informativeness
of the price is relatively balanced between the two fundamentals, which implies that
economies with more diverse information — i.e., where the information is more evenly
distributed between the two groups — will exhibit positive externalities and have higher
levels of overall market efficiency. Finally, we endogenize the incentives for informa-
tion production and show that the above effect leads to strategic complementarities in
information production.
∗Itay Goldstein: Department of Finance, Wharton School, University of Pennsylvania, Philadelphia, PA19104; Email: [email protected]; Tel: 215-746-0499. Liyan Yang: Department of Finance, Joseph
L. Rotman School of Management, University of Toronto, 105 St. George Street, Toronto, Ontario M5S
3E6; Email: [email protected]; Tel: 416-978-3930. For helpful comments and discussions, we
thank Efstathios Avdis, Vincent Glode, Doron Levit, Igor Makarov, Konstantin Milbradt, Tarun Ramadorai,
Dimitri Vayanos, Kathy Yuan, and participants at the 2012 Adam Smith Asset Apricing Conference (Oxford,
UK).
1 Introduction
Does the presence of information in financial markets attract more traders to produce in-
formation and trade on it or does it keep them away from doing so? Knowing the answer
to this question is crucial for our understanding of the workings of financial markets. If
information in financial markets attracts the production and transmission of more informa-
tion in the trading process, then shocks to market efficiency will be amplified, creating a
spiral that leads to sharp changes in informativeness and efficiency. On the other hand, if
information in financial markets deters traders from producing more information or from
trading aggressively on the information that they have, then shocks to market efficiency will
be attenuated, implying modest changes in informativeness and efficiency.
The seminal model of Grossman and Stiglitz (1980) provides an unambiguous answer
to this question. In that model, when more informed traders are present in the market,
others have a lower incentive to become informed and trade on their information. This is
because, as more people are informed, the price provides more information, and so each
trader has a lower incentive to produce information on his own, as he can get a good amount
of information from the price. As a result, shocks to market efficiency are attenuated in
equilibrium: The arrival of more information to the market deters others from becoming
informed, and so the overall effect on price informativeness and market efficiency is modest.
But, in reality, things often seem to go in the opposite direction. As uncertainty about
economic fundamentals heightens, traders tend to stay away from the market, avoiding
trades even on issues related to their area of expertise. This was evident in the recent
financial crisis, as markets froze, exhibiting very low trade volumes, following the increase in
economic uncertainty that led market prices to be an unreliable source of information. The
economic force behind this phenomenon is that risk averse traders want to avoid the risk in
trading securities, whose underlying value is too uncertain.
For example, consider traders, who are informed about traditional (consumer and com-
mercial) loans provided by a bank, that in normal times trade in the bank’s stock based on
their information about the quality of these loans. Suppose that, as in the recent crisis, a
new dimension of uncertainty emerges, concerning the quality of the bank’s investment in
1
mortgage-backed securities. The lack of information in the market about these securities
might deter the traders, who are informed about traditional loans, from trading, since there
is a lot of risk involved in taking positions in stocks, whose value will be determined to a
large extent by the quality of the mortgage-backed securities. Moreover, the fact that in-
vestors with information about loans leave the market might deter traders with information
about mortgage-backed securities from trading in the market for the same reason: It is too
risky for them to trade when the value of the stock is largely determined by something they
do not understand and that is not reflected in the price. Hence, we get a self-reinforcing
market efficiency spiral, by which less information on one dimension of uncertainty leads to
less information on another dimension of uncertainty, and so on, ending with much lower
levels of informativeness and efficiency. This can explain sudden market breakdowns as in
the recent crisis.
More generally, there are many cases where firms face multiple dimensions of uncertainty,
and, due to costs of information production and natural areas of expertise, different specula-
tors specialize and trade on information along different dimensions. The value of technology
firms is driven by the quality of their technology and by the demand for their products, and
there are traders with technical expertise trading on information about technology, while
there are traders with marketing expertise trading on information about the demand for
firms’ products. The value of multinational firms depends on the developments in various
countries, and there are traders who understand the developments in a specific country and
trade on this information, taking into account whether there are traders in the market trad-
ing on information about the developments in other countries. The idea that investors trade
on one kind of information is featured in the literature on style investing (Chan, Chen, and
Lakonishok, 2002; Barberis and Shleifer, 2003; Goetzmann and Brown, 2003). It is also
related to behavioral arguments about investors being limited in the number of variables
they can keep track of (Hong, Stein, and Yu, 2007; Brunnermeier and Oehmke, 2009).1
Overall, we seek to explore the interaction between different types of investors trading on
different types of information, and the extent to which this interaction leads to amplification
1This idea is akin to the notion of limited attention, which has been recently studied in the finance
literature (e.g., Moscarini, 2004; Peng, 2005; Peng and Xiong, 2006; and Gabaix, Laibson, Moloche, and
Weinberg, 2006).
2

or attenuation of market efficiency and price informativeness.
The model we study in this paper is an extension of Grossman and Stiglitz (1980) that
considers two dimensions of uncertainty about the value of the traded security, say that the
value of the security depends on the quality of the firm’s technology and on the demand for
the firm’s products. We first consider an economy where traders are endowed with different
types of information: Some traders are informed about the technology of the firm and others
are informed about the demand for its products. Traders are risk averse, and trade in a
market with uninformed traders and with noisy supply, as in Grossman and Stiglitz (1980).
When they trade, they condition on the price of the security, and hence the information in
the price benefits their trading decision.
We analyze the interaction between the two groups of informed traders in this model.
Suppose that the size of the group of technology-informed traders increases, what is the effect
on the informativeness of the price about the demand for the firm’s products? There are two
effects. First, the presence of more technology-informed traders creates an adverse selection
effect that deters demand-informed traders from trading aggressively. This is because when
they trade, they do so without having information that is available to an increased number of
other traders in the market. This effect attenuates the impact of shocks to market efficiency:
An increase in efficiency due to the increase in the number of traders who are informed
on one dimension will cause traders who are informed on the other dimension to trade less
aggressively, making the overall effect on market efficiency modest. Second, the presence of
more technology-informed traders implies that more of their information will get into the
price, reducing the overall uncertainty that demand-informed traders have to face concerning
technology issues when they trade. This effect amplifies the impact of shocks to market effi-
ciency: The presence of more technology-informed traders allows demand-informed traders
to trade more aggressively on what they know without being exposed to risks they do not
understand, and this increases efficiency further.2 This is the basis for the market efficiency
spiral that motivates our paper.
Interestingly, we find that in equilibrium the amplification effect dominates the atten-
2This is similar to a firm that specializes in one type of activity and hedges itself against other unrelated
risks.
3
uation effect when the informativeness of the price is relatively balanced between the two
dimensions of uncertainty. On the other hand, the attenuation effect dominates the ampli-
fication effect when the price is much more informative about one dimension than about
the other. This has important implications for the optimal structure of information in the
economy. Fixing the total mass of informed traders, an economy with a diverse information
structure — i.e., where there is more balance between the two groups of informed traders —
will exhibit a higher level of market efficiency than an economy with a concentrated infor-
mation structure — i.e., where there are many more traders informed about one dimension
than on the other. This is because the former economy benefits more from the amplification
in informativeness as a result of the uncertainty reduction effect described above.
We then extend our analysis to allow traders to decide whether to become informed
on one of the two dimensions of uncertainty.3 We again analyze the interaction between
the two types of information. Suppose that there are more technology-informed traders
in the market, what will be the effect on the incentives of agents to acquire information
about demand? On the one hand, the traditional Grossman-Stiglitz effect, reducing the
incentive to produce information about demand when there are more technology-informed
traders in the market, exists in our model. This is a strategic substitute that attenuates
the effect on market efficiency. However, on the other hand, the uncertainty reduction effect
mentioned above creates a strategic complementarity that amplifies the effect on market
efficiency: Knowing that more technology information will go into the price, traders know
they will face less uncertainty when trading on demand information, and hence have a
stronger incentive to produce information about demand. We identify conditions under
which this effect dominates, creating another form of market efficiency spiral that leads to
amplification of shocks in equilibrium.
We finally compare our economy where the asset payoff has multiple dimensions of un-
certainty and traders are informed of different dimensions, to the standard unidimensional
economy, analyzed by Hellwig (1980) and Verrecchia (1982), where the asset payoff is mod-
elled as a single random variable and traders are informed of the overall asset payoff. We
3We do not allow traders to acquire information in both dimensions, following the arguments above about
traders having a comparative advantage in processing one kind of information or about the limited capacity
that they have.
4
find that the standard result that the benefit of acquiring information decreases with the
total size of the informed traders population in the unidimensional economy is not robust.
In general, how traders respond to other traders becoming informed does not only depend
on the overall size of informed group, but also depends on its composition. If traders are
acquiring information about fundamentals that are weakly correlated, then acquiring infor-
mation on different fundamentals tend to be a complement rather than a substitute. This
result highlights the uniqueness of our analysis.
Several papers in the literature analyze models of financial markets, where the value of
the traded security is affected by more than one fundamental, on which agents are informed.
Froot, Scharfstein, and Stein (1992) show that short term investors tend to concentrate on
collecting one type of information, because prices in the short-run will most likely reflect
information that other people have. Goldman (2005) studies whether a two-division firm is
better off when it is listed as one unit rather than when its two divisions are traded sepa-
rately. Yuan (2005) demonstrates that benchmark securities allow heterogeneously informed
investors to create trading strategies that are perfectly aligned with their signals about differ-
ent fundamentals. Kondor (2012) shows that public announcement can create disagreement
and increase trading volume when traders are informed of different fundamentals and have
heterogeneous trading horizons.
More closely related is Lee (2010), which builds on Subrahmanyam and Titman (1999).
Like us, Lee (2010) investigates the interactions between different types of informed traders
in the same market and points out the possibility that learning can be a complement when
informed traders pursue different trading strategies. In his paper, however, the complemen-
tarity comes from the fact that trades based on different types of information provide noise
for each other in a market-order based model (Kyle, 1985). By contrast, our mechanism
works through the uncertainty reduction effect (which is absent in Lee, 2010) due to the fact
that information revealed in prices reduces the uncertainty faced by agents and encourages
them to trade more aggressively and produce more information. Our analysis also goes be-
yond pointing out the learning complementarity, e.g., by showing that information diversity
can have important implications for price informativeness and the cost of capital.
Another related literature analyzes models of trading in multiple securities, e.g., Admati
5

(1985) and Bernhardt and Taub (2008). Most closely related in this literature is the recent
paper by Cespa and Foucault (2011). They study liquidity spillovers between different
securities when speculators trading in one security may observe the price of the other traded
security and learn information concerning the security they trade. In contrast, we show the
amplification in efficiency and informativeness in a one-security setting and address different
questions like the effect of information diversity on market efficiency, the effect of the cost
of producing one type of information on the production of another type of information, etc.
Finally, our model contributes to the literature studying sources of strategic comple-
mentarities in financial markets, by highlighting a different mechanism by which such com-
plementarities arise. Other papers in this literature include: Barlevy and Veronesi (2000),
Ganguli and Yang (2009), Garcia and Strobl (2010), Goldstein, Ozdenoren, and Yuan (2010),
Mele and Sangiorgi (2010), and Breon-Drish (2011).
The remainder of this paper is organized as follows. Section 2 presents the model and
the characterization of the equilibrium. In Section 3, we analyze the interaction between
the two types of information and provide a full characterization of when our model features
amplification vs. attenuation of market efficiency. Section 4 studies the role of information
diversity, showing that economies with more diverse information will feature greater market
efficiency. In Section 5, we endogenize the information acquisition decision and analyze
when it will exhibit strategic substitute vs. strategic complementarity. Section 6 checks
the robustness of our results and highlights the uniqueness of our analysis, and Section 7
concludes.
2 The Model
2.1 Setup
We study an environment similar to Grossman and Stiglitz (1980). There are two assets
traded in the financial market: one riskless asset (bond) and one risky asset (stock). The
bond is in unlimited supply; its payoff is 1, and its price is normalized to 1. The stock has a
total supply of 1 unit and has a price of , which is determined endogenously in the financial
6
market, and its payoff is given by:
= 1 + 2. (1)
As we see in (1), the payoff of the stock is composed of two ingredients, 1 and 2, some-
times referred to as fundamentals, which are independent and identically distributed (i.i.d.)
according do a normal distribution function: ∼ (0 1) ( = 1 2), where represents
the common prior precision of 1 and 2. The idea is that there are two dimensions of un-
certainty about the payoff from the stock, captured by the variables, 1 and 2, and, as we
will discuss below in more detail, they are potentially observable to different traders.
There are three types of rational traders (of a total mass of 1) trading the bond and the
stock in the financial market: (1) 1-informed traders (of mass 1 0), who observe the
realization of the first component 1 of the stock payoff. (2) 2-informed traders (of mass
2 0), who observe the realization of the second component 2 of the stock payoff. (3)
Uninformed traders (of mass = 1 − 1 − 2 ≥ 0), who do not observe any information.While we currently assume that the masses of informed traders, 1 and 2, are exogenous, we
endogenize them later in Section 5, where we analyze learning complementarities. All three
types of traders condition their trades on the stock price . Their utility from consumption
is given by the usual constant-absolute-risk-aversion (CARA) function, −− , where isthe risk-aversion parameter. Finally, to prevent fully revealing prices, we assume that there
are noise traders who trade a random amount ∼ (0 1) (with 0) of the stock,
which is independent of the realizations of 1 and 2.
As mentioned above, 1 and 2 represent two dimensions of uncertainty about the traded
firm. For example, one dimension can be the demand for the firm’s products and the other
one can be the quality of the firm’s technology. Then, different traders may be exposed to
different types of information, depending on their expertise and background. For example,
people with technical background may know more about the technology of the firm, while
consumers may have assessments about the demand for the firm’s products. Also, retail
investors may be exposed to information about aspects of the firm which are different than
those that institutional investors are exposed to.
7

For the sake of tractability, we have assumed that the two ingredients 1 and 2 are
mutually independent and that -informed traders perfectly observe . In Section 6 we
remove these two assumptions and show that our main results go through. We have also
assumed that 1 and 2 are identically distributed, as this assumption gives us a natural
aspect of information diversity based on the proportion of traders informed about each
fundamental (which is formalized by equation (22)). If instead the two fundamentals are
not identically distributed, we have not found a tractable way to implement a notion of
information diversity, because it is difficult to control the impact of the total amount of
information while we vary parameters to examine the impact of information diversity.
2.2 Equilibrium Definition
The equilibrium concept that we use is the rational expectations equilibrium (REE), as in
Grossman and Stiglitz (1980). In equilibrium, traders trade to maximize their expected
utility given their information set, where -informed traders know and ( = 1 2), and
uninformed traders know only . The price is determined, in turn, by the market-clearing
condition, whereby the sum of demands from the three types of rational traders and the
noise traders is equal to the supply of the stock 1. As in most of the literature, we consider a
linear equilibrium, where the price linearly depends on the signals 1 and 2 and the noisy
trading :
= 0 + 11 + 22 + (2)
The coefficients 0, 1, 2, and will be endogenously determined.
2.3 Equilibrium Characterization
We start by deriving the demands of the different traders. The -informed traders have
information set F = { }. The CARA-normal setup indicates that their demand functionis:
( ) = (|F)−
(|F)=
+(|F)−
(|F) (3)
8

where the second equality follows from equation (1). Given the price function (2), the
information set F is equivalent to the following signal in predicting :
| ≡ − 0 −
(4)
= + () (5)
By Bayes’ rule, we have,
(|F) = (||) =()
2|
+ ()2 (6)
(|F) = (||) = [+ ()2]−1 (7)
Plugging the above expressions into equation (3), we can express the demand function of
-informed traders as follows:
( ) = +(||)−
(||) = +
()2|
+()2−
[+ ()2]−1
(8)
for = 1 2.
The uninformed traders only observe the price and their demand function is:
() = (|)−
(|) (9)
The price is equivalent to the following signal in predicting the total payoff :
≡ − 0
=1
1 +2
2 + (10)
Applying Bayes’ rule, we have:
(|) = (11)
(|) =(1 − 2)
2+ 2−1
(1)2+ (2)
2+ 2−1
(12)
9

where
=(1) + (2)
(1)2+ (2)
2+ −1
(13)
The equilibrium price is determined by the market-clearing condition for the risky asset:
11( 1) + 22( 2) + () + = 1 (14)
Plugging the expressions for ( ) and () (equations (8) and (9)) into the above
market-clearing condition, we can solve for the price as a function of the variables 1, 2
and . Then, comparing coefficients with those in the conjectured price function (equation
(2)), we get the following proposition that characterizes the linear rational-expectations
equilibrium. The proof of all propositions are in the appendix.
Proposition 1 For any 1 0 and 2 0, there exists a unique linear rational-expectations
equilibrium, in which
= 0 + 11 + 22 +
The coefficients 0 0, 1 0, 2 0, and 0 are given as a function of the exogenous
parameters of the model in the proof in the appendix.
3 Trading Incentives and the Interaction between the
Two Types of Information
3.1 Trading Incentives and Price Informativeness
Going back to Grossman and Stiglitz (1980), price informativeness is often defined as the
ratio between the sensitivity of the price to fundamental shocks and the sensitivity of the
price to noise. In our model, there are two types of fundamentals, 1 and 2, and we would
like to examine the informativeness of the price about each one of them and the interaction
between the two. Hence, we define 1 ≡ 1and 2 ≡ 2
as the price informativeness about
signals 1 and 2, respectively.4
4Our definition of price informativeness about is in the same spirit as Grossman and Stiglitz (1980)
who intepret price informativeness as the extent to which variations of the price come from fundamental
10

We are also interested in a measure of overall informativeness, i.e., how much the price
reflects the total stock payoff , which also measures the market efficiency. As in Brun-
nermeier (2005), we define this as ≡ 1 (|) , i.e., the reciprocal of the variance of
conditional on the price. This corresponds to how much residual uncertainty is faced by the
uninformed traders after conditioning on the price. By equation (12) and the definitions
=( = 1 2), we can see how the overall price informativeness measure depends on
the other two informativeness measures 1 and 2:
=1
(|) =21+ 22+ 2−1
(1 − 2)2+ 2−1
(15)
Note that 1 and 2 positively affect the overall price informativeness . That is,1
0
and 2
0. This result is intuitive, as one would expect that the price system will reveal
more information about the total asset payoff (1 + 2) when the variations of the price come
more from either component of the asset payoff than from the noisy asset trading.5
In equilibrium, price informativeness is determined by the trading incentives of the in-
formed traders, that is, by the extent to which a change in their signal affects the amount
that they trade, which is represented by()
for the -informed traders. Intuitively, this
is because prices reflect information precisely as a result of informed traders trading on their
private signals. To see this formally, consider the following experiment. A unit increase in
will cause each of these traders to buy()
more stocks, and so as a group -informed
traders will buy ()
more stocks. If it happens that the noise traders supply the
same number of extra shares, then the price will not change. That is, changing by one
unit has the same price impact as changing by ()
units, and as a result, the price
informativeness about is given by:
=
= ( )
for = 1 2. (16)
rather than from the noise . Strictly speaking, a full notion of inofmrativness might be the precision
of conditional on the price ,1
(|) = ³1 +
22+
−1
´. But our measures 1 and 2 are analytically
more tractable and they give us building blocks we can work with toward those variables of final interest,
for example the price informativeness about the overall payoff = 1 + 2 and the cost of capital.5Note, however, that the result is not trivial due to the interactions between 1 and 2 in determining .
Hence, establishing that 1
0 and 2
0 requires us to rely on the relation between 1 and 2 specified
in equation (18). For details, see equations (57) and (58) in the appendix.
11

3.2 The Interaction between the Two Types of Information
Using equation (3) for the demands of the two types of informed speculators, we can see how
these demands are affected by changes in the signals, and how this in turn determines price
informativeness:
= ( )
=
µ1
1
(|F)+1
(|F)
(|F)
¶(17)
= ¡−1(+ 2 )− −1
¢ (18)
where the last equality follows from equations (4)-(7).
An increase in the signal has two effects on the trading of a -informed trader, as
can be seen in equation (17). First, as we can see in the first term in the parentheses, he is
going to demand more of the asset due to the direct effect that has on the payoff of the
asset. Note that this effect gets smaller when there is a higher residual variance about ,
since a higher variance implies that the trader takes more risk when holding a position in
the asset, and this makes him trade less aggressively. Second, as we can see in the second
term in the parentheses, he is going to demand less of the asset due to the indirect effect via
the expectation that he has about : Holding the price constant, an increase in implies
a lower expectation about , and so reduces the trader’s demand of the asset.
Equation (18) also demonstrates the interaction between the informativeness of the price
about and the informativeness of the price about . Consider equation (18) for the -
informed traders. An increase in the informativeness of the price about , , has two effects
on their trading incentives. First, it reduces the residual uncertainty they face when they
trade, and hence makes them trade more aggressively on their information about . We
label this channel the “uncertainty reduction effect”. It is represented in the first term in
the parentheses. Second, it makes them use the price more to infer information about ,
and so trade less aggressively on their information about . (An increase in , holding the
price constant, provides now stronger indication that is low, and this makes the traders
rely less on their private information when trading.) We label this channel the “adverse
selection effect”. It is represented in the second term in the parentheses.
Rearranging terms in (18), we get two response functions that jointly determine 1 and
12
2 in equilibrium:
= (; ) ≡(+ 2 )
+ for = 1 2 and 6= . (19)
As we can see, due to the two effects mentioned above (“uncertainty reduction effect” and
“adverse selection effect”), the two response functions may have either a positive or a neg-
ative slope. Analyzing (19), we can see that (; ·) is decreasing in when is low,
and then increasing when is high. That is, the adverse selection effect dominates for low
levels of informativeness and the uncertainty reduction effect dominates for high levels of
informativeness. As we show in the next subsection, whether we get amplification or atten-
uation of shocks to market efficiency depends on the slopes of the two response functions in
equilibrium.
3.3 Market Efficiency Multipliers
Let be one of the five exogenous parameters (1 2 ) that determine the price in-
formativeness measures (1 and 2) in the system defined in (19).6 The following proposition
characterizes the effect of on , separating between the direct effect and the indirect effect
due to the feedback loop between the two types of information. It identifies when the direct
effect of on is amplified and when it is attenuated due to the interdependence between
the two price informativeness measures.
Proposition 2 (i) The effect of an exogenous parameter on the informativeness of the
price about is given by:
|{z}total effect
=Mµ
+
¶| {z }
direct effect
(20)
where the term³+
´captures the “direct effect” of changing on and the
6Note that we can rewrite (19) as ≡ (+2 )
+. So, the three parameters ( ) affect (19) only
through ( ), meaning that ( ) only have two degrees of freedom in determining the system (19).
Actually, we can normalize any one of ( ) to 1 without affecting the equilibrium price informativeness
measures.
13
coefficientM is a “multiplier” given by:
M =
µ1− 1
2
2
1
¶−1 0 (21)
(ii) Suppose that 1 0 and 2 0. Then, (a) when12 1
2 2,M 1, and so the effect
of on is amplified in equilibrium; (b) when12
12or when 1
2 2, 0 M 1, and
so the effect of on is attenuated in equilibrium; and (c) when12= 1
2or when 1
2= 2,
M = 1.
The direct effect of a shock in a parameter on price informativeness can be thought
of as the initial impact before the feedback effect between the two informativeness measures
is considered. It is given by³+
´. The feedback loop then creates a multiplier
that either amplifies or attenuates the direct effect. It is given by M =³1− 1
2
21
´−1,
which, as the proof of the proposition shows, is strictly positive. Whether the direct effect is
attenuated or amplified in equilibrium then depends on whetherM is smaller than or bigger
than 1, which depends on the signs of the cross derivatives 12
and 21. The proof of the
proposition shows that it is impossible to have both cross derivatives negative in equilibrium
(i.e., 12
0 and 21
0 at the point where the two response functions in (19) intersect).
Hence, either one of them is negative and one is positive, in which caseM 1 and the direct
effect of a shock on price informativeness is attenuated in equilibrium, or both of them are
positive, in which case M 1 and the direct effect of a shock on price informativeness is
amplified in equilibrium.
The result shows that when 1 and 2 are very far from each other (specifically, when
12
12or when 1
2 2) — which will be true when 1 and 2 are very far from each other
— the uncertainty reduction effect dominates for one response function, while the adverse
selection effect dominates for the other. As a result, the interaction between the two price
informativeness measures tends to attenuate the initial shock to the economy; that is, 0
M 1. In contrast, when 1 and 2 are close to each other (specifically, when12 1
2 2) —
which will be true when 1 and 2 are close to each other — the uncertainty reduction effect
dominates for both response functions. As a result, the two price informativeness measures
reinforce each other and any exogenous shock affecting one price informativeness measure
14

will lead to a “market efficiency spiral”, whereby a shock directly improving one type of
price informativeness will propagate to the other type, which will in turn feed back on the
original one, amplifying the effect of the initial shock and improving both types of price
informativeness, as well as the total market efficiency. In this case, we haveM 1.7
Figure 1 uses a numerical example to illustrate this spiral reaction to an increase in 1.
The figure depicts the two functions in a case where they intersect at the upward sloping
parts (i.e., the uncertainty reduction effect is the dominant effect for both of them). In
the figure, we set the parameters at = 50, = 50 and = 3. Suppose that initially
1 = 2 = 005, so that the equilibrium is at Point and 1 = 2 = 083. Now suppose
that 1 increases to 01. Then, function 1 moves upward to 01, and the equilibrium moves
to point 0 (1 = 128 and 2 = 107). We can see how the effect of the increase in the
amount of informed trading on 1 is amplified in equilibrium along the route → → → → 0. That is, when there are more informed traders who know 1, the price is
automatically more informative about 1. Then, traders who know 2 trade more aggressively
on their information because they face less uncertainty (and the uncertainty reduction effect
dominates the adverse selection effect), and so the price is more informative about 2 as well.
Now traders trade more aggressively on 1 as well, which increases the price informativeness
on 1 further. The amplification chain continues on and on till it converges to much higher
levels of informativeness on both 1 and 2.
[FIGURE 1 ABOUT HERE]
7We note that the competition between the adverse selection effect and the uncertainty reduction ef-
fect is also responsible for the uniqueness of the financial market equilibrium described by Proposition 1.
Specifically, the uncertainty reduction effect increases the possibility of multiple equilibria through its self-
reinforcing feature, while the adverse selection effect decreases it. In our economy, both effects are present
so that the strength of self-fulfilling expectations is weak and there are no multiple equilibria. In a recent
study by Cespa and Foucault (2011) who consider a two-security setting, they indeed find the possibility
of multiple linear equilibria, because in their economy, informed traders only specialize in one market and
there is no adverse selection effect to counterbalance the uncertainty reduction effect, thereby causing the
strength of self-fulfilling expectations to be particularly strong.
15
4 The Impact of Information Diversity
In the previous section, we showed that the interaction between the two types of information
can either amplify or attenuate shocks to market efficiency in our model, and that whether
we obtain amplification or attenuation depends on the difference between the two types of
informativeness. A natural implication of this result is that the diversity of information in
the model should have important implications for overall market efficiency and, as a result,
for the cost of capital of the traded firm. In this section, we explore this implication formally.
4.1 Price Informativeness
In our model, there are two types of informed agents. The mass of traders informed about
1 is 1 and the mass of traders informed about 2 is 2. We would like to analyze the
effect of the difference between 1 and 2 on the informativeness of the price in our model,
while keeping the total size of the informed-traders population fixed. For this purpose, we
set 1 + 2 = Λ (where Λ is a constant), and define the following measure of information
diversity:
∆ ≡ 1− |1 − 2|Λ
∈ [0 1] (22)
A higher ∆ means that the two groups of informed traders are closer in size, and so the total
amount of information is more equally distributed between the two types of informed traders;
hence, there is more diversity of information in the economy. (By this logic, a situation with
less diversity is one where most people know the same thing and so ∆ is low.)
Following Proposition 2, we know that when ∆ is close to 0, either 1 or 2 is close to
0, and so 1 and 2 are far from each other, implying that the market efficiency multiplier
M is smaller than 1. On the other hand, when ∆ is close to 1, we know that 1 is close
to 2, and so 1 and 2 are close to each other, and by Proposition 2, the market efficiency
multiplierM is greater than 1.
This link between∆ andM has important implications for market efficiency. Specifically,
the following proposition shows that as information diversity increases, the overall price
informativeness goes up.
16
Proposition 3 Information diversity increases the total price informativeness regarding ,
that is, ∆
0.
To understand this result, compare the following two economies with the same total
mass of informed traders 1 + 2 = Λ, but with levels of diversity at the two ends of the
spectrum: (1) Economy I, where 1 = Λ− ≈ Λ, 2 = ≈ 0, and ∆ ≈ 0 (a “concentrated”economy); and (2) Economy II, where 1 = 2 =
Λ2and ∆ = 1 (a “diverse” economy).
These two economies can be obtained by injecting a total mass (Λ− 2) of informed tradersto an initial economy where there is almost no information (i.e., 1 = 2 = ≈ 0) along twodifferent paths. To obtain Economy I, we only add traders who are informed about 1, while
keeping the mass of agents informed about 2 close to 0. In contrast, to obtain Economy II,
we simultaneously add traders informed about 1 and traders informed about 2.
Adding informed traders along both paths improves market efficiency, since
0 for
= 1 2. However, the impact of the new information is different on the two different paths
leading to the two economies because of the market-efficiency-multiplier effect identified by
Proposition 2. Along the path to obtain Economy I, the multiplierM is smaller than 1, and
thus the impact of the new added information is attenuated, while along the path to obtain
Economy II, the multiplierM is greater than 1, and the impact of the new added information
is amplified. As a result, the total impact of the added mass (Λ− 2) of informed traderson market efficiency is larger in Economy II than in Economy I.
Overall, market efficiency is higher in our model when there is more diversity of informa-
tion, or when there is more balance between the amount of information available on different
dimensions. This is because the effect of adding more informed agents on market efficiency is
greater when the two levels of informativeness are relatively close to each other, as then the
uncertainty reduction effect dominates, and we get a self-reinforcing spiral, by which more
information encourages more aggressive trading, increasing informativeness further.
Figure 2 demonstrates graphically the effect of information diversity in our model for the
parameter values = = 50, = 3 and Λ = 01. In Panel (a), we see that the market
efficiency multiplier M is below 1 for low levels of diversity and above 1 for high levels of
diversity. Panel (b) confirms the result of Proposition 3 that the overall price informativeness
17
increases in information diversity (as a result of the multiplier effect in Panel (a)).
[FIGURE 2 ABOUT HERE]
4.2 Cost of Capital
One important implication of price informativeness is its effect on the cost of capital. We
define the cost of capital as follows (see, e.g., Easley and O’Hara, 2004):
= ( − ) (23)
That is, the cost of capital is the expected difference between the cash flow generated by the
security and its price, which is due to the risk taken by the traders who hold the security.
By Proposition 1, we have
= −0 =
0
(24)
where 0 is the average trading aggressiveness across all traders, and is given by equation
(46) in part A of the appendix as follows:
0 =1
(|F1) +2
(|F2) +
(|) (25)
= 1¡+ 22
¢+ 2
¡+ 21
¢+ (1− Λ) (26)
The right hand side of equation (25) captures the average trading aggressiveness of the
different kinds of traders, which is a function of the residual risk they have to bear. Com-
bining (25) with (24), we can see that the cost of capital increases in the risk that traders
are exposed to per unit of the security: (|F1) for 1-informed traders, (|F2) for2-informed traders, and (|) for uninformed traders.The following proposition shows that information diversity lowers the cost of capital:
Proposition 4 Information diversity lowers the cost of capital, that is, ∆
0.
There are two effects leading to the result in Proposition 4. First, greater information
diversity causes uninformed traders to bear less risk and trade more aggressively (as captured
18
by the term (1− Λ) in equation (26)), because, as we showed in the previous subsection,
information diversity increases the total price informativeness regarding . This raises
prices and lowers the cost of capital. Second, the two groups of informed traders, in aggregate,
also bear less risk and trade more aggressively (as captured by the term 1 (+ 22) +
2 (+ 21) in equation (26)). To understand this, suppose, without loss of generality,
that there are more 1-informed traders than 2-informed traders, so that in general, the
price system reflects more information regarding 1 than 2 (i.e., 1 2), and thus 2-
informed traders are exposed to less risk when they trade than 1-informed traders (i.e.,
(+ 21) (+ 22)). Increasing information diversity is equivalent to replacing some 1-
informed traders with 2-informed traders, and as a result, the average risk that informed
traders are exposed to decreases. This leads to an increase in price and a reduction in the
cost of capital. Panel (c) of Figure 2 demonstrates the effect of information diversity on the
cost of capital.
5 Endogenous Information Acquisition
So far, we assumed that the proportions of agents who are informed about the two funda-
mentals 1 and 2 — 1 and 2, respectively — were exogenous. We now endogenize these
parameters and examine how they are determined in light of the incentives to become in-
formed in our model. The new result that we get relative to the literature is that sometimes
there will be a dominant strategic complementarity effect, whereby the increase in the mass
of agents acquiring information on one fundamental will lead more agents to acquire infor-
mation about the other fundamental. This is because of the uncertainty reduction effect
identified earlier.
5.1 Information Acquisition in Equilibrium
We assume that there are two groups of traders of sizes 1 2 0, 1 + 2 = 1. Traders
in 1 can acquire the signal 1 at cost 1 0, and traders in 2 can acquire the signal 2
at cost 2 0. Traders who choose to acquire 1 (2) become part of the 1 (2) group
in the trading model described in previous sections, while those who choose not to acquire
19
information become part of the group.
Note that, for simplicity, we assume that any trader has an opportunity to become
informed only about one of the two signals. This can be viewed as an extreme case of
asymmetric expertise in information acquisition. That is, there are two groups of traders,
and each group can only gather a particular type of information at a finite cost. This seems
particularly reasonable when speculators acquire and trade on inside information. But, even
without inside information, it is reasonable to think of different traders having potential
access to different pieces of news based on their different expertise. Moreover, our setting
can be justified based on limited ability to process information, e.g., Brunnermeier and
Oehmke (2009) argue that investors may be subject to computational limitations or limited
in the number of variables that they can keep track of. This idea is akin to the notion of
limited attention, which has been recently studied in the finance literature (e.g., Moscarini,
2004; Peng, 2005; Peng and Xiong, 2006; and Gabaix, Laibson, Moloche, and Weinberg,
2006).
Using arguments similar to those in Grossman and Stiglitz (1980), we can show that for
given fractions (1 2) of informed traders (and hence given values of 1 and 2, which are
determined by the system in (19)), the expected net benefit from purchasing information
to a potential purchaser is:
(1 2) = log
µ (|) (|F)
¶−2 = log
¡+ 2
¢−log ()−2, for = 1 2 and 6=
(27)
Intuitively, the net benefit from acquiring information is increasing in the quality of infor-
mation available to the trader after purchasing the signal (given by + 2), decreasing
in the quality of information available to the trader by only observing the price (given by
), and decreasing in the cost of information production.
We focus on interior solutions, where 0 ∗1 1 and 0 ∗2 2.8 Hence, conditions
1 (∗1
∗2 ) = 0 and 2 (
∗1
∗2) = 0 characterize the equilibrium price informativeness mea-
sures ∗1 and ∗2 , such that speculators are indifferent between acquiring information and not
8We assume that parameters are such that interior solutions exist. This implies that the cost of informa-
tion acquisition is neither too high nor too low. Here and in the rest of the section, we add a superscript ∗
to all endogenous variables to emphasize that the information structure is endogenous.
20
acquiring information. These equilibrium price informativeness measures, in turn, character-
ize the equilibrium fractions (∗1 ∗2) of informed traders through the system (19). While we
cannot prove analytically that the equilibrium in the information-acquisition stage is unique,
in simulation analysis, the equilibrium always appears to be unique.
5.2 Strategic Complementarities vs. Strategic Substitutes
We now analyze the strategic interactions among traders producing information. In par-
ticular, we show that learning the two independent pieces of information and can be
complementary, in the sense that an increase in the mass of agents acquiring information on
one fundamental will increase the incentive of agents to acquire information about the other
fundamental.
Specifically, by equation (27), an increase in the population of -informed traders has
two offsetting effects on the benefit of acquiring signal , which are reflected by the two
terms, log¡+ 2
¢and log (). First, an increase in will improve the informativeness
of the price about signal (as
0 by Proposition 2). This increased directly
reduces the remaining uncertainty of a -informed trader, which allows him to trade more
aggressively and increases his welfare due to the uncertainty reduction effect identified in
earlier sections. This increases the benefit of becoming -informed, which is reflected by
the term log¡+ 2
¢in equation (27). Second, an increase in also causes the price to
be more informative about the total cash flow (as
0 by Proposition 2 and equation
(15)). This reduces the incentive of uninformed traders to become informed about , which
is part of , as they can now gain more information about from the price. This effect is
the standard Grossman-Stiglitz substitution effect, whereby having more informed traders,
reduces the incentive to become informed. This negative effect is reflected by the term
log () in equation (27).
When the positive uncertainty reduction effect dominates the negative Grossman-Stiglitz
effect, an increase in , the size of -informed traders, can increase , the benefit of acquir-
ing signal , thereby causing acquiring the two types of information to be complementary.
We can show that this is true when ; that is,
0 if and only if . Intu-
itively, when , the price is mainly a public signal about the component . As a
21
result, acquiring will be particularly profitable when used in combination with , a public
signal about , in the trading stage (i.e., a strong uncertainty reduction effect); and at the
same time, the knowledge of will not be passed on to the price very much (i.e., a weak
Grossman-Stiglitz effect), since the price is mainly informative about .
Interestingly, learning the same information is still a strategic substitute, i.e.,
0:
An increase in the population of -informed traders will always decrease the benefit
of acquiring signal . This is because the uncertainty reduction effect discussed above
operates through the price informativeness about the other component , while increasing
mainly increases .9 Thus, the complementarity effect in acquiring different information
is not present in the traditional unidimensional Grossman-Stiglitz framework, and can only
be uncovered by considering the two-dimension framework in our paper. We summarize the
above discussion in the following proposition.
Proposition 5 Acquiring information on the same fundamental is a strategic substitute:
As more traders become informed of , the benefit of acquiring decreases; that is,
0. Acquiring information on different fundamentals can be a strategic substitute or a
complement: As more traders become informed of , the benefit of acquiring can decrease
or increase, and
0 if and only if .
5.3 The Impact of Information Acquisition Cost
In this subsection, we will conduct comparative-statics analysis, examining the impact of
changing the cost of acquiring information on the equilibrium fractions (∗1 ∗2) of in-
formed traders, on market efficiency ∗ , and on the cost of capital ∗ in the overall equilib-
rium. The comparative-statics analysis is based on the equilibrium conditions 1 (∗1
∗2) = 0
and 2 (∗1
∗2 ) = 0 in the information-acquisition stage and on the system in (19) charac-
9Formally, we can argue that the uncertainty reduction effect generated by an increase in the size of traders
informed of the same information either works in the same direction as the Grossman-Stiglitz effect or is
small in magnitude. Specifically, the uncertainty reduction effect is captured by log¡+ 2
¢in equation
(27) and its strength is related to. By Propostion 2, we have
=
, which can be positive
or negative, depending on the sign of. If
0, then
0 and the uncertainty reduction effect
works in the same direction as the Grossman-Stiglitz effect. If
0, we have
1 by equation (52),
and hence the effect of on is smaller that its effect on ; therefore, the uncertainty reduction effect is
limited.
22
terizing price informativeness measures in the trading stage. The cost of information
represents a measure of the easiness of acquiring information on one fundamental : A
proliferation of sources of information about the firm (say, abundant disclosure, large an-
alyst/media coverage, and advanced communication technologies) leads to easier access to
information and corresponds to a low value of (e.g., Fishman and Hagerty, 1989; Kim
and Verrecchia, 1994). Our results depend on the strategic interactions between traders
producing information on the two different dimensions, as we discussed above. We now turn
to describe these effects and the comparative-statics results that they generate.
As we will show in Proposition 6, a decrease in the cost of acquiring signal increases
the equilibrium size ∗ of the population of -informed traders. This is intuitive since a lower
corresponds to a higher net benefit of knowing . More interestingly, the complementarity
effect emphasized in Proposition 5 implies that a decrease in , the cost of acquiring , can
increase the equilibrium size ∗ of the population of -informed traders, too. As a result,
∗ and ∗ move in the same direction in response to the change in , which is another
form of a positive market efficiency spiral. Proposition 6 shows that∗
0 if and only
if . Specifically, when , we have ∗ ∗ , which, according to Proposition 5,
implies
0, so that the increased ∗ (due to the decrease in ) increases the incentive of
traders to acquire , leading to a higher equilibrium size ∗ of the population of -informed
traders.
The proposition also shows that a decrease in the cost of acquiring signal always
leads the price to reveal more about the fundamental of the underlying asset, and as a result,
the total price informativeness measure ∗ increases. Finally, the equilibrium cost of capital
∗ is given by equations (24) and (26) as follows:
∗ =
∗0
where
∗0 = ∗1¡+ ∗22
¢+ ∗2
¡+ ∗21
¢+ (1− ∗1 − ∗2)
∗
=£∗1¡+ ∗22 − ∗
¢+ ∗2
¡+ ∗21 − ∗
¢¤+ ∗ (28)
23

Clearly, the increased ∗ caused by the decrease in tends to decrease ∗. We can also
show that the bracket term in equation (28), which captures the willingness to bear risk by
all informed traders, increases. Thus, a decrease in will decrease the equilibrium cost of
capital ∗. This suggests that disclosure, reducing the cost of information acquisition by
speculators improves market efficiency and reduces the cost of capital.
The proposition is stated as follows:
Proposition 6 A decrease in the cost of acquiring information
(i) increases the equilibrium size ∗ of -informed traders (i.e.,∗
0);
(ii) increases the equilibrium size ∗ of -informed traders if and only if (i.e.,∗
0
if and only if );
(iii) increases the overall price informativeness (i.e.,∗
0); and
(iv) decreases the equilibrium cost of capital ∗ (i.e., ∗
0).
Figure 3 plots ∗1 (Panel (a)), ∗2 (Panel (b)), and ∗1 and ∗2 (Panel (c)) as functions of
11for the same numerical example as in Figure 1 with 2 = 01 and 1 ∈ [005 013]. We
can see that, for low values of 1, we have ∗1 ∗2 , and so in equilibrium learning the two
types of information is complementary to each other, as ∗1 and ∗2 both become larger when
1 decreases. In contrast, for high values of 1, the Grossman-Stiglitz substitution effect
dominates and information choices are strategic substitutes.
[FIGURE 3 ABOUT HERE]
6 An Extension: Correlated Payoff Ingredients and
Noisy Signals
In this section, we analyze an extended economy where the two ingredients of the asset payoff
are correlated and where informed traders receive noisy signals about the two ingredients.
The analysis serves two purposes. First, it demonstrates the robustness of our main results
— that information diversity improves overall price informativeness and reduces the cost of
capital and that there are strategic complementarities at the stage of learning — by showing
24
that they hold in this extended economy. Second, it highlights the importance of multiple
dimensions of fundamentals in driving our results, as the extended economy nests both the
traditional unidimensional model analyzed by Hellwig (1980) and Verrecchia (1982) and the
new two-dimensional economy analyzed by this paper, thereby allowing a direct comparison
between them to sharpen the distinctions.
6.1 Setup
The asset payoff is still given by the sum of two ingredients: = 1 + 2. To accommodate
the correlation between and 2, we assume that they are generated by the following loading
structure:
1 =p +
p1− 1 (29)
2 =p +
p1− 2 (30)
where ∼ (0 1) is the common factor affecting both ingredients and where ∼ (0 1) is an idiosyncratic factor. We assume that ( 1 2) are mutually independent.
Thus, parameter ∈ [0 1] is the correlation coefficient between 1 and 2.
As in the our baseline model analyzed in previous sections, we assume that a continuum
[0 1] of traders can acquire signals regarding 1 and 2 at costs 1 0 and 2 0. Still,
each trader can only acquire one signal, and let denote the size of traders who decide to
become informed of . But now we do not assume that those informed traders observe
perfectly. Instead, an informed trader receives a noisy signal about :
= +
with
∼ (0 1) , 0, (31)
for ∈ [0 ] and = 1 2. Let ∼ (0 −1) be the noise traders’ demand for the risky
asset. We assume that ( 1 2 {} ) are mutually independent. Our baseline modelcorresponds to the special case of = 0 and = ∞ (i.e., the noise-to-signal ratio
= 0),
and the traditional unidimensional model analyzed by Hellwig (1980) corresponds to the
special case of = 1 and ∈ (0∞). Thus, this structure is general enough to serve our two
25
purposes mentioned above — demonstrating the robustness of our results and highlighting
the uniqueness of our analysis.
The price still linearly depends on the signals 1 and 2 and the noisy trading , given
by equation (2). We still use =to measure the price informativeness regarding , and
use =1
(|) to measure the overall price informativeness regarding = 1 + 2.
6.2 Equilibrium Characterization
The CARA-normal feature implies that the demand of investor informed of is:
( ) =
(| )−
(| ) (32)
Applying Bayes’ rule yields:
(| ) = (1)
− 0
+ (2)
1 (33)
(| ) =(1− ) () + 2 () () + (1− ) () (1 − 2)
2¡1− 2
¢2 + () (1 + ()) + () (
21 + 22 + 212)
(1 + ) −1 (34)
with
(1) =
(1 + ) [() + (() + 1− ) ]¡1− 2
¢2 + () (1 + ()) + () (
21 + 22 + 212)
(35)
(2) =
(1 + )£() + (1− ) 2 − (1− ) 12
¤¡1− 2
¢2 + () (1 + ()) + () (
21 + 22 + 212)
(36)
The system determining the price informativeness measures 1 and 2 in the financial
market is:
=
Z
0
¡|
¢
=
(2)
(| 1), for = 1 2 (37)
Equations (34), (36) and (37) jointly determine the equilibrium 1 and 2. Bayes’ rule also
implies that the overall price informativeness is:
=1
(|) =() + 21 + 22 + 212£
2 () + (1− ) (1 − 2)2¤(1 + ) −1
(38)
26
The cost of capital is:
= ( − ) =
1 −1(| 1) + 2 −1(| 2) + (1− 1 − 2) (39)
Going back to the information acquisition stage, the learning benefit (certainty equivalent
multiplied by 2) of observing signal is:
(1 2) = log
∙ (|)
(| )
¸− 2 (40)
The equilibrium fractions ∗1 and ∗2 of informed traders are obtained in two steps: first, set
(∗1
∗2) = 0 (for = 1 2) to solve
∗1 and ∗2 for the overall equilibrium; and second, use
the system defining 1 and 2 at the trading stage, that is, equations (34), (36) and (37), to
back out ∗1 and ∗2.
6.3 Robustness of Our Results
We now examine our twomain results: (i) at the trading stage, information diversity increases
overall price informativeness and decreases the cost of capital; and (ii) at the learning stage,
there is strategic complementarity in information acquisition.
The information diversity ∆ is still defined by equation (22):
∆ ≡ 1− |1 − 2|Λ
∈ [0 1]
where Λ is a fixed total size of the informed traders population. The complexity of the
equations defining the equilibrium 1 and 2 precludes simple analytical analysis. Instead we
use numerical analysis to examine the implications of information diversity and present the
result in Figure 4. We have checked a wide range of parameters and found that the results
hold for all parameter configurations.
[FIGURE 4 ABOUT HERE]
In Figure 4, we choose parameter values similar to those in Figure 2. That is, we set
27
= = 50, = 3 and Λ = 01. In Panel (a), we set = 05 and =∞ (i.e., the noise-to-
signal ratio
is 0) to isolate the impact of the correlation between the two ingredients 1
and 2. In Panel (b), we set = 0 and = 250 (i.e., the noise-to-signal ratio
is 02) to
isolate the impact of the noise in the signal . We find that, consistent with Propositions 3
and 4 in Section 4, increasing ∆ increases and decreases in both panels.
We use Figures 5 and 6 to investigate the implications of and for learning com-
plementarities, respectively. In both figures, we conduct an exercise similar to Figure 3 to
examine Proposition 6 — we fix 2 and decrease 1, and check whether there is a region for
which ∗1 and ∗2 move in the same direction in equilibrium.
10 Since ∗1 always decreases with
1, we only plot ∗2 against (21), and a U-shaped ∗2 indicates the existence of learning
complementarities.
[FIGURES 5 AND 6 ABOUT HERE]
Specifically, in both figures, we set = = 50 and = 3. Then, in each panel, we set
2 at a value such that when 1 = 2 = , the equilibrium fractions of informed traders
are ∗1 = ∗2 = 005. We see that, consistent with Panel (b) of Figure 3, for all economies
in Figures 5 and 6, when 1 is sufficiently low, so that the equilibrium ∗1 is sufficiently
large, ∗2 increases with (21) and hence moves in the same direction as ∗1. Figure 5 also
suggests the turning point of (21) increases with . This is because when is high, the
Grossman-Stiglitz effect is strong: The high correlation between 1 and 2 implies that much
information contained in signal 2 can be learned from observing prices, which aggregate
many new acquired 1 signals due to the drop in 1.
6.4 Two-Dimensional Economy versus Hellwig (1980)
In this last subsection, we will compare our economy with the unidimensional economy
studied by Hellwig (1980) and Verrecchia (1982) to highlight the role of multiple dimensions
of fundamentals in delivering our results. As we mentioned before, when we choose = 1 and
10Note that Proposition 6 is an equilibrium result of complementarities in information acquisition de-
scribed in Proposition 5. So, Figures 5 and 6 are a stronger test of learning complementarities. We will
examine Proposition 5 more closely in the next subsection when we compare our economy with the standard
unidimensional Hellwig (1980) economy.
28

∈ (0∞), the two ingredients of asset payoff reduce to one common factor and informedtraders acquire a noisy signal about this common factor representing the overall asset payoff.
In this case, using the equations characterizing the equilibrium, we can analytically compute
the price informativeness measures, the cost of capital, and the benefit of acquiring signals,
which all depend on the total size Λ of the informed traders population. In particular,
unlike Propositions 3-5 in previous sections, now information diversity ∆ does not influence
the overall price informativeness and the cost of capital (∆=
∆= 0), and acquiring
information is always a substitute (
=
0), which suggests that our results are driven
by the fact that informed traders are informed of non-perfectly correlated components of asset
payoff (i.e., 6= 1).11 We summarize these results in the following proposition.
Proposition 7 [Hellwig (1980)] Suppose = 1 and ∈ (0∞). Then, (i) 1 = 12,
2 =22, =
4+³Λ4
´2, = 4
+Λ+(Λ2 )2, and hence
∆=
∆= 0; (ii) (1 2) =
log
∙
+(Λ2 )2+ 1
¸− 2, and hence
=
0, for = 1 2 and 6= .
Figures 7 and 8 further use numerical examples to compare our economy and the Hellwig
(1980) economy. In both figures, Panel (a) corresponds to the one-dimensional economy
studied by Hellwig (1980): = 1. Panel (b) corresponds to a two-dimensional economy
where the two payoff ingredients are non-perfectly correlated: = 05. In both economies,
we assume that informed traders observe noisy signals about the asset payoff by setting
= 250 (i.e., the noise-to-signal ratio
= 02). The other parameter values in both panels
are: = = 50 and = 3. In Figure 7, Panel (a) illustrates Proposition 7 by showing that
the overall price informativeness and the cost of capital do not vary with information
diversity ∆, while Panel (b) confirms Propositions 3 and 4 in the two-dimensional economy
11An alternative view is that the Hellwig (1980) economy is the limiting case of our two-dimensional
economy and our results hold trivially. Specifically, since all traders are effectively informed of only common
factor, then (i) in effect, there are no distinctions between 1 and 2, and the variable of information diversity
∆ effectively takes only one value of 0, and thus the overall price informativeness and the cost of capital
take only one value accordingly, which is consistent with Propositions 3 and 4 trivially (as there are no
variations of ∆), and (ii) for the same reason,
effectively captures the strategic substitute in acquiring
information on the same fundamental, which is consistent with Proposition 5, too. But both views highlight
the fact that our results can only be developed in a two-dimensional economy like the one analyzed in this
paper.
29
by showing that increases with ∆ and that decreases with ∆.
[FIGURES 7 AND 8 ABOUT HERE]
In Figure 8, for both the Hellwig economy and the two-dimensional economy, we con-
duct two exercises to examine learning complementarities, which correspond respectively
to Propositions 5 and 6. First, to examine Proposition 5 which directly describes learning
complementarities through the impact of the number of informed traders on the benefit of
acquiring information, we draw the simplex©(1 2) ∈ R2+ : 1 + 2 ≤ 1
ª— which is the
whole range of (1 2) — and use “+” to indicate the complementarity region for which the
benefit 2 of acquiring signal about 2 increases with the size 1 of 1-informed group (i.e.,
21
0). We see that there is no such a complementarity region in the Hellwig economy,
while the size of the complementarity region is nontrivial in the two-dimensional economy.
In addition, we find that 21
is more likely to be positive in the two-dimensional economy
when 1 is relatively large relative to 2, which is consistent with Proposition 5 which says
that 21
0 if and only if 1 2 in the baseline model.
Second, we follow Figure 3 and draw the equilibrium ∗2 against (21) to examine
Proposition 6 which specifies the implications of changing the cost of information in the
presence of learning complementarities. Specifically, we fix 2 at a constant (such that
∗1 = ∗2 = 005 when 1 = 2 = ) and decrease 1, and then plot ∗2 against (21) = (1).
Then, a U-shaped ∗2 indicates the existence of learning complementarities, since the right
upward-sloping branch is a region for which ∗1 and ∗2 move in the same direction in response
to a change in 1. We see that, in the two-dimensional economy, ∗2 indeed first decreases
and then increases with (21), which is consistent with Proposition 6. In contrast, in the
Hellwig economy, ∗2 generally decreases with (21): When (21) 1, we have 1 2 = ,
and all informed traders acquire information about 2 (which is the overall payoff too) since
the cost of acquiring 2 is cheaper than that of acquiring 1 (which is too), and the size ∗2
is maintained at Λ∗ = 01; when (21) 1, then 2 = 1 and thus no one will acquire
2 and hence ∗2 = 0; when (21) = 1, then 1 = 2 = , the exact size ∗2 is indeterminate,
and it can take any value in [0Λ∗].
30
Now the central message at the learning stage should be clear. The standard result that
the benefit of acquiring information decreases with the total size of the informed traders pop-
ulation in the unidimensional Hellwig (1980) economy is not robust to perturbations in the
correlation of different ingredients of the asset payoff. How traders respond to other traders
becoming informed does not only depend on the total size of the informed group, but also
on its composition. If traders are acquiring information about fundamentals that are weakly
correlated, then acquiring information on different fundamentals tend to be a complement
instead of a substitute, as the price will reveal more information that is unknown even after
traders become informed and hence that is particularly useful in reducing uncertainty when
combined with their own acquired information in a particular dimension.
7 Conclusion
Our paper addresses a fundamental question in the study of market efficiency and price
informativeness: Does information in financial markets attract or deter the production and
transmission of more information? Extending the seminal Grossman and Stiglitz (1980)
model to include two dimensions of uncertainty in the value of the traded asset, we uncover
a rich set of interactions, providing new insights into this question.
When the price becomes more informative about one fundamental, traders informed
about another fundamental may reduce their trading aggressiveness due to an adverse se-
lection effect, or increase it due to an uncertainty reduction effect. We show that the latter
effect dominates in equilibrium if and only if the levels of informativeness about the two
fundamentals are sufficiently close to each other, implying that greater diversity of informa-
tion in the economy generates amplification of informativeness and hence greater equilibrium
market efficiency. We also show that the uncertainty reduction effect can generate strategic
complementarities in information production, leading to another form of a market efficiency
spiral.
The paper highlights the importance of information diversity in determining the level of
market efficiency. Future empirical research can test the predictions of the paper by linking
the diversity of trading styles to measures of market efficiency and price informativeness.
31
Future theoretical research can extend the model in various directions, such as including
more dimensions of uncertainty and allowing traders to be informed in various dimensions,
to improve our understanding of the effect of information structure on the efficiency of
financial markets.
Appendix: Proofs
A. Proof of Proposition 1
Using the expressions for ( ) and () (given by equations (8) and (9)) and the definition
of | (given by equations (4)), we can rewrite the market clearing condition (equation (14)) asfollows:
1
h+ (2)
2 − (2)2 2i
+2
h+ (1)
2 − (1)2 1i+
− (|) (|)
= 1 (2)2 −02
+ 2 (1)2 −01−
+1
h+ (2)
2 − (1) (2)i1
+2
h+ (1)
2 − (1) (2)i2 + (41)
Note that the left-hand side of the above equation is only related to , while the right-hand
side is only related to 1, 2, and . Hence, based on (41) and (2), we form the following system of
two equations in terms of two unknowns, (1) and (2):
(1) = 1
h+ (2)
2 − (1) (2)i−1 (42)
(2) = 2
h+ (1)
2 − (1) (2)i−1 (43)
By equation (43), we can express (2) in terms of (1) as follows (this is equation (19)
for = 2 in the main text):
2
=
2
h+ (1)
2i
[ + 2 (1)] (44)
Then, plugging the above expression into equation (42), we have the following cubic polynomial in
(1): ¡12
2 + 222¢(1)
3 + 2¡22− 1
22
2¢(1)
2
+¡12− 212+ 3
¢(1) +
¡−1222− 21¢
= 0 (45)
32

The discriminant of the polynomial is
−212¡2 + 22
¢2Ã 46 + 24412+ 32331
323
+212
³2621
2 + (1− 32)2 + 18222´ !
0
Thus, equation (45) has only one real solution for (1). In addition, this solution is positive,
because when 1 0 and 2 0, the left-hand side of equation (45) is negative at (1) = 0
and becomes positive as (1) is sufficiently large. By equation (44), we also know that the
equilibrium coefficient ratio 2is positive.
Using equations (9)-(13) to express out−(|) (|) in equation (41) deliversµ
0 −1
¶ = 11 +22 + +
µ−010
1−02
0
2−0
0
−
¶where the coefficients of ’s are known positive values — which are determined by (1) and
(2) — defined as follows:
0 =1
(|F1) +2
(|F2) +
(|) (46)
= 1 (2)+ 2 (1)+
(|) (47)
1 = (1) 2 = (2)
01 = 2 (1)2 02 = 1 (2)
2 0 =
(|)
Thus, we can solve for :
=
0 −1
⇒ = +
0 0 (48)
Combining the known ratios (1) and (2) with the value of gives the values of 1 and
2, which are positive. Once we know 1, 2 and , then we can solve 0 using
0 =−01 01 −02
02−0
0−
0 −1
⇒ 0 = − ³0 −
1
´+01
11+02
12+0
1
We can further use the solved expressions of 01, 02, 0 and to simplify the denominator of
the above expression of 0 and show that
0 = −
0 0
This in turn implies that the cost of capital is
= ( − ) = −0 =
0 (49)
QED.
33

B. Proof of Proposition 2
Taking total differentiation of equation (19) (for = 1 2) with respect to implies:
1
=
1
+
1
2
2
and
2
=
2
+
2
1
1
Solving for 1and 2
delivers
1
=
1+ 1
2
2
1− 12
21
and2
=
2+ 2
1
1
1− 12
21
which is equation (20).
Next, we examine the sign and magnitude of M =³1− 1
2
21
´−1. By equation (19), direct
computation shows
= 1− 2 + 2
( + )2 (50)
Using equations (42)-(43), we can express in terms of 1 and 2 as follows:
=
+ 2 − 12 (51)
Plugging the above expression into equation (50) yields:
=(2 − )
+ 2 (52)
Thus, we have
M−1 = 1− 1
2
2
1
= 1− (22 − 1)1
+ 22
(21 − 2)2
+ 21
=(+ 212)
³+ (1 − 2)
2´
¡+ 22
¢ ¡+ 21
¢ 0
That is,M 0.
Whether 1 depends on whether 12
and 21
have the same sign. Specifically, we have
three cases.
Case 1. If
= 0 for some , thenM = 1. By equation (52), this will be true if and only if
=(2 − )
+ 2= 0⇒
= 2
Case 2. If
0 for = 1 2, thenM 1. By equation (52), this will be true if and only if
=(2 − )
+ 2 0⇒
2∀⇒ 1
2
1
2 2
34

Case 3. If
0 and
0, then 0 M 1. This will be true if and only if 2, i.e.,
12
2 or 12
12.
Note that it is not possible to have both 12
0 and 21
0, because these two inequalities
combine to imply 2 1
2, which is impossible. QED.
C. Proof of Proposition 3
Without loss of generality, we assume that 1 2, and as a result, increasing diversity ∆ while
fixing Λ is equivalent to decreasing 1 and increasing 2. Formally, we have
1 + 2 = Λ and ∆ = 1− 1 − 2
1 + 2=
22
1 + 2
Then, taking total differentiation of the above system, yields:
1 + 2 = Λ = 0
µ22
1 + 2
¶= 2
µ− 2
(1 + 2)21 +
(1 + 2)− 2
(1 + 2)2
2
¶= ∆
which implies:1
∆= −Λ
2and
2
∆=Λ
2 (53)
and1
=
1
∆= −1
1
Λ
2and
2
=
2
∆=
2
2
Λ
2 (54)
in equation (20).
Now, we analyze the impact of ∆ on the total price informativeness . By equations (20) and
(54), we have
1
∆= M
µ1
∆+
1
2
2
∆
¶= M
µ−11
+1
2
2
2
¶Λ
2
Then, using equations (50) and (51), we have
1
∆=MΛ
2
⎡⎢⎣− + 22³ + 1
+22−122
´2 + (22 − 1)1
+ 22
+ 21³ + 2
+21−121
´2⎤⎥⎦ (55)
Similarly, we can compute:
2
∆=MΛ
2
⎡⎢⎣ + 21³ + 2
+21−121
´2 − (21 − 2)2
+ 21
+ 22³ + 1
+22−122
´2⎤⎥⎦ (56)
35

Recall that by equation (15), we have:
=1
(|) =21+ 22+ 2−1
(1 − 2)2 + 2−1
Direct computation shows:
1=
2 (1 + 2)¡+ 22 − 12
¢¡2+ 21 + 22 − 212
¢2 0 (57)
2=
2 (1 + 2)¡+ 21 − 12
¢¡2+ 21 + 22 − 212
¢2 0 (58)
where the inequalities follow from equations (42)-(43), namely, (+ 2 − 12) =
0.
By chain rule:
∆=
1
1
∆+
2
2
∆
Plugging equations (55)-(58) into the above equation delivers:
∆=MΛ
2
22¡21 − 22
¢(1 + 2)¡
2+ 21 + 22 − 212¢2 3 + 2 (1 + 2)
2 + 3212 (1 − 2)2 + 312 (1 − 2)
4
2¡+ 22
¢ ¡+ 21
¢ 0
because 1 2 by 1 2. QED.
D. Proof of Proposition 4
We build on the proof of the previous proposition. By equations (25) and (24), to show ∆
0,
it suffices to show0
∆ 0. By equations (26) and (53), we have
0
∆=
1
∆
¡+ 22
¢+ 1
µ22
2
∆
¶+
2
∆
¡+ 21
¢+ 2
µ21
1
∆
¶+ (1− Λ)
∆
=Λ
2¡21 − 22
¢+ (1− Λ)
∆+ 2
µ12
2
∆+ 21
1
∆
Since Λ2¡21 − 22
¢ 0 and (1− Λ)
∆ 0, to show
0
∆ 0, it suffices to showµ
122
∆+ 21
1
∆
¶ 0
which is true, because equations (51), (55) and (56) imply:
122
∆+ 21
1
∆
= MΛ212
¡21 − 22
¢ 3 + 2 (1 + 2)2 + 3212 (1 − 2)
2 + 312 (1 − 2)4¡
+ 22¢ ¡+ 21
¢ ¡+ 22 − 12
¢ ¡+ 21 − 12
¢ 0
QED.
36

E. Proof of Proposition 5
Let us first prove
0. By Proposition 2, we have:
=M (+ 2 )
( + )2 0 and
=(2 − )
+ 2
By equation (27) and the above expression of, we have:
=
2
+ 2
− 1
µ
+
¶=
"Ã2
+ 2 − 1
!(2 − )
+ 2− 1
#
Then, using equations (15), (57) and (58), we can show the bracket term in the above equation
is negative: Ã2
+ 2 − 1
!(2 − )
+ 2− 1
= −2³+ 2 − 12
´" 21 + 22 + 31 + 32 + (1 − 2)2
+22 + 2
³22 + 2
´(1 − 2)
2
#¡+ 21
¢ ¡+ 22
¢ ¡+ 21 + 22
¢ ¡2+ 21 + 22 − 212
¢ 0
where we have used the fact of³+ 2 − 12
´=
0. Thus,
0.
Next, we prove
0 if and only if . Following the similar argument as above, we can
show:
=
"2
+ 2 − 1
− 1
(2 − )
+ 2
#
=2 ( − )
³+ 2 − 12
´2³+ 2
´ ¡2+ 21 + 22 − 212
¢ ¡+ 21 + 22
¢
Since
0, we have
0 if and only if . QED.
F. Proof of Proposition 6
Setting (1 2) = 0 for = 1 2 delivers the following system:½log¡+ ∗22
¢− log (∗ ) = 21log¡+ ∗21
¢− log (∗ ) = 22 (59)
37

Suppose we decrease 1. Applying the implicit function theorem to the above system delivers:⎧⎨⎩ −1∗
∗∗1
∗11+³− 1
∗∗∗2
+2∗2
+∗22
´∗21
= 2³− 1
∗∗∗1
+2∗1
+∗21
´∗11− 1
∗∗∗2
∗21
= 0
Thus,∗11
= −2
1
∗
∗∗2
and∗21
= −2
µ− 1∗
∗∗1
+2∗1
+ ∗21
¶ (60)
where
=42
¡∗21 + ∗22
¢ ¡+ ∗22 − ∗1
∗2
¢ ¡+ ∗21 − ∗1
∗2
¢¡+ ∗22
¢ ¡+ ∗21
¢ ¡+ ∗21 + ∗22
¢ ¡2+ ∗21 + ∗22 − 2∗1∗2
¢ 0Impact on ∗1 and ∗2 By equation (51),
∗11
=
¡+ ∗22
¢ ∗11+ (∗1 − 2∗2 ) ∗1∗2
1¡+ ∗22 − ∗1
∗2¢2
Then, plugging equation (60), (15), (57) and (58) into the above expression yields:
∗11
= −42¡+ ∗21 − ∗1
∗2
¢¡+ ∗22 − ∗1
∗2¢2
∙2∗1 + 2∗2 + ∗31 + ∗32 + 2∗1
∗22
+∗1 (∗1 − ∗2 )
2¡+ ∗21 + 2∗22
¢ ¸¡+ ∗21
¢ ¡+ ∗21 + ∗22
¢ ¡2+ ∗21 + ∗22 − 2∗1∗2
¢ 0Similarly, we can compute:
∗21
= ∗2 (
∗2 − 2∗1 )∗1
1+¡+ ∗21
¢ ∗21¡
+ ∗21 − ∗1∗2¢2
= − 42 (∗1 − ∗2 )
¡+ ∗21 − ∗1
∗2¢2
¡+ ∗21 − ∗1
∗2
¢2¡+ ∗21 + ∗22
¢ ¡2+ ∗21 + ∗22 − 2∗1∗2
¢ Thus,
∗21
0 if and only if ∗1 ∗2 .Finally, we have
∗1 ∗2 ⇔ 1 2,
because the system of determining ∗1 and ∗2 (equation (59)) implies that
log¡+ ∗22
¢− log ¡+ ∗21 ¢= 2 (1 − 2)
Therefore.∗21
0 if and only if 1 2.
Impact on ∗ . By the chain rule,
∗1
=∗∗1
∗11
+∗∗2
∗21
38

Plugging equations (57), (58) and (60) into the above equation delivers:
∗1
= −2
∗∗2
2∗1+ ∗21
0
Impact on ∗. Given∗1
0, to show ∗1
0, it suffices to show that in equation (28)
the term£∗1¡+ ∗22 − ∗
¢+ ∗2
¡+ ∗21 − ∗
¢¤decreases with 1. By equations (15) and (51),
we have:
∗1¡+ ∗22 − ∗
¢+ ∗2
¡+ ∗21 − ∗
¢=
∗1 + ∗22+ ∗21 + ∗22 − 2∗1∗2
Direct computation shows:
1
∙
∗1 + ∗22+ ∗21 + ∗22 − 2∗1∗2
¸=
¡2− ∗21 + 3∗22 − 2∗1∗2
¢ ∗11+¡2+ 3∗21 − ∗22 − 2∗1∗2
¢ ∗21¡
2+ ∗21 + ∗22 − 2∗1∗2¢2
Plugging equations (57), (58) and (60) into the above equation shows:
1
£∗1¡+ ∗22 − ∗
¢+ ∗2
¡+ ∗21 − ∗
¢¤= −4
2¡∗1 + ∗31 + ∗32 + 2∗1
∗22 + ∗1
¡+ ∗21 − ∗1
∗2
¢¢ ¡+ ∗21 − ∗1
∗2
¢¡2+ ∗21 + ∗22 − 2∗1∗2
¢2 ¡+ ∗21
¢ ¡+ ∗21 + ∗22
¢ 0
QED.
39
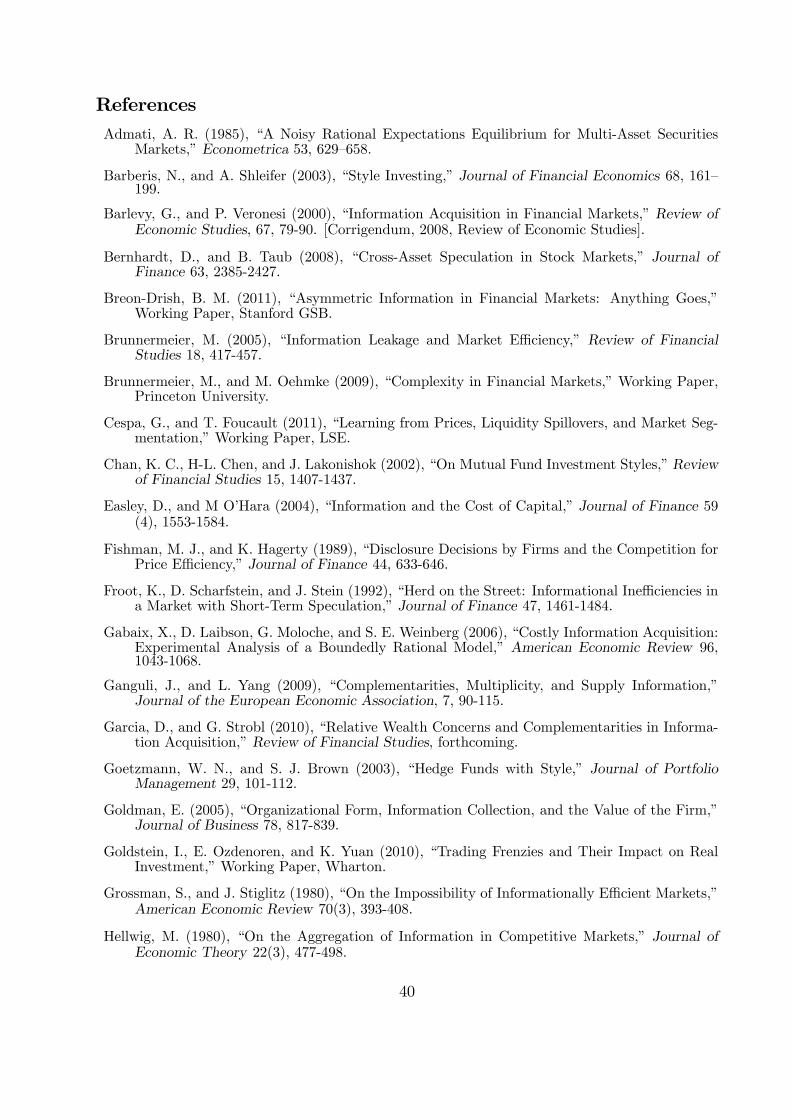
References
Admati, A. R. (1985), “A Noisy Rational Expectations Equilibrium for Multi-Asset SecuritiesMarkets,” Econometrica 53, 629—658.
Barberis, N., and A. Shleifer (2003), “Style Investing,” Journal of Financial Economics 68, 161—199.
Barlevy, G., and P. Veronesi (2000), “Information Acquisition in Financial Markets,” Review ofEconomic Studies, 67, 79-90. [Corrigendum, 2008, Review of Economic Studies].
Bernhardt, D., and B. Taub (2008), “Cross-Asset Speculation in Stock Markets,” Journal ofFinance 63, 2385-2427.
Breon-Drish, B. M. (2011), “Asymmetric Information in Financial Markets: Anything Goes,”Working Paper, Stanford GSB.
Brunnermeier, M. (2005), “Information Leakage and Market Efficiency,” Review of FinancialStudies 18, 417-457.
Brunnermeier, M., and M. Oehmke (2009), “Complexity in Financial Markets,” Working Paper,Princeton University.
Cespa, G., and T. Foucault (2011), “Learning from Prices, Liquidity Spillovers, and Market Seg-mentation,” Working Paper, LSE.
Chan, K. C., H-L. Chen, and J. Lakonishok (2002), “On Mutual Fund Investment Styles,” Reviewof Financial Studies 15, 1407-1437.
Easley, D., and M O’Hara (2004), “Information and the Cost of Capital,” Journal of Finance 59(4), 1553-1584.
Fishman, M. J., and K. Hagerty (1989), “Disclosure Decisions by Firms and the Competition forPrice Efficiency,” Journal of Finance 44, 633-646.
Froot, K., D. Scharfstein, and J. Stein (1992), “Herd on the Street: Informational Inefficiencies ina Market with Short-Term Speculation,” Journal of Finance 47, 1461-1484.
Gabaix, X., D. Laibson, G. Moloche, and S. E. Weinberg (2006), “Costly Information Acquisition:Experimental Analysis of a Boundedly Rational Model,” American Economic Review 96,1043-1068.
Ganguli, J., and L. Yang (2009), “Complementarities, Multiplicity, and Supply Information,”Journal of the European Economic Association, 7, 90-115.
Garcia, D., and G. Strobl (2010), “Relative Wealth Concerns and Complementarities in Informa-tion Acquisition,” Review of Financial Studies, forthcoming.
Goetzmann, W. N., and S. J. Brown (2003), “Hedge Funds with Style,” Journal of PortfolioManagement 29, 101-112.
Goldman, E. (2005), “Organizational Form, Information Collection, and the Value of the Firm,”Journal of Business 78, 817-839.
Goldstein, I., E. Ozdenoren, and K. Yuan (2010), “Trading Frenzies and Their Impact on RealInvestment,” Working Paper, Wharton.
Grossman, S., and J. Stiglitz (1980), “On the Impossibility of Informationally Efficient Markets,”American Economic Review 70(3), 393-408.
Hellwig, M. (1980), “On the Aggregation of Information in Competitive Markets,” Journal ofEconomic Theory 22(3), 477-498.
40
Hong, H., J. Stein, and J. Yu (2007), “Simple Forecasts and Paradigm Shifts,” Journal of Finance62, 1207-1242.
Kim, O., and R. E. Verrecchia (1994), “Market Liquidity and Volume Around Earnings Announce-ments,” Journal of Accounting and Economics 17, 41-68.
Kondor, P. (2012), “The More We Know about the Fundamental, the Less We Agree on thePrice,” Review of Economic Studies.
Kyle, A. S. (1985), “Continuous Auctions and Insider Trading,” Econometrica 53, 1315-1335.
Lee, S. (2010), “Active Investment, Liquidity Externalities, and Markets for Information,” Work-ing Paper, NYU Stern.
Mele, A., and F. Sangiorgi (2010), “Uncertainty, Information Acquisition and Price Swings inAsset Markets,” Working Paper, Stockholm School of Economics.
Moscarini, G. (2004), “Limited Information Capacity as a Source of Inertia,” Journal of EconomicDynamics and Control 28, 2003-2035.
Peng, L. (2005), “Learning with Information Capacity Constraints,” Journal of Financial andQuantitative Analysis 50, 307-329.
Peng, L., and W. Xiong (2006), “Investor Attention, Overconfidence and Category Learning,”Journal of Financial Economics 80, 563-602.
Subrahmanyam, A., and S. Titman (1999), “The Going-Public Decision and the Development ofFinancial Markets,” Journal of Finance 54, 1045-1082.
Verrecchia, R. E. (1982), “Information Acquisition in A Noisy Rational Expectations Economy,”Econometrica 50(6), 1415-1430.
Yuan, K. (2005), “The Liquidity Service of Benchmark Securities,” The Journal of the EuropeanEconomic Association 3 (5), 1156 - 1180.
41
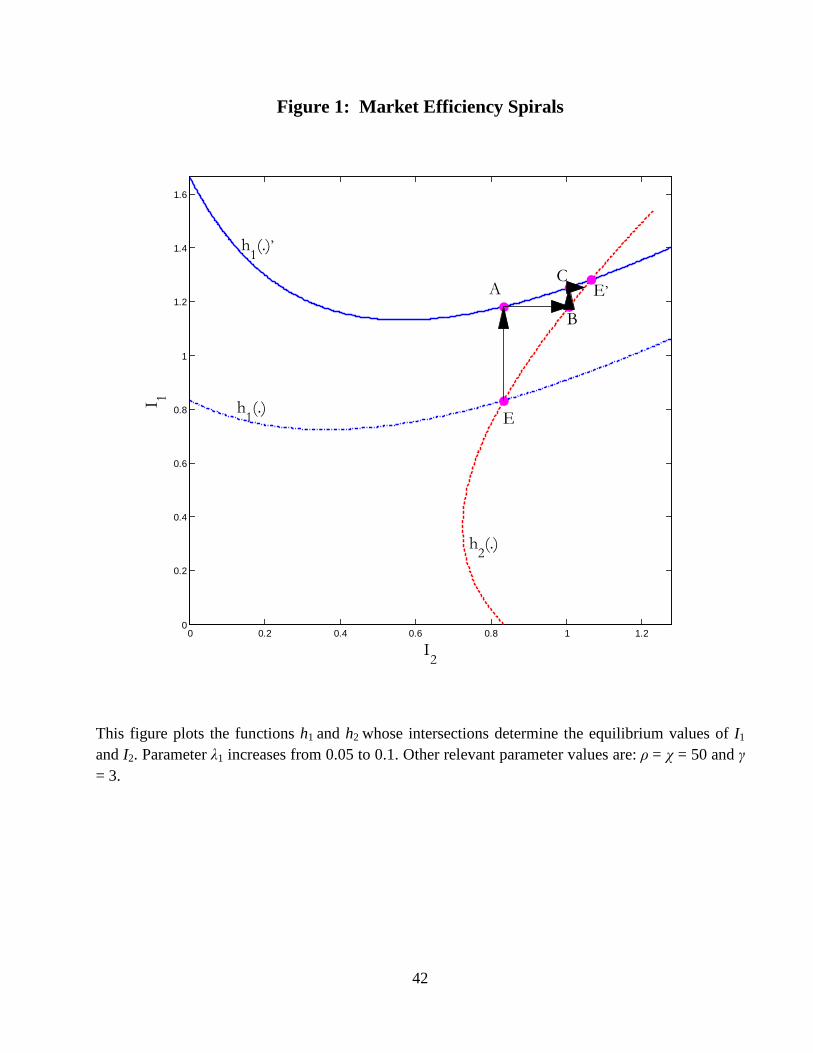
42
Figure 1: Market Efficiency Spirals
This figure plots the functions h1 and h2 whose intersections determine the equilibrium values of I1
and I2. Parameter λ1 increases from 0.05 to 0.1. Other relevant parameter values are: ρ = χ = 50 and γ = 3.
0 0.2 0.4 0.6 0.8 1 1.20
0.2
0.4
0.6
0.8
1
1.2
1.4
1.6
I2
I 1
E
E,
h1(.)
h1(.),
h2(.)
A
B
C
43
Figure 2: Impact of Diversity (Δ)
This figure plots the impact of information diversity on market efficiency multiplier, price informativeness regarding total cash flow, and cost of capital. The parameter values are ρ = χ = 50, γ = 3 and Λ = 0.1.
0 0.2 0.4 0.6 0.8 10.85
0.9
0.95
1
1.05
1.1
1.15
1.2
Diversity, ∆
M(a)
0 0.2 0.4 0.6 0.8 1
40
42
44
46
48
50
52
54
56
58
Diversity, ∆
I v
(b)
0 0.2 0.4 0.6 0.8 1
0.05
0.055
0.06
0.065
0.07
Diversity, ∆
Cost
of C
apita
l
(c)
44
Figure 3: Learning Complement vs. Substitute
This figure plots the impact of the cost c1 of acquiring 𝑣�1 on the endogenous fractions of informed traders and the price informativeness measures. When the two fractions 𝜆1∗ and 𝜆2∗ of informed traders move in the same direction, there exist learning complementarities; otherwise, information acquisition is a substitute. The parameter values are: ρ = χ = 50, γ = 3, and c2 = 0.1. The range of c1 is [0.05, 0.13].
8 10 12 14 16 18 20
0.01
0.02
0.03
0.04
0.05
0.06
1/c1
λ* 1
(a)
8 10 12 14 16 18 20
0.02
0.022
0.024
0.026
1/c1
λ* 2
(b)
8 10 12 14 16 18 20
0.2
0.4
0.6
0.8
1/c1
I* 1, I* 2
(c)
I*1
I*2
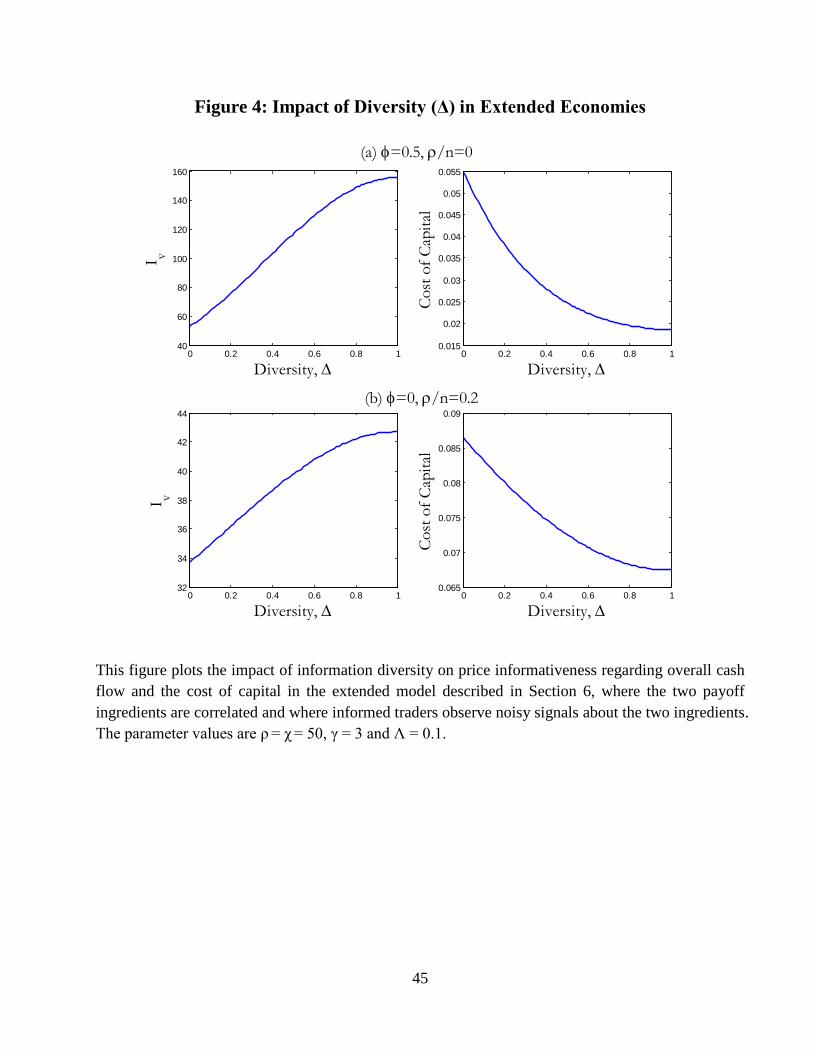
45
Figure 4: Impact of Diversity (Δ) in Extended Economies
This figure plots the impact of information diversity on price informativeness regarding overall cash flow and the cost of capital in the extended model described in Section 6, where the two payoff ingredients are correlated and where informed traders observe noisy signals about the two ingredients. The parameter values are ρ = χ = 50, γ = 3 and Λ = 0.1.
0 0.2 0.4 0.6 0.8 140
60
80
100
120
140
160
Diversity, ∆
I v(a) φ=0.5, ρ/n=0
0 0.2 0.4 0.6 0.8 10.015
0.02
0.025
0.03
0.035
0.04
0.045
0.05
0.055
Diversity, ∆
Cost
of C
apita
l
0 0.2 0.4 0.6 0.8 132
34
36
38
40
42
44
Diversity, ∆
I v
(b) φ=0, ρ/n=0.2
0 0.2 0.4 0.6 0.8 10.065
0.07
0.075
0.08
0.085
0.09
Diversity, ∆
Cost
of C
apita
l
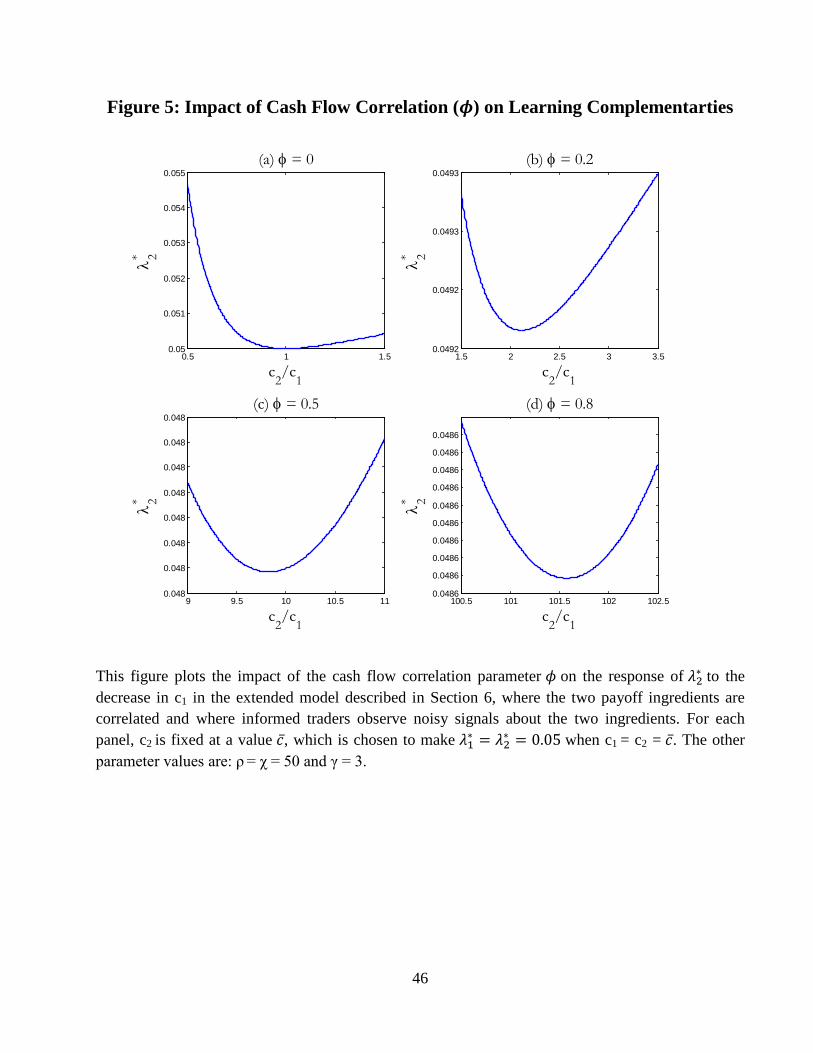
46
Figure 5: Impact of Cash Flow Correlation (𝝓) on Learning Complementarties
This figure plots the impact of the cash flow correlation parameter 𝜙 on the response of 𝜆2∗ to the decrease in c1 in the extended model described in Section 6, where the two payoff ingredients are correlated and where informed traders observe noisy signals about the two ingredients. For each panel, c2 is fixed at a value 𝑐, which is chosen to make 𝜆1∗ = 𝜆2∗ = 0.05 when c1 = c2 = 𝑐. The other parameter values are: ρ = χ = 50 and γ = 3.
0.5 1 1.50.05
0.051
0.052
0.053
0.054
0.055
c2/c
1
λ* 2(a) φ = 0
1.5 2 2.5 3 3.50.0492
0.0492
0.0493
0.0493
c2/c
1
λ* 2
(b) φ = 0.2
9 9.5 10 10.5 110.048
0.048
0.048
0.048
0.048
0.048
0.048
0.048
c2/c
1
λ* 2
(c) φ = 0.5
100.5 101 101.5 102 102.50.0486
0.0486
0.0486
0.0486
0.0486
0.0486
0.0486
0.0486
0.0486
0.0486
c2/c
1
λ* 2(d) φ = 0.8
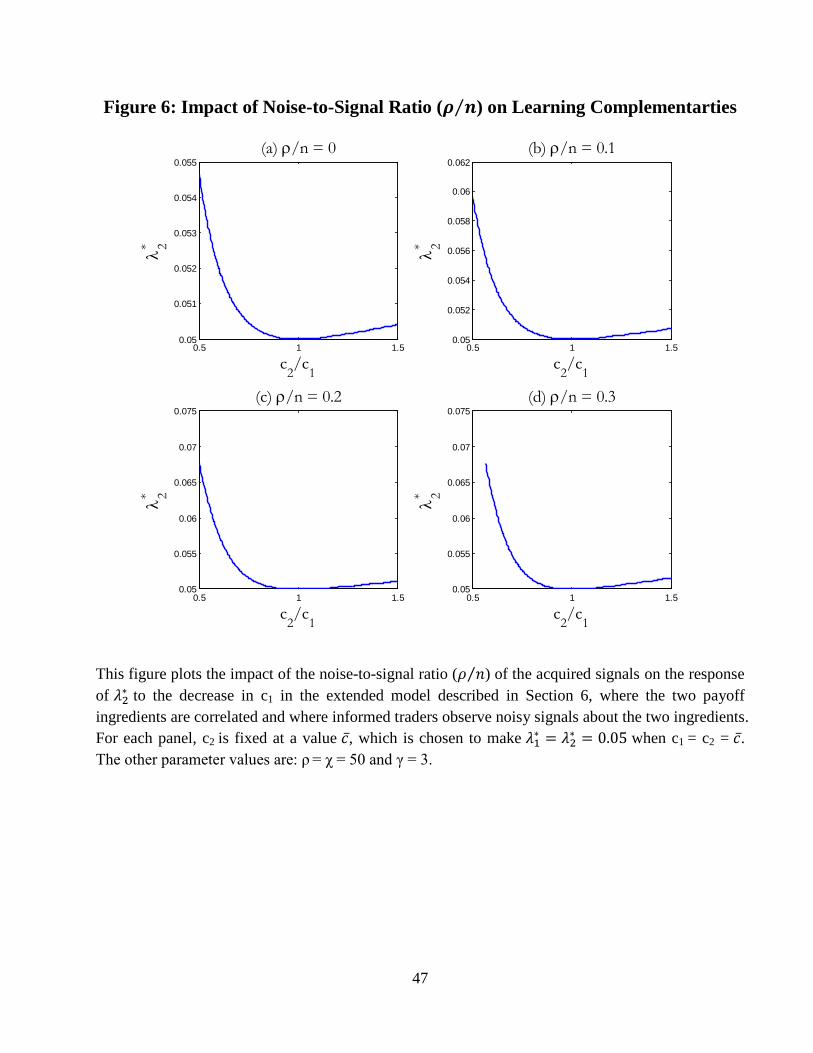
47
Figure 6: Impact of Noise-to-Signal Ratio (𝝆 𝒏⁄ ) on Learning Complementarties
This figure plots the impact of the noise-to-signal ratio (𝜌 𝑛⁄ ) of the acquired signals on the response of 𝜆2∗ to the decrease in c1 in the extended model described in Section 6, where the two payoff ingredients are correlated and where informed traders observe noisy signals about the two ingredients. For each panel, c2 is fixed at a value 𝑐, which is chosen to make 𝜆1∗ = 𝜆2∗ = 0.05 when c1 = c2 = 𝑐. The other parameter values are: ρ = χ = 50 and γ = 3.
0.5 1 1.50.05
0.051
0.052
0.053
0.054
0.055
c2/c
1
λ* 2(a) ρ/n = 0
0.5 1 1.50.05
0.052
0.054
0.056
0.058
0.06
0.062
c2/c
1
λ* 2
(b) ρ/n = 0.1
0.5 1 1.50.05
0.055
0.06
0.065
0.07
0.075
c2/c
1
λ* 2
(c) ρ/n = 0.2
0.5 1 1.50.05
0.055
0.06
0.065
0.07
0.075
c2/c
1
λ* 2
(d) ρ/n = 0.3
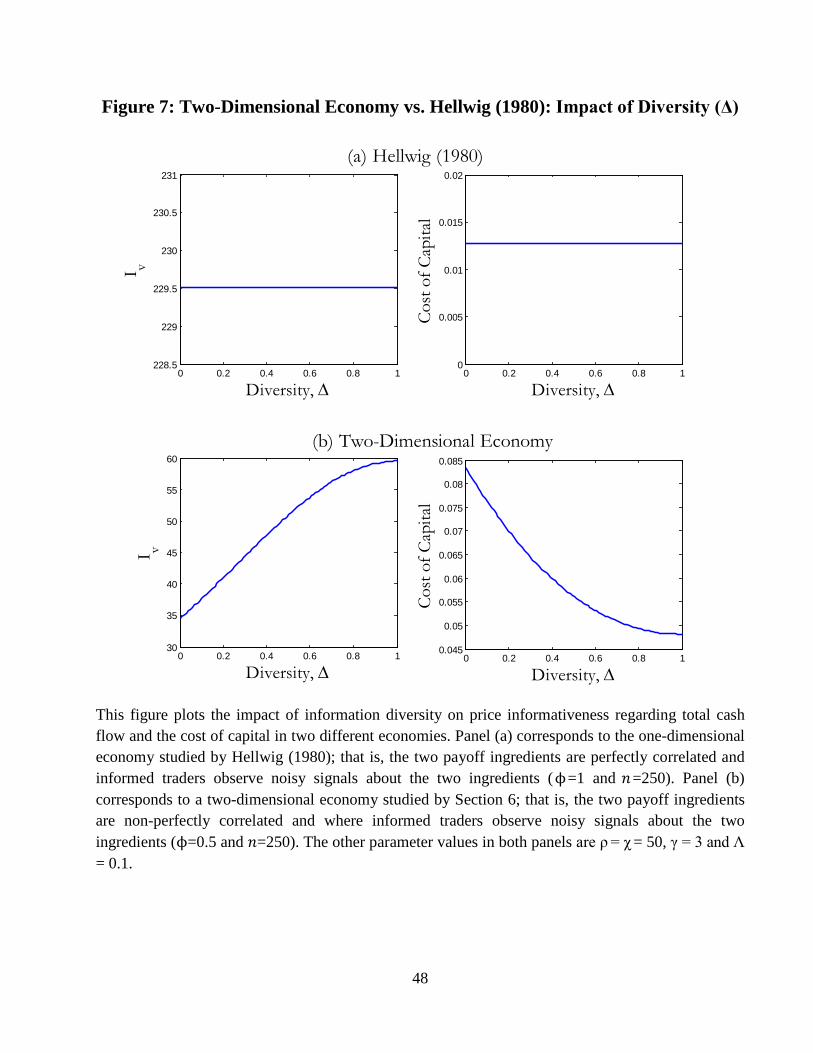
48
Figure 7: Two-Dimensional Economy vs. Hellwig (1980): Impact of Diversity (Δ)
This figure plots the impact of information diversity on price informativeness regarding total cash flow and the cost of capital in two different economies. Panel (a) corresponds to the one-dimensional economy studied by Hellwig (1980); that is, the two payoff ingredients are perfectly correlated and informed traders observe noisy signals about the two ingredients (ϕ=1 and 𝑛=250). Panel (b) corresponds to a two-dimensional economy studied by Section 6; that is, the two payoff ingredients are non-perfectly correlated and where informed traders observe noisy signals about the two ingredients (ϕ=0.5 and 𝑛=250). The other parameter values in both panels are ρ = χ = 50, γ = 3 and Λ = 0.1.
0 0.2 0.4 0.6 0.8 1228.5
229
229.5
230
230.5
231
Diversity, ∆
I v
0 0.2 0.4 0.6 0.8 10
0.005
0.01
0.015
0.02
Diversity, ∆
Cost
of C
apita
l
(a) Hellwig (1980)
0 0.2 0.4 0.6 0.8 130
35
40
45
50
55
60
Diversity, ∆
I v
0 0.2 0.4 0.6 0.8 10.045
0.05
0.055
0.06
0.065
0.07
0.075
0.08
0.085
Diversity, ∆
Cost
of C
apita
l(b) Two-Dimensional Economy
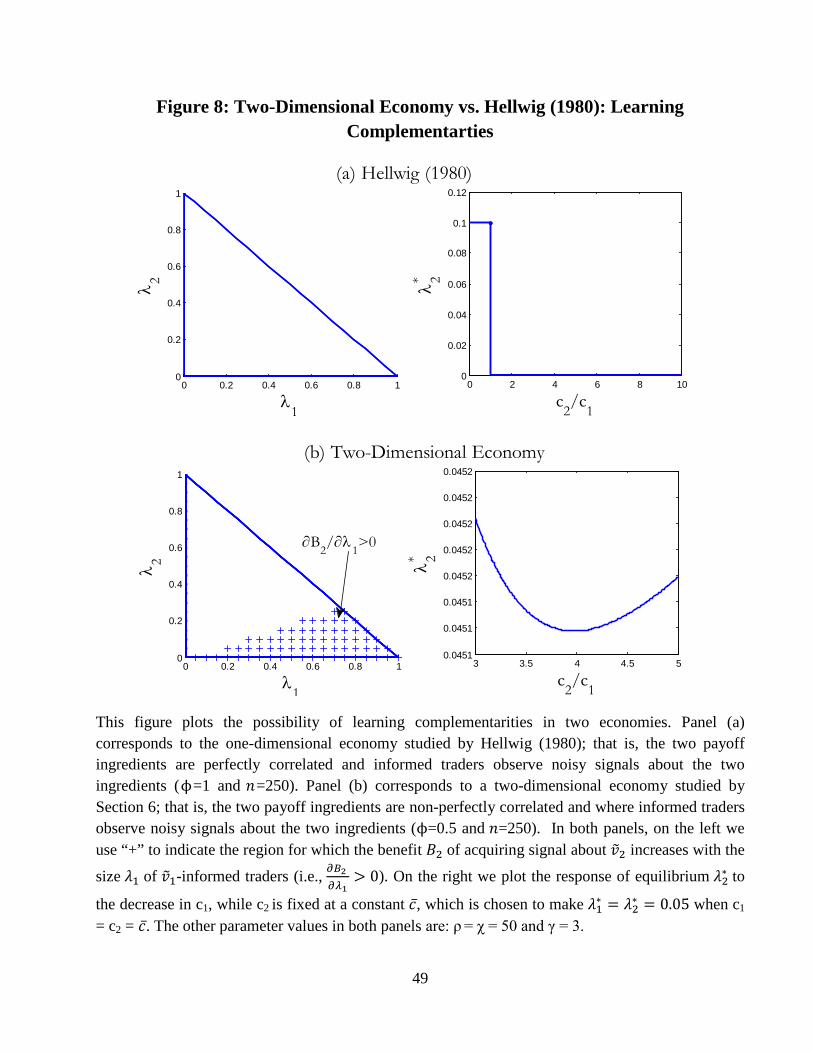
49
Figure 8: Two-Dimensional Economy vs. Hellwig (1980): Learning Complementarties
This figure plots the possibility of learning complementarities in two economies. Panel (a) corresponds to the one-dimensional economy studied by Hellwig (1980); that is, the two payoff ingredients are perfectly correlated and informed traders observe noisy signals about the two ingredients (ϕ=1 and 𝑛=250). Panel (b) corresponds to a two-dimensional economy studied by Section 6; that is, the two payoff ingredients are non-perfectly correlated and where informed traders observe noisy signals about the two ingredients (ϕ=0.5 and 𝑛=250). In both panels, on the left we use “+” to indicate the region for which the benefit 𝐵2 of acquiring signal about 𝑣�2 increases with the
size 𝜆1 of 𝑣�1-informed traders (i.e., 𝜕𝐵2 𝜕𝜆1
> 0). On the right we plot the response of equilibrium 𝜆2∗ to
the decrease in c1, while c2 is fixed at a constant 𝑐, which is chosen to make 𝜆1∗ = 𝜆2∗ = 0.05 when c1
= c2 = 𝑐. The other parameter values in both panels are: ρ = χ = 50 and γ = 3.
0 0.2 0.4 0.6 0.8 10
0.2
0.4
0.6
0.8
1
λ1
λ 2
∂B2/∂λ1>0
3 3.5 4 4.5 50.0451
0.0451
0.0451
0.0452
0.0452
0.0452
0.0452
0.0452
λ* 2
(b) Two-Dimensional Economy
c2/c
1
0 0.2 0.4 0.6 0.8 10
0.2
0.4
0.6
0.8
1
λ1
λ 2
0 2 4 6 8 100
0.02
0.04
0.06
0.08
0.1
0.12
c2/c
1λ* 2
(a) Hellwig (1980)