Embed Size (px)
Citation preview
VISUAL COGNITION, 1995,Z (I), 35-58
Information Encoding in Short Firing Rate Epochs by Single Neurons in the Primate
Temporal Visual Cortex
Martin J. Tovee and Edmund T. Rolls University of Oxford, Oxford, UK.
The information available about face identity from the firing rate and from temporal encoding in the spike train of single neurons recorded in the temporal lobe visual cortical areas of rhesus macaques was analysed using principal component and information theory analyses of smoothed spike trains. The neurons analysed had responses selective for faces. The stimulus set consisted of 20 different faces. The first principal component provided by a considerable extent the most information (57%) available in principal components 1-5, with the second adding 18%, the third 16%. and the fourth and fifth adding 9%. For each image, the weighting on the first principal component was highly correlated with the mean firing rate of the neuron to that image. The information available from the firing rate of the neuron was very close to that available in the first principal component. Information theory analysis showed that in short epochs (e.g. 50 msec) the information available from the firing rate can be as high, on average, as 65% of that available from the firing rate calculated over 400 msec, and 38% of that available from principal components 1-3 in the 400-msec period. It was also found that 30% of the information calculated from the first three principal components is available in the firing rates calculated over epochs as short as 20 msec. More infor- mation was available near the start of the neuronal response, and the information available from short epochs became less later in the neuronal response.
Taken together, these analyses provide evidence that a short period of firing taken close to the start of the neuronal response provides a reasonable proportion
Requests for reprints should be sent to E.T. Rolls, University of Oxford, Department of
Martin J. Tovee is now at the Department of Psychology, University of Newcastle.
This research was supported by Medical Research Council Grant pG8513790 to Dr.
Experimental Psychology, South Parks Road, Oxford, OX1 3UD. UK.
Ridley Building, Newcastle upon v n e , NEl 7RU, UK.
E.T. Rolls.
8 1995 Lawrence Erlbaum Associates Ltd.
Downloaded By: [University of Oxford] At: 13:22 1 May 2011
36 TOVEE AND ROLLS
of the total information that would be available if a long period of neuronal firing (e.g. 400 msec) were utilized to extract it, even if temporal encoding were used. The implications of these and related findings are that at least for rapid object recognition, each cortical stage provides information to the next in a short period of 20-50 msec, does not rely on temporal encoding, and completes sufficient computation to provide an output to the next stage in this same 20- to 50-mscc period.
The inferior temporal cortex of primates contains neurons that appear to be involved in the solution of many percxpmd problems, including the perceptual invariances (see Rolls, 1992, 1994a, b). One population of neurons in the inferior temporal cortex and in the superior temporal sulcus has responses that are selec- tive for faces, in that they respond at least twice as much to the best face stimulus as to the best non-face stimulus (see Bruce, Desimone, & Gross, 1981; Perrett, Rolls, & Caan, 1982; Rolls, 1984, 1992; Tovee, Rolls, Treves, & Bellis, 1993). These neurons in the superior temporal sulcus respond differently to different faces, so that information is present in their responses that would be useful in face identification (Baylis, Rolls, & Leonard, 1985). Each neuron has its own profile of sensitivity to a set of faces, so that sparse ensemble encoding is used (Baylis et al., 1985; Rolls & Treves, 1990).
In the majority of studies in this and other parts of the brain, the measure that has been taken of the response of the neuron is its firing rate. However, it is possible that information about the stimulus present is carried not only by the mean firing rate of the neuron, but also by temporal variations in the spike train of the neuron. In a series of interesting papers, Richmond and Optican (Richmond & Optican, 1987, 1990; Optican & Richmond, 1987) have applied principal component analysis and information theory to the analysis of spike trains produced in single neurons in the primate temporal and striate cortices by different visual stimuli. The general procedure was to smooth the spike train for a single trial with a gaussian filter (with a 0 of 10 msec initially, made adaptive in later papers; see Richmond & Optican, 1990) to produce a spike-density func- tion. The spikedensity function was then sampled every 6 msec over 384 msec starting 20 msec after the onset of the visual stimuli, to produce a 64-point time series for each trial. At least five such time series were collected for each stimu- lus in the stimulus set. From these time series, the principal components were extracted. The principal components are extracted from all individual responses of a neuron to all stimuli. The principal components form an orthogonal basis set and are ordered so that each component accounts for more variance than any subsequent one. The response of a neuron to a particular stimulus can then be fully described as a weighted sum of these principal components. The propor- tion of the variance accounted for by each principal component can be taken as a measure of its importance. In addition, to assess how many of the principal components are significant, a bootstrap randomization technique can be applied (as described under Methods) (Richmond & Optican, 1987).
Downloaded By: [University of Oxford] At: 13:22 1 May 2011
NEURONAL RESPONSES IN PRIMATE TEMPORAL CORTEX 37
Using these techniques, Richmond and Optican showed that several principal components were required to describe the responses of a typical neuron to the different visual stimuli, which consisted of a set of black-and-white patterns based on Walsh functions (see Richmond, Optican, Podell, & Spitzer, 1987). The first principal component was typically correlated with the firing rate of the neuron. The second and higher principal components usually had complex time courses, and Optican and Richmond (1987) therefore suggested that information was contained not only in the magnitude of the firing rate response of a neuron, but also in the temporal pattern with which it fired.
Optican and Richmond (1987) went on to analyse the information contained when this temporal aspect of the encoding was taken into account (cf. Eckhorn & Popel, 1974, 1975) and obtained evidence that approximately 107% more information about the stimulus was available if the temporal pattern of firing of the neuron (as expressed by the first three principal components) to a stimulus over the 384-msec analysis period was taken into account when compared to the information contained only in the firing rate. The information measure they calculated was, for a given cell, the average information gained on a single trial about which member of the set of stimuli had been shown. The following points may help in the interpretation of this measure. (a) If there are eight stimuli, three bits of information are required on each trial to identify which of the equiprob- able stimuli was seen. (b) If a neuron responded to half the stimuli in the set, the information made available on each trial would be one bit. (c) If each neuron conveyed on average 0.5 bits of information about each stimulus in a set of 32 stimuli, then the 5 bits of information could be provided by as few as 10 neurons (in the optimal case of no correlation between the responses of the neurons, which may be approached but not achieved perfectly by neurons in the temporal cortical visual areas).
One potential problem with encoding information in the temporal aspects of the spike trains of neurons is that decoding the information will necessarily take time. Thorpe and Imbert (1989), and Rolls (1991, 1992,1994a, b) have come to the conclusion that, at least for object recognition, there may be as little as 15 msec at each stage of visual cortical processing before useful output is available for the next cortical stage, based on the response latencies of neurons at different stages of cortical visual processing. Rolls et al. (1994) and Rolls and Tovee (1994) have obtained strong evidence for this in a visual backward-masking paradigm, in which it was shown that cortical neurons in the monkey temporal visual cortex fire for as little as 25-30 msec under conditions when humans can just identify which visual stimulus was shown.
Because of this potential problem with temporal encoding, Tovee et al. (1993) performed an investigation of temporal encoding. (1) They showed, consistent with a more recent paper by Optican, Gawne, Richmond, and Joseph (1991), that if a correction (necessary because of the limited number of trials available) was applied to earlier methods of principal component analysis used for neuronal
Downloaded By: [University of Oxford] At: 13:22 1 May 2011
38 TOME AND ROLLS
spike trains, the first principal component provides by a great extent the most infomation, with the second and third adding only small proportions. (2) They found that the first principal component correlated with the firing rate of the neurons, whereas the second could in at least some cases be related to onset response latency differences produced by the different stimuli. (3) They showed that a considerable proportion (60%) of the information available using PCA in a 400-msec period was available in the firing rate of the neuron in the m e period. (4) They showed that periods of the firing rate of as little as 50 or even 20 msec are sufficient to give a reasonable proportion (84.4%) of the informa- tion available from the fving rate calculated over 400 msec.
These findings provide an indication that much of the infomation about which stimulus has been shown can be extracted from a short period of the fving rate of a neuron taken near the start of its response. In the study by Tovee et al. (1!B3), the stimuli were four faces, with five fixation conditions (centre of face, and upper left, upper right, lower left, and lower right), giving 20 stimulus condi- tions in all. Because it was found that the neuronal response latency was 10-15 msec longer if fixation was away from the centre of the face, and that the response latency tended to be reflected in the second principal component (Tovee et al. 1993; Tovee, Rolls, & Azzopardi, 1994) we decided to investigate the issue further by utilizing a set of stimuli with fixation on only the centre of the face. We expected that this might reduce even further the small advantage gained by including the second (and higher) principal components in the infix- mation analysis. At the same time, in the experiment described here, we took the opportunity to increase the number of face stimuli in the set to 20, to provide a full opportunity for temporal encoding to be used to encode the stimulus set. (If 20 stimuli are used, then more principal components might be needed to encode the temporal variation in the spike train than with fewer stimuli.)
This investigation is one of a series (Rolls, 1992) designed to investigate the normal functions of the temporal lobe visual cortical areas, and how damage to these brain regions may underlie the perceptual deficits found in patients with damage to these and related regions.
METHOD Recording Techniques
The activity of single neurons was recorded with glass-insulated tungsten microelectrodes (after Merrill & Ainsworth, 1972, but without the platinum plating) in 2 alert macaque monkeys (Macaca mulatta, weight 3.0 kg) seated in a primate chair using techniques that have been described previously (Rolls, Burton, & Mom, 1976; Rolls, Yaxley, & Sienkiewicz, 1990). All procedures, including preparative and subsequent ones, were carried out in sccordance wirh the Policy Regarding the Care and Use of Animals approved by the Society for
Downloaded By: [University of Oxford] At: 13:22 1 May 2011
NEURONAL RESPONSES IN PRIMATE TEMPORAL CORTEX 39
Neuroscience and were licensed under the UK Animals (Scientific Procedures) Act 1986. The action potentials of single cells were amplified using techniques described previously (Rolls, Sanghera, & Roper-Hall, 1979), were converted into digital pulses using the trigger circuit: of an oscilloscope, and were analysed on-line using a MicroVaxII computer. The computer collected peristimulus rastergrams of neuronal activity for each trial and displayed, printed, and stored each trial, as well as computing the peristimulus time histogram by summing trials of a given type. Eye position was measured to an accuracy of 0.5" with the search coil technique, and fixation of the visual stimuli was ensured by use of a blink version of a visual fixation task in which the fixation spot was blinked off 100 msec before the test stimulus appeared. The duration of the test stimuli was 500 msec. After this, the fixation spot reappeared, and when it dimmed after a further random period, the monkey could lick to obtain fruit juice. The stimuli were static visual stimuli subtending 13.5' in the visual field presented on a video monitor at a distance of 1.0 m. The fixation spot position was at the centre of the screen.
X-Radiographs were used to locate the position of the microelectrode on each recording track relative to permanently implanted reference electrodes and bony landmarks. The position of cells was then reconstructed from the X-ray co- ordinates taken together with serial 50p histological sections, which showed the reference electrodes and micro-lesions made at the end of some of the micro- electrode tracks (Feigenbaum & Rolls, 1991).
Stimulus Presentation
Visual stimuli were stored in digital form on a computer disk and displayed on a monochrome video monitor using a video framestore (Imaging Technology OFG). The resolution of these images was 256 wide X 256 high, with 256 gray levels. The monitor provided maximum and minimum luminances of 292 and 11 cum*, respectively, and was adjusted internally and by use of a lookup table for linearity to within 3% using a photometer. The computer randomized the order of presentation of these stimuli, switched the stimuli on and off for each trial, and synchronized its data collection so that the stimulus was turned on at the start of the 21st bin of the peristimulus time histogram.
When digitized visual stimuli were being presented on the video monitor, one set of 4-12 visual stimuli was used at a time. Each set of stimuli was designed to provide neuronal response data relevant to one or several hypotheses. For example, one set included 5 different faces, to test whether the neuron responded differently to different faces, and some non-face stimuli such as a sine wave grating, a boundary curvature descriptor, and a complex visual image (see Baylis et al., 1985, Fig. l), to provide an indication of whether the neuron responded differently to face and to non-face stimuli. Another set consisted of the 20 face stimuli used in this experiment. The computer randomized the sequence in
Downloaded By: [University of Oxford] At: 13:22 1 May 2011
40 TOVEE AND ROLLS
which the members of the set were presented, and after it had presented the sequence once, it restarted the set with another random sequence. The computer was allowed to repeat the set 8-12 times in order to provide sufficient data for an analysis of variance so as to determine whether the neuron responded differ- ently to the different stimuli within the set, and for the principal component and information analysis.
Procedure
As tracks were made into the cortex in the anterior part of the superior temporal sulcus, the responses of each neuron were measured to a standard digi- tized set of stimuli of different faces and of non-face stimuli (Baylis et al., 1985). If a neuron responded to one or more of the faces, but to none of the non-face stimuli in the set, then a wide range of digitized and real 3D non-face stimuli were shown, to determine whether the response of the neuron was selective for faces. The criterion was that the response to the optimal face stimulus should be more than twice as large as to the optimal non-face stimulus. (In fact, the majority of the neurons in the cortex in the superior temporal sulcus classified as showing responses selective for faces responded much more specifically than this. For half these neurons, their response to the most effective face was more than five times as large as to the most effective non-face stimulus, and for 25% of these neurons, the ratio was greater than 10: 1. These ratios show that although they respond preferentially to faces, these neurons do not have absolute speci- ficity for faces. Further information on and discussion of the extent to which these neurons have selective responses is given by Baylis et al. (1985). The non- face stimuli from which the optimal was chosen included sine-wave gratings, boundary curvature descriptors, complex 2D stimuli, and complex 3D objects, as described above. If the neuron satisfied the criterion, then a series of 20 face stimuli, which included very effective to non-effective stimuli for that neuron, was presented in random sequence in the blink task, and then the set was repeated in a new random sequence for a further 8-12 repetitions of the set, to obtain data to allow the responses to each member of the set of stimuli to be analysed. The face stimuli were monkey or human, usually in frontal view, but in two cases in profile view.
Data analysis
The principles of the data analysis were similar to those developed by Richmond and Optican (1987) and Optican and Richmond (1987), except that we applied a correction procedure for the limited number of trials similar to but not identical to that developed by Optican et al. (1991), in a way made. clear below and used by Tovee et al. (1993). A novel aspect of our data analysis is that we investigated how much information was available in short epochs of the spike train.
Downloaded By: [University of Oxford] At: 13:22 1 May 2011
NEURONAL RESPONSES IN PRIMATE TEMPORAL CORTEX 41
Representation of Neural Responses. The raw data, expressed as the post- stimulus occurrence times of individual spikes, recorded with 1 -msec resolution, was smoothed by convolution with a Gaussian kernel with a u of 5 msec (corres- ponding to low pass filtering with -3dB cutoff at 240 Hz). The smoothed data were then quantized, for some of the analyses, into bins of width 10 msec. As a result, the numbers of spikes in each bin i, giving the components xi of a multi- dimensional response vector, were real rather than integers.
Extraction of the Principal Components ofthe Variance. In order to analyse the temporal course of the response, a certain number B of consecutive bins (typically B = 40) were selected to form a basis in the space of response vectors. In most cases, we chose the bins to cover either of the two post-stimulus time periods 0-400 msec or 150-550 msec. Labelling the bins with the subscript i (e.g. i = 1,40), the response vector during a particular trial k is denoted as xk;. The covariance matrix of the responses recorded from a particular cell is
where N is the total number of trials for that cell, and xi is the average number of spikes, over those N trials, falling in bin i. Eigenvalues and eigenvectors of the covariance matrix were extracted using a standard algorithm. The eigenvec- tors, labelled I = 1, . . . , B in order of decreasing eigenvalue, form a new basis for the response space. Each subtracted response vector (i.e. with the average response vector subtracted out) is now expressed in this new basis via multi- plication by the appropriate orthogonal matrix. The resulting coefficients cki (sometimes called the Karhunen-Loeve transform of the vector, $i -3) are uncorrelated, in the sense that their covariance matrix is, by construction, diag- onal. Note that although the eigenvectors of Cu, the principal components, are normalized to unit length, they are plotted in the Figures after multiplication by the square root of the corresponding eigenvalue, in order to bring out their rela- tive contribution to the variance.
cij = Ck (Xk; -?;)($j -%)IN
Means and Statistical Significance of the Coeficients. The coefficients Cki
were then averaged over the trials with the same stimulus. (Stimulus refers here to one experimental stimulus condition. The number of experimental conditions in these experiments was the number of stimuli, i.e. 20 different faces.) The means csi represent the loading of stimulus s on component i , and their statistical significance can be tested using the bootstrap method (Richmond & Optican, 1987). A scrambled stimulus-response pairing is obtained by assigning random selections of actually recorded responses to new stimulus labels, while main- taining the same number of trials of each stimulus as in the authentic pairing. The coefficients C'j are then calculated for each pseudo-stimulus label, with the number of labels high enough that the distribution of coefficients approaches, for each component, a continuous distribution (we used a hundred times as many
Downloaded By: [University of Oxford] At: 13:22 1 May 2011
42 TOVEE AND ROLLS
labels for the bootstrap distribution as experimental stimuli). The statistical significance of the original csi can now be tested against the null hypothesis distribution that the relationship between stimulus and response be purely random. We note that if there are 40 coefficients, then the response space is 40- dimensional. However, given that there were 20 stimulus conditions, if there were no noise, (i.e. the response were uniquely determined by the stimulus), we would expect no more than 19 components to be significant.
Raw Informution Measures. If S denotes the set of all stimuli s, and R the set of responses, the average information contained in the responses of a particular cell about that set of stimuli is defined as
where P is the probability of Occurrence of a particular event. In evaluating the information content from the data recorded, we consider different definitions of the response set. In one case, responses are simply quantified by the number of spikes within a preset time period (a unidimensional measure). In another case, we consider a multidimensional response space spanning the first Q (typically Q = 1,2, or 3) of the principal components extracted with the algorithm above. If, for example, 3 principal components are included, the particular response relative to trial k isdefined as the triplet (&I, c%, &). Although the set of stimuli can be discrete (it is in the present experiment), R is generally a continuum (in the second case, a Q-dimensional vector) space. As in practice one has to evalu- ate the expression for I by performing a sum rather than an integral, R needs to be quantized. We perform this second quantitization following a procedure similar to the first. Consider first the spike count case. The original data are represented by the number of spikes nk recorded in trial k within the prescribed window, minus the average over all trials. The range of the data is set as ( -An , An), with A n the largest between the maximum and absolute value of the minimum recorded for that cell. This range is divided into a preselected number D of bins (we ultimately used D = 15). 0 - 2 bins have width dn = 2An/(D-3), with the second bin centred around - An, the third shifted by dn, and so on. The first and last bins cover the two semi-infinite intervals at the extremes. Considering now only the trials relative to a given stimulus s, a smoothing procedure is applied by convolving the individual values n with a Gaussian kernel of width the standard deviation a&) of the values relative to the same stimulus. The result, normalized by dividing by the total number of trials, is quantized into the bins defined above, the area within each bin being used as an estimate of the joint probability P(s,r), where r corresponds to one of the response bins. Summing over all stimuli gives P(r) = C s ~ s P(s,r). In the case, instead, of the information contained in the Q principal components, the original data are represented by the Q-dimensional set of coefficients &. Note that the
Downloaded By: [University of Oxford] At: 13:22 1 May 2011
NEURONAL RESPONSES IN PRIMATE TEMPORAL CORTEX 43
average response ha.. already been subtracted out. One repeats the same proced- ure Q times in order to find the ranges spanned by the coefficients for each component, divides the ranges into bins, smooths the distribution of values recorded for each stimulus, and find P(:s,r). Each of the Dp bins of the response space is now the product of independently determined bins for each of the Q components, and the relative probability is obtained by multiplying the estim- ated probabilities of the response falling into each unidimensional interval. As noted by Optican and Richmond (1987), it would be preferable to estimate P(s,r) by using the more time-consuming procedure of recalculating separate principal components for each stimulus, because these are in general different from those calculated over the whole stimulus set. However, this simplification in the construction of the estimator P(s,r) is of minor import when compared to the distortions produced by limited sampling (see below).
Subtracted Znfonnation Measures. The procedure introduced so far for estimating the probability P(s,r) of a particular response is rather simple. Slightly more sophisticated estimators can be used (see Fukunaga, 1972; Optican & Richmond, 1987), which attempt to take into account the limited number of trials available, in practice, for each stimulus. Ultimately, however, the fact that the probability distribution for each response is extracted from a small sample remains a problem, which cannot be solved by adjusting the kernel used for smoothing, nor by a clever quantization into bins. This can be seen by using again a bootstrap procedure similar to the one used to test the significance of principal component coefficients (Optican et al., 1991). One generates a scrambled stimulus-response pairing, with the number of pseudo-stimulus labels now equal to the number of real stimuli, and calculates the information l a contained in the responses about their randomly paired pseudostimuli. l o should be zero, whereas it turns out, in practice, to be of the same order as the original I. This is because the use of probability distributions based on a limited number of trials for each stimulus unavoidably biases upwards an information estimate, by producing random fluctuations in the distributions of responses to different stimuli, which are then picked up by the information measure as being related to the stimuli.
The most straightforward remedy is to subtract 10 from Z, to obtain a measure Is = Z - I0 which averages zero, even for small samples, in the absence of a stimulus-response causal relationship. This is one of the simplest of several correction procedures for sampling bias in information estimates that have been reported in the literature (see Optican et al., 1991, and references therein). It should be noted that only few of these procedures are applicable to data for which the a priori distribution is unknown, and that the relative validity of different methods is strongly dependent on the data distribution itself (MacRae, 1971). The latter of these considerations, especially, makes us tend to prefer the simplest and most conservative procedure (i.e. Is = I - 10) (see further Treves
Downloaded By: [University of Oxford] At: 13:22 1 May 2011
44 TOVEE AND ROLLS
& Panzeri, 1995), rather than the one that consists in subtracting, instead of the “fraction of spurious information”, its square, i.e. I,’ = I [ Z - (Zdw], as proposed by Optican et al. (1991). We note that subtraction of the squiue (which is obviously less than the fraction itself) leaves an estimate Zsl often closer to Z than to Is. Optican et al. (1991) argue in favour of subtracting the square on the basis of computer simulations (and data from two cells in the striate cortex), which Seem to indicate a faster convergence to the asymptotic “correct” value. We note, however, that those computer simulations, based on different distribu- tions than the unknown ones characterizing real data, could lead to inappropriate conclusions with small sample sizes (i.e. numbers of trials), althou~@ of course both correction procedures approach the same asymptotic correct value as the sample size increases. We note that because the upward bias of I increases with the dimensionality of the response space, the use of some subtracted estimate is particularly important when calculating the information contained in the first Q principal components, with Q > 1.
Because on the basis of the above points it was not clear which correction procedure should be used, we specifically investigated which correction proced- ure may be most appropriate for data obtained from real neurons (Tovee et al., 1993, Fig. 1.). Use of the correction procedure Is = Z - lo (which we term Correction Procedure 2 for reference), tended to underestimate the information when there are few (3-10) presentations of each stimulus, but was more likely to be accurate with 1 5 4 0 presentations of each stimulus. in contrast, the measure I: = I [ I - (ldl)*] (which we will refer to as Correction l), underestim- ated less than Correction 2 with small numbers of presentations of each stimulus (3-7), but did provide somewhat of an overestimate of the information about the stimulus for all other numbers of stimulus presentations in the range 1040. In the light of these findings, we present the data later with the results calculated with both corrections, knowing that Correction 2 is more conservative. Correction 1 does allow comparison with other data (Optican et al., 1991), but it must be borne in mind that use of this correction may tend to over- emphasize the proportion of information available in principal components higher than 1.
It should be noted, finally, that an information estimate based on a quantized response set tends to grow with the size DQ of the set for D small, until it satur- ates once the width of the D bins along each dimension becomes negligible with respect to the standard deviation of the relative coefficients for each stimulus. We used D = 15 (similar to the value of 12 used by Optican & Richmond, 1987) after checking that no marked increase in Is resulted from using larger D values.
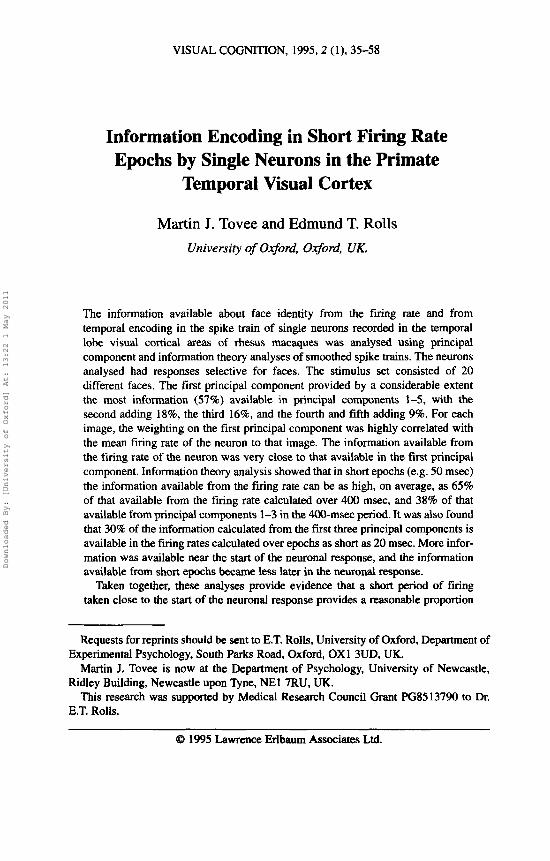
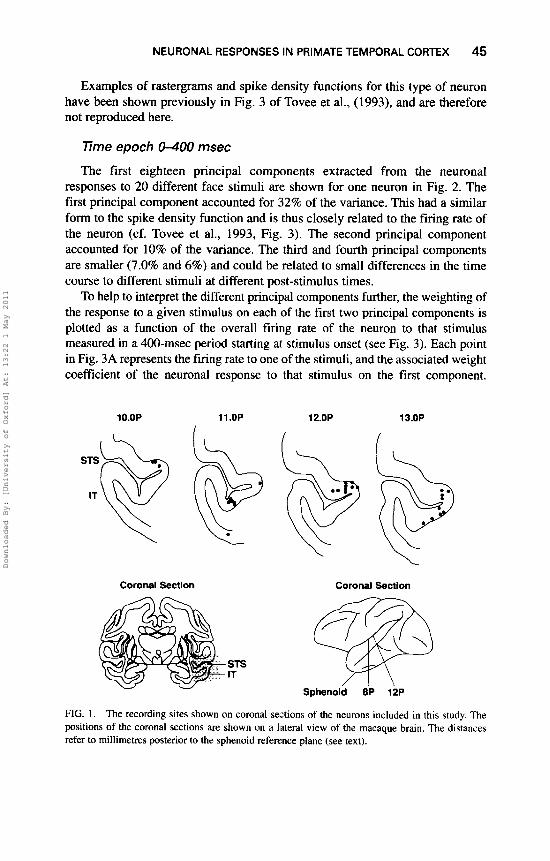
Results It was possible to complete the analyses for 15 neurons recorded in two monkeys. The neurons were in the cortex in the anterior part of the superior temporal sulcus or in the inferior temporal visual cortex (see Fig. 1).
Downloaded By: [University of Oxford] At: 13:22 1 May 2011
NEURONAL RESPONSES IN PRIMATE TEMPORAL CORTEX 45
Examples of rastergrams and spike density functions for this type of neuron have been shown previously in Fig. 3 of Tovee et al., (1993), and are therefore not reproduced here.
Time epoch M U 0 msec
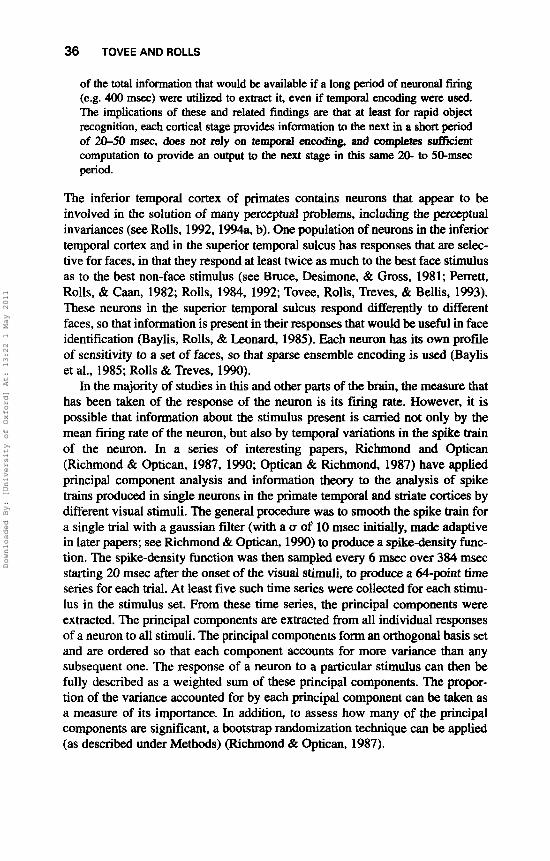
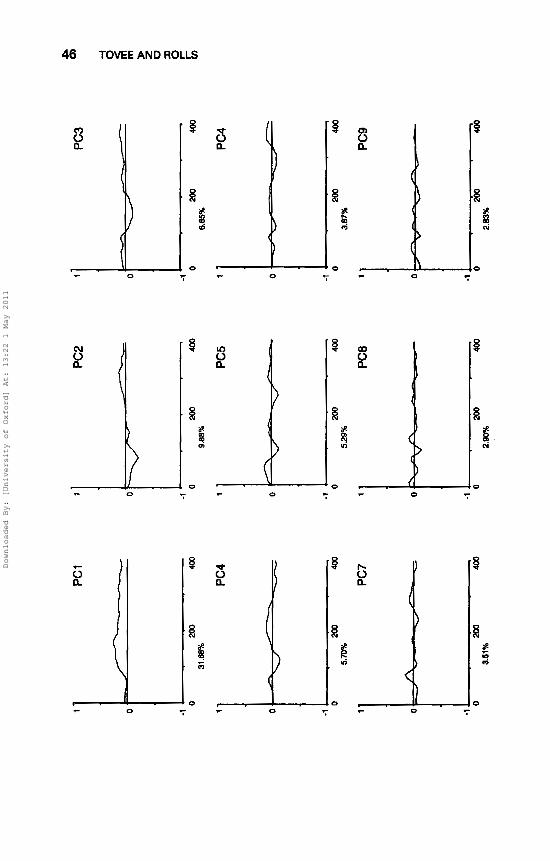
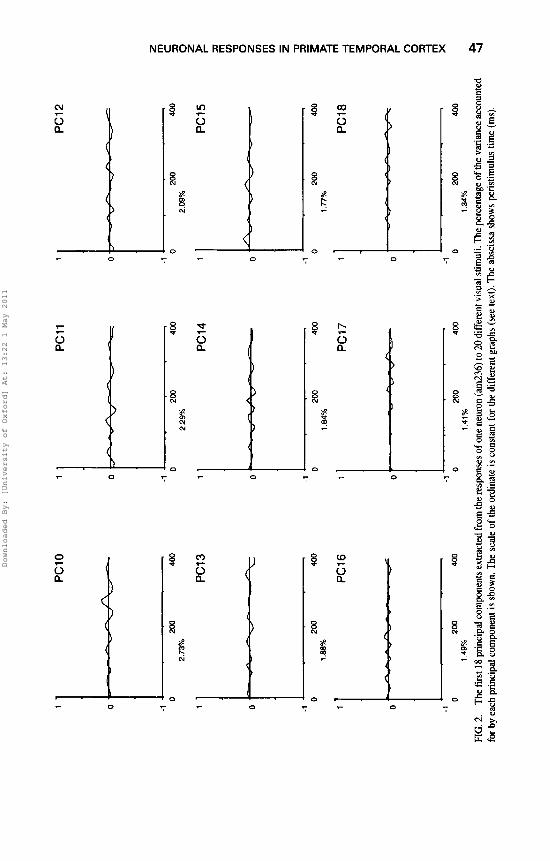
The first eighteen principal components extracted from the neuronal responses to 20 different face stimuli are shown for one neuron in Fig. 2. The first principal component accounted for 32% of the variance. This had a similar form to the spike density function and is thus closely related to the firing rate of the neuron (cf. Tovee et al., 1993, Fig. 3). The second principal component accounted for 10% of the variance. The third and fourth principal components are smaller (7.0% and 6%) and could be related to small differences in the time course to different stimuli at different post-stimulus times.
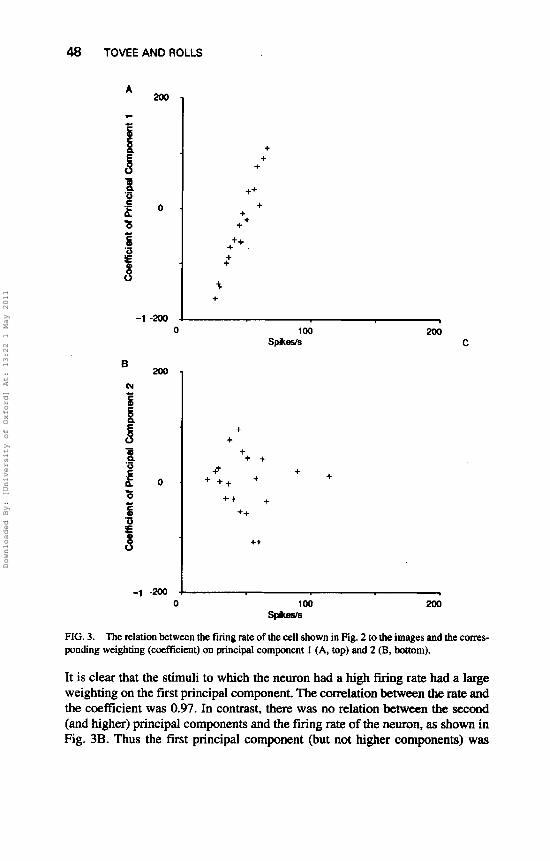
To help to interpret the different principal components further, the weighting of the response to a given stimulus on each of the first two principal components is plotted as a function of the overall firing rate of the neuron to that stimulus measured in a 400-msec period starting at stimulus onset (see Fig. 3). Each point in Fig. 3A represents the firing rate to one of the stimuli, and the associated weight coefficient of the neuronal response to that stimulus on the firit component.
1Q.OP
s::Q
ll .0P 12.0P 13.QP
Coronal Section Coronal Section
STS IT
Sphenold 8P 12P
FIG. 1. The recording sites shown on coronal sections of the neurons included in this study. The positions of the coronal sections are shown on a lateral view of the macaque brain. The distances refer to millimetres posterior to the sphenoid reference plane (see text).
Downloaded By: [University of Oxford] At: 13:22 1 May 2011
46 TOVEE AND ROLLS
B
Downloaded By: [University of Oxford] At: 13:22 1 May 2011
PC
IO
'1 1 P
C16
1
PC
17
1
0-- - /-- -
0'
-
- -
w-
-
,.A
-
r
- ,-.
0
-1 0
200
400
2.73
%
PC
13
rri 4 5
^^
A
-
B F
pcia
--
-
-
4
'I II
PC11
P
C12
1
z 2 C
n
-1
0 20
0 40
0 0
200
400
-1
2.29
%
2.09%
'1
PC
14
lI
P
C15
F
-1 1
0 m
40
0 1.
88%
71 2
-1 0
200
400
-1 1
0 2M
) 40
0
2 1 .+I%
1.
77%
0 20
0 40
0 0
m
400
0 m
40
0 1.
49%
1.
41%
1.
34%
FIG. 2.
Th
e fir
st 18
prin
cipal
com
pone
nts e
xtra
cted
from
the r
espo
nses
of o
ne n
euro
n (a
m23
6) to
20
diffe
rent
visu
al st
imul
i. 7h
e per
cent
age o
f the
var
ianc
e acc
ount
ed
for
by e
ach
prin
cipal
com
pone
nt is
show
n. T
he s
cale
of th
e or
dina
te is
cons
tant
for
the
diffe
rent
grap
hs (s
ee te
xt).
The
absc
issa
show
s pen
stim
ulus
tim
e (m
s).
3
Downloaded By: [University of Oxford] At: 13:22 1 May 2011
48 TOVEE AND ROLLS
-1 -200 Q
200 (Y
E
d
+ + +
++ + +
++
2' 2
% +
+
++ + +
++
2' 2
% +
100 spikes&
i +
+ + + + + fl
+ + + +
++ + ++
+t
200 C
-1 -200 I 0 100 200
spikesls
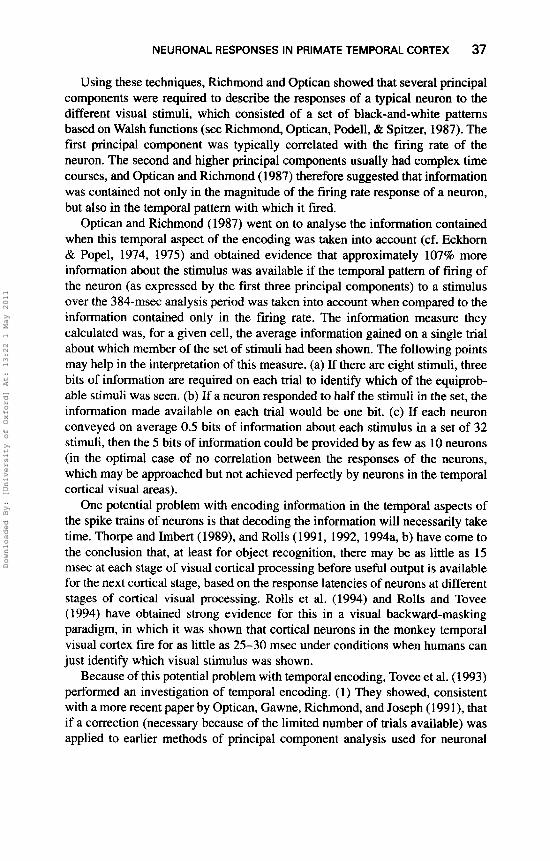
FIG. 3. The relation between the firing rate of the cell shown in Fig. 2 to the images and the corres- ponding weighting (cceficient) on principal component 1 (A, top) and 2 (B, bottom).
It is clear that the stimuli to which the neuron had a high firing rate had a large weighting on the first principal component. The correlation betweem the rate and the coefficient was 0.97. In contrast, there was no relation between the second (and higher) principal components and the firing rate of the neuron, as shown in Fig. 3B. Thus the first principal component (but not higher components) was
Downloaded By: [University of Oxford] At: 13:22 1 May 2011
NEURONAL RESPONSES IN PRIMATE TEMPORAL CORTEX 49
related to the rate of firing of the neuron, as suggested above, and as also found by Richmond and Optican (1987) and Tovee et al. (1993). Similar analyses were performed for the other cells recorded, and the results for all cells showed a high correlation between the firing rate and principal component 1 only.
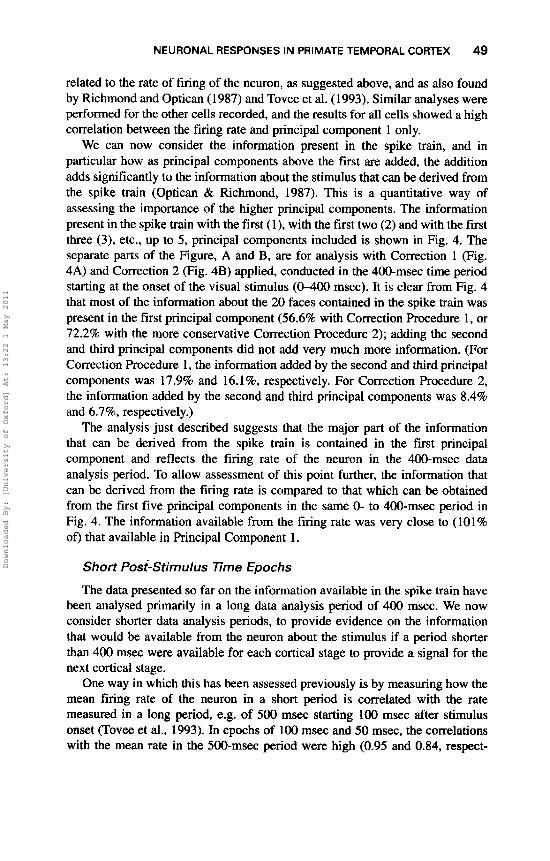
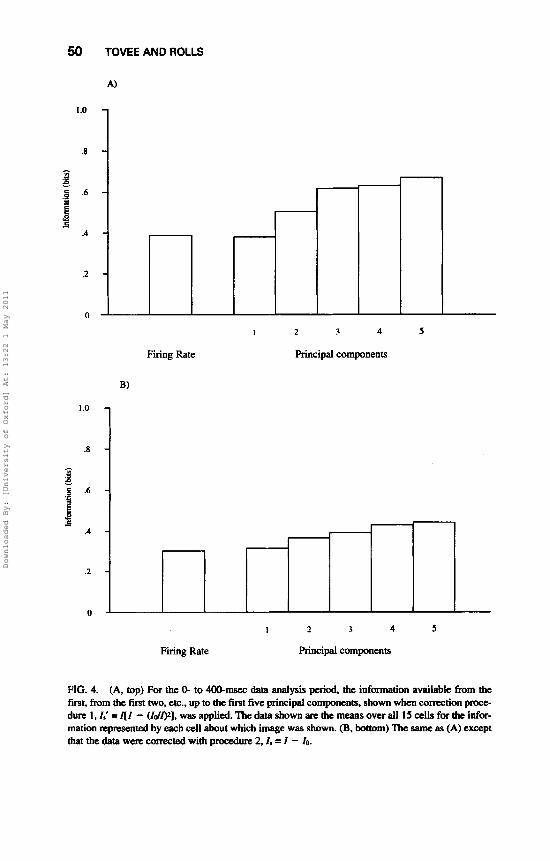
We can now consider the information present in the spike train, and in particular how as principal components above the first are added, the addition adds significantly to the information about the stimulus that can be derived from the spike train (Optican & Richmond, 1987). This is a quantitative way of assessing the importance of the higher principal components. The information present in the spike train with the first (l) , with the first two (2) and with the first three (3), etc., up to 5 , principal components included is shown in Fig. 4. The separate parts of the Figure, A and B, are for analysis with Correction 1 (Fig. 4A) and Correction 2 (Fig. 4B) applied, conducted in the 400-msec time period starting at the onset of the visual stimulus (0-400 msec). It is clear from Fig. 4 that most of the information about the 20 faces contained in the spike train was present in the first principal component (56.6% with Correction Fkcedure 1, or 72.2% with the more conservative Correction Procedure 2); adding the second and third principal components did not add very much more information. (For Correction Procedure 1 , the information added by the second and third principal components was 17.9% and 16.1%, respectively. For Correction Procedure 2, the information added by the second and third principal components was 8.4% and 6.7%, respectively.)
The analysis just described suggests that the major part of the information that can be derived from the spike train is contained in the first principal component and reflects the firing rate of the neuron in the 400-msec data analysis period. To allow assessment of this point further, the information that can be derived from the firing rate is compared to that which can be obtained from the first five principal components in the same 0- to 400-msec period in Fig. 4. The information available from the firing rate was very close to (101% of) that available in Principal Component 1.
Short Post-Stimulus Time Epochs
The data presented so far on the information available in the spike train have been analysed primarily in a long data analysis period of 400 msec. We now consider shorter data analysis periods, to provide evidence on the information that would be available from the neuron about the stimulus if a period shorter than 400 msec were available for each cortical stage to provide a signal for the next cortical stage.
One way in which this has been assessed previously is by measuring how the mean firing rate of the neuron in a short period is correlated with the rate measured in a long period, e.g. of 500 msec starting 1 0 0 msec after stimulus onset (Tovee et al., 1993). In epochs of 1 0 0 msec and 50 msec, the correlations with the mean rate in the SWmsec period were high (0.95 and 0.84, respect-
Downloaded By: [University of Oxford] At: 13:22 1 May 2011
50 TOME AND ROLLS
1.0 -
.8 - - 3 a .5 -
3 .4 -
1
I
Firing Rate
1 2 3
I 4 5
principal components
FIG. 4. (A, top) F a the 0- to 400-msec data analysis period, the information available from the first, from the first two, etc., up to the first five principal components, shown when conation pmce- durc 1, I,' = I [ I - (Id@], was applied. The data shown are the means over all 15 cells for the infur- mation represented by each cell about which image was shown. (B, bottom) Thc same as (A) except that the data were corrected with procedure 2. I . = I - 10.
Downloaded By: [University of Oxford] At: 13:22 1 May 2011
NEURONAL RESPONSES IN PRIMATE TEMPORAL CORTEX 51
ively). The correlation was lower, though still very significant, when the response was measured over a period of 20 msec. These data show that the firing rate remains stable throughout the 400-msec data analysis period. TO show quantitatively how much information is present in periods of different durations taken at different times after the stimulus onset, we calculated the information available from the firing rate in short periods as described under Methods. (It should be noted that for these short response periods, the information must be based on firing rates in the periods, or on principal component analysis utilizing many fewer than the 40 time bins used in the previous analysis. It is useful to understand that the reason for this is that 40 principal components of a time- varying spike train simply cannot be extracted, and are essentially meaningless, if the spike train is short, because only one or a few time samples would be effec- tively available as a result of the necessary temporal smoothing required to extract the time series; cf. Richmond & Optican, 1987. The results are shown in Figs. 5 and 6. The information based on rates in the 0- to 400-msec period is included to show what is available with a long analysis time. In all cases, the data shown in Figs. 5 and 6 are the means over the whole population of 15 cells analysed, and are not just for one cell, so that they give a fair indication of the properties of this population of cells.
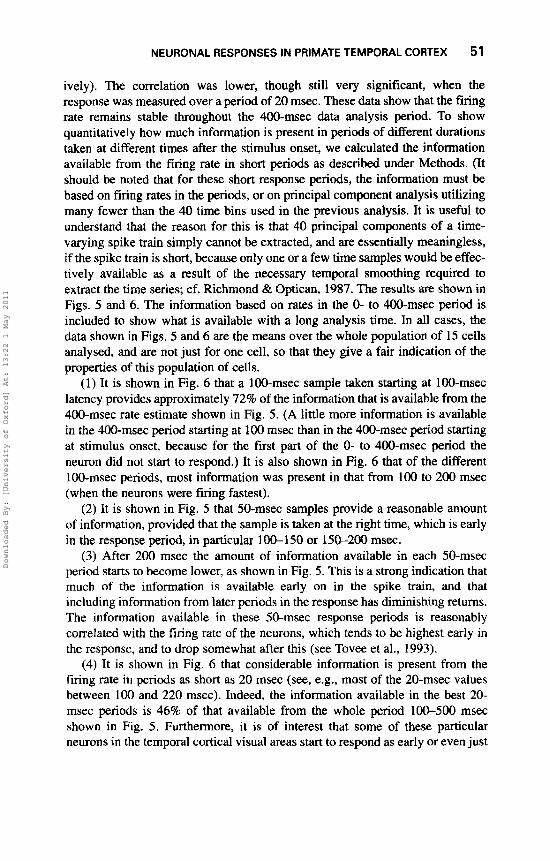
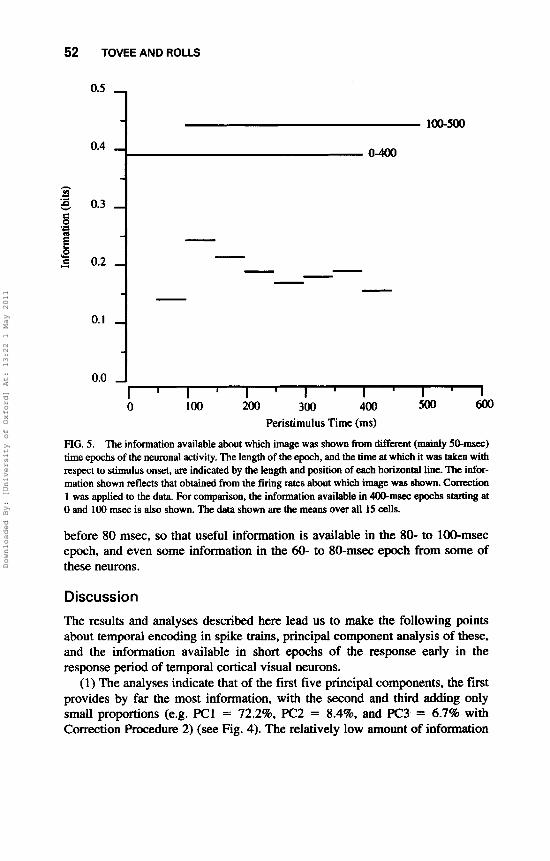
(1) It is shown in Fig. 6 that a 100-msec sample taken starting at 100-msec latency provides approximately 72% of the information that is available from the 400-msec rate estimate shown in Fig. 5. (A little more information is available in the 400-msec period starting at 100 msec than in the 400-msec period starting at stimulus onset, because for the first part of the 0- to 400-msec period the neuron did not start to respond.) It is also shown in Fig. 6 that of the different 100-msec periods, most information was present in that from 100 to 200 msec (when the neurons were firing fastest).
(2) It is shown in Fig. 5 that 50-msec samples provide a reasonable amount of information, provided that the sample is taken at the right time, which is early in the response period, in particular 100-150 or 150-200 msec.
(3) After 200 msec the amount of information available in each 50-msec period starts to become lower, as shown in Fig. 5. This is a strong indication that much of the information is available early on in the spike train, and that including information from later periods in the response has diminishing returns. The information available in these 50-msec response periods is reasonably correlated with the firing rate of the neurons, which tends to be highest early in the response, and to drop somewhat after this (see Tovee et al., 1993).
(4) It is shown in Fig. 6 that considerable information is present from the firing rate in periods as short as 20 msec (see, e.g., most of the 20-msec values between 100 and 220 msec). Indeed, the information available in the best 20- msec periods is 46% of that available from the whole period 100-500 msec shown in Fig. 5. Furthermore, it is of interest that some of these particular neurons in the temporal cortical visual areas start to respond as early or even just
Downloaded By: [University of Oxford] At: 13:22 1 May 2011
TOVEE AND ROLLS
- - - - - - - - - - d
0.5
0.4
0.3
0.2
0. I
0.0
100-500
0-400
-
I I I I I
FIG. 5. The information available about which image was shown from dif€erent (mainly 5o-mSeC) time epochs of the neuronal activity. The length of the epoch, and the time at which it was taken with respect to stimulus onset, are indicated by the length and position of each horizontal line. 'Ihe infor- mation shown reflects that obtained from the firing rates about which image was shown. Correction 1 was applied to the data. For comparison, the infomation available in 4Oo-msec epochs statting at 0 and 100 msec is also shown. The data shown are the means over all 15 cells.
before 80 msec, so that useful information is available in the 80- to 100-msec epoch, and even some information in the 60- to 80-msec epoch from some of these neurons.
Discussion The results and analyses described here lead us to make the following points about temporal encoding in spike trains, principal component analysis of these, and the information available in short epochs of the response early in the response period of temporal cortical visual neurons.
(1) The analyses indicate that of the first five principal components. the first provides by far the most information, with the second and third adding only small proportions (e.g. PCI = 72.2%, PC2 = 8.4%. and PC3 = 6.7% with Correction Procedure 2) (see Fig. 4). The relatively low amount of information
Downloaded By: [University of Oxford] At: 13:22 1 May 2011
NEURONAL RESPONSES IN PRIMATE TEMPORAL CORTEX 53
1 0.0-I -
I I I I 1 ' 1 0 100 200 300 400 500 600
Peristilnulus Time (ms) FIG. 6. As for Fig. 5, except that the information available from 100-msec and 20-msec epochs is shown.
provided by the second and higher principal components compared to some earlier analyses of Optican and Richmond (1987) is due in part to the use of a correction for limited sampling, the general form of which has been noted to be required by Optican el al. (1991). Our findings are thus consistent with those of Optican and Ricmond (1987) and Optican et al. (1991) in that we confm that there is information contained in more than the first principal component. However, our finding is that with the correction applied, relatively small propor- tions of information are provided by the second and third principal components (cf. Optican et al., 1991; Eskandar, Richmond, & Optican, 1992). It is worth noting that even the use of Correction 1 will tend to overemphasize the contri- bution of PC analysis compared to firing rate analysis (see Fig. 4A), relative to the more conservative Correction 2 (see Fig. 4B).
This conclusion extends as follows the findings of Tovee et al. ( I 993), who used four face stimuli and five fixation positions, located at the centre and at the upper left, upper right, lower left, and lower right of the face. (a) In that study, as only four different faces were used as stimuli, few principal components differently organized in time of the spike trains might have been used to encode the different stimuli. In the present study, 20 different face stimuli were used, and yet most of the information about which stimulus had been shown was still related to the first principal component, and relatively little information about the identity of the faces was contained in the higher principal components. (b) In
Downloaded By: [University of Oxford] At: 13:22 1 May 2011
54 TOVEE AND ROLLS
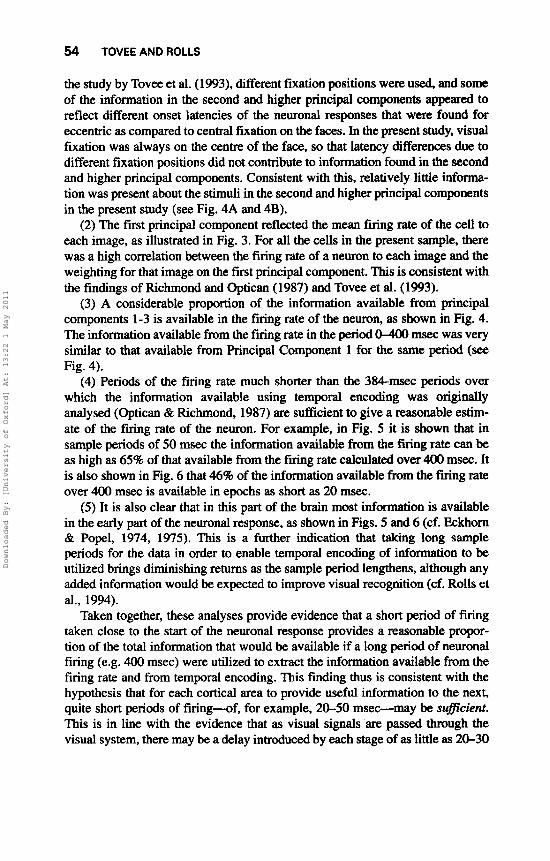
the study by Tovee et al. (1993), different fixation positions were used, and some of the information in the second and higher principal components appeared to reflect different onset latencies of the neuronal responses that were found for eccentric as compared to central fixation on the faces. In the present study, visual fixation was always on the centre of the face, so that latency differences due to different fixation positions did not contribute to information found in the second and higher principal components. Consistent with this, relatively little informa- tion was present about the stimuli in the second and higher principal components in the present study (see Fig. 4A and 4B).
(2) The first principal component reflected the mean firng rate of the cell to each image, as illustrated in Fig. 3. For all the cells in the present sample, there was a high correlation between the firing rate of a neuron to each image and the weighting for that image on the first principal component. This is consistent with the findings of Richmond and Optican (1987) and Tovee et al. (1993).
(3) A considerable proportion of the information available from principal components 1-3 is available in the firing rate of the neuron, as shown in Fig. 4. The information available from the firing rate in the period O-400 msec was very similar to that available from Principal Component 1 for the same period (see Fig. 4).
(4) Periods of the firing rate much shorter than the 384-msec periods over which the information available using temporal encoding was originally analysed (Optican & Richmond, 1987) are sufficient to give a reasonable estim- ate of the firing rate of the neuron. For example, in Fig. 5 it is shown that in sample periods of 50 msec the information available from the firing rate can be as high as 65% of that available from the firing rate calculated over 400 msec. It is also shown in Fig. 6 that 46% of the information available from the firing rate over 400 mSec is available in epochs as short as 20 msec.
(5) It is also clear that in this part of the brain most information is available in the early part of the neuronal response, as shown in Figs. 5 and 6 (cf. Eckhom & Popel, 1974, 1975). This is a further indication that taking long sample periods for the data in order to enable temporal encoding of information to be utilized brings diminishing returns as the sample period lengthens, although any added information would be expected to improve visual recognition (cf. Rolls et al., 1994).
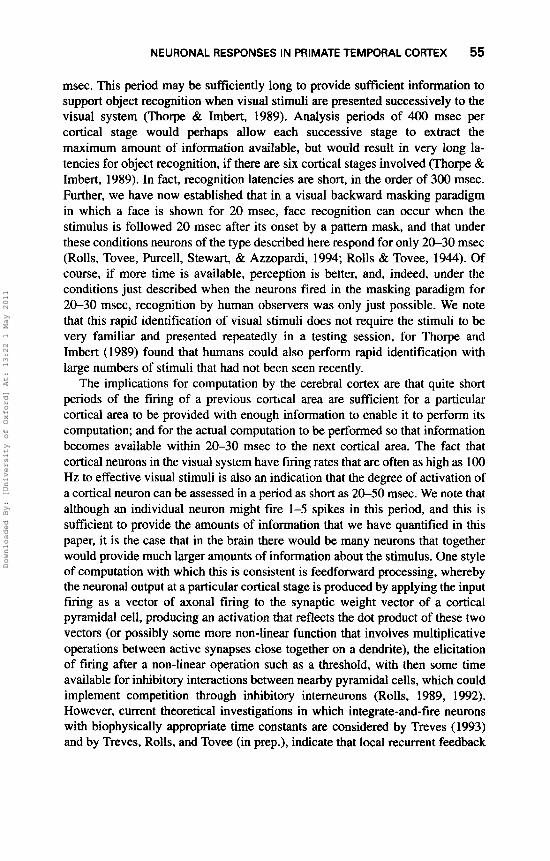
Taken together, these analyses provide evidence that a short period of firing taken close to the start of the neuronal response provides a reasonable propor- tion of the total information that would be available if a long period of neuronal firing (e.g. 400 msec) were utilized to extract the information available from the firing rate and from temporal encoding. This finding thus is consistent with the hypothesis that for each cortical area to provide useful information to the next, quite short periods of firing-of, for example, 20-50 msec-may be suficienf. This is in line with the evidence that as visual signals are passed through the visual system, there may be a delay introduced by each stage of as little as 20-30
Downloaded By: [University of Oxford] At: 13:22 1 May 2011
NEURONAL RESPONSES IN PRIMATE TEMPORAL CORTEX 55
msec. This period may be sufficiently long to provide sufficient information to support object recognition when visual stimuli are presented successively to the visual system (Thorpe & Imbert, 1989). Analysis periods of 400 msec per cortical stage would perhaps allow each successive stage to extract the maximum amount of information available, but would result in very long la- tencies for object recognition, if there are six cortical stages involved (Thorpe & Imbert, 1989). In fact, recognition latencies are short, in the order of 300 msec. Further, we have now established that in a visual backward masking paradigm in which a face is shown for 20 msec, face recognition can occur when the stimulus is followed 20 msec after its onset by a pattern mask, and that under these conditions neurons of the type described here respond for only 20-30 msec (Rolls, Tovee, hrcell, Stewart, & Azzopardi, 1994; Rolls & Tovee, 1944). Of course, if more time is available, perception is better, and, indeed, under the conditions just described when the neurons fired in the masking paradigm for 20-30 msec, recognition by human observers was only just possible. We note that this rapid identification of visual stimuli does not require the stimuli to be very familiar and presented repeatedly in a testing session, for Thorpe and Imbert (1989) found that humans could also perform rapid identification with large numbers of stimuli that had not been seen recently.
The implications for computation by the cerebral cortex are that quite short periods of the firing of a previous cortical area are sufficient for a particular cortical area to be provided with enough information to enable it to perform its computation; and for the actual computation to be performed so that information becomes available within 20-30 msec to the next cortical area. The fact that cortical neurons in the visual system have firing rates that are often as high as 100 Hz to effective visual stimuli is also an indication that the degree of activation of a cortical neuron can be assessed in a period as short as 20-SO msec. We note that although an individual neuron might fire 1-5 spikes in this period, and this is sufficient to provide the amounts of information that we have quantified in this paper, it is the case that in the brain there would be many neurons that together would provide much larger amounts of information about the stimulus. One style of computation with which this is consistent is feedforward processing, whereby the neuronal output at a particular cortical stage is produced by applying the input firing as a vector of axonal firing to the synaptic weight vector of a cortical pyramidal cell, producing an activation that reflects the dot product of these two vectors (or possibly some more non-linear function that involves multiplicative operations between active synapses close together on a dendrite), the elicitation of firing after a non-linear operation such as a threshold, with then some time available for inhibitory interactions between nearby pyramidal cells, which could implement competition through inhibitory interneurons (Rolls, 1989, 1992). However, current theoretical investigations in which integrate-and-fire neurons with biophysically appropriate time constants are considered by Treves (1993) and by Treves, Rolls, and Tovee (in prep.), indicate that local recurrent feedback
Downloaded By: [University of Oxford] At: 13:22 1 May 2011
56 TOVEE AND ROLLS
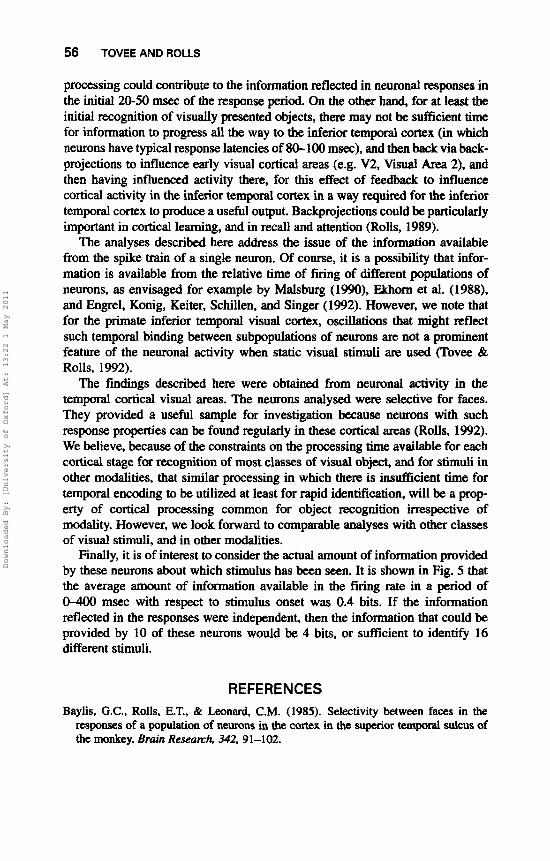
processing could contribute to the infomation reflected in neuronal responses in the initial 20-50 msec of the response period. On the other hand, for at least the initial recognition of visually presented objects, there may not be sufficient time for information to progress all the way to the inferior temporal cortex (in which neurons have typical response latencies of 80-100 msec), and then back via back- projections to influence early visual cortical areas (e.g. V2, Visual Area 2), and then having influenced activity there, for this effect of feedback to influence cortical activity in the inferior temporal cortex in a way required for the inferior temporal cortex to produce a useful output. Backprojections cwld be particularly important in cortical learning, and in recall and attention (Rolls, 1989).
The analyses described here address the issue of the information available from the spike train of a single neuron. Of course, it is a possibility that infor- mation is available from the relative time of firing of different populations of neurons, as envisaged for example by Malsburg (1990), morn et al. (1988). and Engrel, Konig, Keiter, Schillen, and Singer (1992). However, we note that for the primate inferior temporal visual cortex, oscillations that might reflect such temporal binding between subpopulations of neurons are not a prominent feature of the neuronal activity when static visual stimuli are used (Tovee & Rolls, 1992).
The findings described here were obtained from neuronal activity in the temporal cortical visual areas. The neurons analysed were selective for faces. They provided a useful sample for investigation because neurons with such response properties can be found regularly in these cortical areas (Rolls, 1992). We believe, because of the constraints on the processing time available for each cortical stage for recognition of most classes of visual object, and for stimuli in other modalities, that similar processing in which there is insufficient time for temporal encoding to be utilized at least for rapid identification, will be a prop- erty of cortical processing common for object recognition irrespective of modality. However, we look forward to comparable analyses with other classes of visual stimuli, and in other modalities.
Finally, it is of interest to consider the actual amount of information provided by these neurons about which stimulus has been seen. It is shown in Fig. 5 that the average amount of information available in the firing rate in a period of 0-400 msec with respect to stimulus onset was 0.4 bits. If the information reflected in the responses were independent, then the information that could be provided by 10 of these neurons would be 4 bits, or sufficient to identify 16 different stimuli.
REFERENCES Baylis. G.C.. Rolls, E.T., Br Leonard, C.M. (1985). Selectivity between faces in the
responses of a population of neurons in the cortex in the superior temporal sukus of the monkey. Brain Research 342, 91-102.
Downloaded By: [University of Oxford] At: 13:22 1 May 2011
NEURONAL RESPONSES IN PRIMATE TEMPORAL CORTEX 57
Bruce, C., Desimone, R. & Gross, C.G. (1981). Visual properties of neurons in a poly- sensory area in superior temporal sulcus of the macaque. Journal of Neuraphysiotogy,
Eckhom, R., Bauer, R., Jordan, W., Brosch, M., Kruse, W., Munk, M., & Reitbaeck, H.J. ( 1988). Biological Cybernetics, 60, 12 1- 130.
Ekhorn, R., & Popel, B. (1974). Rigorous and extended application of information theory to the afferent visual system of the cat 1. Basic concepts. Kybernetik, 16,
Ekhom, R., & Popel, B. (1975). Rigorous and extended application of information theory to the afferent visual system of the cat 11. Experimental results. Biological Cybernetics, 17,7-17.
Engel, A.K., Konig, P., Kreiter, A.K., Schillen, T.B., & Singer, W. (1992). Temporal coding in the visual cortex: New vistas on integration in the nervous system. Trends Neuroscience, 15, 218-226.
Eskandar, E.N., Richmond, B.J., & Optican, L.M. (1992). Role of inferior temporal neurons in visual memory. I. Temporal encoding of information about visual images, recalled images, and behavioural context. Journal of Neumphysiology, 68, 1277-1295.
Feigenbaum, J.D. & Rolls, E.T. (1991). Allocentric and egocentric spatial information processing in the hippocampal formation of the behaving primate. Psychobiology, 19, 2140.
Fukunaga, K. (1972). Introduction to statistical pattern recognition. New York: Academic Press.
MacRae, A.W. (1 971). On calculating unbiased information measures. Psychological Bulletin, 75, 270-277.
Malsburg, C. von der (1990). A neural architecture for the representation of scenes. In J.L. McGaugh, N.M. Weinberger, & G. Lynch (Eds.), Brain organization and memory: Cells, systems and circuits (pp. 356-372). New York: Oxford University Press.
Merrill, E.G., & Ainsworth, A. (1972). Glass-coated platinum-plated tungsten micro- electrodes. Medical Biological Engineering, 10, 662-672.
Optican, L.M., Gawne, T.J., Richmond, B.J., & Joseph, P.J. (1991). Unbiased measures of transmitted information and channel capacity from multivariate neuronal data. Biological Cybernetics, 65, 305-3 10.
Optican, L., & Richmond, B.J. (1987). Temporal encoding of two-dimensional patterns by single units in primate inferior temporal cortex. 111. Information theoretic analysis. Journal of Neurophysiology, 57, 132-146.
Perrett, D.I., Rolls, E.T., & Caan, W. (1982). Visual neurons responsive to faces in the monkey temporal cortex. Experimental Brain Research, 47, 329-342.
Richmond, B.J., & Optican, L. (1987). Temporal encoding of two-dimensional patterns by single units in primate inferior temporal cortex. 11. Quantification of response wave- form. Journal of Neurophysiology, 57, 147-161.
Richmond, B.J., & Optican, L.M. (1990). Temporal encoding of two-dimensional patterns by single units in primate primary visual cortex. 11. Information transmission. Journal of Neurophysiology, 64, 370-380.
Richmond, B.J., Optican, L.M., Podell, M., & Spitzer, H. (1987). Temporal encoding of two-dimensional patterns by single units in primate inferior temporal cortex. I. Response characteristics. Journal of Neurophysiology, 57, 132-14.6.
Rolls, E.T. (1984). Neurons in the cortex of the temporal lobe and in the amygdala of the monkey with responses selective for faces. Human Neurobiology, 3, 209-222.
46, 369-384.
19 1-200.
Downloaded By: [University of Oxford] At: 13:22 1 May 2011
58 TOVEE AND ROLLS
Rolls, E.T. (1989). Functions of neuronal networks in the hippocampus and neocortex in memory. In J.H. Byrne & W.O. Berry (Eds.), Neuml models of plasticity: Experimental and theoretical approaches (pp. 240-265). San Diego. CA. Academic Press.
Rolls, E.T. (1991). Neural organisation of higher visual functions. Current Ophion in Neurobiology, 1, 214-218.
Rolls, E.T. (1992). Neurophysiological mechanisms underlying face processing within and beyond the temporal cortical visual areas. Philosophical Transactions of the Royal Society, 335, 11-21.
Rolls, E.T. (1994a). Brain mechanisms for invariant recognition and learning. Behavioural Processes.
Rolls, E.T. (1994b). Learning mechanisms in the temporal lobe visual cortex. Behavioural Brain Research.
Rolls, E.T., Burton, M.J., & Mora, F. (1976). Hypothalamic neuronal responses associ- ated with the sight of food. Brain Research, 111, 53-66.
Rolls, E.T., Sanghera, M.K., & Roper-Hall, A. (1979). The latency of activation of neurons in the lateral hypothalamus and substantia innominata during feeding in the monkey. Brain Research, 164, 121-135.
Rolls, E.T., Tovee, M.J., h e l l , D.G., Stewart, A.L., & Azzopardi, l? (1994). The responses of neurons in the temporal cortex of primates, and face identification and detection. Experimental Brain Research, 101, 474484.
Rolls, E.T., & Tovee, M.J. (1994). Processing speed in the cerebral cortex, and the neurophysiology of visual backward masking. Proceedings of rhe Royal Society, London, B., 297, 9-15.
Rolls, E.T., & Treves, A. (1990). The relative advantages of sparse versus distributed encoding for associative neuronal networks in the brain. Network, I , 407421.
Rolls, E.T., Yaxley, S., & Sienkiewicz, Z.J. (1990). Gustatory responses of single neurons in the orbitofrontal cortex of the macaque monkey. Journal of Neurophysiology, 64, 1055-1066.
Thorpe, S.J., & Imbert, M. (1989). Biological constraints on connectionist models. In R. Pfeifer, 2. Schreter, & F. Fogelman-Soulie (Eds.), Connectionism in perspective (pp. 63-92). Amsterdam: Elsevier.
Tovee, M.J., & Rolls, E.T. (1992). Oscillatory activity is not evident in the primate temporal visual cortex with static stimuli. Neuromport, 3, 369-372.
Tovee, M.J., Rolls, E.T., & Azzopardi, P. (1994). Translation invariance and the responses of neurons in the temporal visual cortical areas of primates. Journal of Neurophysiology, 72,1049-1060.
Tovee, M.J., Rolls, E.T., Treves, A., & Bellis, R.P. (1993). Information encoding and the responses of single neurons in the primate temporal visual cortex. Journal of Neurophysiology, 70, 640-654.
Treves, A. (1993). Mean-field analysis of neuronal spike dynamics. Nemork, 4,259-284. Treves, A., & Panzeri, S. (in press). The upward bias in measures of information derived
from limited data samples. Neural Computation.
Revised manuscript received 22 Jury 1994.
Downloaded By: [University of Oxford] At: 13:22 1 May 2011