Embed Size (px)
Citation preview
General rights Copyright and moral rights for the publications made accessible in the public portal are retained by the authors and/or other copyright owners and it is a condition of accessing publications that users recognise and abide by the legal requirements associated with these rights.
• Users may download and print one copy of any publication from the public portal for the purpose of private study or research. • You may not further distribute the material or use it for any profit-making activity or commercial gain • You may freely distribute the URL identifying the publication in the public portal
If you believe that this document breaches copyright please contact us providing details, and we will remove access to the work immediately and investigate your claim.
Downloaded from orbit.dtu.dk on: May 20, 2018
Information Flow Through Stages of Complex Engineering Design Projects: A DynamicNetwork Analysis Approach
Parraguez Ruiz, Pedro; Eppinger, Steven D.; Maier, Anja
Published in:I E E E Transactions on Engineering Management
Link to article, DOI:10.1109/TEM.2015.2469680
Publication date:2015
Document VersionPeer reviewed version
Link back to DTU Orbit
Citation (APA):Parraguez, P., Eppinger, S. D., & Maier, A. (2015). Information Flow Through Stages of Complex EngineeringDesign Projects: A Dynamic Network Analysis Approach. I E E E Transactions on Engineering Management,62(4), 604-617. DOI: 10.1109/TEM.2015.2469680

General rights Copyright and moral rights for the publications made accessible in the public portal are retained by the authors and/or other copyright owners and it is a condition of accessing publications that users recognise and abide by the legal requirements associated with these rights.
Information Flow Through Stages of Complex Engineering Design Projects: A DynamicNetwork Analysis Approach
Parraguez, Pedro; Eppinger, Steven D.; Maier, Anja Published in:I E E E Transactions on Engineering Management
DOI:10.1109/TEM.2015.2469680
Publication date:2015
Link to publication
Citation (APA):Parraguez, Pedro., Eppinger, S. D., & Maier, A. (2015). Information Flow Through Stages of Complex Engineering Design Projects: A Dynamic Network Analysis Approach. I E E E Transactions on Engineering Management, 62(4), 604-617. 10.1109/TEM.2015.2469680
Authorised final preprint version

TITLE: Information Flow through Stages of Complex Engineering Design Projects:
A Dynamic Network Analysis Approach
KEYWORDS/INDEX TERMS: Complex System Development, Design Activities, Design
Process, Engineering Communication, Information Flow, Network Analysis, Project
Management, R&D Management
ABSTRACT: The pattern of information flow through the network of interdependent design
activities is thought to be an important determinant of engineering design process results. A
previously unexplored aspect of such patterns relates to the temporal dynamics of
information transfer between activities as those activities are implemented through the
network of people executing the project. To address this gap, we develop a dynamic
modelling method that integrates both the network of people and the network of activities in
the project. We then employ a large dataset collected from an industrial setting, consisting of
project-related e-mails and activity records from the design and development of a renewable
energy plant over the course of more than three years. Using network metrics for centrality
and clustering, we make three important contributions: 1. We demonstrate a novel method for
analysing information flows between activities in complex engineering design projects. 2. We
show how the network of information flows in a large-scale engineering project evolved over
time and how network analysis yields several managerial insights. 3. We provide a useful
new representation of the engineering design process and thus support theory-building
towards the evolution of information flows through systems engineering stages. Implications
include guidance on how to analyse and predict information flows as well as better planning
of information flows in engineering design projects according to their individual stage and
activity characteristics.
This is the author's version of an article that has been published in this journal. Changes were made to this version by the publisher prior to publication.The final version of record is available at http://dx.doi.org/10.1109/TEM.2015.2469680
Copyright (c) 2015 IEEE. Personal use is permitted. For any other purposes, permission must be obtained from the IEEE by emailing [email protected].
2
I. INTRODUCTION
Complex engineering design projects comprise interdependent activities implemented by
interconnected people. Such projects can be described as an intertwined network of people
exchanging and transforming information, the organisation architecture, and as a network of
information interdependent activities, the process architecture. The connection between these
two architectures is created when design engineers and other project participants interact to
exchange and transform information between activities [1]–[4]. As a result of these
interactions, information can flow between interdependent design activities in the form of
design inputs and outputs [5].
From a research and managerial perspective, quantifying, analysing and understanding the
evolving information flows between activities in the design process is an essential tool to
provide support to complex engineering design projects [2], [6]. The intended or expected
evolution of information flows between activities (given activities’ information
dependencies) has been modelled and analysed through activity network process models [7].
In turn, the overall evolution of the design process has been framed and guided through
stage-based models of the design process [8], [9]. The combination of these two approaches
is particularly relevant in the context of process planning, supporting key decisions related to
process structure, resource allocation and budgeting [7]. However, in order to quantify and
analyse how information actually flows between activities, and support process execution and
control, we require a model that simultaneously integrates the dynamic architecture of the
process as well as the dynamic architecture of the organisation that implements the process.
This integration allows connecting the actual sequence of activities in the process with those
who, through their work, exchange and transform information within and between activities
[4].
This is the author's version of an article that has been published in this journal. Changes were made to this version by the publisher prior to publication.The final version of record is available at http://dx.doi.org/10.1109/TEM.2015.2469680
Copyright (c) 2015 IEEE. Personal use is permitted. For any other purposes, permission must be obtained from the IEEE by emailing [email protected].
3
Nonetheless, previous studies of the design process have not provided and empirically tested
a model to analyse the evolution of information flow between activities in a way that clearly
distinguishes actual flows from information dependencies or intended information flows; nor
have these studies analysed evolving information flows at each systems engineering stage. As
a consequence, it has not been possible to compare actual information flows against expected
information flows at each stage. This is not only a shortcoming in our design process
knowledge, but also has hindered possibilities for monitoring overall project progress and
improving process execution and control.
Against this background, this paper poses two main research questions:
1) How can we model and analyse actual information flows between activities through stages
of complex engineering design projects? and 2) What are the implications, for theory and
practice, of a model to analyse actual information flows between activities?
To answer these research questions the rest of the paper is structured as follows: Section II
reviews and identifies gaps in key literature on information flow models. Section III develops
a dynamic model to quantify and analyse actual information flows between activities. Section
IV develops a baseline from which to compare and interpret empirical results derived from
the application of our model. Section V introduces our case study. Section VI provides
empirical results of the application of our model. Section VII discusses the results,
limitations, and answers the above research questions. Finally, section VIII concludes with a
synthesis of this paper’s contribution.
II. LITERATURE BACKGROUND
In the context of the design process of complex systems, information flows can be studied
from three main perspectives: (A) Organisational, with design as a social process of
information transformation and a focus on communication between people. (B) Process
This is the author's version of an article that has been published in this journal. Changes were made to this version by the publisher prior to publication.The final version of record is available at http://dx.doi.org/10.1109/TEM.2015.2469680
Copyright (c) 2015 IEEE. Personal use is permitted. For any other purposes, permission must be obtained from the IEEE by emailing [email protected].
4
oriented, analysing design in terms of information dependent activities and a set of project
stages. (C) At the intersection of organisation and process, explicitly considering the
information flow between activities as a function of information exchanges between people.
In this section we cover each of these three perspectives, identify current literature gaps, and
elicit the requirements for a dynamic model of actual information flows between activities.
A) Organisational perspectives on information flow in engineering design: The design of
complex products and systems has been considered a social process of information
transformation [10]–[12]. As such, a systemic understanding of communication that
considers information, interactions, and the specific situation during the development process
becomes essential for design process improvements [6], [13].
Information exchanges and information flows are used to model communication patterns
between participants of engineering design projects. An information exchange can be
understood as a simplified communication episode, where information is generated and
transmitted between parties of the design process as a discrete event in time. An information
flow is the combination of information exchanges over a period of time and involves a
sequence of information exchanges about usually interdependent design activities [14, Ch. 1],
[15].
Although information flows are inherently dynamic in nature, for simplicity, most studies
analyse them at an aggregate level e.g. [16]–[19]. Only more recently, with the advent of
richer data sources and powerful network analysis techniques, have detailed dynamics been
studied, e.g. [20]–[23].
This organisational perspective of information flows provides valuable insights for the
analysis of organisational issues, such as communication patterns between individuals or
departments, e.g. [16], [24]. However, this perspective of the design process of complex
This is the author's version of an article that has been published in this journal. Changes were made to this version by the publisher prior to publication.The final version of record is available at http://dx.doi.org/10.1109/TEM.2015.2469680
Copyright (c) 2015 IEEE. Personal use is permitted. For any other purposes, permission must be obtained from the IEEE by emailing [email protected].
5
engineering projects is incomplete, as it does not explicitly integrate activities and project
progress.
B) Process-driven perspectives on information flow in engineering design: In the process
domain we find engineering design activities connected by their information dependencies
and/or administrative controls. Following Sim & Duffy’s ontology of generic design
activities [25], we use the term activity to refer to the actual realisation of a particular design
task. Activities then involve actions executed by a person or group to transform a set of
information inputs into a set of information outputs. In the context of a design activity,
information has the purpose of defining the design object, evaluating design options, and/or
coordinating the design process [25].
Models describing the architecture of the process domain that have been used to study issues
related to information flows between activities include, to name a few, the process-type
Design Structure Matrix (DSM), workflow diagrams, IDEF, CPM/PERT and Petri nets (for a
review of activity network-based process models see [7]). All these models consider a
network of activities frequently connected by information-based relationships between them.
Even though process models are often used to describe and analyse actual information flows
between activities, the relationship they use to connect activities is not an actual information
flow. Instead, the relationship between activities tends to fall into two types. One,
relationships based on known technical and managerial needs that are used to define a
dependency. And two, relationships based on planned information flows, typically in the
form of top-down plans or perceptions acquired from a few company experts. These two
types of relationships restrict the kind of questions that can be posed to elicit the process
architecture to questions such as: “What is the information dependency (if any) between
activities A and B?” and “What is expected/should be the information flow between activities
A and B?”. However, what is really required to model actual information flows between
This is the author's version of an article that has been published in this journal. Changes were made to this version by the publisher prior to publication.The final version of record is available at http://dx.doi.org/10.1109/TEM.2015.2469680
Copyright (c) 2015 IEEE. Personal use is permitted. For any other purposes, permission must be obtained from the IEEE by emailing [email protected].
6
activities is to complement plans and known technical dependencies with the architecture of
the multiple information exchanges between project participants in the context of the
activities in which they participate.
This distinction between a process model that is built upon planned or expected information
flows, in contrast to a model of actual information flows, is important when interpreting
empirical results. For example, the stated aim of Collins et al. [26] and Braha & Bar-Yam
[27] is to describe and analyse the dynamics of information flows between activities;
nevertheless, the information they acquire and model only describes an evolving network of
information dependencies. As a consequence, their results describe planned or expected
information flows, not actual information flows.
Activity categories: In terms of the functions that activities perform, and building on the
approach by Sosa et al. [28] to identify and name modular and integrative subsystems, we can
identify two broad activity categories: The first category includes activities related to the
engineering design of specific components, modules, or subsystems under development;
these we call modular subsystem activities. The second category corresponds to activities
with the objective of integrating two or more components, modules, or subsystems; these we
call integrative subsystem activities. A third category, not included in the original work of
Sosa [28] but considered important by Sim & Duffy [25], corresponds to activities that
support, manage, and coordinate design work; for consistency we call these integrative work
activities. These three categories allow classifying activities based on their overall function
and with this the means for aggregated analysis of information flows of each design stage.
Design process stages: Staged-based models of the design process reflect the transformation
over time of a set of requirements into a detailed set of instructions to implement the design
object [5], [12]. As the design process unfolds throughout its stages, information flows
between activities also evolve. This evolution through different stages can be traced to
This is the author's version of an article that has been published in this journal. Changes were made to this version by the publisher prior to publication.The final version of record is available at http://dx.doi.org/10.1109/TEM.2015.2469680
Copyright (c) 2015 IEEE. Personal use is permitted. For any other purposes, permission must be obtained from the IEEE by emailing [email protected].

7
temporal and co-dependent aspects such as the progression of the design object [5], the
maturity of the design process [29], and the changing interaction patterns between the people
participating in the activities [4].
Systematic models of the engineering design process implicitly or explicitly consider a
logical sequence of stages and a set of activities within each stage [30, p. 35]. To guide this
paper’s discussion, we focus on the generic product development (PD) stages described in
Ulrich and Eppinger [5] in conjunction with the system development perspective found in
INCOSE’s systems engineering V model (SE-V) [31]. This combination has been selected
because these models provide widely accepted generic stage descriptions for new product
development and systems engineering processes. In addition, there are multiple
commonalities between the stages of these models and the ones found in other popular
engineering design process models [32], which enables generalisations beyond these
particular models.
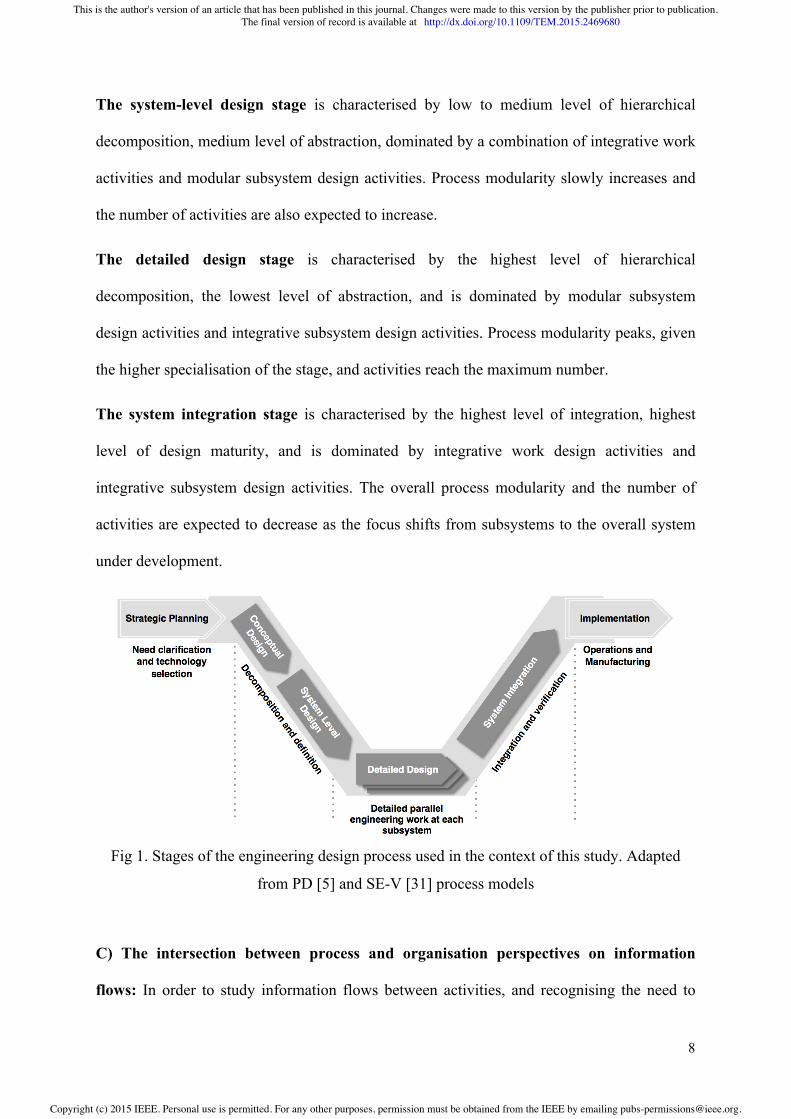
Figure 1 offers an overview that serves as a reference point for the characterisation of each
stage. Our emphasis is on the stages spanning conceptual design to system integration, as
these are the limits of what is usually considered the predominant focus of engineering design
[14, p. 5]. Consequently, strategic planning and implementation are not explicitly covered in
our analysis and discussion.
Combining the descriptions for the PD stages [5] and the SE-V model [31] each stage can be
summarised from the literature in terms of its level of decomposition or integration, the level
of abstraction or maturity of the design, process modularity, and the key activity categories
that are expected to dominate the stage: The conceptual design stage is characterised by a
low level of hierarchical decomposition, high level of abstraction, and is dominated by
integrative work activities. Low process modularity and a relatively low number of activities
are also expected.
This is the author's version of an article that has been published in this journal. Changes were made to this version by the publisher prior to publication.The final version of record is available at http://dx.doi.org/10.1109/TEM.2015.2469680
Copyright (c) 2015 IEEE. Personal use is permitted. For any other purposes, permission must be obtained from the IEEE by emailing [email protected].
8
The system-level design stage is characterised by low to medium level of hierarchical
decomposition, medium level of abstraction, dominated by a combination of integrative work
activities and modular subsystem design activities. Process modularity slowly increases and
the number of activities are also expected to increase.
The detailed design stage is characterised by the highest level of hierarchical
decomposition, the lowest level of abstraction, and is dominated by modular subsystem
design activities and integrative subsystem design activities. Process modularity peaks, given
the higher specialisation of the stage, and activities reach the maximum number.
The system integration stage is characterised by the highest level of integration, highest
level of design maturity, and is dominated by integrative work design activities and
integrative subsystem design activities. The overall process modularity and the number of
activities are expected to decrease as the focus shifts from subsystems to the overall system
under development.
Fig 1. Stages of the engineering design process used in the context of this study. Adapted
from PD [5] and SE-V [31] process models
C) The intersection between process and organisation perspectives on information
flows: In order to study information flows between activities, and recognising the need to
This is the author's version of an article that has been published in this journal. Changes were made to this version by the publisher prior to publication.The final version of record is available at http://dx.doi.org/10.1109/TEM.2015.2469680
Copyright (c) 2015 IEEE. Personal use is permitted. For any other purposes, permission must be obtained from the IEEE by emailing [email protected].
9
take the organisation architecture into account, previous studies have developed static or
dynamic models of the design process combining elements from the process and the
organisation domains. In combining these domains, various approaches have been followed
according to the temporality of the analysis.
Static models have provided a temporally aggregated view of the information flows between
activities through one or a few snapshots. These models have used either single-domain,
matrix-based approaches, where each activity is associated with one organisational unit, for
example 2D DSMs [33], [34], multi-domain matrix-based approaches [35], [36], or bi-modal
network-based approaches [4]. Unfortunately, the static nature of these models does not
allow calculating information flow metrics for each period of time nor does it allow
contrasting those measures with expected information flow patterns at each design process
stage. Dynamic models that simultaneously consider the evolution of process and
organisation architectures, and therefore allow describing the actual evolution of information
flow between activities, were not found.
Requirements and current gaps for a dynamic model of actual information flows
between activities: Based on the above literature background, we can identify a set of key
requirements to dynamically model actual information flows between activities through the
design process stages:
• People and activities: The organisation and process architecture, as well as their
intersection, need to be simultaneously considered so that all paths for information
exchanges between activities are included.
• Dynamics: To capture the dynamic evolution of information flows through stages of the
design process, both the organisation and process architecture need to be modelled as a
dynamic network and quantitatively measured.
This is the author's version of an article that has been published in this journal. Changes were made to this version by the publisher prior to publication.The final version of record is available at http://dx.doi.org/10.1109/TEM.2015.2469680
Copyright (c) 2015 IEEE. Personal use is permitted. For any other purposes, permission must be obtained from the IEEE by emailing [email protected].
10
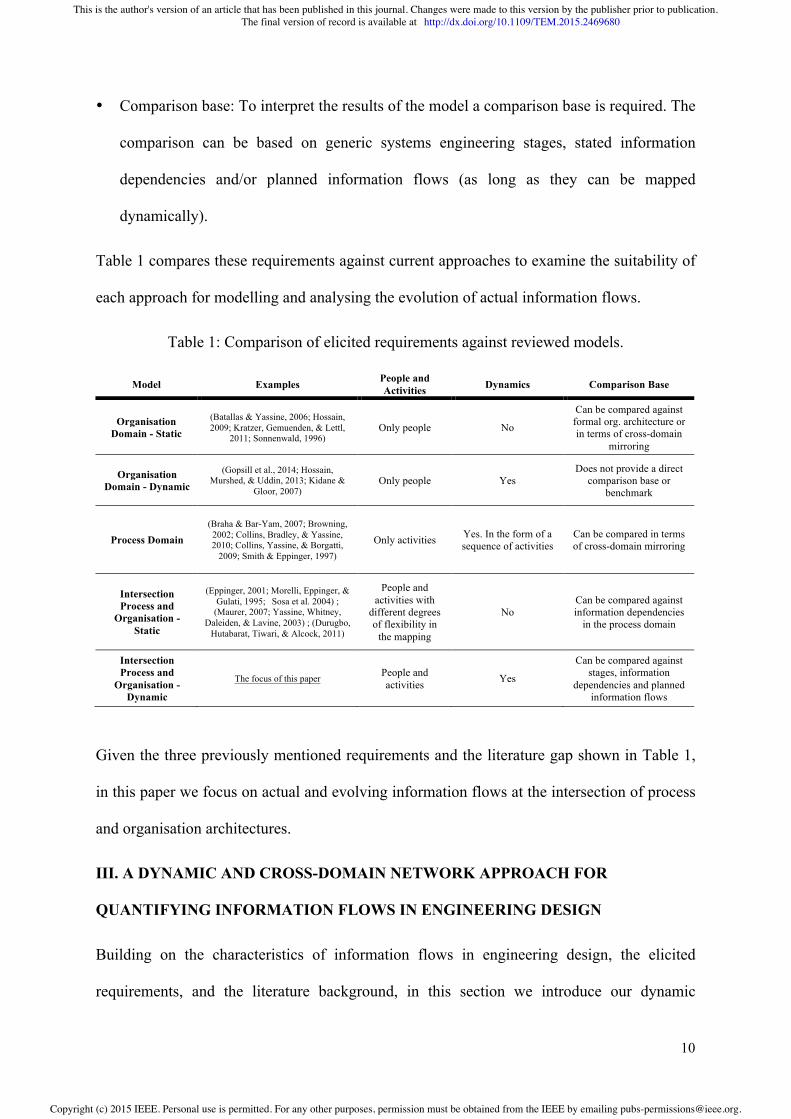
• Comparison base: To interpret the results of the model a comparison base is required. The
comparison can be based on generic systems engineering stages, stated information
dependencies and/or planned information flows (as long as they can be mapped
dynamically).
Table 1 compares these requirements against current approaches to examine the suitability of
each approach for modelling and analysing the evolution of actual information flows.
Table 1: Comparison of elicited requirements against reviewed models.
Given the three previously mentioned requirements and the literature gap shown in Table 1,
in this paper we focus on actual and evolving information flows at the intersection of process
and organisation architectures.
III. A DYNAMIC AND CROSS-DOMAIN NETWORK APPROACH FOR
QUANTIFYING INFORMATION FLOWS IN ENGINEERING DESIGN
Building on the characteristics of information flows in engineering design, the elicited
requirements, and the literature background, in this section we introduce our dynamic
Model Examples People and Activities Dynamics Comparison Base
Organisation Domain - Static
(Batallas & Yassine, 2006; Hossain, 2009; Kratzer, Gemuenden, & Lettl,
2011; Sonnenwald, 1996) Only people No
Can be compared against formal org. architecture or in terms of cross-domain
mirroring
Organisation Domain - Dynamic
(Gopsill et al., 2014; Hossain, Murshed, & Uddin, 2013; Kidane &
Gloor, 2007) Only people Yes
Does not provide a direct comparison base or
benchmark
Process Domain (Braha & Bar-Yam, 2007; Browning, 2002; Collins, Bradley, & Yassine, 2010; Collins, Yassine, & Borgatti,
2009; Smith & Eppinger, 1997)
Only activities Yes. In the form of a sequence of activities
Can be compared in terms of cross-domain mirroring
Intersection Process and
Organisation - Static
(Eppinger, 2001; Morelli, Eppinger, & Gulati, 1995; Sosa et al. 2004) ;
(Maurer, 2007; Yassine, Whitney, Daleiden, & Lavine, 2003) ; (Durugbo,
Hutabarat, Tiwari, & Alcock, 2011)
People and activities with
different degrees of flexibility in
the mapping
No Can be compared against information dependencies
in the process domain
Intersection Process and
Organisation - Dynamic
The focus of this paper People and activities Yes
Can be compared against stages, information
dependencies and planned information flows
This is the author's version of an article that has been published in this journal. Changes were made to this version by the publisher prior to publication.The final version of record is available at http://dx.doi.org/10.1109/TEM.2015.2469680
Copyright (c) 2015 IEEE. Personal use is permitted. For any other purposes, permission must be obtained from the IEEE by emailing [email protected].

11
network model of information flow between activities. In addition, here we also provide a
brief introduction to key network analysis concepts, in particular centrality and clustering,
which will be used as tools to quantify the evolution of information flows.
Network metrics: A common thread of the organisational and process models introduced in
section II is the explicit or implicit use of network analysis. The most common approaches
consider matrix-based or graph-based network analysis to model information flow or
information dependencies in the form of an information network. In order to understand these
information networks it is helpful to frame them in the wider context of network analysis
studies of complex engineering design projects.
An information network is taken to be a system representation of the information
transformation process, where the elements (nodes) are connected by information exchanges
(edges). Such elements can be combined into a multimodal network (where different types of
elements co-exist) or as a one-mode network (where only one type of element is represented).
Each node can be described using network measures that quantify their direct and/or indirect
connections. Likewise, the network as a whole can also be described based on the structure of
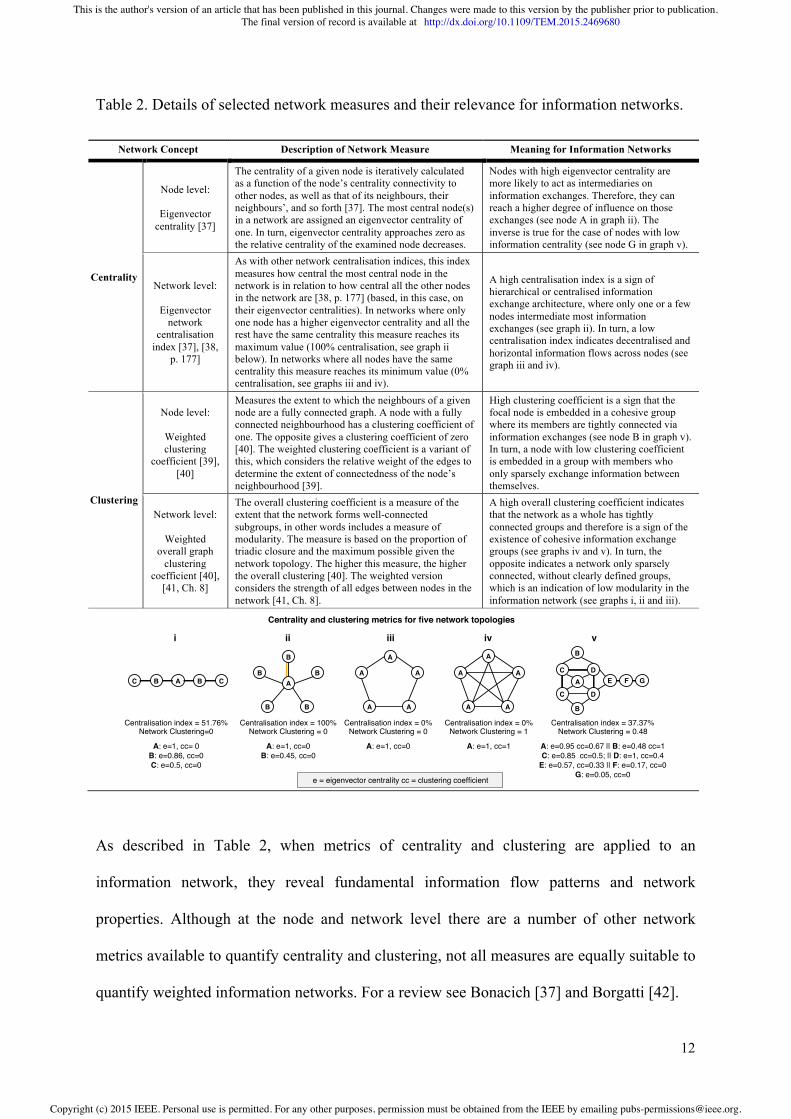
its connections (in our case information exchanges). Table 2 offers a description of selected
network measures that allow quantifying two important aspects of information networks:
centrality and clustering.
This is the author's version of an article that has been published in this journal. Changes were made to this version by the publisher prior to publication.The final version of record is available at http://dx.doi.org/10.1109/TEM.2015.2469680
Copyright (c) 2015 IEEE. Personal use is permitted. For any other purposes, permission must be obtained from the IEEE by emailing [email protected].
12
Table 2. Details of selected network measures and their relevance for information networks.
Network Concept Description of Network Measure Meaning for Information Networks
Centrality
Node level:
Eigenvector centrality [37]
The centrality of a given node is iteratively calculated as a function of the node’s centrality connectivity to other nodes, as well as that of its neighbours, their neighbours’, and so forth [37]. The most central node(s) in a network are assigned an eigenvector centrality of one. In turn, eigenvector centrality approaches zero as the relative centrality of the examined node decreases.
Nodes with high eigenvector centrality are more likely to act as intermediaries on information exchanges. Therefore, they can reach a higher degree of influence on those exchanges (see node A in graph ii). The inverse is true for the case of nodes with low information centrality (see node G in graph v).
Network level:
Eigenvector network
centralisation index [37], [38,
p. 177]
As with other network centralisation indices, this index measures how central the most central node in the network is in relation to how central all the other nodes in the network are [38, p. 177] (based, in this case, on their eigenvector centralities). In networks where only one node has a higher eigenvector centrality and all the rest have the same centrality this measure reaches its maximum value (100% centralisation, see graph ii below). In networks where all nodes have the same centrality this measure reaches its minimum value (0% centralisation, see graphs iii and iv).
A high centralisation index is a sign of hierarchical or centralised information exchange architecture, where only one or a few nodes intermediate most information exchanges (see graph ii). In turn, a low centralisation index indicates decentralised and horizontal information flows across nodes (see graph iii and iv).
Clustering
Node level:
Weighted clustering
coefficient [39], [40]
Measures the extent to which the neighbours of a given node are a fully connected graph. A node with a fully connected neighbourhood has a clustering coefficient of one. The opposite gives a clustering coefficient of zero [40]. The weighted clustering coefficient is a variant of this, which considers the relative weight of the edges to determine the extent of connectedness of the node’s neighbourhood [39].
High clustering coefficient is a sign that the focal node is embedded in a cohesive group where its members are tightly connected via information exchanges (see node B in graph v). In turn, a node with low clustering coefficient is embedded in a group with members who only sparsely exchange information between themselves.
Network level:
Weighted overall graph
clustering coefficient [40],
[41, Ch. 8]
The overall clustering coefficient is a measure of the extent that the network forms well-connected subgroups, in other words includes a measure of modularity. The measure is based on the proportion of triadic closure and the maximum possible given the network topology. The higher this measure, the higher the overall clustering [40]. The weighted version considers the strength of all edges between nodes in the network [41, Ch. 8].
A high overall clustering coefficient indicates that the network as a whole has tightly connected groups and therefore is a sign of the existence of cohesive information exchange groups (see graphs iv and v). In turn, the opposite indicates a network only sparsely connected, without clearly defined groups, which is an indication of low modularity in the information network (see graphs i, ii and iii).
As described in Table 2, when metrics of centrality and clustering are applied to an
information network, they reveal fundamental information flow patterns and network
properties. Although at the node and network level there are a number of other network
metrics available to quantify centrality and clustering, not all measures are equally suitable to
quantify weighted information networks. For a review see Bonacich [37] and Borgatti [42].
B CAC B
Centralisation index = 51.76%Network Clustering=0
A: e=1, cc= 0B: e=0.86, cc=0C: e=0.5, cc=0
i
B
B
B
B
B
A
Centralisation index = 100%Network Clustering = 0
A: e=1, cc=0B: e=0.45, cc=0
ii
A
A
A
A
A
Centralisation index = 0%Network Clustering = 0
A: e=1, cc=0
iii
A
A
A
A
A
Centralisation index = 0%Network Clustering = 1
A: e=1, cc=1
iv
C
CA
B
B
E F GD
D
Centralisation index = 37.37%Network Clustering = 0.48
A: e=0.95 cc=0.67 || B: e=0.48 cc=1C: e=0.85 cc=0.5; || D: e=1, cc=0.4
E: e=0.57, cc=0.33 || F: e=0.17, cc=0G: e=0.05, cc=0
v
Centrality and clustering metrics for five network topologies
e = eigenvector centrality cc = clustering coefficient
This is the author's version of an article that has been published in this journal. Changes were made to this version by the publisher prior to publication.The final version of record is available at http://dx.doi.org/10.1109/TEM.2015.2469680
Copyright (c) 2015 IEEE. Personal use is permitted. For any other purposes, permission must be obtained from the IEEE by emailing [email protected].
13
Node-level and network-level centrality measures applied to information networks quantify
the influence that a given node can have on information flows in a network and the degree to
which those flows are centralised in a few nodes. Borgatti [42] shows that given the
properties of inherent divisibility, parallel duplication, and influence transitivity found in
networks constituted of information flows “the eigenvector centrality measure is ideally
suited for influence type processes” [42, p. 62], in particular those related to information-
based influence.
Node-level and network-level clustering metrics applied to information networks determine
the extent of triadic closure of a given node or the entire network, and therefore reveal the
extent to which information flows are associated to tight network clusters [40]. As a result,
clustering provides an indication about the modularity of the information network. Unlike
centrality measures, for which there are less consensus and more options, the clustering
coefficient of Watts & Strogatz [40] and its weighted version [39] (at the node and network
level) are widely used, and while generic, are well-suited for the analysis of information
networks, e.g. [4].
If either centrality or clustering metrics are utilised in isolation, it is hard to evaluate the
overall network topology in terms of aspects such as modularity, which at least requires a
combination of inputs on centrality and clustering [43]. For example, graph iv in Table 2 has
a maximum clustering coefficient, however that network is only formed by one big cohesive
cluster, therefore it is not possible to speak about modularity, as that would require the
underlying system to be at least semi-decomposable into two or more modular subsystems
[43]. As a result, the combination of network-level measures for centrality and clustering
provide a more balanced view.
Proposed approach: Our approach differentiates from prior research in its explicit
integration of the interconnectedness between domains and the temporal dynamics of the
This is the author's version of an article that has been published in this journal. Changes were made to this version by the publisher prior to publication.The final version of record is available at http://dx.doi.org/10.1109/TEM.2015.2469680
Copyright (c) 2015 IEEE. Personal use is permitted. For any other purposes, permission must be obtained from the IEEE by emailing [email protected].
14
engineering design process. The emphasis is on the process architecture as implemented
through the organisation architecture. This approach allows describing and analysing the
actual temporal dynamics of the design process, in contrast to the traditional form of
modelling the process architecture based on reported dependencies.
In order to obtain the process architecture as implemented through the organisation
architecture, our research approach models engineering design as a social process of
information transformation [10]–[12], where information flows between activities are
connected and progressively transformed via people participating in the process [4].
Figure 2 shows how the actual process architecture is derived from the combination of an
activity network (process architecture), a communication network (organisation architecture)
and an activity-people mapping (cross-domain architecture). More specifically, our model is
built using: a) A work breakdown structure to identify the activities and their logical work
packages, b) an organisation-type DSM to identify information-driven interactions between
the members of the project (in our case synonymous with information exchanges) [2], and c)
a Domain Mapping Matrix (DMM) [36] to identify the participation of the members of the
project in design activities. All relations in the matrices are directly acquired (no indirect
dependency is computed) and the people-activities relations of the DMM are combined with
the people-people information exchanges to produce all information paths shown by the
dashed lines in Figure 2. The dashed lines in our suggested model represent the actual
information flowing through activities and people at any given point of time.
This is the author's version of an article that has been published in this journal. Changes were made to this version by the publisher prior to publication.The final version of record is available at http://dx.doi.org/10.1109/TEM.2015.2469680
Copyright (c) 2015 IEEE. Personal use is permitted. For any other purposes, permission must be obtained from the IEEE by emailing [email protected].
15
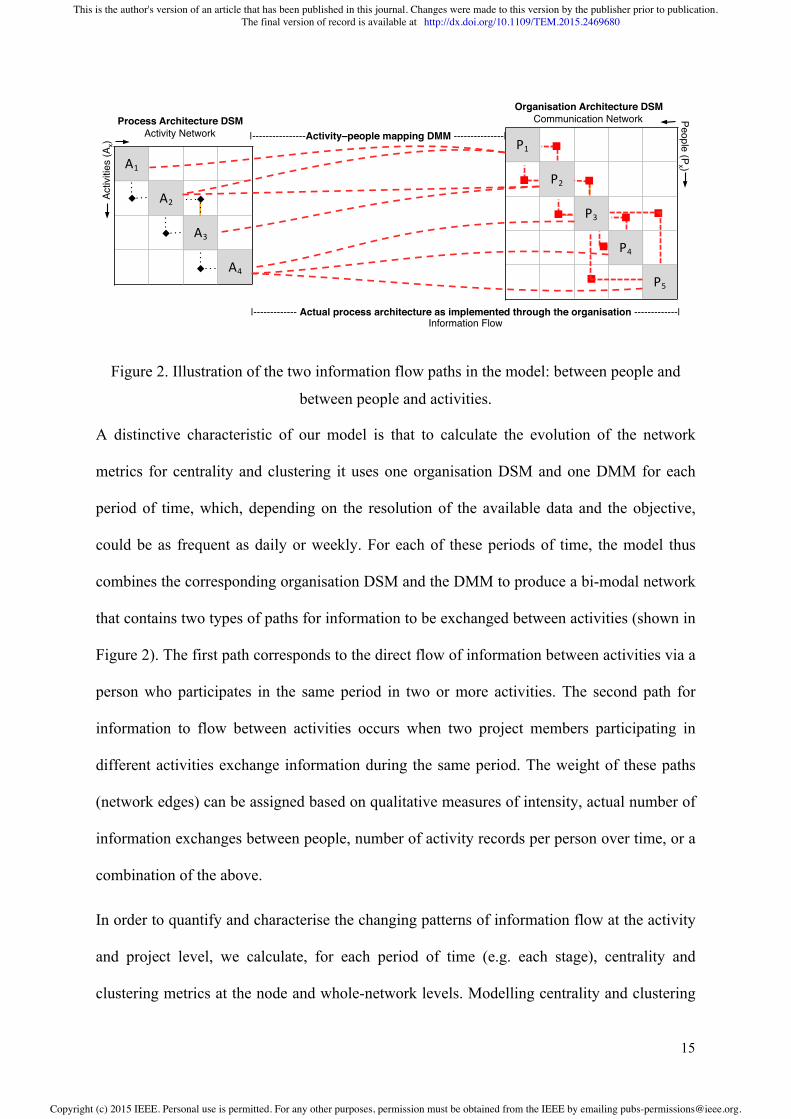
Figure 2. Illustration of the two information flow paths in the model: between people and
between people and activities.
A distinctive characteristic of our model is that to calculate the evolution of the network
metrics for centrality and clustering it uses one organisation DSM and one DMM for each
period of time, which, depending on the resolution of the available data and the objective,
could be as frequent as daily or weekly. For each of these periods of time, the model thus
combines the corresponding organisation DSM and the DMM to produce a bi-modal network
that contains two types of paths for information to be exchanged between activities (shown in
Figure 2). The first path corresponds to the direct flow of information between activities via a
person who participates in the same period in two or more activities. The second path for
information to flow between activities occurs when two project members participating in
different activities exchange information during the same period. The weight of these paths
(network edges) can be assigned based on qualitative measures of intensity, actual number of
information exchanges between people, number of activity records per person over time, or a
combination of the above.
In order to quantify and characterise the changing patterns of information flow at the activity
and project level, we calculate, for each period of time (e.g. each stage), centrality and
clustering metrics at the node and whole-network levels. Modelling centrality and clustering
|----------------Activity–people mapping DMM ---------------|!P1
P2
P3
P4
P5
A1
A2
A3
A4
!!"!
Activ
ities
(Ax)!
People (Px )!
!!
!!
!! "!
"!
"! "!
"! "!
"!
!
!
!
!
|------------- Actual process architecture as implemented through the organisation -------------|Information Flow!
Organisation Architecture DSMCommunication Network!Process Architecture DSM
Activity Network!
This is the author's version of an article that has been published in this journal. Changes were made to this version by the publisher prior to publication.The final version of record is available at http://dx.doi.org/10.1109/TEM.2015.2469680
Copyright (c) 2015 IEEE. Personal use is permitted. For any other purposes, permission must be obtained from the IEEE by emailing [email protected].

16
is important as it reveals when and which activities intermediate or influence information in
the project and the underlying topology of the network where this happens. This, in turn
shapes the temporal dynamics of the design process and affects the development of critical
interfaces between subsystems [24].
We define the information centrality (or influence) of an activity by its weighted degree of
intermediation on information exchanges. This information centrality can be determined by
the centrality of the activity within a network of information flows and quantified using the
previously introduced network metric of eigenvector centrality [37]. In addition, we define
information centralisation (centrality at the network level) as the overall weighted
distribution of information centrality in the whole project. We quantify information
centralisation using a network metric based directly on eigenvector centrality known as
eigenvector network centralisation index [37], [38, p. 177].
We define information clustering of an activity by the weighted degree of triadic closure of
the information exchanges between the people performing the activity. Information clustering
can be quantified using the previously introduced network metric of weighted clustering
coefficient [39]. In addition, we define overall information clustering (clustering at the
network level) as a measure of the tendency of the network to form well-connected
subgroups of people around activities. We quantify overall information clustering using a
network metric based on the clustering coefficient, known as the weighted overall graph
clustering coefficient [40]. The weighted version of this last metric “gives weight to the
neighbourhood densities proportional to their size; that is, actors with larger neighbourhoods
get more weight in computing the average density” [41, Ch. 8]. The formulas for these four
network metrics are available in appendix A.
Although to obtain the actual process architecture we could have taken a more traditional
process DSM approach, asking directly how activities are implemented based on expert
This is the author's version of an article that has been published in this journal. Changes were made to this version by the publisher prior to publication.The final version of record is available at http://dx.doi.org/10.1109/TEM.2015.2469680
Copyright (c) 2015 IEEE. Personal use is permitted. For any other purposes, permission must be obtained from the IEEE by emailing [email protected].
17
knowledge, as in [2], [44], the inter-temporal nature of our analysis would have made this
task overly difficult for the respondents. The problem originates in the multiple ways in
which activities can be implemented and connected to other activities through people. In
contrast, instead of directly gathering this dynamic network of task interactions from experts,
our approach first acquires the mapping of people to activities over time, then identifies the
dynamic interactions between people, and finally composes a unified network structure
utilising this bottom-up perspective. Such data gathering strategy also has the advantage that
it can be automated via the extraction of digital traces produced throughout the design
process.
To facilitate analysis and interpretation, the process architecture can be analysed by
aggregating low-level activities into larger activity groups (work packages) and activity
categories based on the common work they perform towards developing a particular
subsystem or subprocess.
IV. THE RELATIONSHIP BETWEEN DESIGN PROCESS STAGES AND THE
DYNAMIC NETWORK STRUCTURE OF INFORMATION FLOWS
The model presented in section III provides a way to empirically quantify the changing
patterns of information centrality and clustering between activities, as well as of overall
information centralisation and overall information clustering in engineering design projects.
However, to interpret the empirical results obtained through the application of the model we
need a base against which to compare the obtained information centrality and clustering
patterns.
One option is to compare the empirical results against a previous and closely related
successful project to which the same quantification of information flows was applied.
Although this option allows for a direct benchmark, it would not allow for a theoretical
This is the author's version of an article that has been published in this journal. Changes were made to this version by the publisher prior to publication.The final version of record is available at http://dx.doi.org/10.1109/TEM.2015.2469680
Copyright (c) 2015 IEEE. Personal use is permitted. For any other purposes, permission must be obtained from the IEEE by emailing [email protected].

18
understanding of information flow patterns. In addition, data of closely related and successful
projects is often unavailable in practice. An alternative option is to build a comparison based
on an examination of qualitative descriptions found in generic models of systems engineering
stages. As long as the engineering design project under study follows a sequence of systems
engineering stages it is possible to benchmark against information centrality and clustering
patterns inferred from the descriptions of each generic engineering design stage.
To enable the analysis and comparison of empirical results produced by the application of the
proposed model against systems engineering stage models, we need to translate the
qualitative systems engineering stage descriptions and characteristics (section II) into
expected information flow patterns by stage. That is to say, we need, a theory of how
information is expected to flow between activities in different engineering systems stages.
Given the description of the design process stages introduced in section II, we postulate the
following information centrality and clustering patterns per stage:
Conceptual design and system-level design stages: While the conceptual and system-level
design stages have different purposes, from the point of view of expected information flow
patterns they share similar features. Both stages are characterised by a high level of
abstraction and system-level focus, and we expect these stages to be dominated by integrative
work activities that possess a relatively high level of information centrality and low levels of
clustering. Such a topology resembles a star-like network structure, with integrative work
activities at the centre of the network (see Table 3). At the whole network level this translates
into a high network centralisation index and low overall graph clustering.
Detailed design stage: As at this stage the maximum level of decomposition is reached, and
the focus shifts towards individual subsystems, we expect modular subsystem activities to
dominate the network topology of this stage. This means that modular subsystem activities
should exhibit, relative to the other two activity categories, the highest centrality. However, at
This is the author's version of an article that has been published in this journal. Changes were made to this version by the publisher prior to publication.The final version of record is available at http://dx.doi.org/10.1109/TEM.2015.2469680
Copyright (c) 2015 IEEE. Personal use is permitted. For any other purposes, permission must be obtained from the IEEE by emailing [email protected].
19
the network level, this stage should exhibit a relatively low centralisation, consistent with the
distributed nature of work in parallel subsystems. Likewise, considering the high level of
decomposition required, clustering should be high, reflecting the expected process modularity
associated with the required system decomposition into subsystems. At this stage, given the
increased level of technical specialisation, the coordination between subsystems is expected
to shift from integrative work activities to integrative subsystem activities. Such a shift
should increase the centrality of integrative subsystem activities and decrease the centrality of
integrative work activities. At the whole network level this translates into a low network
centralisation index and high overall graph clustering.
System integration stage: Considering the shift of focus in this stage from the detailed design
of subsystems to their integration, we expect a reversal of some of the network patterns
reached at the detailed design stage. In particular, and consistent with the need for cross-
subsystem coordination, integrative work activities should regain centrality and the overall
information centralisation of the network should also increase. As the emphasis shifts from
modularity to integration, overall graph clustering should decrease and centralisation should
increase. Given the higher degree of technical maturity and system complexity of the design
reached at this stage, while overall clustering is expected to decline, is not expected to go
below levels found during the conceptual and system-level design stages.
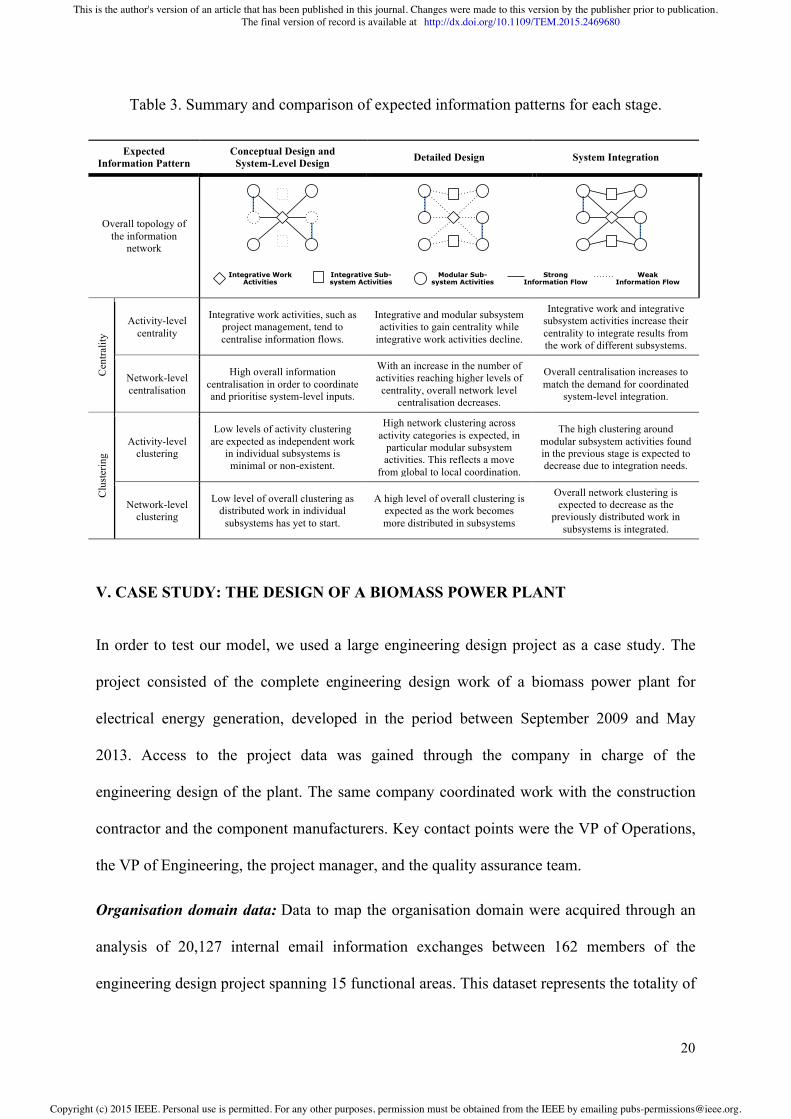
Table 3 summarises the expected patterns for each of the previously covered stages in terms
of information centrality and clustering, providing a base against which to compare the
empirical results obtained from our case study (presented in the following section).
This is the author's version of an article that has been published in this journal. Changes were made to this version by the publisher prior to publication.The final version of record is available at http://dx.doi.org/10.1109/TEM.2015.2469680
Copyright (c) 2015 IEEE. Personal use is permitted. For any other purposes, permission must be obtained from the IEEE by emailing [email protected].
20
Table 3. Summary and comparison of expected information patterns for each stage.
Expected Information Pattern
Conceptual Design and System-Level Design Detailed Design System Integration
Overall topology of the information
network
Cen
tralit
y
Activity-level centrality
Integrative work activities, such as project management, tend to centralise information flows.
Integrative and modular subsystem activities to gain centrality while
integrative work activities decline.
Integrative work and integrative subsystem activities increase their centrality to integrate results from the work of different subsystems.
Network-level centralisation
High overall information centralisation in order to coordinate and prioritise system-level inputs.
With an increase in the number of activities reaching higher levels of
centrality, overall network level centralisation decreases.
Overall centralisation increases to match the demand for coordinated
system-level integration.
Clu
ster
ing
Activity-level clustering
Low levels of activity clustering are expected as independent work
in individual subsystems is minimal or non-existent.
High network clustering across activity categories is expected, in
particular modular subsystem activities. This reflects a move
from global to local coordination.
The high clustering around modular subsystem activities found in the previous stage is expected to decrease due to integration needs.
Network-level clustering
Low level of overall clustering as distributed work in individual
subsystems has yet to start.
A high level of overall clustering is expected as the work becomes more distributed in subsystems
Overall network clustering is expected to decrease as the
previously distributed work in subsystems is integrated.
V. CASE STUDY: THE DESIGN OF A BIOMASS POWER PLANT
In order to test our model, we used a large engineering design project as a case study. The
project consisted of the complete engineering design work of a biomass power plant for
electrical energy generation, developed in the period between September 2009 and May
2013. Access to the project data was gained through the company in charge of the
engineering design of the plant. The same company coordinated work with the construction
contractor and the component manufacturers. Key contact points were the VP of Operations,
the VP of Engineering, the project manager, and the quality assurance team.
Organisation domain data: Data to map the organisation domain were acquired through an
analysis of 20,127 internal email information exchanges between 162 members of the
engineering design project spanning 15 functional areas. This dataset represents the totality of
Modular Sub-system Activities
Integrative Work Activities
Integrative Sub-system Activities
Strong Information Flow
Weak Information Flow
This is the author's version of an article that has been published in this journal. Changes were made to this version by the publisher prior to publication.The final version of record is available at http://dx.doi.org/10.1109/TEM.2015.2469680
Copyright (c) 2015 IEEE. Personal use is permitted. For any other purposes, permission must be obtained from the IEEE by emailing [email protected].

21
project-related email communication during the period under study. Email metadata about
sender and recipient as well as time and date were used to model the actual organisation
architecture as a dynamic information exchange network. Due to archival requirements from
clients and regulatory agencies, all emails in this dataset are related exclusively to the design
process of the biomass power plant, therefore they are a good representation of relevant
project-related information exchanges.
We assessed how fully email communication represents all possible communication channels
in the project through an electronic questionnaire. The questionnaire was administered to a
selection of 49 core project members who reported the frequency (daily, monthly or weekly)
of their information exchanges with 77 project members (including the 49 surveyed
members). The result of this cross validation was that for the 60 members for whom there
was complete overlap between survey and email communication, 58% of their dyadic
information exchanges had a near complete correspondence between survey and email
communication, while 68% had a frequency weighted correspondence within 70% or more.
Hence, we consider this email communication database as a good proxy for the majority of
information exchanges in this project.
The person-person communication network was built with people as nodes and email
exchanges between them as edges. The weight of the edges between project participants was
calculated by counting the number of emails between a particular dyad for each temporal
snapshot under analysis (i.e. each stage). This is equivalent to weighting edges by
communication frequency.
Process domain data: Data about the process domain included a detailed list of project
activities (used internally by the company for project management and reporting) as well as
their information dependencies. After eliminating non-design activities and activities for
which there was no valid match between a person in the email dataset and the activity log, a
This is the author's version of an article that has been published in this journal. Changes were made to this version by the publisher prior to publication.The final version of record is available at http://dx.doi.org/10.1109/TEM.2015.2469680
Copyright (c) 2015 IEEE. Personal use is permitted. For any other purposes, permission must be obtained from the IEEE by emailing [email protected].
22
total of 66 activities were determined to be suitable to form part of the dynamic network
analysis. This final list was validated through interviews with the VP of Operations, VP of
Engineering, and the project manager in addition to the company’s own technical
documentation, which included workflow diagrams and Gantt charts.
With the help of company engineers, the activities were categorised into the 13 activity
groups listed in Table 4. This first level of categorisation was based on the identification of
cohesive work packages related to the subsystems under development or other common
characteristics shared by the activities. A process-type DSM was then created to identify the
planned relationships across the 13 activity groups. This DSM was based on information
dependencies revealed by the project managers and existing workflow diagrams. The
objective of this DSM analysis was to classify the activity groups in one of the three
categories identified in section III (integrative work, integrative subsystem, and modular
subsystem activities).
Based on company records and internal experts’ knowledge, an approximate chronological
sequence of stages was established: Conceptual design occurred during the first four months
of the project, starting in September 2009 and finishing by December 2009. System-level
design was performed during a period of 10 months, between January and October 2011.
Detailed design was performed during a period of about 14 months, between November 2011
and December 2012. Finally system integration was mainly performed during a period of 5
months, between January and May 2013.
Following the model proposed in section III, the network representation of actual information
flows between activities is calculated as a function of information exchanges between people
and the participation of people in activities.
This is the author's version of an article that has been published in this journal. Changes were made to this version by the publisher prior to publication.The final version of record is available at http://dx.doi.org/10.1109/TEM.2015.2469680
Copyright (c) 2015 IEEE. Personal use is permitted. For any other purposes, permission must be obtained from the IEEE by emailing [email protected].
23
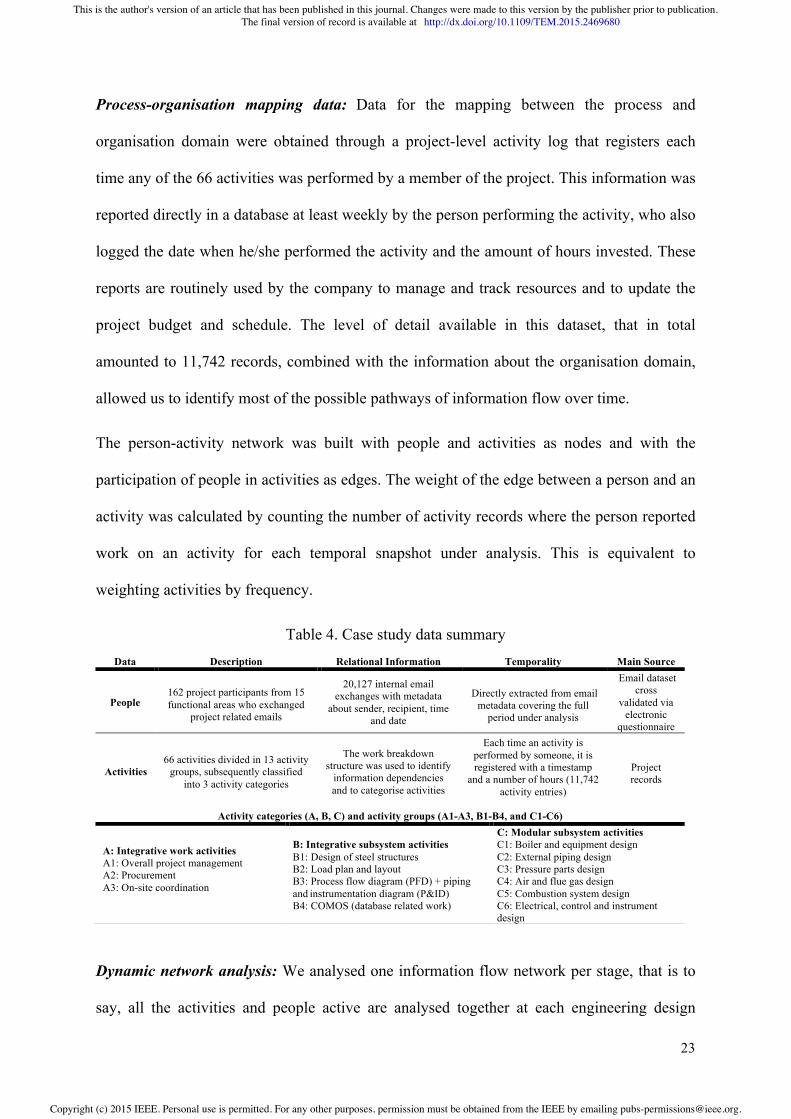
Process-organisation mapping data: Data for the mapping between the process and
organisation domain were obtained through a project-level activity log that registers each
time any of the 66 activities was performed by a member of the project. This information was
reported directly in a database at least weekly by the person performing the activity, who also
logged the date when he/she performed the activity and the amount of hours invested. These
reports are routinely used by the company to manage and track resources and to update the
project budget and schedule. The level of detail available in this dataset, that in total
amounted to 11,742 records, combined with the information about the organisation domain,
allowed us to identify most of the possible pathways of information flow over time.
The person-activity network was built with people and activities as nodes and with the
participation of people in activities as edges. The weight of the edge between a person and an
activity was calculated by counting the number of activity records where the person reported
work on an activity for each temporal snapshot under analysis. This is equivalent to
weighting activities by frequency.
Table 4. Case study data summary
Dynamic network analysis: We analysed one information flow network per stage, that is to
say, all the activities and people active are analysed together at each engineering design
Data Description Relational Information Temporality Main Source
People
162 project participants from 15 functional areas who exchanged
project related emails
20,127 internal email exchanges with metadata
about sender, recipient, time and date
Directly extracted from email metadata covering the full
period under analysis
Email dataset cross
validated via electronic
questionnaire
Activities 66 activities divided in 13 activity
groups, subsequently classified into 3 activity categories
The work breakdown structure was used to identify
information dependencies and to categorise activities
Each time an activity is performed by someone, it is registered with a timestamp
and a number of hours (11,742 activity entries)
Project records
Activity categories (A, B, C) and activity groups (A1-A3, B1-B4, and C1-C6)
A: Integrative work activities A1: Overall project management A2: Procurement A3: On-site coordination
B: Integrative subsystem activities B1: Design of steel structures B2: Load plan and layout B3: Process flow diagram (PFD) + piping and instrumentation diagram (P&ID) B4: COMOS (database related work)
C: Modular subsystem activities C1: Boiler and equipment design C2: External piping design C3: Pressure parts design C4: Air and flue gas design C5: Combustion system design C6: Electrical, control and instrument design
This is the author's version of an article that has been published in this journal. Changes were made to this version by the publisher prior to publication.The final version of record is available at http://dx.doi.org/10.1109/TEM.2015.2469680
Copyright (c) 2015 IEEE. Personal use is permitted. For any other purposes, permission must be obtained from the IEEE by emailing [email protected].
24
stage. As a result, the overall per-stage network structure is preserved and there is no need to
use averages or other forms of aggregation that could affect network metrics. An alternative
to this method is to analyse weekly or monthly network snapshots. However, the cost of this
alternative is to be exposed to higher network variability, which also imposes additional
difficulties to interpret the network results at the stage level. For simplicity, the analysis is
performed symmetrising the network [38, p. 216]. This is consistent with the fact that
communication networks tend to be reciprocal e.g. [33], and avoids the interpretational
limitations of applying network metrics such as eigenvector centrality [37] and clustering
coefficient [39], [40] to directed networks.
VI. ANALYTICAL RESULTS FROM THE CASE STUDY
In this section we present the results of applying our model of information flow between
activities to the organisation and process data from our case study. To focus on the evolving
information flow patterns discussed in section IV, we show here all network metrics
calculated by process stage only. Also, given the relatively small amount of conceptual
design work in this particular project, and the similarity of its expected information flow
patterns with system-level design, these two stages have been combined. Such combination
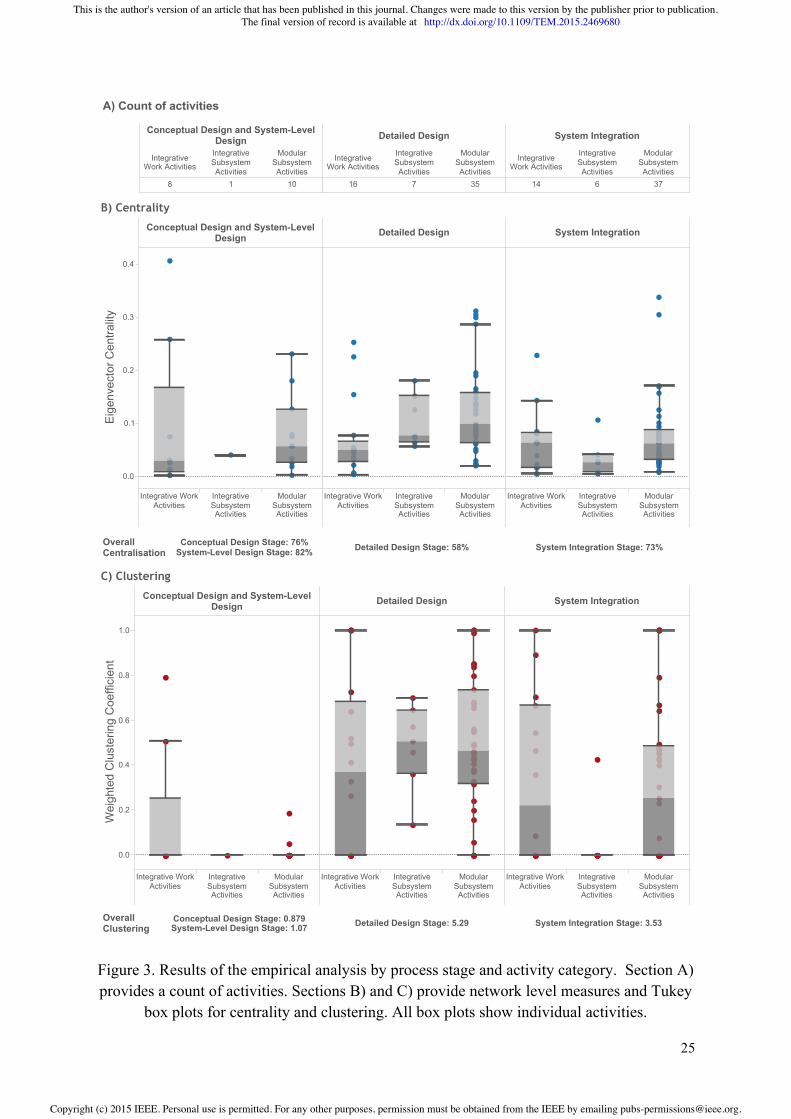
facilitates discussion of the results and keeps the focus on the most relevant patterns. Figure 3
and Table 5 show the results by stage and activity category.
This is the author's version of an article that has been published in this journal. Changes were made to this version by the publisher prior to publication.The final version of record is available at http://dx.doi.org/10.1109/TEM.2015.2469680
Copyright (c) 2015 IEEE. Personal use is permitted. For any other purposes, permission must be obtained from the IEEE by emailing [email protected].
25
Figure 3. Results of the empirical analysis by process stage and activity category. Section A) provides a count of activities. Sections B) and C) provide network level measures and Tukey
box plots for centrality and clustering. All box plots show individual activities.
Conceptual Design and System-LevelDesign Detailed Design System Integration
Integrative WorkActivities
IntegrativeSubsystemActivities
ModularSubsystemActivities
Integrative WorkActivities
IntegrativeSubsystemActivities
ModularSubsystemActivities
Integrative WorkActivities
IntegrativeSubsystemActivities
ModularSubsystemActivities
0.0
0.1
0.2
0.3
0.4
Eig
enve
ctor
Cen
tralit
y
B) Centrality
Conceptual Design and System-LevelDesign Detailed Design System Integration
Integrative WorkActivities
IntegrativeSubsystemActivities
ModularSubsystemActivities
Integrative WorkActivities
IntegrativeSubsystemActivities
ModularSubsystemActivities
Integrative WorkActivities
IntegrativeSubsystemActivities
ModularSubsystemActivities
0.0
0.2
0.4
0.6
0.8
1.0
Wei
ghte
d C
lust
erin
g C
oeffi
cien
t
C) Clustering
Conceptual Design Stage: 76%System-Level Design Stage: 82% Detailed Design Stage: 58% System Integration Stage: 73%Overall
Centralisation
Conceptual Design and System-LevelDesign
IntegrativeWork Activities
IntegrativeSubsystemActivities
ModularSubsystemActivities
Detailed Design
IntegrativeWork Activities
IntegrativeSubsystemActivities
ModularSubsystemActivities
System Integration
IntegrativeWork Activities
IntegrativeSubsystemActivities
ModularSubsystemActivities
1018 35716 37614
Overall Clustering
Conceptual Design Stage: 0.879System-Level Design Stage: 1.07 Detailed Design Stage: 5.29 System Integration Stage: 3.53
A) Count of activities
This is the author's version of an article that has been published in this journal. Changes were made to this version by the publisher prior to publication.The final version of record is available at http://dx.doi.org/10.1109/TEM.2015.2469680
Copyright (c) 2015 IEEE. Personal use is permitted. For any other purposes, permission must be obtained from the IEEE by emailing [email protected].
26
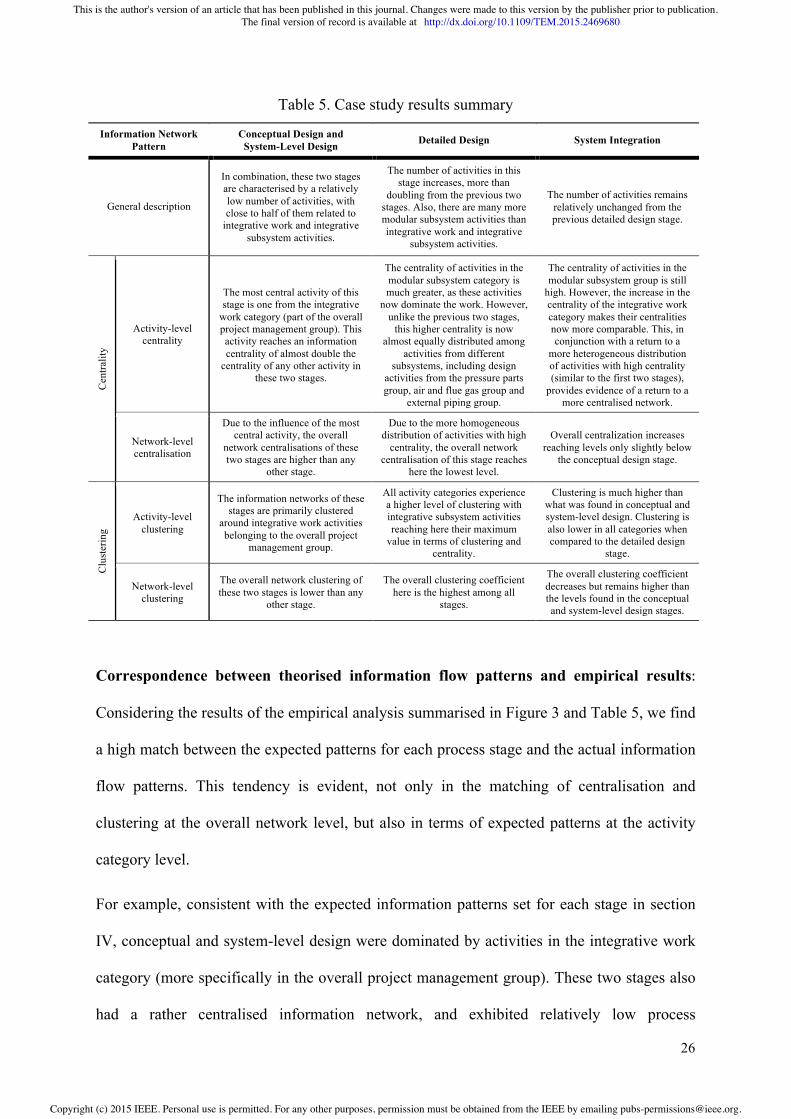
Table 5. Case study results summary
Information Network Pattern
Conceptual Design and System-Level Design Detailed Design System Integration
General description
In combination, these two stages are characterised by a relatively low number of activities, with close to half of them related to
integrative work and integrative subsystem activities.
The number of activities in this stage increases, more than
doubling from the previous two stages. Also, there are many more modular subsystem activities than integrative work and integrative
subsystem activities.
The number of activities remains relatively unchanged from the previous detailed design stage.
Cen
tralit
y
Activity-level centrality
The most central activity of this stage is one from the integrative
work category (part of the overall project management group). This activity reaches an information centrality of almost double the
centrality of any other activity in these two stages.
The centrality of activities in the modular subsystem category is much greater, as these activities
now dominate the work. However, unlike the previous two stages,
this higher centrality is now almost equally distributed among
activities from different subsystems, including design
activities from the pressure parts group, air and flue gas group and
external piping group.
The centrality of activities in the modular subsystem group is still
high. However, the increase in the centrality of the integrative work category makes their centralities now more comparable. This, in conjunction with a return to a
more heterogeneous distribution of activities with high centrality (similar to the first two stages),
provides evidence of a return to a more centralised network.
Network-level centralisation
Due to the influence of the most central activity, the overall
network centralisations of these two stages are higher than any
other stage.
Due to the more homogeneous distribution of activities with high
centrality, the overall network centralisation of this stage reaches
here the lowest level.
Overall centralization increases reaching levels only slightly below
the conceptual design stage.
Clu
ster
ing
Activity-level clustering
The information networks of these stages are primarily clustered
around integrative work activities belonging to the overall project
management group.
All activity categories experience a higher level of clustering with integrative subsystem activities reaching here their maximum
value in terms of clustering and centrality.
Clustering is much higher than what was found in conceptual and system-level design. Clustering is also lower in all categories when compared to the detailed design
stage.
Network-level clustering
The overall network clustering of these two stages is lower than any
other stage.
The overall clustering coefficient here is the highest among all
stages.
The overall clustering coefficient decreases but remains higher than the levels found in the conceptual and system-level design stages.
Correspondence between theorised information flow patterns and empirical results:"
Considering the results of the empirical analysis summarised in Figure 3 and Table 5, we find
a high match between the expected patterns for each process stage and the actual information
flow patterns. This tendency is evident, not only in the matching of centralisation and
clustering at the overall network level, but also in terms of expected patterns at the activity
category level."
For example, consistent with the expected information patterns set for each stage in section
IV, conceptual and system-level design were dominated by activities in the integrative work
category (more specifically in the overall project management group). These two stages also
had a rather centralised information network, and exhibited relatively low process
This is the author's version of an article that has been published in this journal. Changes were made to this version by the publisher prior to publication.The final version of record is available at http://dx.doi.org/10.1109/TEM.2015.2469680
Copyright (c) 2015 IEEE. Personal use is permitted. For any other purposes, permission must be obtained from the IEEE by emailing [email protected].

27
modularity. Detailed design was dominated by activities in the modular subsystem category
(including multiple activity groups), had a high process modularity (where coordination
tended to be local rather than global), and coordination was supported not only by integrative
work activities, but also by integrative subsystem activities. Finally, in system integration the
trend of high process modularity found in the previous stage was replaced by an increase in
overall centralisation, which can be linked to the expected subsystem integration needs."
VII. DISCUSSION
In light of our research questions, here we examine and discuss what has been presented in
the previous sections.
Research question #1: How can we model and analyse actual information flows between
activities through stages of complex engineering design projects?
This paper proposes a new model that integrates elements from previous network-based
process models, takes advantage of dynamic network analysis tools, and of increasingly
available rich data trails from activity logging systems, electronic project management tools,
and internal communication platforms such as emails. The model builds on previous research
on organisational information flow such as [20], [21], dynamic process models such as [26],
[27], and models that combine aspects of process and organisation architecture such as [4],
[33]–[36], providing altogether an improved analytical understanding of the dynamic
information flow through activities by process stages. In order to quantify information flow
changes at the activity and project level, this paper introduces the use of network centrality
and clustering metrics that provides a consistent and replicable platform for analysis.
Addressing the need for a comparison base against which to interpret empirical results of the
proposed model, we also translate qualitative systems engineering stage descriptions into a
This is the author's version of an article that has been published in this journal. Changes were made to this version by the publisher prior to publication.The final version of record is available at http://dx.doi.org/10.1109/TEM.2015.2469680
Copyright (c) 2015 IEEE. Personal use is permitted. For any other purposes, permission must be obtained from the IEEE by emailing [email protected].
28
theory of how information is expected to flow between activities in different engineering
system stages.
Research question #2: What are the implications, for theory and practice, of a model to
analyse actual information flows between activities?
The application of this model allowed us to identify distinct and measureable patterns in
information centrality and clustering associated with different stages of the design process.
Having means to identify such patterns is crucial to provide insights into the actual process
and to start uncovering causal explanations [14, p. 16]. For example, design patterns can be
compared against models that provide abstract descriptions of generic design processes. This
also allows for a theoretically grounded interpretation of the patterns in light of previous
research and what is suggested as best practices by prescriptive models.
In our case, the emergence of meaningful and interpretable patterns from the dynamic
analysis of a period of over three years and thousands of valued dyads serves as a positive
proof of concept for the approach proposed here. Moreover, and based on our empirical
results, we claim that the information flow patterns revealed are related to the progression of
the project, and as a consequence can be compared against idealised generic models in order
to identify, and if necessary correct, unexpected and potentially undesirable information flow
patterns.
Research implications: As a theoretical contribution, we provide evidence of relationships
between the proposed measures for information centrality and information clustering and
standard design stages. This serves to quantify information network properties for different
stages of the design process, enriches previous descriptions and interpretations of the stages,
and allows design researchers to develop process models that better fit observed project
patterns. Furthermore, the existence of such patterns also serves as a quantitative indication
This is the author's version of an article that has been published in this journal. Changes were made to this version by the publisher prior to publication.The final version of record is available at http://dx.doi.org/10.1109/TEM.2015.2469680
Copyright (c) 2015 IEEE. Personal use is permitted. For any other purposes, permission must be obtained from the IEEE by emailing [email protected].
29
of distinct information networks in the different product development [5] and systems
engineering stages [31]. This provides new evidence about the existence of distinct process
stages that goes beyond a qualitative description of observable changes in the process.
The observed information flow patterns also allow a meaningful macro-level categorisation
of activities into three classes based on their distinctive information centrality and clustering
patterns and evolution. This validates, complements, and expands the categories introduced
originally by Sosa [28]. We found that modular subsystem design activities, integrative
subsystem design activities, and integrative work design activities are distinguishable not
only based on company insights, observations, and static network models, but also based on
their characteristic network dynamics. This allows researchers to perform simplified
analyses, which instead of following the dynamics of each activity or activity group, only
need to study the patterns of three activity categories to visualise a meaningful distribution of
the information centrality and clustering linked to SE-V process stages [31].
Practical implications: Managerial implications include the provision of support to generate
a quantitative overview of real designing patterns and compare them against prescriptive
models, giving opportunities for reflections and changes when this is required. In particular,
we argue that under normal conditions, projects that implicitly or explicitly follow the SE-V
model, have a predictable pattern in terms of the evolution of information centrality and
clustering among key activity categories. Deviations from the expected patterns could be an
indication of a mismatch between the required architecture of information flows and the
actual information flows in the project. Depending on the assessment, such deviations may
require company actions or at least an understanding of the reasons for such a mismatch.
When our analysis is applied at a detailed activity level, and the appropriate tools to structure
and analyse existent information are in place, our model can also be used to highlight periods
in the process where multiple areas concurrently increase their information centrality,
This is the author's version of an article that has been published in this journal. Changes were made to this version by the publisher prior to publication.The final version of record is available at http://dx.doi.org/10.1109/TEM.2015.2469680
Copyright (c) 2015 IEEE. Personal use is permitted. For any other purposes, permission must be obtained from the IEEE by emailing [email protected].
30
potentially draining resources and generating complex coordination scenarios. Knowing more
about these periods can help to defer activities that do not need to be concurrently active,
while prioritising the ones with coupled subsystems that do require concurrency or iterations.
Another practical implication is based on an improved understanding of the nature of
integration activities in complex engineering design projects. Existing prescriptive models of
complex system design have either emphasised the high degree of coordination and
integration required in product development e.g. [44] or suggested that modular design
reduces the requirements for such coordination and integration e.g. [28]. In this paper, we
offer more specific prescriptive guidance based on actual information flow patterns over the
duration of the project – one that points to the difference between integrative and modular
design activities and their coordination efforts over the duration of the project.
Limitations: The benefits of the proposed approach are realised mainly on large scale,
complex engineering design projects following systems engineering stages. Conclusions will
largely depend on already having a good understanding of the process and organisation
architectures of the project under study. Furthermore, the approach is reliant on abundant and
accurate dynamic data traces captured during the design process.
VIII. CONCLUSIONS
Through the model developed in this paper we offer means to dynamically quantify and
analyse actual information flows between activities of complex engineering design projects,
filling a literature gap between dynamic process and dynamic organisation approaches. This
model allows connecting otherwise unknown designing patterns with stage-based models of
the design process. As a result, opportunities for design process improvements are created
based on active progress monitoring and analysis. With increasingly ubiquitous information
systems that continually create logs of activities, communication platforms, and our
This is the author's version of an article that has been published in this journal. Changes were made to this version by the publisher prior to publication.The final version of record is available at http://dx.doi.org/10.1109/TEM.2015.2469680
Copyright (c) 2015 IEEE. Personal use is permitted. For any other purposes, permission must be obtained from the IEEE by emailing [email protected].

31
simplified activity categorisation, this approach can be used to support project management
in engineering design projects without increasing reporting demands upon design engineers
and project managers. The three key contributions of this paper are the development of a
theory towards the evolution of information flows through systems engineering stages, a
methodological contribution consistent of a network model to quantify information flows
between activities, and an empirical application of the proposed approach that shows an
empirical relationship between information flow patterns and process stages which is
consistent with theoretical expectations.
Opportunities for further research include the examination of the same model and type of
datasets when the unit of analysis is people instead of activities, enabling the study of
questions at the organisational level. Also interesting are comparisons of information
centrality measures across different projects and industries, which would allow evaluating if
the overall patterns are ubiquitous or are project or industry specific. In addition, more
research is required to explore the evolution of other network measures and their interplay
with centrality measures. Finally, further studies could use dynamic network measures as
independent variables and performance as a dependent variable in order to establish concrete
connections between network structure and results.
REFERENCES
[1] M. Sosa, M. Gargiulo, and C. Rowles, “Inter-Team Technical Communication in Complex New Product Development Projects,” INSEAD Working Paper, 2014/42/TOM/OBH, 2014.
[2] S. D. Eppinger and T. R. Browning, Design Structure Matrix Methods and Applications. Cambridge: The MIT Press, 2012.
[3] E. Crawley, O. de Weck, S. D. Eppinger, C. L. Magee, J. Moses, W. Seering, J. Schindall, D. Wallace, and D. E. Whitney, “The Influence of Architecture in Engineering Systems,” Massachusetts Institute of Technology, Cambridge, 2004.
This is the author's version of an article that has been published in this journal. Changes were made to this version by the publisher prior to publication.The final version of record is available at http://dx.doi.org/10.1109/TEM.2015.2469680
Copyright (c) 2015 IEEE. Personal use is permitted. For any other purposes, permission must be obtained from the IEEE by emailing [email protected].
32
[4] C. Durugbo, W. Hutabarat, A. Tiwari, and J. R. Alcock, “Modelling collaboration using complex networks,” Inf. Sci. (Ny)., vol. 181, no. 15, pp. 3143–3161, Aug. 2011.
[5] K. T. Ulrich and S. D. Eppinger, Product Design and Development. New York: McGraw-Hill Irwin, 2012.
[6] C. M. Eckert, A. M. Maier, and C. McMahon, “Communication in Design,” in Design Process Improvement: A review of current practice, J. Clarkson and C. Eckert, Eds. Cambridge: Springer, 2005, p. 560.
[7] T. R. Browning and R. V Ramasesh, “A Survey of Activity Network-Based Process Models for Managing Product Development Projects,” Prod. Oper. Manag., vol. 16, no. 2, pp. 217–240, Jan. 2007.
[8] D. C. Wynn, “Model-Based Approaches to Support Process Improvement in Complex Product Development,” PhD Thesis, University of Cambridge, 2007.
[9] K. Gericke and L. Blessing, “An analysis of design process models across disciplines,” in Proceedings of DESIGN 2012, the 12th International Design Conference, 2012, pp. 171–180.
[10] V. Hubka, M. M. Andreasen, and W. E. Eder, Practical Studies in Systematic Design. London: Butterworth-Heinemann, 1988.
[11] L. L. Bucciarelli, “An ethnographic perspective on engineering design,” Des. Stud., vol. 9, no. 3, pp. 159–168, Jul. 1988.
[12] H. A. Simon, The Sciences of the Artificial. Cambridge: The MIT Press, 1996.
[13] A. M. Maier, C. M. Eckert, and P. J. Clarkson, “A meta-model for communication in engineering design,” CoDesign, vol. 1, no. 4, pp. 243–254, Dec. 2005.
[14] P. J. Clarkson and C. M. Eckert, Design process improvement: A review of current practice. London: Springer London, 2005.
[15] T. Allen, “Organizational structure, information technology and R&D productivity,” IEEE Trans. Eng. Manag., vol. EM-33, no. 4, pp. 212–217, 1986.
[16] D. A. Batallas and A. A. Yassine, “Information Leaders in Product Development Organizational Networks: Social Network Analysis of the Design Structure Matrix,” IEEE Trans. Eng. Manag., vol. 53, no. 4, pp. 570–582, Nov. 2006.
[17] D. H. Sonnenwald, “Communication roles that support collaboration during the design process,” Des. Stud., vol. 17, pp. 277–301, 1996.
[18] J. Kratzer, H. Gemuenden, and C. Lettl, “The Organizational Design of Large R&D Collaborations and Its Effect on Time and Budget Efficiency: The Contrast Between Blueprints and Reality,” IEEE Trans. Eng. Manag., vol. 58, no. 2, pp. 295–306, 2011.
This is the author's version of an article that has been published in this journal. Changes were made to this version by the publisher prior to publication.The final version of record is available at http://dx.doi.org/10.1109/TEM.2015.2469680
Copyright (c) 2015 IEEE. Personal use is permitted. For any other purposes, permission must be obtained from the IEEE by emailing [email protected].
33
[19] L. Hossain, “Effect of organisational position and network centrality on project coordination,” Int. J. Proj. Manag., vol. 27, no. 7, pp. 680–689, Oct. 2009.
[20] L. Hossain, S. T. Murshed, and S. Uddin, “Communication network dynamics during organizational crisis,” J. Informetr., vol. 7, no. 1, pp. 16–35, Jan. 2013.
[21] Y. H. Kidane and P. A. Gloor, “Correlating temporal communication patterns of the Eclipse open source community with performance and creativity,” Comput. Math. Organ. Theory, vol. 13, no. 1, pp. 17–27, 2007.
[22] J. A. Gopsill, S. Jones, C. Snider, L. Shi, C. McMahon, and B. J. Hicks, “Understanding the engineering design process through the evolution of engineering digital objects,” in Proceedings of the 13th International Design Conference (DESIGN 2014), 2014, pp. 1773–1784.
[23] P. Cash, T. Stanković, and M. Štorga, “Using visual information analysis to explore complex patterns in the activity of designers,” Des. Stud., vol. 35, no. 1, pp. 1–28, Jan. 2014.
[24] D. Braha and Y. Bar-Yam, “Information flow structure in large-scale product development organizational networks,” J. Inf. Technol., vol. 19, no. 4, pp. 244–253, Nov. 2004.
[25] S. K. Sim and A. H. B. Duffy, “Towards an ontology of generic engineering design activities,” Res. Eng. Des., vol. 14, no. 4, pp. 200–223, Nov. 2003.
[26] S. T. Collins, J. Bradley, and A. A. Yassine, “Analyzing Product Development Task Networks to Examine Organizational Change,” IEEE Trans. Eng. Manag., vol. 57, no. 3, pp. 513–525, Aug. 2010.
[27] D. Braha and Y. Bar-Yam, “The Statistical Mechanics of Complex Product Development: Empirical and Analytical Results,” Manage. Sci., vol. 53, no. 7, pp. 1127–1145, Jul. 2007.
[28] M. E. Sosa, S. D. Eppinger, and C. M. Rowles, “Identifying Modular and Integrative Systems and Their Impact on Design Team Interactions,” J. Mech. Des., vol. 125, no. 2, p. 240, 2003.
[29] A. M. Maier, M. Kreimeyer, C. Hepperle, C. M. Eckert, U. Lindemann, and P. J. Clarkson, “Exploration of Correlations between Factors Influencing Communication in Complex Product Development,” Concurr. Eng., vol. 16, no. 1, pp. 37–59, Mar. 2008.
[30] D. Wynn and J. Clarkson, “Models of Designing,” in Design Process Improvement: A review of current practice, J. Clarkson and C. Eckert, Eds. London: Springer, 2005, p. 571.
[31] C. Haskins, K. Forsberg, M. Krueger, D. Walden, and R. D. Hamelin, Systems Engineering Handbook, no. October. International Council on Systems Engineering, 2011.
This is the author's version of an article that has been published in this journal. Changes were made to this version by the publisher prior to publication.The final version of record is available at http://dx.doi.org/10.1109/TEM.2015.2469680
Copyright (c) 2015 IEEE. Personal use is permitted. For any other purposes, permission must be obtained from the IEEE by emailing [email protected].
34
[32] T. J. Howard, S. J. Culley, and E. Dekoninck, “Describing the creative design process by the integration of engineering design and cognitive psychology literature,” Des. Stud., vol. 29, no. 2, pp. 160–180, Mar. 2008.
[33] M. D. Morelli, S. D. Eppinger, and R. K. Gulati, “Predicting technical communication in product development organizations,” IEEE Trans. Eng. Manag., vol. 42, no. 3, pp. 215–222, 1995.
[34] M. E. Sosa, S. D. Eppinger, and C. M. Rowles, “The Misalignment of Product Architecture and Organizational Structure in Complex Product Development,” Manage. Sci., vol. 50, no. 12, pp. 1674–1689, Dec. 2004.
[35] A. A. Yassine, D. E. Whitney, S. Daleiden, and J. Lavine, “Connectivity maps: Modeling and analysing relationships in product development processes,” J. Eng. Des., vol. 14, no. 3, pp. 377–394, 2003.
[36] M. S. Maurer, “Structural Awareness in Complex Product Design,” PhD Thesis, Technischen Universität München, 2007.
[37] P. Bonacich, “Power and Centrality: A Family of Measures,” Am. J. Sociol., vol. 92, no. 5, pp. 1170–1182, 1987.
[38] S. Wasserman and K. Faust, Social Network Analysis: Methods and Applications. Cambridge: Cambridge University Press, 1994.
[39] A. Barrat, M. Barthélemy, R. Pastor-Satorras, and A. Vespignani, “The architecture of complex weighted networks.,” Proc. Natl. Acad. Sci. U. S. A., vol. 101, pp. 3747–3752, 2004.
[40] D. J. Watts and S. H. Strogatz, “Collective dynamics of ‘small-world’ networks,” Nature, vol. 393, no. 6684, pp. 440–442, 1998.
[41] R. A. Hanneman and M. Riddle, Introduction to social network methods. Riverside: University of California, 2005.
[42] S. Borgatti, “Centrality and network flow,” Soc. Networks, vol. 27, no. 1, pp. 55–71, Jan. 2005.
[43] S. Fortunato, “Community detection in graphs,” Phys. Rep., no. 486, pp. 75–174, Jun. 2010.
[44] T. R. Browning, “Process integration using the design structure matrix,” Syst. Eng., vol. 5, no. 3, pp. 180–193, 2002.
This is the author's version of an article that has been published in this journal. Changes were made to this version by the publisher prior to publication.The final version of record is available at http://dx.doi.org/10.1109/TEM.2015.2469680
Copyright (c) 2015 IEEE. Personal use is permitted. For any other purposes, permission must be obtained from the IEEE by emailing [email protected].
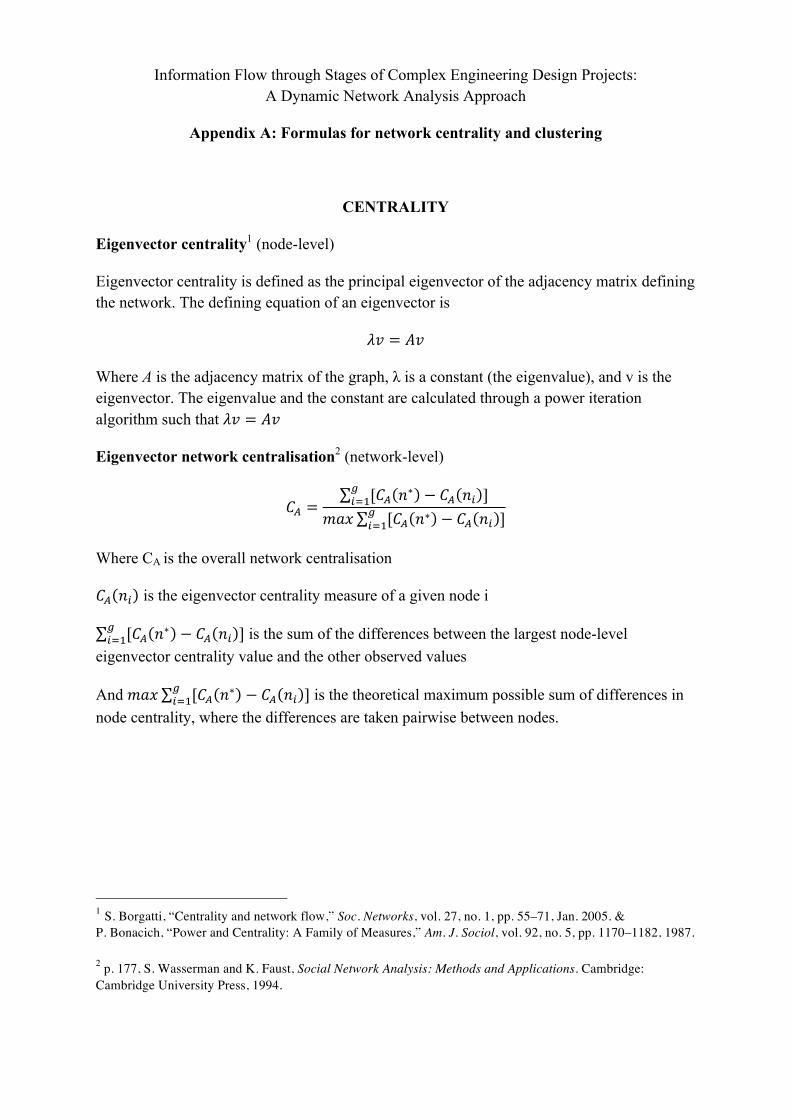
Information Flow through Stages of Complex Engineering Design Projects: A Dynamic Network Analysis Approach
Appendix A: Formulas for network centrality and clustering
CENTRALITY
Eigenvector centrality1 (node-level)
Eigenvector centrality is defined as the principal eigenvector of the adjacency matrix defining the network. The defining equation of an eigenvector is
!" = $"
Where A is the adjacency matrix of the graph, λ is a constant (the eigenvalue), and v is the eigenvector. The eigenvalue and the constant are calculated through a power iteration algorithm such that !" = $"
Eigenvector network centralisation2 (network-level)
%& =[%& (∗ − %& (+ ]-
+./012 [%& (∗ − %& (+ ]-
+./
Where CA is the overall network centralisation
%& (+ is the eigenvector centrality measure of a given node i
[%& (∗ − %& (+ ]-+./ is the sum of the differences between the largest node-level
eigenvector centrality value and the other observed values
And 012 [%& (∗ − %& (+ ]-+./ is the theoretical maximum possible sum of differences in
node centrality, where the differences are taken pairwise between nodes.
!!!!!!!!!!!!!!!!!!!!!!!!!!!!!!!!!!!!!!!!!!!!!!!!!!!!!!!!1 S. Borgatti, “Centrality and network flow,” Soc. Networks, vol. 27, no. 1, pp. 55–71, Jan. 2005. & P. Bonacich, “Power and Centrality: A Family of Measures,” Am. J. Sociol, vol. 92, no. 5, pp. 1170–1182, 1987.
2 p. 177, S. Wasserman and K. Faust, Social Network Analysis: Methods and Applications. Cambridge: Cambridge University Press, 1994.

! 2!
CLUSTERING
Weighted clustering coefficient3 (node-level)
%+3 =1
5+(7+ − 1)(9+: + 9+<)
2:,<
1+:1+<1:<
Where %+3 is the weighted clustering coefficient of node i
i is the focal node and j and h are nodes connected to i
k is the number of connections of node i
Si is the strength of the connections to node i, strength which is based on the total weight of the node connections (k).
Wij is the intensity of the interaction between focal nodes i and connected node j (for details about the calculation of this intensity please see Barrat et. al. 2004)
And aij is the adjacency matrix that includes focal node i and connected node j
Weighted overall graph clustering coefficient4 (network-level)
The overall graph-clustering coefficient is the average of the densities of the neighborhoods of all of the nodes. The "weighted" version gives weight to the neighborhood densities proportional to their size (nodes with larger neighborhoods get more weight in computing the average density).
!!!!!!!!!!!!!!!!!!!!!!!!!!!!!!!!!!!!!!!!!!!!!!!!!!!!!!!!3 A. Barrat, M. Barthélemy, R. Pastor-Satorras, and A. Vespignani, “The architecture of complex weighted networks.” Proc. Natl. Acad. Sci. U. S. A., vol. 101, pp. 3747–3752, 2004.
4 R. A. Hanneman and M. Riddle, Introduction to social network methods. Riverside: University of California, 2005.
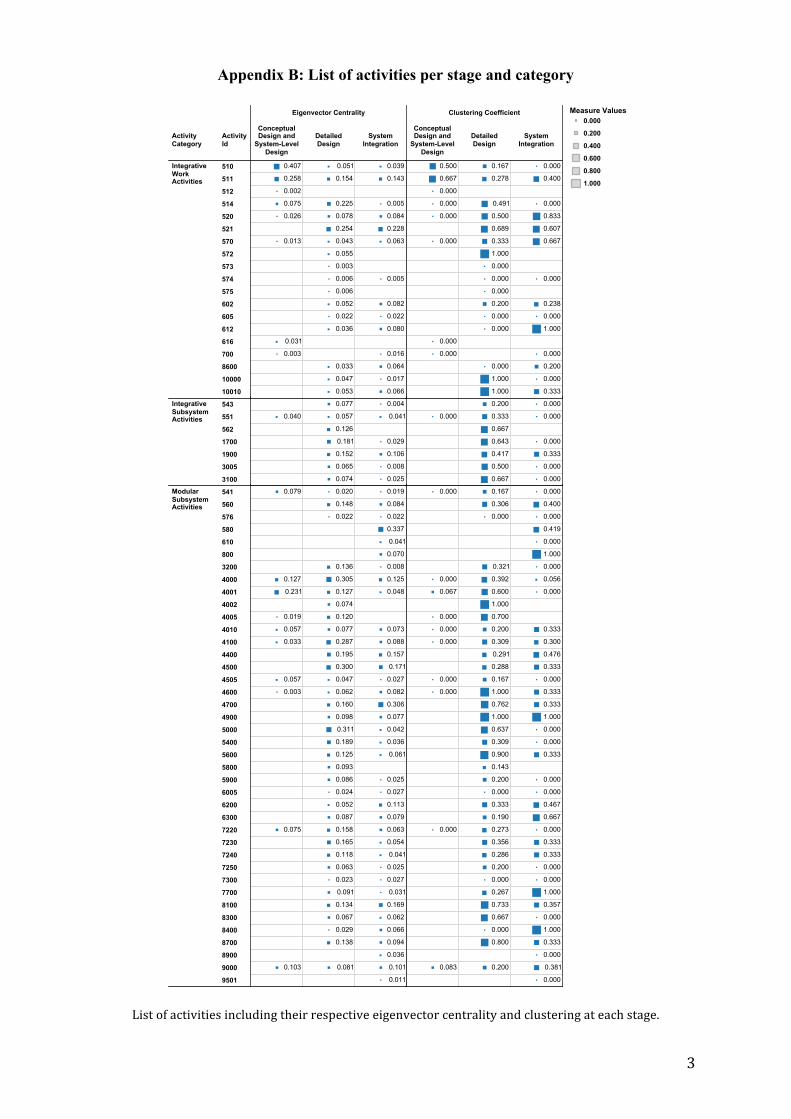
! 3!
Appendix B: List of activities per stage and category
!!
List!of!activities!including!their!respective!eigenvector!centrality!and!clustering!at!each!stage.!
ActivityCategory
ActivityId
Eigenvector Centrality
ConceptualDesign and
System-LevelDesign
DetailedDesign
SystemIntegration
Clustering Coefficient
ConceptualDesign and
System-LevelDesign
DetailedDesign
SystemIntegration
IntegrativeWorkActivities
510
511
512
514
520
521
570
572
573
574
575
602
605
612
616
700
8600
10000
10010
IntegrativeSubsystemActivities
543
551
562
1700
1900
3005
3100
ModularSubsystemActivities
541
560
576
580
610
800
3200
4000
4001
4002
4005
4010
4100
4400
4500
4505
4600
4700
4900
5000
5400
5600
5800
5900
6005
6200
6300
7220
7230
7240
7250
7300
7700
8100
8300
8400
8700
8900
9000
9501
0.066
0.017
0.064
0.016
0.080
0.022
0.082
0.005
0.063
0.228
0.084
0.005
0.143
0.039
0.053
0.047
0.033
0.036
0.022
0.052
0.006
0.006
0.003
0.055
0.043
0.254
0.078
0.225
0.154
0.051
0.003
0.031
0.013
0.026
0.075
0.002
0.258
0.407
0.333
0.000
0.200
0.000
1.000
0.000
0.238
0.000
0.667
0.607
0.833
0.000
0.400
0.000
1.000
1.000
0.000
0.000
0.000
0.200
0.000
0.000
0.000
1.000
0.333
0.689
0.500
0.491
0.278
0.167
0.000
0.000
0.000
0.000
0.000
0.000
0.667
0.500
0.025
0.008
0.106
0.029
0.041
0.004
0.074
0.065
0.152
0.181
0.126
0.057
0.077
0.040
0.000
0.000
0.333
0.000
0.000
0.000
0.667
0.500
0.417
0.643
0.667
0.333
0.200
0.000
0.011
0.101
0.036
0.094
0.066
0.062
0.169
0.031
0.027
0.025
0.041
0.054
0.063
0.079
0.113
0.027
0.025
0.061
0.036
0.042
0.077
0.306
0.082
0.027
0.171
0.157
0.088
0.073
0.048
0.125
0.008
0.070
0.041
0.337
0.022
0.084
0.019
0.081
0.138
0.029
0.067
0.134
0.091
0.023
0.063
0.118
0.165
0.158
0.087
0.052
0.024
0.086
0.093
0.125
0.189
0.311
0.098
0.160
0.062
0.047
0.300
0.195
0.287
0.077
0.120
0.074
0.127
0.305
0.136
0.022
0.148
0.020
0.103
0.075
0.003
0.057
0.033
0.057
0.019
0.231
0.127
0.079
0.000
0.381
0.000
0.333
1.000
0.000
0.357
1.000
0.000
0.000
0.333
0.333
0.000
0.667
0.467
0.000
0.000
0.333
0.000
0.000
1.000
0.333
0.333
0.000
0.333
0.476
0.300
0.333
0.000
0.056
0.000
1.000
0.000
0.419
0.000
0.400
0.000
0.200
0.800
0.000
0.667
0.733
0.267
0.000
0.200
0.286
0.356
0.273
0.190
0.333
0.000
0.200
0.143
0.900
0.309
0.637
1.000
0.762
1.000
0.167
0.288
0.291
0.309
0.200
0.700
1.000
0.600
0.392
0.321
0.000
0.306
0.167
0.083
0.000
0.000
0.000
0.000
0.000
0.000
0.067
0.000
0.000
Full tableMeasure Values
0.000
0.200
0.400
0.600
0.800
1.000
Eigenvector Centrality and Clustering Coefficient broken down by Design Stages vs. Activity Category and Activity Id. Size shows Eigenvector Centrality and Clustering Coefficient. The marks are labeled by Eigenvec-tor Centrality and Clustering Coefficient. The data is filtered on Node Type, which keeps Activity.