Embed Size (px)
Citation preview
46
American Economic Journal: Applied Economics 2 (July 2010): 46–59http://www.aeaweb.org/articles.php?doi=10.1257/app.2.3.46
“[With a mobile phone], in record time, I have all sorts of information from markets near and far … ”
— Grain trader in Magaria, Niger1
Economic theory often relies upon the assumption that market agents have suf-ficient information to engage in optimal arbitrage, and that this information is
symmetric. In reality, however, information is rarely costless or symmetric. Due partly to costly information, excess price dispersion across markets is a common occurrence (George J. Stigler 1961; Jeffrey R. Brown and Austan Goolsbee 2002) and is especially acute in developing countries (Robert Jensen 2007). In this con-text, a new technology for collecting information can have important implications for market agents’ behavior and hence the performance of nascent markets.
This paper estimates the impact of mobile phones on agricultural price disper-sion in one of the world’s poorest countries, Niger. Between 2001 and 2006, mobile phone service was phased-in throughout the country. As grain traders have tradition-ally traveled to markets to obtain price information for agricultural goods, mobile phones should have reduced their search costs, allowing them to search over a larger number of markets more quickly. This effect was supported by the grain traders
1 Based upon interviews with the author between 2005 and 2007.
* Department of Economics and the Fletcher School, Tufts University, 160 Packard Avenue, Medford, MA 02155 and Center for Global Development (e-mail: [email protected]). This research was partially funded by Rocca Dissertation Fellowship, Catholic Relief Services, CARE, World Vision, the Ford Foundation, and UC-Berkeley’s Center for International and Development Economics Research (CIDER). I am grateful to two anon-ymous referees for valuable comments. Ali Abdoulaye, Erin Baldridge, Ousseini Sountalma, Lisa Washington-Sow, and the data collection team in Niger provided invaluable support. I would like to thank Maximilian Auffhammer, Guido Imbens, Kristin Kiesel, Edward Miguel, Elisabeth Sadoulet, Brian Wright, and seminar participants at Bates College, Boston College, the Center for Global Development, Fordham University, Tufts University, the University of Delaware, University of California-Berkeley, University of California-Davis, University of Oxford, University of Virginia, Williams College, the Bureau for Research and Economic Analysis of Development (BREAD), Pacific Development (PACDEV). All errors are my own.
† To comment on this article in the online discussion forum, or to view additional materials, visit the articles page at http://www.aeaweb.org/articles.php?doi=10.1257/app.2.3.46.
Information from Markets Near and Far:Mobile Phones and Agricultural Markets in Niger†
By Jenny C. Aker*
Price dispersion across markets is common in developing countries. Using novel market and trader-level data, this paper provides esti-mates of the impact of mobile phones on price dispersion across grain markets in Niger. The introduction of mobile phone service between 2001 and 2006 explains a 10 to 16 percent reduction in grain price dispersion. The effect is stronger for market pairs with higher transport costs. (JEL O13, O33, Q11, Q13)
ContentsInformation from Markets Near and Far: Mobile Phones and Agricultural Markets in Niger† 46
I. Background on Niger 48A. Agricultural Markets in Niger 48B. Expansion of Mobile Phone Coverage 48II. Data and Measurement 49III. Empirical Strategy 50IV. The Impact of Mobile Phones on Market Performance 51A. Average Impact of Mobile Phones 51B. Heterogeneity of the Treatment Effect 54V. Alternative Explanations 55A. Threats to Identification of Mobile Phone Coverage 55B. Spillover Effects and Market Collusion 55VI. Conclusion 57References 58
VoL. 2 No. 3 47AkEr: moBILE PhoNEs ANd grAIN mArkETs IN NIgEr
themselves, one of whom stated, “[With a mobile phone], I know the price for US $2, rather than traveling (to the market), which costs US $20.”2 In response to this reduction in search costs, the introduction of mobile phones should reduce price dispersion across markets.
I exploit the exogenous variation of mobile phone rollout to identify its impact on agricultural market performance in Niger. This involves estimating a difference-in-differences (DD) model with pooled treatments. This approach differs from the existing empirical literature on search technology and market performance in two ways. First, the quasi-experimental nature of mobile phone rollout in Niger pro-vides an opportunity to partially distinguish the impact of mobile phone coverage from other confounding factors. Second, to correct for potential selection bias due to observables, I combine DD estimation with matching techniques.
For the empirical investigation, I construct two primary datasets. The first con-tains data on prices, transaction costs, rainfall and mobile phone coverage obtained from a variety of primary and secondary sources. The dataset includes monthly agri-cultural price data over an eight year period (1999–2006) across 42 domestic and cross-border markets. The second dataset is a detailed panel survey of traders and transporters collected by the author between 2005 and 2007.
I find that the introduction of mobile phone coverage reduces agricultural price dispersion across markets by 10 percent. The effect is larger for markets that are more remote and those connected by unpaved roads. The effect is also larger when a higher percentage of markets have coverage, suggestive of network externalities. I also examine alternative explanations for the empirical results, such as spillover effects and collusive behavior among traders, but find little evidence.
This paper is broadly related to the literature on the relationship between tele-communications infrastructure and market performance. Most of these papers have examined the impact of telecommunications in high-income countries (Lars-Hendrik Röller and Leonard Waverman 2001; Brown and Goolsbee 2002) or on a specific perishable commodity (Jensen 2007).3 In contrast, this paper provides new evidence for a category of commodity that is storable and produced in a variety of countries within sub-Saharan Africa.
The rest of this paper proceeds as follows. Section I provides an overview of grain markets in Niger and the introduction of mobile phones into the country. Section II presents the data, and Section III presents the empirical strategy. Section IV discusses the main empirical results, followed by robustness checks in Section V. Section VI concludes.
2 Based upon interviews with the author between 2005 and 2007. 3 Megumi Muto and Takashi Yamano (2009) examine the impact of mobile phone coverage on farmers’ market
participation for bananas and maize in Uganda. Aparajita Goyal (2010) assesses the impact of internet kiosks on wholesale soybean price levels in India.

48 AmErIcAN EcoNomIc JoUrNAL: APPLIEd EcoNomIcs JULy 2010
I. Background on Niger
A. Agricultural markets in Niger
With a per capita gross national product (GNP) of US $230 and an estimated 85 percent of the population living on less than US $2 per day, Niger is ranked last on the United Nations’ Human Development Index (United Nations Development Program 2009). Agriculture employs more than 80 percent of the total population and contributes approximately 40 percent to gross domestic product (GDP). The majority of the population consists of rural subsistence farmers, who depend on rain-fed agri-culture as their main source of food and income. The main grains cultivated are millet, sorghum, and rice, with cash crops including cowpeas, peanuts, and sesame.
A variety of market agents are involved in moving grains from the farm to rural and urban consumers in Niger. These include farmers, who produce, sell, and buy grains; traders, including retailers, intermediaries, semi-wholesalers, and wholesal-ers; and transporters. Farmers sell their production directly to intermediaries, who sell directly to wholesalers in local markets. Wholesalers are primarily responsible for inter-regional trade, selling the commodity to other wholesalers, retailers, or consum-ers. As there is only one growing season per year, both traders and farmers engage in intra-annual storage, although inter-annual storage is limited (Aker 2008).
Traders buy and sell commodities through a system of traditional markets, each of which is held on a weekly basis. The density of markets varies considerably by geographic region, with inter-market distances for which trade occurs ranging from 8 kilometers to over 1,200 kilometers. The number of traders per market ranges from 24 to 353, with retailers accounting for over 50 percent of all traders. While an agricultural market information system has existed in Niger since the 1990s, 89 percent of grain traders surveyed by the author stated that they primarily obtain price information through their own personal and professional networks.4
B. Expansion of mobile Phone coverage
Mobile phone service first became available in part of Niger in October 2001. Although private mobile phone companies initially intended to provide universal coverage, due to high fixed costs and uncertainty about demand, mobile phone ser-vice was rolled out gradually. The initial criteria for introducing mobile phone cov-erage to a location were twofold: whether the town was an urban center, and whether it was located near an international border.5 During the first three years of mobile phone expansion, the average distance between markets with coverage was 367 km.
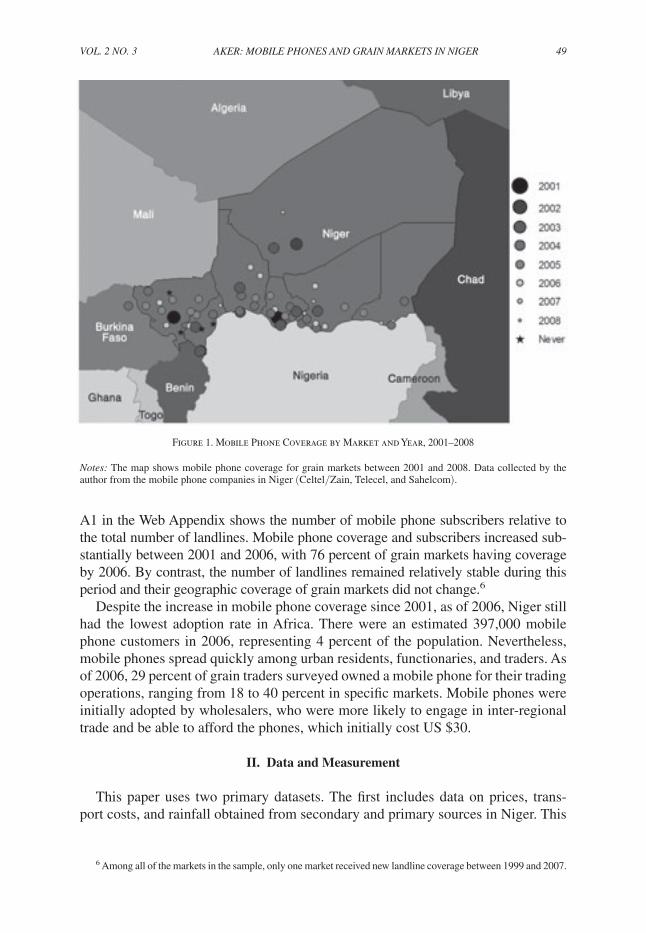
Although landlines existed prior to 2001, Niger has the second lowest landline cov-erage in the world, with only 2 landlines available per 1,000 people, as compared to 113 landlines per 1,000 people in South Africa (World Bank 2005). Figure 1 shows the spatial rollout of mobile phone coverage by market and by year, whereas Figure
4 The agricultural market information system (AMIS) in Niger did not change the composition of the markets from which it collects price data between 2000 and 2007.
5 Based upon the author’s interviews with mobile phone companies in Niger.
VoL. 2 No. 3 49AkEr: moBILE PhoNEs ANd grAIN mArkETs IN NIgEr
A1 in the Web Appendix shows the number of mobile phone subscribers relative to the total number of landlines. Mobile phone coverage and subscribers increased sub-stantially between 2001 and 2006, with 76 percent of grain markets having coverage by 2006. By contrast, the number of landlines remained relatively stable during this period and their geographic coverage of grain markets did not change.6
Despite the increase in mobile phone coverage since 2001, as of 2006, Niger still had the lowest adoption rate in Africa. There were an estimated 397,000 mobile phone customers in 2006, representing 4 percent of the population. Nevertheless, mobile phones spread quickly among urban residents, functionaries, and traders. As of 2006, 29 percent of grain traders surveyed owned a mobile phone for their trading operations, ranging from 18 to 40 percent in specific markets. Mobile phones were initially adopted by wholesalers, who were more likely to engage in inter-regional trade and be able to afford the phones, which initially cost US $30.
II. Data and Measurement
This paper uses two primary datasets. The first includes data on prices, trans-port costs, and rainfall obtained from secondary and primary sources in Niger. This
6 Among all of the markets in the sample, only one market received new landline coverage between 1999 and 2007.
Figure 1. Mobile Phone Coverage by Market and Year, 2001–2008
Notes: The map shows mobile phone coverage for grain markets between 2001 and 2008. Data collected by the author from the mobile phone companies in Niger (Celtel/Zain, Telecel, and Sahelcom).

50 AmErIcAN EcoNomIc JoUrNAL: APPLIEd EcoNomIcs JULy 2010
dataset includes monthly agricultural prices over an eight year period (1999–2006) across 37 domestic markets. In addition, monthly data on gas prices, mobile phone and landline coverage, road quality, trade flows, and district population levels were also collected.7
The second dataset is based on a survey of traders, transporters, and market resource persons in Niger collected by the author between 2005 and 2007. The sur-vey includes 415 traders located in 35 markets across 6 geographic regions of Niger. Prior to the first round of data collection, I developed a census of all grain markets, and markets were randomly sampled based upon the criteria of geographic location and market size. Within each market, a census of all grain traders operating on the market was conducted, including the trader type and gender.8
III. Empirical Strategy
The consumer search literature mainly uses three measures of price dispersion: the sample variance of prices across markets over time (John W. Pratt, David A. Wise, and Richard Zeckhauser 1979), the coefficient of variation (CV) across mar-kets in a particular period (E. Woodrow Eckard 2004; Jensen 2007), and the maxi-mum and minimum (max-min) prices across markets (Pratt, Wise, and Zeckhauser 1979; Jensen 2007). In his analysis of the impact of mobile phones on the fisheries sector in Kerala, India, Jensen (2007) uses the max-min and CV as measures of price dispersion. Mobile phone coverage in Kerala was phased in by geographic region, and markets were in close geographic proximity (an average of 15 km apart). By contrast, mobile phone coverage in Niger was phased in throughout the country, with distances between mobile phone markets ranging from 8 km to 1,262 km in a single year. Consequently, the CV among mobile phone markets is not appropriate for the empirical setting of this paper. My primary measure of market performance is therefore the absolute value of the price difference between markets j and k at month t, defined as y jk,t = | p jt − p kt |.9
Letting y jk,t represent the value of the outcome for millet in market pair jk at month t, I examine the change in y jk,t before and after the introduction of mobile phone towers in each market pair. The regression model is the following:
(1) y jk,t = β0 + β1 cell jk,t + X jk,t ′ γ + α jk + θ t + μ jk,t
where cell jk,t is a binary variable equal to one in month t if both markets j and k have mobile phone coverage, and zero otherwise.10 X jk,t is a vector of variables that affect spatial price dispersion, such as transport costs and the occurrence of drought. The
7 Secondary data sources in Niger include AMIS for grain price data; the syndicat des Transporteurs routiers for transport cost data; the direction de la météo for rainfall data; and the mobile phone service providers for mobile phone coverage.
8 Key trader and market-level variables from the panel data survey are described in Table A1 (Web Appendix).9 As prices are likely to change proportionally rather than by a fixed amount, I also use log transformation for
the dependent variable.10 In this specification, treatment is defined as the presence of a mobile phone tower in both markets in a pair,
not mobile phone adoption. This assumes that once mobile phone coverage is available, traders operating in the market have access to the technology.

VoL. 2 No. 3 51AkEr: moBILE PhoNEs ANd grAIN mArkETs IN NIgEr
α jk ’s are market-pair fixed effects, including controlling for geographic location, urban status, and market size. The θ t ’s are time fixed effects. I also include market pair-specific time trends in some specifications. μ jk,t is an error term with zero con-ditional mean. The parameter of interest is β1 . The key identifying assumption is that trends in outcomes are the same for both treated and untreated market pairs.11
Assuming that market performance in period t depends on performance in previous periods, I add lagged values of the dependent variable to the right-hand side of equa-tion (1), controlling for endogeneity by using the Arellano-Bond estimator (Manuel Arellano and Stephen Bond 1991).12 To assess the heterogeneous impact of mobile phones across markets, I interact the mobile phone variable with distance and road quality. Finally, to examine whether mobile phones are more useful as more markets receive mobile phone coverage, I re-estimate equation (1) on a yearly basis.
As equation (1) is a time-series dyadic linear regression, the standard errors must be corrected for spatial and temporal dependence. I first cluster the standard errors at the market pair level, which allows for dependence between market pairs over time. I then include market-specific fixed effects and cluster by quarter, which corrects for spatial dependence and allows for some dependence between months. As a robustness check, I employ dyadic standard errors (Marcel Fafchamps and Flore Gubert 2007), which correct for spatial dependence, but do not allow for temporal independence.13
IV. The Impact of Mobile Phones on Market Performance
A. Average Impact of mobile Phones
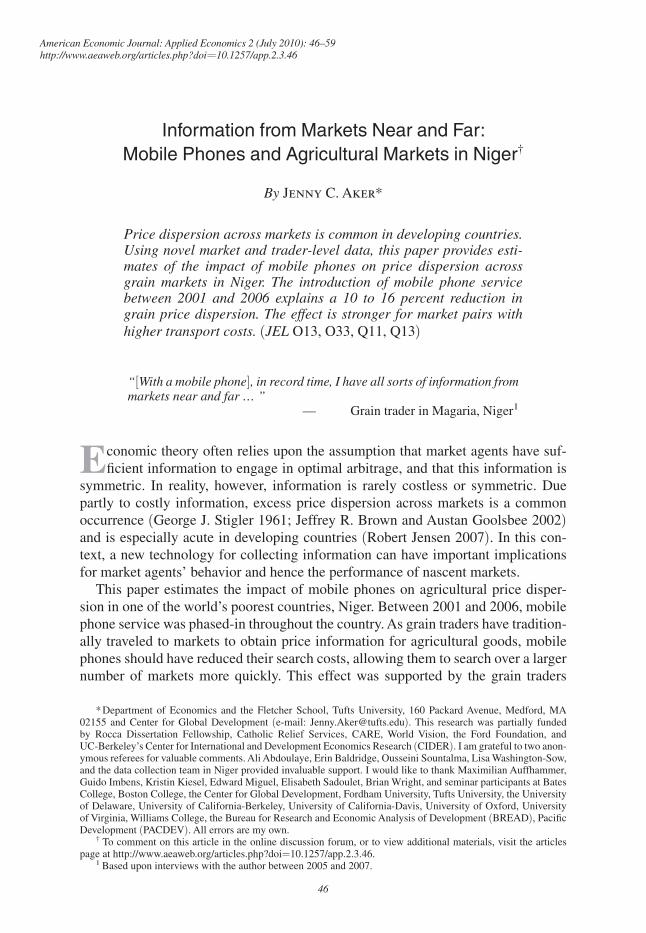
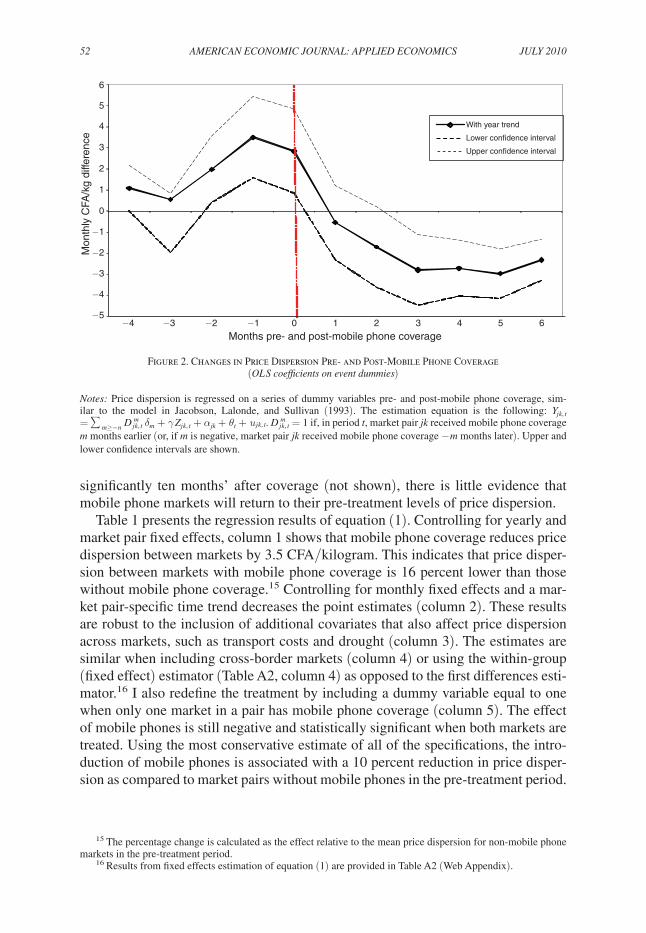
Figure 2 summarizes the key results of this paper. The graph shows a regres-sion of inter-market price dispersion on a series of dummy variables (d jk,t
m ) for the
number of months before and after a market pair received mobile phone cover-age between 2001 and 2006 (Louis S. Jacobson, Robert J. LaLonde, and Daniel G. Sullivan 1993).14 The introduction of mobile phone coverage is associated with a significant reduction in grain price dispersion across markets. This reduction is strongest in the initial three months after coverage, with an average 2.5 CFA/kg reduction in price dispersion across markets. This represents a 10.9 percent reduc-tion in grain price dispersion as compared with pre-treatment levels. The marginal impact remains fairly stable over time, as price dispersion in mobile phone markets is 2.3 CFA per kg lower 6 months after coverage. Since the effect does not decline
11 While equation (1) can either be estimated via fixed effects (FE) transformation or first differencing (FD), I use first-differencing to allow for a possible nonstationary process. Fixed effects results are presented in Table A2 for comparison.
12 I test for autocorrelation in the first-differenced errors and cannot reject the null hypothesis of no autocorrela-tion of order 2 in the residuals.
13 I also use a variant of the nonparametric permutation test (Bradley Efron and Robert Tibshirani 1993; Michael L. Anderson 2008), which computes the null distribution of the test statistic under the assumptions of random assignment and no treatment effect.
14 I strongly reject the hypothesis that the OLS coefficients are jointly equal to zero post treatment. Each of the post-treatment OLS coefficients is statistically significant at the 1 percent level.
52 AmErIcAN EcoNomIc JoUrNAL: APPLIEd EcoNomIcs JULy 2010
significantly ten months’ after coverage (not shown), there is little evidence that mobile phone markets will return to their pre-treatment levels of price dispersion.
Table 1 presents the regression results of equation (1). Controlling for yearly and market pair fixed effects, column 1 shows that mobile phone coverage reduces price dispersion between markets by 3.5 CFA/kilogram. This indicates that price disper-sion between markets with mobile phone coverage is 16 percent lower than those without mobile phone coverage.15 Controlling for monthly fixed effects and a mar-ket pair-specific time trend decreases the point estimates (column 2). These results are robust to the inclusion of additional covariates that also affect price dispersion across markets, such as transport costs and drought (column 3). The estimates are similar when including cross-border markets (column 4) or using the within-group (fixed effect) estimator (Table A2, column 4) as opposed to the first differences esti-mator.16 I also redefine the treatment by including a dummy variable equal to one when only one market in a pair has mobile phone coverage (column 5). The effect of mobile phones is still negative and statistically significant when both markets are treated. Using the most conservative estimate of all of the specifications, the intro-duction of mobile phones is associated with a 10 percent reduction in price disper-sion as compared to market pairs without mobile phones in the pre-treatment period.
15 The percentage change is calculated as the effect relative to the mean price dispersion for non-mobile phone markets in the pre-treatment period.
16 Results from fixed effects estimation of equation (1) are provided in Table A2 (Web Appendix).
Months pre- and post-mobile phone coverage−4 −3 −2 −1 0 1 2 3 4 5 6
Mon
thly
CFA
/kg
diffe
renc
e6
5
4
3
2
1
0
−1
−2
−3
−4
−5
With year trend
Lower con dence interval
Upper con dence interval
Figure 2. Changes in Price Dispersion Pre- and Post-Mobile Phone Coverage (oLs coefficients on event dummies)
Notes: Price dispersion is regressed on a series of dummy variables pre- and post-mobile phone coverage, sim-ilar to the model in Jacobson, Lalonde, and Sullivan (1993). The estimation equation is the following: y jk, t
= ∑m≥− n d jk, t
m δ m + γ Z jk, t + αjk + θ t + u jk, t . d jk, t
m = 1 if, in period t, market pair jk received mobile phone coverage
m months earlier (or, if m is negative, market pair jk received mobile phone coverage − m months later). Upper and lower confidence intervals are shown.

VoL. 2 No. 3 53AkEr: moBILE PhoNEs ANd grAIN mArkETs IN NIgEr
Table 1—Estimated Effects of Mobile Phone Coverage on Price Dispersion: DD Estimation
Dependent variable: | P jt − P kt |(1) (2) (3) (4) (5) (6) (7) (8)
Mobile phone dummy (both treated)
− 3.51***(0.645)
− 2.19***(0.555)
− 2.17***(0.555)
− 2.24***(0.512)
− 2.44***(0.688)
− 2.28***(0.732)
− 1.34*(0.729)
1.08(0.732)
Mobile phone dummy (one treated)
− 0.193(0.484)
Lagged dependent variable
0.359***(0.009)
Distance dummy × mobile phone dummy
− 1.92*(1.17)
Road quality × mobile phone dummy
− 4.83***(1.05)
Other covariates No No Yes Yes Yes Yes Yes YesCommon time trend
Yes Yes Yes Yes Yes Yes Yes Yes
Market-pair fixed effects
Yes Yes Yes Yes Yes Yes Yes Yes
Yearly time dummy
Yes Yes Yes Yes Yes Yes Yes Yes
Monthly time dummy
No Yes Yes Yes Yes Yes Yes Yes
Group-specific time trend
No Yes Yes Yes Yes Yes Yes Yes
Cross-border markets
No No No Yes Yes No No No
N of observations 53,820 53,820 53,820 62,223 53,820 51,698 52,290 53,820N of cross- sectional observations
666 666 666 777 666 666 648 666
r2 0.0047 0.0904 0.0906 0.0828 0.0906 0.0935 0.0909Joint effect − 1.92***
(0.729)− 3.25***(0.901)
− 3.74***(0.738)
Long-term effect
− 3.55***(1.15)
Market fixed effects clustered by quarter
− 3.52**(1.59)
− 2.20*(1.13)
− 2.17*(1.15)
− 2.24*(1.15)
− 2.44*(1.20)
− 1.34 (1.08)
1.08(1.08)
Dyadic s.e. − 3.52*(1.92)
− 2.20*(1.12)
− 2.18*(1.12)
− 2.24*(1.15)
− 2.44*(1.20)
− 1.34 (1.09)
1.08 (1.08)
Pre-treatment value of dependent variable for control groups
22.11(17) 22.11(17) 22.11(17) 22.11(17) 22.11(17) 22.11(17) 22.11(17) 22.11(17)
Notes: Data from the Niger trader survey and secondary sources collected by the author. For market pairs, mobile phone dummy = 1 in period t when both markets have mobile phone coverage, 0 otherwise. Distance dummy = 1 if market pairs are separated by a distance of greater than or equal to 375 km, 0 otherwise. Road quality is equal to 1 if the road connecting a market pair is unpaved, 0 otherwise. Additional covariates include CFA/kg transport costs for millet at time t and the presence of drought in one market. Huber-White robust standard errors clustered by market pair are in parentheses. Market fixed effects with clustering at the quarterly level and cross-sectional dyadic stan-dard errors are also provided. Missing values in the dyadic or clustered s.e. denote that this specification cannot be used with the specific standard error correction. All prices are deflated by the Nigerien Consumer Price Index (CPI).
*** Significant at the 1 percent level. ** Significant at the 5 percent level. * Significant at the 10 percent level.
54 AmErIcAN EcoNomIc JoUrNAL: APPLIEd EcoNomIcs JULy 2010
The standard errors increase when including market fixed effects and clustering by quarter, but the results are still statistically significant at the 10 percent level.17
Column 6 of Table 1 presents the results of the model with a lagged dependent variable as an additional regressor, using the Arellano-Bond estimator. Controlling for transport costs, drought, and monthly time fixed effects, the coefficient on the lagged dependent variable is positive, implying that it takes approximately 2.5 months for price differences across markets to adjust.18 The coefficient on mobile phones is still negative and statistically significant at the 1 percent level, represent-ing the initial impact of mobile phone coverage. The long-run treatment effect is measured as β 1 /(1 − ρ), where ρ is the coefficient on the lagged dependent variable. Using this formula, mobile phones reduce price dispersion across markets by 3.6 CFA per kilogram in the long-term.
B. heterogeneity of the Treatment Effect
To examine treatment effect heterogeneity across markets, I interact the mobile phone treatment variable with distance and road quality between markets. Column 7 of Table 1 shows the results of interacting mobile phones with road distance between markets, separating the sample into short-haul (less than 375 km) and long-haul (greater than 375 km) market pairs. The interaction term between mobile phones and distance is negative and statistically significant, suggesting that mobile phones are more useful in reducing price dispersion when markets are farther apart. The joint effect suggests that mobile phones are associated with a 3.25 CFA per kilo-gram reduction in price dispersion across markets.19 Column 8 of Table 1 shows similar results for poor road quality. The interaction term between mobile phones and unpaved roads is negative and statistically significant, suggesting that mobile phones have a stronger impact on price dispersion for markets linked by unpaved roads. The joint effect is statistically significant at the 1 percent level.
As mobile phone towers were phased in between 2001 and 2006, it is reasonable to assume that mobile phones became more useful as a greater number of markets received mobile phone coverage. To test whether the treatment effect varies over time, I estimate equation (1) on a yearly basis (Table A4, Web Appendix). In the initial years of mobile phone coverage, mobile phones are associated with a reduc-tion in price dispersion, but the coefficients are not statistically significant. This coincides with the periods when less than 5 percent of market pairs had mobile phone coverage. By 2004/2005, mobile phone coverage reached 31 percent of all market pairs, and was associated with a 2.98 CFA/kg and statistically significant reduction in price dispersion across markets. The coefficient remains negative and statistically significant in 2005/2006. Such findings are intuitive: mobile phones are more likely to be useful as network coverage increases, since traders are able to
17 Transforming the dependent variable using logs, mobile phones reduce price dispersion across markets by 1.3 percent (Table A3, Web Appendix).
18 The coefficient on the lagged dependent variable can be interpreted as the speed of adjustment. The concept of a “half-life” can be used to interpret the results, calculated as ln(0.5)/ln(1 + ρ).
19 Aker (2008) shows that there is a diminishing marginal effect of mobile phones on price dispersion after a distance of 550 km.

VoL. 2 No. 3 55AkEr: moBILE PhoNEs ANd grAIN mArkETs IN NIgEr
search over a larger number of markets using the new technology. These results also support related research on network effects in information technology (Röller and Waverman 2001; Brown and Goolsbee 2002).
V. Alternative Explanations
A. Threats to Identification of mobile Phone coverage
As initial mobile phone coverage in Niger was not randomly assigned, current market outcomes can be the result of differences in markets prior to the placement of mobile phone towers. Table 2 shows the differences in unconditional means and distributions for pre-treatment outcomes and covariates.20 The difference in average price dispersion for millet in the pre-treatment period (1999–2001) is small and not statistically different from zero. Most of the differences in unconditional means for the pre-treatment covariates are not statistically significant, with the exception of a market’s urban status. This relationship is expected, as a market’s probability of receiving mobile phone coverage, at least initially, depended upon whether it was located in an urban center. Overall, the results suggest that there were no statistically significant differences in pre-treatment characteristics between the two groups.21
As a robustness check, I combine the estimation strategy outlined in equation (1) with techniques that match treated and untreated market pairs. The propensity score is estimated by a probit model of regressing the treatment variable on pre-treatment observables. I then include the propensity score as an additional control in the equa-tion and in a weighted least squares (WLS) regression (James M. Robins and Ya’acov Ritov 1997; Keisuke Hirano and Guido W. Imbens 2001). Using both approaches, the results are consistent with the unmatched regressions (Table A6, Web Appendix).
Several potential sources of unobserved bias exist, such as political pressures affecting mobile phone companies’ selection of coverage areas or broader eco-nomic factors that could simultaneously affect price dispersion and the timing of mobile phone rollout. While it is not possible to directly test for selection on the unobservables, I conduct a falsification check by estimating the impact of mobile phones on price dispersion during the pre-treatment period (1999–2001) (Imbens and Jeffrey M. Wooldridge 2009). For all specifications, the estimated effect is close to zero and not statistically significant at conventional levels (Table A7, Web Appendix). The results suggest a lack of direct evidence of selec-tion on unobservable characteristics.
B. spillover Effects and market collusion
A central concern with the above estimates is the possibility of alternative expla-nations for the empirical results, such as spillover effects or collusive behavior.
20 As mobile phone coverage was phased in over time, I also test for differences in pre-treatment trends in mar-ket outcomes. Table A5 (Web Appendix) reports these results. The trends are not statistically different from zero, except for the market pair treated in 2001.
21 Using the Kolmogorov-Smirnov test, the differences in distributions for most covariates are not statisti-cally significant.

56 AmErIcAN EcoNomIc JoUrNAL: APPLIEd EcoNomIcs JULy 2010
It is plausible that mobile phone coverage in market pair ij could affect price dis-persion in market pair kl, especially if traders begin selling more of their goods in mobile phone markets (a “downstream” equilibrium effect). One could also imagine a scenario whereby mobile phone coverage affects the farm gate price for grains, thereby influencing farmers’ production decisions and, hence, local supply (an “upstream” equilibrium effect).22 In this context, standard policy evaluation practices can be biased.
22 “Upstream” equilibrium effects would be a concern if mobile phones had an impact on farm-gate prices and farmers’ grain production is elastic. Aker (2008) posits that this is not a first-order concern, as only 5 percent of
Table 2—Comparison of Observables by Treated and Untreated Groups in the Pre-Treatment Period (1999–2001)
Unconditional meanDifference in
means Difference in distributions
Unconditional Kolmogorov-Smirnov
test
Pre-treatment observablesMobile phone
mean (SD)
No mobile phone mean
(SD)Unconditional
(SE) d-statistic p-value
Panel A. market pair level data| P jt − P kt | for millet (CFA/kg) 21.03
(16.9)22.11
(17)− 1.07(0.907)
0.0478*** 0
Distance between markets (km) 438.75(275)
413.86(247)
24.89(26.87)
0.0647 0.852
Indicator for road quality between markets
0.338(0.47)
0.390(0.49)
− 0.052(0.052)
0.0518 0.972
Indicator for drought in 1999 or 2000
0.050(0.22)
0.052(0.22)
− 0.002(0.008)
0.002 1
Indicator for urban center (> = 35,000)
0.346(0.476)
0.305(0.46)
0.041(0.049)
0.041 0.998
Transport costs between markets (CFA/kg)
12.57(7.3)
11.91(6.6)
0.656(0.708)
0.0513 0
Panel B. market-level data
Indicator for road quality to market (1 = Paved, 0 = Unpaved)
0.588(0.49)
0.4(0.49)
0.188(0.24)
0.1882 0.988
Market size 88.58(80)
124(77)
− 35.41(41.3)
0.4853 0.368
Indicator for drought in 1999 or 2000
0.052(0.22)
0.025(0.16)
0.027(0.026)
0.0277 1
Indicator for landline service 1999–2001, (1 = Yes, 0 = No)
0.865(0.34)
0.5(0.51)
0.364(0.362)
0.3649 0.962
Indicator for urban center (> = 35,000)
0.382(0.486)
0(0.00)
0.382***(0.084)
0.3824 0.55
Notes: Data from the Niger trader survey and secondary sources collected by the author. In panel A, “mobile phone” market pairs are pairs in which both markets received mobile phone coverage at some point between 2001 and 2006; “no mobile phone” market pairs are those pairs in which either one or both markets never received cell phone cover-age. The number of market pairs is 666. In panel B, “cell phone” markets are those that received coverage at some point between 2001 and 2006, whereas “no cell phones” markets are those markets that never received coverage. The number of markets is 37. Huber-White robust standard errors clustered by market pair (panel A) and by market (panel B) are in parentheses. Prices are deflated by the Nigerien CPI. The Kolmogorov-Smirnov test tests for the equality of the distribution functions.*** Significant at the 1 percent level.

VoL. 2 No. 3 57AkEr: moBILE PhoNEs ANd grAIN mArkETs IN NIgEr
A common approach to evaluating treatment effects in this setting is to combine smaller treatment units into larger units that do not interfere with one another (Paul R. Rosenbaum 1987). I therefore match mobile phone and non-mobile phone mar-ket pairs in geographically isolated regions in an attempt to address the potential “downstream” equilibrium impacts on the treatment effect. The magnitude and sta-tistical significance of the mobile phone coefficients are much stronger as compared to the estimates using all market pairs (Aker 2008), thereby suggesting that the pooled coefficients are a lower bound on the treatment effect.23
An additional concern is whether mobile phones facilitated collusive behavior among traders, specifically by facilitating communication and coordination. If this were the case, a reduction in price dispersion could be an indication of convergence toward the monopoly price.24 While I am unable to directly rule out this hypoth-esis, an analysis of the grain market structure provides evidence of the plausibility of collusive behavior. The most commonly used measure of market power in the agricultural marketing literature is the market concentration index, which measures the percentage of traded volume accounted for by a given number of participants (Richard L. Kohls and Joseph N. Uhl 1985). Figure A3 (Web Appendix) shows the four-firm concentration ratios (CR4s) for grain markets in Niger. The CR4s suggest that the grain market structure is fairly competitive. Nationally, the largest traders accounted for 23 percent of grain traded in 2005/2006, and 26 percent of all grain traded in 2004/2005.25 Markets are fairly competitive across regions as well, with most regions having a CR4 less than 25 percent. These results suggest that reduc-tions in price dispersion across markets are not driven by collusive behavior.
VI. Conclusion
This paper provides empirical evidence of the nature and magnitude of the effects of mobile phone coverage on agricultural market performance in Niger. The introduc-tion of mobile phones is associated with a 10 to 16 percent reduction in price disper-sion across markets, with a larger impact for those market pairs with higher transport costs. The paper also provides evidence of a network effect, as mobile phones have a stronger effect on price dispersion once a critical mass of market pairs has mobile phone coverage. While the magnitude of the impact is smaller than the results found in Jensen (2007), this is not surprising, as grains are a storable commodity.
The reduction in price dispersion across markets in Niger does not appear to be driven by selection on observable or unobservable characteristics, spillover effects or collusive behavior. Rather, Aker (2008) finds that the primary mechanism through
villages had mobile phone coverage by 2006, and related research suggests that grain production is highly price inelastic in Niger.
23 Market equilibrium effects are still possible if trade occurs among markets that link the regions. I posit that these effects dissipate with distance. In addition, by focusing on geographically isolated regions, it is possible that the approach has introduced a new bias of different trends among regions. I cannot reject the equality of pre-treatment means or trends between the regions.
24 In this case, reductions in price dispersion would still be attributed to mobile phone coverage, but would have different welfare implications.
25 Kohls and Uhl (1985) suggest that a CR4 less than or equal to 33 percent is indicative of a competitive market structure, while a CR4 of 33–50 percent, and above 50 percent, may indicate a weak and strongly oligopolistic market structures, respectively.

58 AmErIcAN EcoNomIc JoUrNAL: APPLIEd EcoNomIcs JULy 2010
which mobile phones affect market-level outcomes is a reduction in search costs, as grain traders operating in mobile phone markets change their search and market-ing behavior as compared to their non-mobile phone counterparts. The reduction in search costs and inter-market price dispersion is associated with improvements in trader and consumer welfare (Aker 2008).
More broadly, this paper provides empirical evidence of the importance of information for market performance, suggesting that the “I” is as important as the “T” in information technology. Information provision is necessary, but not suffi-cient, for welfare improvements, especially in the presence of other market fail-ures. Nevertheless, mobile phones appear to be a particularly effective and low-cost means of providing such information, and are well-suited to social and commercial norms in sub-Saharan Africa.
These issues are central to the current debate concerning the role of information technology in promoting economic development. Mobile phone infrastructure can have positive spillover effects on markets, thereby serving as an effective poverty reduction tool for poor rural households. However, it cannot replace investments in other infra-structure necessary for sustainable development, such as power, roads and electricity.
REFERENCES
Aker, Jenny C. 2008. “Does Digital Divide or Provide? The Impact of Cell Phones on Grain Markets in Niger.” Bureau for Research and Economic Analysis of Development (BREAD) Working Paper 177.
Anderson, Michael L. 2008. “Multiple Inference and Gender Differences in the Effects of Early Inter-vention: A Reevaluation of the Abecedarian, Perry Preschool, and Early Training Projects.” Journal of the American statistical Association, 103(484): 1481–95.
Arellano, Manuel, and Stephen Bond. 1991. “Some Tests of Specification for Panel Data: Monte Carlo Evidence and an Application to Employment Equations.” review of Economic studies, 58(2): 277–97.
Baye, M. R., J. Morgan, and P. Scholten. 2007. “Information, Search, and Price Dispersion.” In Eco-nomics and Information systems, ed. Terrence Hendershott, 323–75. Amsterdam: Elsevier.
Bertrand, Marianne, Esther Duflo, and Sendhil Mullainathan. 2004. “How Much Should We Trust Differences-in-Differences Estimates?” Quarterly Journal of Economics, 119(1): 249–75.
Brown, Jeffrey R., and Austan Goolsbee. 2002. “Does the Internet Make Markets More Competitive? Evidence from the Life Insurance Industry.” Journal of Political Economy, 110(3): 481–507.
Cameron, A. Colin, Jonah B. Gelbach, and Douglas L. Miller. 2006. “Robust Inference with Multi-Way Clustering.” National Bureau of Economic Research Technical Working Paper 327.
Conley, T. G. 1999. “GMM Estimation with Cross Sectional Dependence.” Journal of Econometrics, 92(1): 1–45.
Eckard, E. Woodrow. 2004. “The ‘Law of One Price’ in 1901.” Economic Inquiry, 42(1): 101–10.Efron, Bradley, and Robert J. Tibshirani. 1993. An Introduction to the Bootstrap. Boca Raton, FL:
CRC Press.Fafchamps, Marcel, and Flore Gubert. 2007. “The Formation of Risk Sharing Networks.” Journal of
development Economics, 83(2): 326–50.Goyal, Aparajita. 2010. “Information, Direct Access to Farmers, and Rural Market Performance in
Central India.” American Economic Journal: Applied Economics, 2(3): 22–45.Heckman, James J. 1979. “Sample Selection Bias as a Specification Error.” Econometrica, 47(1):
153–61.Heckman, James J., and V. Joseph Hotz. 1989. “Choosing among Alternative Nonexperimental Meth-
ods for Estimating the Impact of Social Programs: The Case of Manpower Training.” Journal of the American statistical Association, 84(408): 862–74.
Heckman, James J., Lance Lochner, and Christopher Taber. 1998. “General-Equilibrium Treatment Effects: A Study of Tuition Policy.” American Economic review, 88(2): 381–86.
Hirano, Keisuke, and Guido W. Imbens. 2001. “Estimation of Causal Effects using Propensity Score Weighting: An Application to Data on Right Heart Catherization.” health services and outcomes research methodology, 2(3–4): 259–78.
VoL. 2 No. 3 59AkEr: moBILE PhoNEs ANd grAIN mArkETs IN NIgEr
Hirano, Keisuke, Guido W. Imbens, and Geert Ridder. 2003. “Efficient Estimation of Average Treat-ment Effects Using the Estimated Propensity Score.” Econometrica, 71(4): 1161–89.
Imbens, Guido W. 2003. “Sensitivity to Exogeneity Assumptions in Program Evaluation.” American Economic review, 93(2): 126–32.
Imbens, Guido W. 2004. “Nonparametric Estimation of Average Treatment Effects under Exogeneity: A Review.” review of Economics and statistics, 86(1): 4–29.
Imbens, Guido W., and Jeffrey M. Wooldridge. 2009. “Recent Developments in the Econometrics of Program Evaluation.” Journal of Economic Literature, 47(1): 5–86.
Jacobson, Louis S., Robert J. LaLonde, and Daniel G. Sullivan. 1993. “Earnings Losses of Displaced Workers.” American Economic review, 83(4): 685–709.
Janssen, Maarten C. W., and Jose Luis Moraga-Gonzalez. 2004. “Strategic Pricing, Consumer Search and the Number of Firms.” review of Economic studies, 71(4): 1089–1118.
Jensen, Robert. 2007. “The Digital Provide: Information (Technology), Market Performance, and Wel-fare in the South Indian Fisheries Sector.” Quarterly Journal of Economics, 122(3): 879–924.
Kohls, Richard L., and Joseph N. Uhl. 1985. The marketing of Agricultural Products. New York: Macmillan.
Manski, Charles F. 1990. “Nonparametric Bounds on Treatment Effects.” American Economic review, 80(2): 319–23.
Muto, Megumi, and Takashi Yamano. 2009. “The Impact of Mobile Phone Coverage Expansion on Market Participation: Panel Data Evidence from Uganda.” World development, 37(12): 1887–96.
Pratt, John W., David A. Wise, and Richard Zeckhauser. 1979. “Price Differences in Almost Competi-tive Markets.” Quarterly Journal of Economics, 93(2): 189–211.
Robins, James M., and Ya’acov Ritov. 1997. “Toward a Curse of Dimensionality Appropriate (CODA) Asymptotic Theory for Semi-parametric Models.” statistics in medicine, 16(3): 285–319.
Röller, Lars-Hendrik, and Leonard Waverman. 2001. “Telecommunications Infrastructure and Eco-nomic Development: A Simultaneous Approach.” American Economic review, 91(4): 909–23.
Rosenbaum, Paul R. 1987. “The Role of a Second Control Group in an Observational Study.” statisti-cal science, 2(3): 292–306.
Rosenbaum, Paul R. 2002. observational studies. 2nd ed. New York: Springer.Rosenbaum, Paul R., and Donald B. Rubin. 1983. “Assessing Sensitivity to an Unobserved Binary
Covariate in an Observational Study with Binary Outcome.” Journal of the royal statistical soci-ety, 45(2): 212–18.
Rubin, Donald B. 1974. “Estimating Causal Effects of Treatments in Randomized and Nonrandomized Studies.” Journal of Educational Psychology, 66(5): 688–701.
Rubin, Donald B. 1978. “Bayesian Inference for Causal Effects: The Role of Randomization.” The Annals of statistics, 6(1): 34–58.
Sianesi, Barbara. 2004. “An Evaluation of the Swedish System of Active Labor Market Programs in the 1990s.” review of Economics and statistics, 86(1): 133–55.
Smith, Jeffrey A., and Petra E. Todd. 2005. “Does Matching Overcome LaLonde’s Critique of Nonex-perimental Estimators?” Journal of Econometrics, 125(1–2): 305–53.
Stigler, George J. 1961. “The Economics of Information.” Journal of Political Economy, 69(3): 213–25.Stiglitz, Joseph E. 1989. “Imperfect Information in the Product Market.” In handbook of Industrial
organization, Volume 1, ed. Richard Schmalensee and Robert D. Willig, 769–847. Amsterdam: Elsevier Science.
Timmer, C. Peter. 1974. “A Model of Rice Marketing Margins in Indonesia.” Food research Institute studies, 13(2): 145–67.
United Nations Development Program (UNDP). 2009. human development report 2009: overcom-ing Barriers: human mobility and development. New York: UNDP.
Wooldridge, Jeffrey M. 2002. Econometric Analysis of cross section and Panel data. Cambridge, MA: MIT Press.
World Bank. 2005. Annual Progress reports of the Poverty reduction strategy Paper Joint staff Advi-sory Note Niger. Report 38271-NE. Washington, DC.