Embed Size (px)
Citation preview
COMMODITIES - BLOOMBERG TICKER - IWCOMPE:LX - LU0762436201 LOW RISK - BLOOMBERG TICKER - IWLWRPE:LX - LU0762435906 REAL VALUE GROWTH - BLOOMBERG TICKER - IWRVGPE:LX - LU0762436110
INVESTMENT FOR WEALTH
General reportComments for july 2012
Hold on to your convictions
We have urged you all to have patience, we have even
paraphrased from the Lion King’s “akuna matata”. We
have shared the frustrations about the nominal volatility of the iW funds. It has seemed that timewise
they were on a road to perdition. We have tried to
explain on the basis of divers technical and
fundamental reasons, that the “ups and downs” in the
precious markets were simply noise in the bigger
scheme of the ongoing financial crisis.
But wait a minute…
When we talk about the volatility of the whole
precious markets, we talk like you know, about your
“one and only” empirically-proven “debt-free” store
of value and hedge against governments’ financial
repression, as a strategic allocation and healthy diversification for your entire portfolio of assets,
meaning a proportion of total assets in a range, in
accordance with the clients investor’s profile, starting
from 5% to a maximum of 30%. Going beyond 30%
leaves the area of hedging.
Graph 1: Currency Crisis : Argentina 2002 - Price of Gold in Argentina Pesos Source : BMG inc
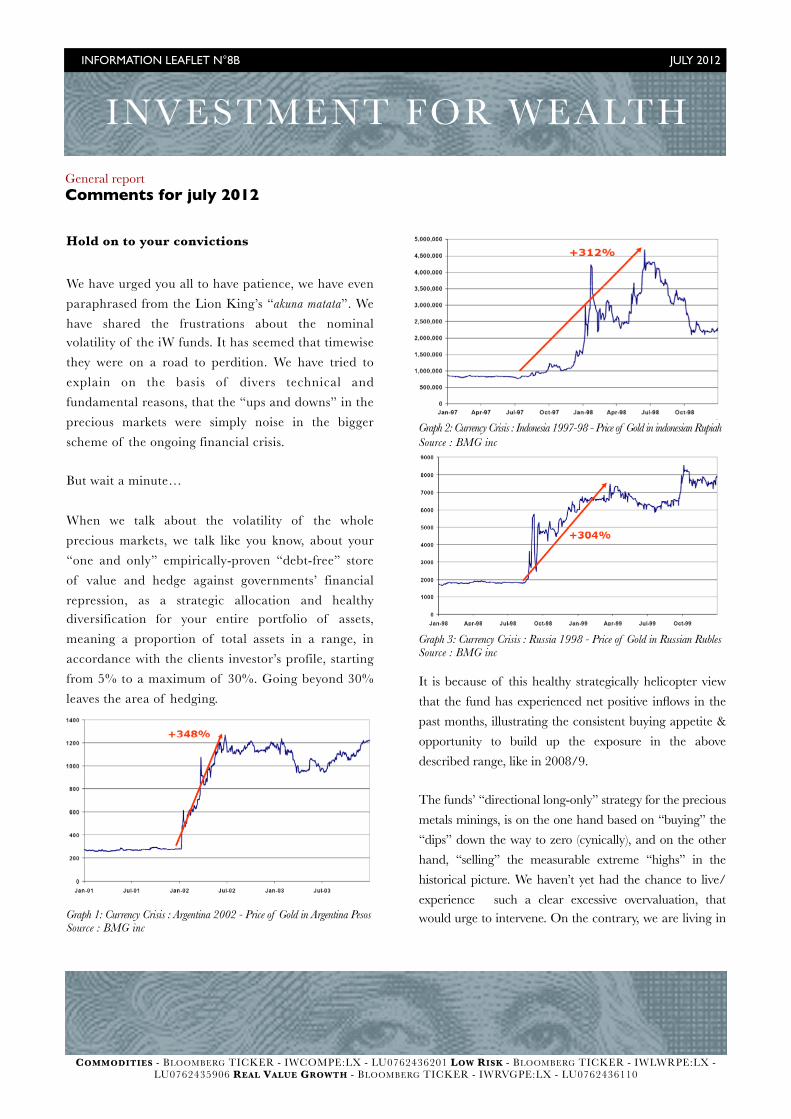
Graph 2: Currency Crisis : Indonesia 1997-98 - Price of Gold in indonesian Rupiah Source : BMG inc
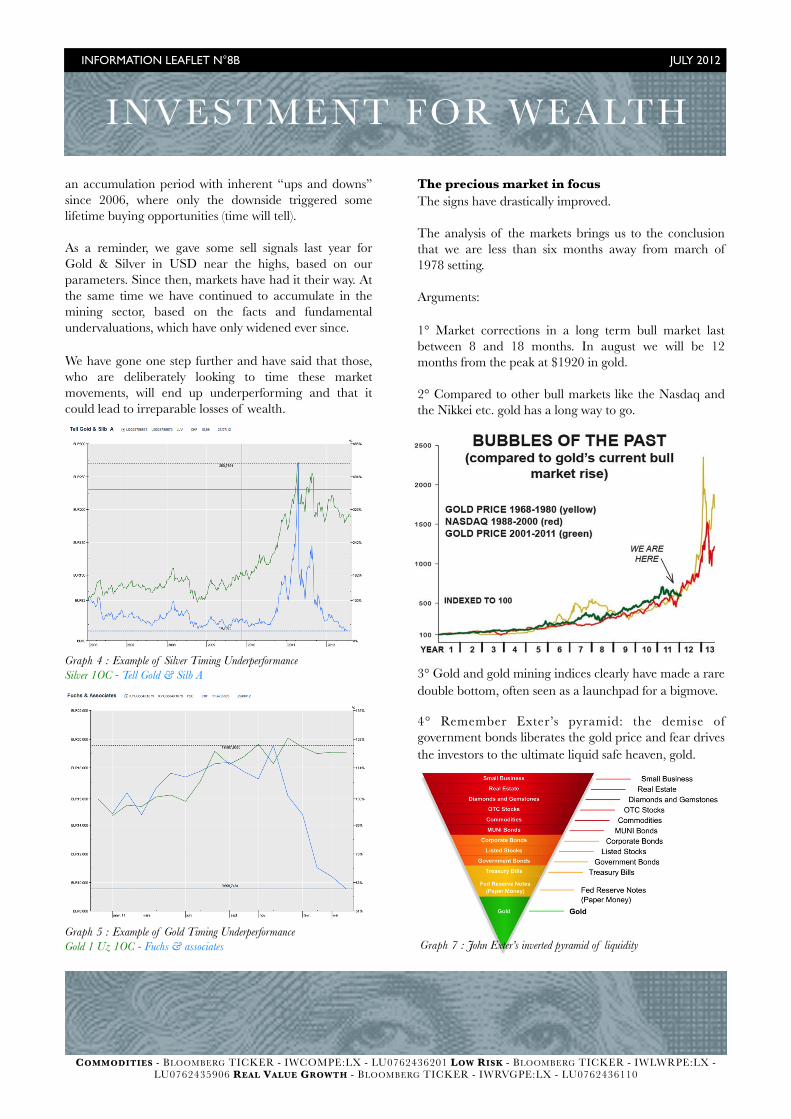
Graph 3: Currency Crisis : Russia 1998 - Price of Gold in Russian Rubles Source : BMG inc
It is because of this healthy strategically helicopter view
that the fund has experienced net positive inflows in the
past months, illustrating the consistent buying appetite &
opportunity to build up the exposure in the above
described range, like in 2008/9.
The funds’ “directional long-only” strategy for the precious
metals minings, is on the one hand based on “buying” the
“dips” down the way to zero (cynically), and on the other
hand, “selling” the measurable extreme “highs” in the
historical picture. We haven’t yet had the chance to live/
experience such a clear excessive overvaluation, that would urge to intervene. On the contrary, we are living in
INFORMATION LEAFLET N°8B JULY 2012
COMMODITIES - BLOOMBERG TICKER - IWCOMPE:LX - LU0762436201 LOW RISK - BLOOMBERG TICKER - IWLWRPE:LX - LU0762435906 REAL VALUE GROWTH - BLOOMBERG TICKER - IWRVGPE:LX - LU0762436110
an accumulation period with inherent “ups and downs” since 2006, where only the downside triggered some lifetime buying opportunities (time will tell).
As a reminder, we gave some sell signals last year for Gold & Silver in USD near the highs, based on our parameters. Since then, markets have had it their way. At the same time we have continued to accumulate in the mining sector, based on the facts and fundamental undervaluations, which have only widened ever since.
We have gone one step further and have said that those, who are deliberately looking to time these market movements, will end up underperforming and that it could lead to irreparable losses of wealth.
Graph 4 : Example of Silver Timing UnderperformanceSilver 1OC - Tell Gold & Silb A
Graph 5 : Example of Gold Timing UnderperformanceGold 1 Uz 1OC - Fuchs & associates
The precious market in focusThe signs have drastically improved.
The analysis of the markets brings us to the conclusion that we are less than six months away from march of 1978 setting.
Arguments:
1° Market corrections in a long term bull market last between 8 and 18 months. In august we will be 12 months from the peak at $1920 in gold.
2° Compared to other bull markets like the Nasdaq and the Nikkei etc. gold has a long way to go.
3° Gold and gold mining indices clearly have made a rare double bottom, often seen as a launchpad for a bigmove.
4° Remember Exter’s pyramid: the demise of government bonds liberates the gold price and fear drives the investors to the ultimate liquid safe heaven, gold.
INFORMATION LEAFLET N°8B JULY 2012
INVESTMENT FOR WEALTH
Graph 7 : John Exter’s inverted pyramid of liquidity
COMMODITIES - BLOOMBERG TICKER - IWCOMPE:LX - LU0762436201 LOW RISK - BLOOMBERG TICKER - IWLWRPE:LX - LU0762435906 REAL VALUE GROWTH - BLOOMBERG TICKER - IWRVGPE:LX - LU0762436110
Moody’s warned that further engagements from Europe’s last triple A bastions (Germany, the Netherlands, Finland and Luxembourg) to overcome the insolvency of the over-indebted periphery (the PIIGS, especially Spain and Italy) will lead to de-ratings, thus implying the bursting of the bubble in government bonds. The fear flight to government bonds (even Belgium was able to lend at zero rates in the short term) will become a flight out of “yield-free and risky” bonds into real assets especially gold.In the USA, a deal between Congress leaders and the President was reached on the 31st of July to stopgap the US spending plan for another six months. They agreed to postpone the effects of the debt ceiling accord because otherwise the federal debt limit of $16.4 trillion would again be surpassed, before the new president is installed. This implies that another $600 billion are added to the deficit before anything will be done about the “fiscal cliff ”. In other words the fear out of treasuries could start in about six months as well.We don’t even need an official QE3 to launch the gold price higher, the gangrene has already spread amply throughout the whole financial system. The problems faced by Japan and Great Brittan are also evident.We could go on about this for a lot longer but we think we have made our point.
5° The coming food inflation, originating from extreme droughts in the USA and the already 6 weeks overdue monsoon rains in India, will exacerbate the fear into gold. The effects on consumer prices normally lag the price movement in the grain market about 4 months.
OUR CONCLUSION: WE ARE PROBABLY ON THE DOORSTEP OF ANOTHER MARCH OF 1978
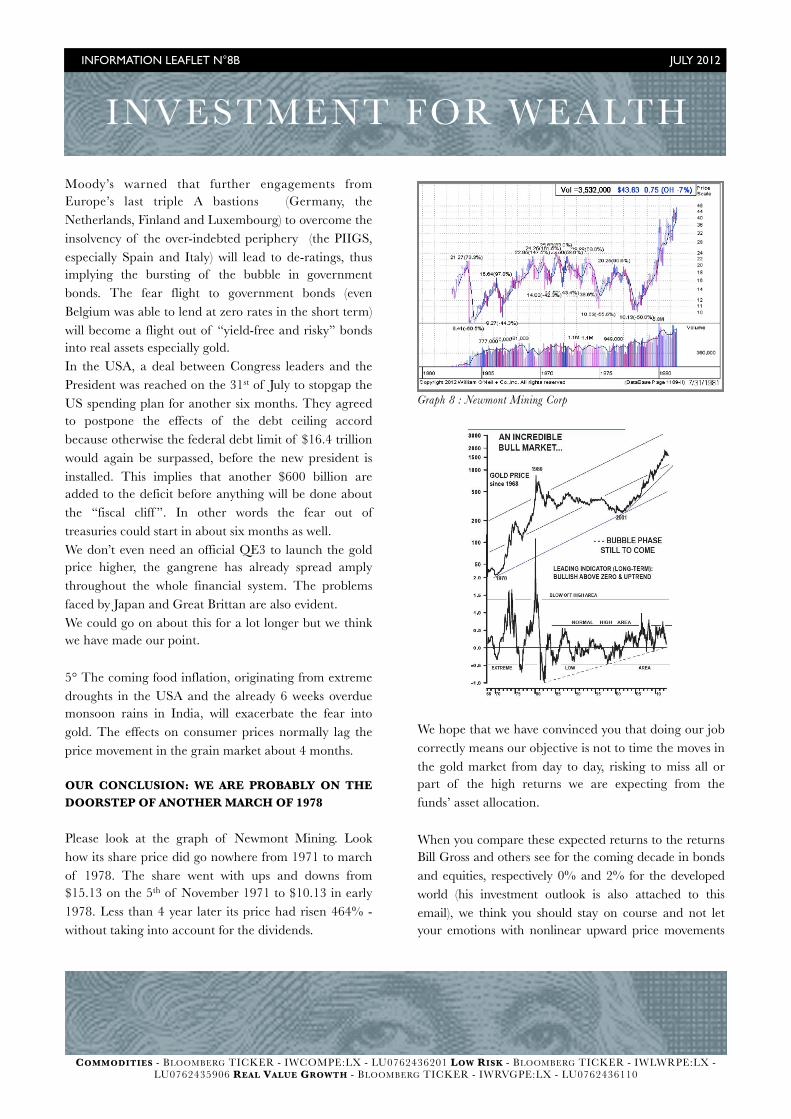
Please look at the graph of Newmont Mining. Look how its share price did go nowhere from 1971 to march of 1978. The share went with ups and downs from $15.13 on the 5th of November 1971 to $10.13 in early 1978. Less than 4 year later its price had risen 464% - without taking into account for the dividends.
Graph 8 : Newmont Mining Corp
We hope that we have convinced you that doing our job correctly means our objective is not to time the moves in the gold market from day to day, risking to miss all or part of the high returns we are expecting from the funds’ asset allocation.
When you compare these expected returns to the returns Bill Gross and others see for the coming decade in bonds and equities, respectively 0% and 2% for the developed world (his investment outlook is also attached to this email), we think you should stay on course and not let your emotions with nonlinear upward price movements
INFORMATION LEAFLET N°8B JULY 2012
INVESTMENT FOR WEALTH
COMMODITIES - BLOOMBERG TICKER - IWCOMPE:LX - LU0762436201 LOW RISK - BLOOMBERG TICKER - IWLWRPE:LX - LU0762435906 REAL VALUE GROWTH - BLOOMBERG TICKER - IWRVGPE:LX - LU0762436110
When we look at the COT report and the Hulbert reading of bullish sentiment under the gold community, it is clear that many market participants have lost their hopes in precious mining as the daily noise (market ups and downs) ate away the strength of their convictions. Part of the gold community is even short now. What better contrary indicator could you wish for?
Performances and trading
iW Alternativ SIF – Low Risk
The fund has increased by 3% in July, NAV 11698.5 EUR.
iW Alternativ SIF – Commodities
The fund has increased by 5.1% in July, NAV 962.89 EUR.
iW Alternativ SIF – Real Value Growth
The fund has increased by 2.8% and 2.7% in July, NAV 97.24 EUR (I), NAV 96.58 EUR (P).
Best regards,
The fund manager
Note : This report is not directed to, or intended for distribution to or use by, any person or entity who is a citizen or resident of, or located in, any locality, state, country or other jurisdiction where such distribution, publication, availability or use would be contrary to law or regulation. Additional information is available upon request.
The information, tools and material presented in this document are provided for information purposes only and are not to be used or considered as an offer or solicitation to buy, sell or subscribe any securities or other financial instruments. Past performance should not be taken as an indication or guarantee of future performance and no representation or warranty, expressed or implied, is made by “iW” regarding future performance. Information found in this report has been prepared based on information provided by various financial sources. Information usually attributable to a unique specific source is quoted whenever such information is available. Otherwise, the information may have been gathered from public news dissemination services such as Bloomberg, Reuters or any other news services.
Information and opinions presented by “iW” have been obtained from sources believed to be reliable, and, although all reasonable care has been taken, “iW” is not able to make any representation as to its accuracy or completeness. Accordingly, “iW” accepts no liability for loss arising from the use of this document presented for information purposes only. “iW” has no obligation to update, modify or amend this report or otherwise notify a reader thereof in the event that any matter stated herein becomes inaccurate.
INFORMATION LEAFLET N°8B JULY 2012
INVESTMENT FOR WEALTH