Embed Size (px)
Citation preview
Information & Management 51 (2014) 762–773
Digital systems and competitive responsiveness: The dynamics of ITbusiness value
Amitava Dutta *, Hun Lee, Masoud Yasai-Ardekani
School of Management MSN 5F4, George Mason University, 4400 University Drive, Fairfax, VA 22030, United States
A R T I C L E I N F O
Article history:
Received 16 November 2012
Received in revised form 13 April 2014
Accepted 3 May 2014
Available online 14 May 2014
Keywords:
IT business value
Competitive dynamics
Response delay
Simulation modeling
A B S T R A C T
The mechanics of competition involve perception and reaction to competitor moves. Both incur delays
that can be reduced by digital systems. Using system dynamics and the Red Queen paradigm, we
modeled the impact of IT investments on response delays and business value, with the following results:
(a) value has significant transient components; (b) value depends on investment level and the relative
delays of competitors; and (c) relative delays affect the first-mover advantage. These results show that
when assessing the value of IT investments, it is important to consider (a) the temporal pattern of
benefits, not just their total magnitude, and (b) the impact of ongoing moves by competitors.
� 2014 Elsevier B.V. All rights reserved.
Contents lists available at ScienceDirect
Information & Management
jo u rn al h om ep ag e: ww w.els evier .c o m/lo c ate / im
1
‘‘The ability to learn faster than your competitors may be the only
sustainable competitive advantage.’’ - Arie de Gues, Former
Director of Corporate Planning, Royal Dutch Shell
‘‘An organization’s ability to learn and translate that learning into
action rapidly is the ultimate competitive advantage.’’ – Jack
Welch, former CEO General Electric
1. Introduction
Consider the battle between FedEx and UPS for the overnightpackage-delivery market [62]. UPS historically had lagged behindFedEx in its use of information technology (IT). In 1989, over aperiod of several months, UPS made a major investment to upgradeits systems to FedEx’s level. Subsequently, UPS surpassed FedExwith the introduction of its handheld Delivery AcquisitionInformation Device (DIAD), which integrated with its Maxitracsystem. FedEx would not introduce its own version of the Maxitracuntil 1993. In November 1994, FedEx was the first to use the WorldWide Web to offer an online package tracking service. Six monthslater, UPS introduced the same service. In March 1996, UPSintroduced its complete Web-shipping service. One year later, asimilar FedEx service was introduced. During the mid-1990s,
* Corresponding author. Tel.: +1 7039931779.
E-mail addresses: [email protected] (A. Dutta), [email protected] (H. Lee),
[email protected] (M. Yasai-Ardekani).
http://dx.doi.org/10.1016/j.im.2014.05.005
0378-7206/� 2014 Elsevier B.V. All rights reserved.
FedEx and UPS targeted warehousing and logistics services. Thesystems that FedEx designed for this application attracted big-name customers such as National Semiconductor and LauraAshley. UPS was not sitting idly by and was implementing asimilar solution, but its system was still two years behind that ofFedEx. In fact, 1992 was the first year in which UPS spent more onIT than on transportation assets. These actions by two competi-tors—FedEx and UPS—illustrate some important aspects of how thebusiness value of IT is realized by a firm in a competitiveenvironment. First, value is not realized instantaneously, but overtime, usually an appreciable period. Second, during this period,competitors usually do not sit idly by. They respond withcountermoves, which can diminish the benefits realized by thefirm.1 Third, the speed with which competitors can respond to eachother plays a crucial role in the realization of business value from ITinvestments. Last but not least, the business value of ITinvestments is determined only over the course of many iterations
of firms observing and reacting to competitors, or what thestrategy literature calls the Red Queen Theory2 [22], referring toLewis Carroll’s Through The Looking Glass [9], in which Alice noticesthat she appears to be stationary even though she is running a race.
In an early paper in this journal, Feeny and Ives [24] develop qualitative
guidelines to help senior executives assess the long term value of IT investments,
and mention the importance of considering competitive responses.2 Variants of the Red Queen Theory also appear in the biology [68] and economics
[53] literature in that they follow this ‘observe competitive environment and then
respond’ paradigm in an evolutionary process.
A. Dutta et al. / Information & Management 51 (2014) 762–773 763
The Red Queen’s response is that Alice must be from a slow worldbecause in a fast world, one must run just to stay still.
To see the consequence of response delays on businessperformance more clearly, consider a market in which two firmsA and B each sell a similar compact car. They each have a 50%market share at time T = 0. Let us say that at T = 10, A unveils a newengine with double the fuel efficiency of the old engine. If we makethe unrealistic assumption that B can instantly perceive and reactto A’s move, B will immediately introduce a similarly efficient carand both A and B will continue to enjoy a 50% market share.However, imagine that B takes three time periods to perceive whatA did and another five periods to improve its own engine inreaction to A’s moves. During these eight periods, A will drain offmarket share from B, and even if B manages to equal A in terms offuel efficiency, it will not win back the lost market share. Thus, theequilibrium outcomes for A and Bare very different whenperception and reaction delays are considered. What if B improvesits engine to be better than A’s engine? A must first perceive thisdifference and then react to it. Again, both steps will involve delays,during which B may recover some market share. Now assume thatinstead of taking five periods, B can react to A’s move in threeperiods. Could B then beat A over the long run despite not havingbeen the first mover? Even if B cannot beat A but can minimize itsloss in market share by reacting quickly, what then is the businessvalue of being able to react faster? Would A and B run faster andfaster simply to stay in the same place, as the Red Queen said toAlice? Deducing the dynamics of competitive outcomes quicklybecomes complicated when one considers that perception andreaction are phenomena that involve substantial delays.
Given the significance of delays in competitive responses, it isnot surprising that organizations have made substantial invest-ments in IT to help reduce these delays and make themselves moreagile [41,47]. The focus of this paper is on presenting an approachto quantifying the business value of IT investments targeted atimproving organizational speed. In doing so, it also addresses twoissues that have not been studied extensively in the literature on ITbusiness value: (a) the presence of significant transient patternsand thus, the need to understand both the timing and the totalmagnitude of their benefits; and (b) the impact of ongoing movesand countermoves by competitors on the realization of IT value.The relationship between digital systems and business value iscomplex and multifaceted. This study helps to reveal one aspect ofthat relationship that stems from the non-instantaneous nature ofcompetitive responses. At this point, it would also be worthwhileto pause and recognize additional important facets of IT businessvalue such as governance and alignment [6,7,55]. To consider all ofthese multiple facets, standardized best-practice frameworks haveevolved to combine them in a systematic and comprehensivemanner when evaluating a specific IT investment opportunity.Examples of such frameworks include COBIT, of which Val IT is apart, and ITIL [16,33,69].
The remainder of the paper is structured as follows. Section 2reviews the IS (information systems) literature on the businessvalue of digital systems under conditions of competition, thecompetitive dynamics literature on response delay, and the impactof digital systems on perception and reaction delays. Section 3presents our system dynamics model of competition. Section 4presents the experimental results and Section 5 discusses theirimplications.
2. Literature survey
2.1. The business value of digital systems under competition
There is extensive literature, albeit with mixed findings, on theimpact of IT investments on firm performance. A variety of
theoretical and empirical studies have analyzed IT value atdifferent levels of aggregation. A comprehensive review andconceptual classification of this body of work from the recent pastmay be found in Melville et al. [45]. However, although thisliterature is substantial, only a relatively small proportion of itexplicitly considers the impact of continuing competitors’ actionson the temporal pattern and magnitude of value realized from ITinvestments. For the purposes of this paper, we limit our review toa sample of studies from this segment to identify methodologiesand common assumptions. Demirhan et al. [21] investigate ITinvestment decisions in a competitive market under decliningcosts. They develop a sequential duopoly model and find thatdeclining IT costs intensify or relax competition, depending onwhether firms serve quality- or price-sensitive markets. Thatcherand Pingry [67] develop a series of two-stage duopoly models ofquality-price competition and a series of monopoly models ofquality-price choice to examine the impact of IT investments onfirm profit, firm productivity, and consumer welfare. Quan et al.[50] propose a duopoly model to study the impact of investmentsin digital systems on firm performance and productivity undercompetitive conditions. They show that the magnitude of benefitsis a function of market sensitivities to the price and quality of theproducts and services offered by a firm and its competitor.Interestingly, Loukis et al. [40], using firm-level data from Greekcompanies, find that external competitive conditions inducecompanies to utilize their IT investments more effectively,resulting in the realization of higher business value from theseinvestments. Tan et al. [65] investigate the word-processing-software marketing war in South Korea using a game-theoryapproach and suggest several reasons why the new entrant wasable to overtake the native incumbent and become the marketleader. Although the previous articles primarily consider two-party games, researchers outside the IS area have developedmethods for efficiently representing multi party-games andalgorithms to find equilibrium solutions in special cases such assingle-stage tree-structured games [35].
The strength of these studies is that they explicitly consider theactions of competitors in determining the business value of digitalsystems, which is appropriate given contemporary businessenvironments. At the same time, modeling techniques assumethat key competitor actions and market events are instantaneouswhen in reality, they are not. For instance, in a two-period game,participants are usually assumed to make their moves instantly atthe beginning or end of a period. Similarly, customers are assumedto perceive a price/quality change instantly, again at the beginningor end of a period. This assumption of instantaneous behavior isperfectly appropriate when actions/decisions take a short amountof time relative to the overall duration of a game and when theemphasis is on analyzing equilibrium or steady-state outcomes[27]. However, although equilibrium analysis is important andvery informative, it is also evident that a game-theory approachwould have limited ability to explicitly model delays in competi-tive responses or deduce the nature of the transient behavior thatprecedes equilibrium. Accordingly, a game-theory approach is aless attractive candidate to analyze the business value of IT thataims to reduce competitors’ perception and reaction delays andmake them more agile.
We conclude this survey by mentioning three articles thatrepresent a class of studies that do not explicitly considercontinuing competitor actions but do examine the impact of ITinvestments on a firm’s ability to respond swiftly to changes in itsenvironment. Altschuller et al. [1] examine whether IT investmentsimprove a firm’s ability to rapidly sense and respond to itsenvironment by analyzing firm performance during periods ofindustry turbulence. Although specific competitor actions are notexplicitly considered, those authors do find that IT investments
A. Dutta et al. / Information & Management 51 (2014) 762–773764
improve firm agility only in industries with unanticipated growth.Zain et al. [76] use structural-equation modeling to analyze therelationship between technology acceptance and organizationalagility by surveying 329 managers of Malaysian firms. Again,specific competitor actions are not considered in the analysis,agility is assessed based on managerial perceptions, and thetechnology-acceptance model is used to assess organizationalassimilation of technology. Roberts and Grover [52] examine aspecific form of organizational agility—i.e., that of being able torespond quickly to customer-based opportunities for innovationand competitive action. They use a two-stage research design inwhich 1, 200 marketing executives were sent surveys, resulting in188 usable responses. They find that Web-based customerinfrastructure improves a firm’s customer-sensing capability,whereas internal systems integration improves a firm’s custom-er-response capability. Although these studies do not explicitlycapture the mechanics by which IT investments improve anorganization’s agility, and therefore the impact on response delays,their value lies in identifying attributes of an organization’s ITinfrastructure that are positively associated with agility. In doingso, they help us to gain a better understanding of the underlyingmechanics of agility, which in turn enables us to make ITinvestment decisions more confidently.
2.2. Response delays in competitive dynamics
Despite its impact on performance, competitive response delayhas not received much attention in the IS literature; however, it hasbeen a key issue in the strategy literature. The theories developedby the strategy literature provide a foundation on which to modelthe dynamics of IT business value under competitive responsedelays. This literature holds that firms profit by taking competitiveactions that maximize rivals’ response delays [13] and byresponding quickly to rivals’ actions [60]. The basic premise isthat the longer an initiating firm can monopolize a market andenjoy first-mover advantages based on a new competitive action,the greater the benefits [37,48]. Responding to a rival’s action firstrequires awareness of that action and then the ability to react [14].If a firm is not aware of a rival’s action, it cannot respond, and theresponse delay will be longer. Likewise, if a firm does not possessthe capability to react to a rival’s action, it cannot respond until itdevelops the capability to do so, and the response delay will belonger. Thus, we can decompose response delay into two maincomponents: perception delay and reaction delay.
Chen [14] suggests that awareness is a prerequisite of anycompetitive move, and that competitors tend to be highly aware ofrivals’ actions in conditions of high market commonality andresource similarity. Awareness can be facilitated by scanning, inwhich firms passively or actively view their environments whilethey collect environmental data and analyze them for relevantsignals about future threats and opportunities [19]. Examplesinclude detecting shifting preferences of buyers, changes in supplierindustries, changes in availability of complementary products andservices, and changes in competitor profiles. Scanning also enablesearly detection of signals about changes in competitors’ capabilitiesand impending actions, facilitates analysis of the impact ofcompetitors’ actions and thus, enables the formulation of appropri-ate responses [75]. Continuous and real-time scanning of competi-tive data using digital systems reduces the time taken from acompetitor’s initiation of an action to perception and interpretationof its effects by the focal firm, thereby reducing perception delays.Online business intelligence services that screen, categorize anddisplay information about strategic activities and emergingtechnologies from numerous sources enable organizations toperceive competitor actions more quickly and accurately [42].More recent tools for gathering competitive intelligence—such as
text and web mining, visualization and associated organizationalprocesses [5] and the availability of commercial satellite imagery[26]—can provide invaluable competitive intelligence, thus enhanc-ing the speed and accuracy of perception.
A firm’s capability to react to a rival’s action also has an impacton response delay. Smith et al. [60] show that the type (strategicversus tactical) and radicality (deviation from industry norms) ofan initiating firm’s action affect the extent of its rivals’ responsedelays. Whereas tactical actions such as price cuts may be easilyimitated, strategic actions such as new product introductions aredifficult to imitate, leading to considerable response delay. Severalstudies find that competitive actions that require more effort toexecute lead to longer response delays [13,60]. As with perception,digital systems can help to significantly reduce reaction delays.ERP packages are a classic example of systems that improvereaction delay because they help coordinate many functions,including order management, materials planning, warehousemanagement, payables, receivables, and general ledger. Otherdigital systems that automate manufacturing processes, improveinternal coordination, help with decision support and organiza-tional knowledge management and speed up product design alsosignificantly reduce reaction delay [34,57,72]. In short, there are awide variety of digital systems that can enable an organization toreact more nimbly to its competitors.
3. Model development
Different methodologies have been used to study the dynamicbehavior of competing entities to suit the objectives of theirrespective studies [2,4,10,12,22,30,64,70,73]. Our objective is torepresent the impact of IT investments on organizational responsedelays and then to link that impact to organizational performance—specifically, organizational performance in the presence of continu-ing countermoves by competitors. The Red Queen theory discussedearlier provided a basis on which to structure the model, which wechoose to represent using the system dynamics (SD) methodology.The basis of the method is the recognition that the structure of anysystem—the many circular, interlocking, and sometimes time-delayed relationships among its components—is often just asimportant in determining its behavior as the individual componentsthemselves. This is precisely contemplated in our scenario ofcompetition between two entities in which competitive responsesare not instantaneous and the action-reaction cycle repeats overtime. In the SD model, individual cause–effect relationships aresynthesized into a holistic causal model of the mechanics underlyinga time dependent phenomenon of interest. The method has beenused in a wide variety of application domains [17,51], particularly toexamine how complex systems behave over time. The basicelements of SD models are feedback, accumulation of flows intostocks and time delays. These elements can be written as a set ofdifferential equations, which are then simulated to deduce systembehavior over time [51]. Although individual causal relationships arerelatively easier to understand, studies show that humans haveconsiderable difficulty in deducing the collective effects of multipleinterrelated causal relationships [39]. The value added by an SDmodel is that the collective effects of multiple causal relationshipscan be deduced computationally through simulation, therebyimproving our understanding of the dynamic phenomenon inquestion. Our choice of methodology is therefore motivated by theobservation that, based on the Red Queen paradigm, if one canformally represent the mechanisms by which perception andreaction delays affect business outcomes, one can computationallydeduce the business value of the digital systems that reduce thosedelays. On the prescriptive front, one can simulate the underlyingmechanics under different business scenarios to help make ITinvestments judiciously. On the descriptive front, observed
A. Dutta et al. / Information & Management 51 (2014) 762–773 765
competitive outcomes can be explained in terms of underlyingmechanics and established findings such as the first-moveradvantage can be re examined in light of nonzero delays. The basicconstructs and terminology of SD are introduced contemporane-ously with the model. The reader can find further technical details ofthe methodology in the earlier references [51]. In the SDmethodology, a problem or a system (e.g., ecosystem, politicalsystem or mechanical system) is first represented as a causal-loopdiagram. A causal-loop diagram is a simple map of a system with allof its constituent components and their cause-effect interactions. Bycapturing interactions and consequently the feedback loops, a causalloop diagram reveals the structure of a system. By understanding thestructure of a system, it becomes possible to ascertain a system’sbehavior over a certain period. Causal-loop diagrams aid invisualizing a system’s structure and behavior, and analyzing thesystem qualitatively. To perform a more detailed quantitativeanalysis, a causal-loop diagram is transformed to a stock and flowdiagram. A stock is the term for any entity that accumulates ordepletes over time. A flow is the rate of change in a stock. A stock-and-flow model helps in studying and analyzing the system in aquantitative way and is built and simulated using computersoftware. Due to space limitations, we represent our problemdirectly as a stock flow model. The repeated action-reaction cyclesimplied in the Red Queen paradigm naturally lead to a complex webof feedback loops, and the SD methodology is particularly well suitedto representing feedback structure.
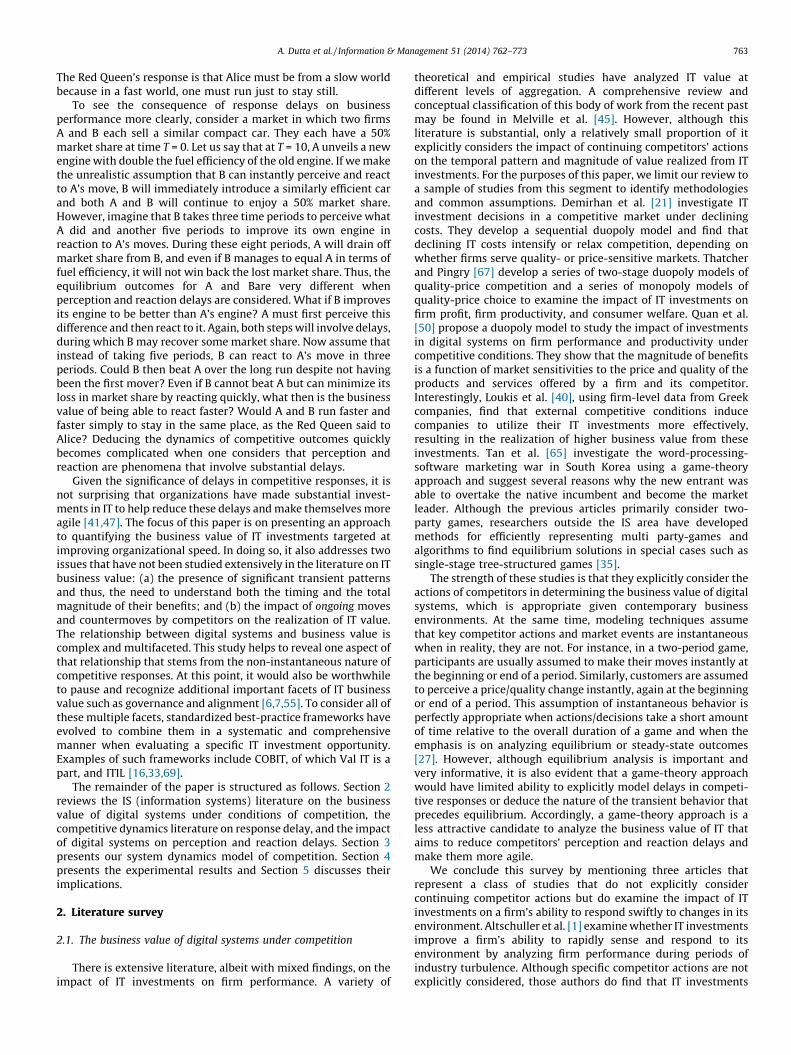
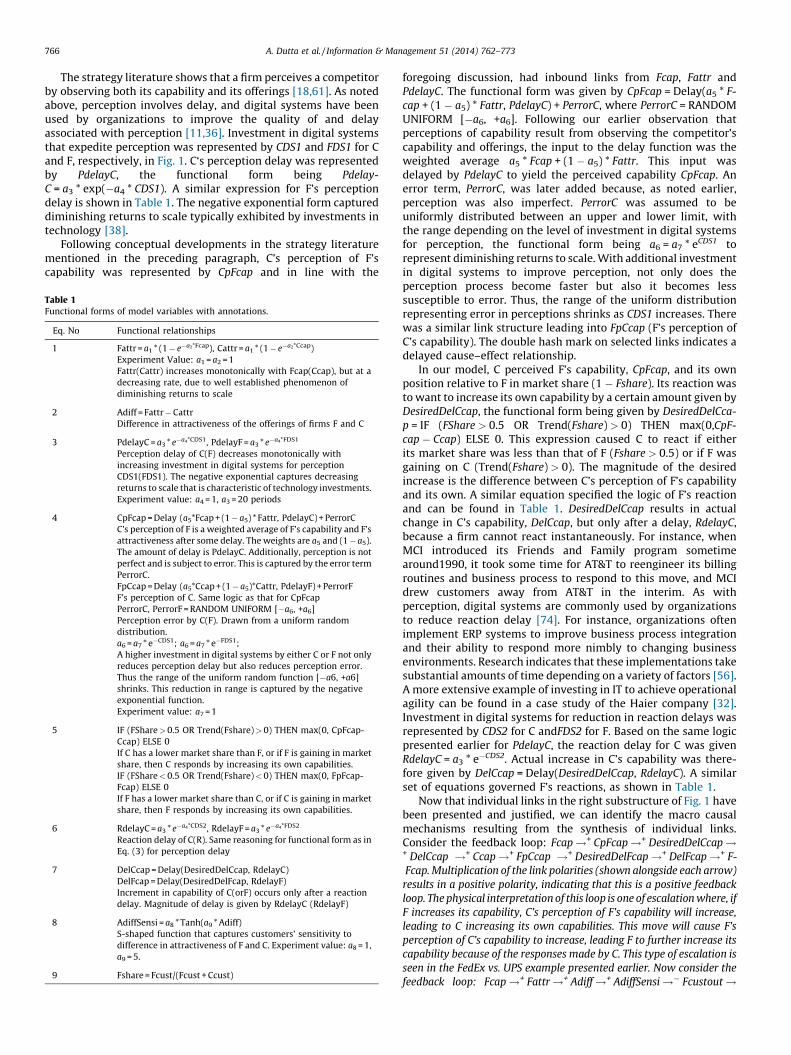
We modeled the simplest competitive scenario in which themarket consists of two firms and customers who choose betweentheir offerings. To ground our narrative, let us assume that the twofirms are mobile telephone service providers F (firm) and C(competitor). Following the Red Queen paradigm, they perceiveeach other’s actions and react to those observations, but bothperception and reaction take time. For instance, if C becomes awarethat F is erecting cell phone towers in a geographic area, then it canconclude that F is in the process of improving its coverage. C canthen decide to react, but that reaction will involve some delay.Customers buy services from either F or C depending on theperceived difference in the attractiveness of their offerings. Thus,both firms repeatedly undergo perception-reaction cycles overtime, as conceptualized in the Red Queen paradigm [22]. Fig. 1represents our SD model of the duopoly described above. In SDparlance, that figure is referred to as a Stock Flow Diagram (SFD).An arrow represents a causal relationship from a cause to an effectvariable and is called a link. Each link has a polarity. A positivepolarity means that cause and effect change in the same direction,whereas a negative link means that cause and effect change inopposite directions.
For ease of identification in the narrative, model variables arewritten in italics. Many different metrics can be used to measurethe business value of an IT investment. Well-established frame-works such as CoBIT, Val IT and ITIL [20,33,69] provide detailedguidance, based on best practices, on how to develop such metricsfor industry- and organization-specific contexts. No specific metricis endorsed for all cases, but the importance of having a metric isemphasized. To develop our model, we used market share as themetric to measure business value, represented by the variableFshare. We found this metric attractive, compared to other possiblemetrics such as revenue or profit, because it captures in a simpleand parsimonious way the impact of competitive response delays,which was the focus of our model. Accordingly, we needed a metricthat would capture the series of retaliatory moves by both parties,and Fshare does that quite well. If one firm’s actions confer anadvantage relative to the competitor, its market share willincrease, and vice versa. There are two main substructures inFig. 1. The substructure to the right of Fshare represents themechanics of perception and reaction between the two rivals F and
C. The substructure to the left of Fshare represents the mechanics ofcustomers reacting to the competition between F and C via theperceived difference in the attractiveness of their offerings. Notethat <Adiff> in the left substructure is the same as Adiff in the rightsubstructure. This variable copy avoids cluttering the diagram witha long link from one end to the other. We now discuss eachsubstructure in turn, with links justified by existing theory or otherappropriate evidence.
In the right substructure, the competition between F and C isrepresented at a level of aggregation that keeps the modelparsimonious while capturing the major impacts of perception andreaction delays. Strategy theory holds that firms deploy theircapabilities in various configurations to bring their products andservices to the market place [3,43,48,66]. Capabilities include bothtangible and intangible resources, along with associated processesand structures that enable the coordination and execution oforganizational activities. In our mobile telephony example, thecapabilities of F and C would include the engineers, managers, salesrepresentatives, backbone networks, transmission towers, mobilehandsets, and associated business processes. The capabilities of Fand C are represented by the stock variables Fcap and Ccap,respectively. These capabilities result in their respective marketofferings that, in our example, would consist of mobile telephonyservices. These services have multiple dimensions including price,geographic coverage, call quality, customer service and billingaccuracy. F’s price may be lower but its geographic coverage maynot be as comprehensive as that of C. The marketing literatureestablishes that customers holistically evaluate the multipledimensions of an offering to form an aggregate assessment ofattractiveness, which then forms the basis for comparison amongdifferent offerings [8,28,29]. Attractiveness is denoted by Fattr andCattr for F and C, respectively. The positive link between Fcap toFattr follows from the fact that higher capability leads to moreattractive offerings. The relationship is thus monotonicallyincreasing but with decreasing marginal returns and is well-established in the literature [54].
The literature on organizational capabilities suggests that thereare limits to capability development and potential for diminishingreturns. Helfat and Peteraf [31] propose a model of capability lifecycles that begins with a founding stage in which capabilities beginto form, followed by a development stage in which capabilitybuilding occurs, followed by a maturity stage in which capabilitybuilding ceases and capabilities reach maturity. Research oncapabilities further suggests that capability development exhibitsa pattern of diminishing marginal returns. For instance, Slotegraafet al. [59] show that returns to market deployment of brand equityand R&D activity monotonically increase but exhibit a pattern ofdiminishing marginal returns. Chu and Keh [15] examine theeffects of lagged advertising, marketing promotions and R&Dexpenses on brand value and show that these lagged expensesresult in diminishing returns. Fortin and Dholakia [25] show thatthere are diminishing returns from the use of the more complexinteractive web-based advertising. Similar behavior has beenobserved in studies of other sectors, such as banking [49]. Finally,Slotegraaf and Dickson [58] suggest that returns from high levels ofcapabilities exhibit diminishing marginal returns due to thepotential competency traps associated with such highly developedcapabilities. Thus, based both on the foregoing observations and onthe fact that attractiveness of product offerings reflects organiza-tional resources and capabilities, we employed a commonly usedand simple negative exponential based function to represent thisrelationship as Fattr = a1 * (1 � exp(�a2 * Fcap)). A similar expres-sion related Ccap to Cattr. The difference in attractiveness, given byAdiff = Fattr � Cattr, drives customer-switching behavior, themechanics of which are discussed shortly; for now, however, wecontinue with the mechanics of the competition between F and C.
A. Dutta et al. / Information & Management 51 (2014) 762–773766
The strategy literature shows that a firm perceives a competitorby observing both its capability and its offerings [18,61]. As notedabove, perception involves delay, and digital systems have beenused by organizations to improve the quality of and delayassociated with perception [11,36]. Investment in digital systemsthat expedite perception was represented by CDS1 and FDS1 for Cand F, respectively, in Fig. 1. C‘s perception delay was representedby PdelayC, the functional form being Pdelay-
C = a3 * exp(�a4 * CDS1). A similar expression for F’s perceptiondelay is shown in Table 1. The negative exponential form captureddiminishing returns to scale typically exhibited by investments intechnology [38].
Following conceptual developments in the strategy literaturementioned in the preceding paragraph, C’s perception of F’scapability was represented by CpFcap and in line with the
Table 1Functional forms of model variables with annotations.
Eq. No Functional relationships
1 Fattr = a1 * (1 � e�a2*Fcap), Cattr = a1 * (1 � e�a2*Ccap)
Experiment Value: a1 = a2 = 1
Fattr(Cattr) increases monotonically with Fcap(Ccap), but at a
decreasing rate, due to well established phenomenon of
diminishing returns to scale
2 Adiff = Fattr � Cattr
Difference in attractiveness of the offerings of firms F and C
3 PdelayC = a3 * e�a4*CDS1, PdelayF = a3 * e�a4*FDS1
Perception delay of C(F) decreases monotonically with
increasing investment in digital systems for perception
CDS1(FDS1). The negative exponential captures decreasing
returns to scale that is characteristic of technology investments.
Experiment value: a4 = 1, a3 = 20 periods
4 CpFcap = Delay (a5*Fcap + (1 � a5) * Fattr, PdelayC) + PerrorC
C’s perception of F is a weighted average of F’s capability and F’s
attractiveness after some delay. The weights are a5 and (1 � a5).
The amount of delay is PdelayC. Additionally, perception is not
perfect and is subject to error. This is captured by the error term
PerrorC.
FpCcap = Delay (a5*Ccap + (1 � a5)*Cattr, PdelayF) + PerrorF
F’s perception of C. Same logic as that for CpFcap
PerrorC, PerrorF = RANDOM UNIFORM [�a6, +a6]
Perception error by C(F). Drawn from a uniform random
distribution.
a6 = a7 * e�CDS1; a6 = a7 * e�FDS1;
A higher investment in digital systems by either C or F not only
reduces perception delay but also reduces perception error.
Thus the range of the uniform random function [�a6, +a6]
shrinks. This reduction in range is captured by the negative
exponential function.
Experiment value: a7 = 1
5 IF (FShare > 0.5 OR Trend(Fshare) > 0) THEN max(0, CpFcap-
Ccap) ELSE 0
If C has a lower market share than F, or if F is gaining in market
share, then C responds by increasing its own capabilities.
IF (FShare < 0.5 OR Trend(Fshare) < 0) THEN max(0, FpFcap-
Fcap) ELSE 0
If F has a lower market share than C, or if C is gaining in market
share, then F responds by increasing its own capabilities.
6 RdelayC = a3 * e�a4*CDS2, RdelayF = a3 * e�a4*FDS2
Reaction delay of C(R). Same reasoning for functional form as in
Eq. (3) for perception delay
7 DelCcap = Delay(DesiredDelCcap, RdelayC)
DelFcap = Delay(DesiredDelFcap, RdelayF)
Increment in capability of C(orF) occurs only after a reaction
delay. Magnitude of delay is given by RdelayC (RdelayF)
8 AdiffSensi = a8 * Tanh(a9 * Adiff)
S-shaped function that captures customers’ sensitivity to
difference in attractiveness of F and C. Experiment value: a8 = 1,
a9 = 5.
9 Fshare = Fcust/(Fcust + Ccust)
foregoing discussion, had inbound links from Fcap, Fattr andPdelayC. The functional form was given by CpFcap = Delay(a5 * F-
cap + (1 � a5) * Fattr, PdelayC) + PerrorC, where PerrorC = RANDOMUNIFORM [�a6, +a6]. Following our earlier observation thatperceptions of capability result from observing the competitor’scapability and offerings, the input to the delay function was theweighted average a5 * Fcap + (1 � a5) * Fattr. This input wasdelayed by PdelayC to yield the perceived capability CpFcap. Anerror term, PerrorC, was later added because, as noted earlier,perception was also imperfect. PerrorC was assumed to beuniformly distributed between an upper and lower limit, withthe range depending on the level of investment in digital systemsfor perception, the functional form being a6 = a7 * eCDS1 torepresent diminishing returns to scale. With additional investmentin digital systems to improve perception, not only does theperception process become faster but also it becomes lesssusceptible to error. Thus, the range of the uniform distributionrepresenting error in perceptions shrinks as CDS1 increases. Therewas a similar link structure leading into FpCcap (F’s perception ofC’s capability). The double hash mark on selected links indicates adelayed cause–effect relationship.
In our model, C perceived F’s capability, CpFcap, and its ownposition relative to F in market share (1 � Fshare). Its reaction wasto want to increase its own capability by a certain amount given byDesiredDelCcap, the functional form being given by DesiredDelCca-
p = IF (FShare > 0.5 OR Trend(Fshare) > 0) THEN max(0,CpF-
cap � Ccap) ELSE 0. This expression caused C to react if eitherits market share was less than that of F (Fshare > 0.5) or if F wasgaining on C (Trend(Fshare) > 0). The magnitude of the desiredincrease is the difference between C’s perception of F’s capabilityand its own. A similar equation specified the logic of F’s reactionand can be found in Table 1. DesiredDelCcap results in actualchange in C’s capability, DelCcap, but only after a delay, RdelayC,because a firm cannot react instantaneously. For instance, whenMCI introduced its Friends and Family program sometimearound1990, it took some time for AT&T to reengineer its billingroutines and business process to respond to this move, and MCIdrew customers away from AT&T in the interim. As withperception, digital systems are commonly used by organizationsto reduce reaction delay [74]. For instance, organizations oftenimplement ERP systems to improve business process integrationand their ability to respond more nimbly to changing businessenvironments. Research indicates that these implementations takesubstantial amounts of time depending on a variety of factors [56].A more extensive example of investing in IT to achieve operationalagility can be found in a case study of the Haier company [32].Investment in digital systems for reduction in reaction delays wasrepresented by CDS2 for C andFDS2 for F. Based on the same logicpresented earlier for PdelayC, the reaction delay for C was givenRdelayC = a3 * e�CDS2. Actual increase in C’s capability was there-fore given by DelCcap = Delay(DesiredDelCcap, RdelayC). A similarset of equations governed F’s reactions, as shown in Table 1.
Now that individual links in the right substructure of Fig. 1 havebeen presented and justified, we can identify the macro causalmechanisms resulting from the synthesis of individual links.Consider the feedback loop: Fcap !+ CpFcap !+ DesiredDelCcap !+ DelCcap !+ Ccap !+ FpCcap !+ DesiredDelFcap !+ DelFcap !+ F-
Fcap. Multiplication of the link polarities (shown alongside each arrow)
results in a positive polarity, indicating that this is a positive feedback
loop. The physical interpretation of this loop is one of escalation where, if
F increases its capability, C’s perception of F’s capability will increase,
leading to C increasing its own capabilities. This move will cause F’s
perception of C’s capability to increase, leading F to further increase its
capability because of the responses made by C. This type of escalation is
seen in the FedEx vs. UPS example presented earlier. Now consider the
feedback loop: Fcap !+ Fattr !+ Adiff !+ AdiffSensi !� Fcustout !
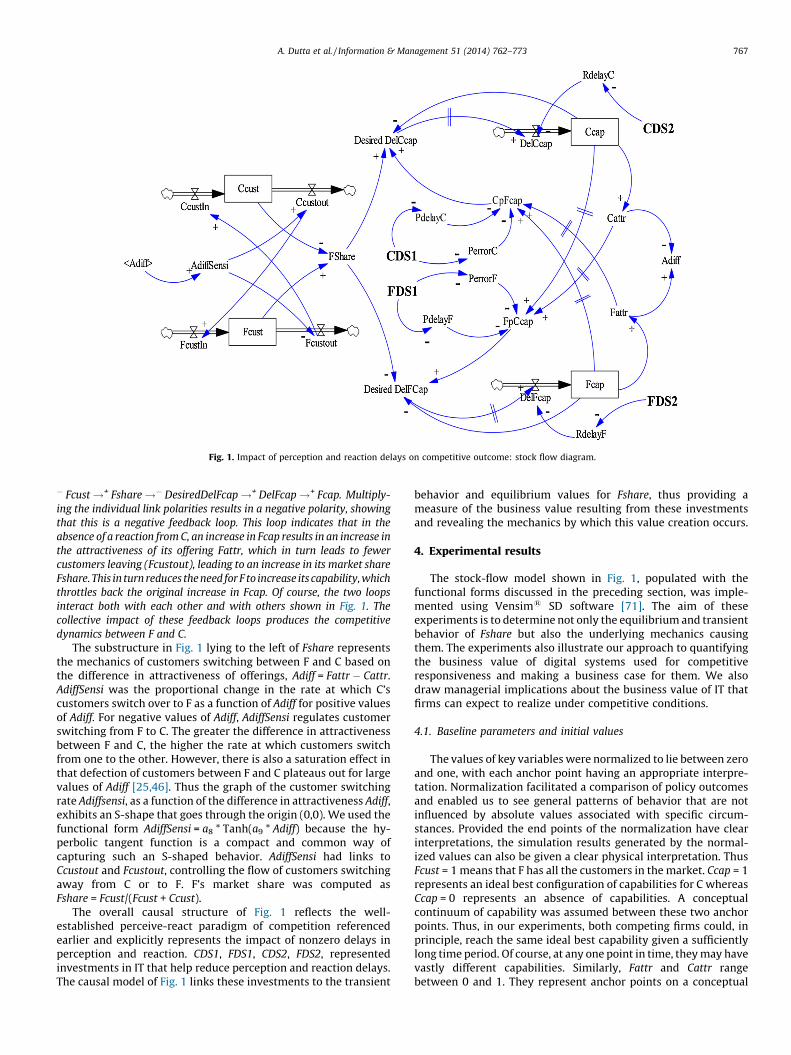
Fig. 1. Impact of perception and reaction delays on competitive outcome: stock flow diagram.
A. Dutta et al. / Information & Management 51 (2014) 762–773 767
� Fcust !+ Fshare !� DesiredDelFcap !+ DelFcap !+ Fcap. Multiply-
ing the individual link polarities results in a negative polarity, showing
that this is a negative feedback loop. This loop indicates that in the
absence of a reaction from C, an increase in Fcap results in an increase in
the attractiveness of its offering Fattr, which in turn leads to fewer
customers leaving (Fcustout), leading to an increase in its market share
Fshare. This in turn reduces the need for F to increase its capability, which
throttles back the original increase in Fcap. Of course, the two loops
interact both with each other and with others shown in Fig. 1. The
collective impact of these feedback loops produces the competitive
dynamics between F and C.
The substructure in Fig. 1 lying to the left of Fshare representsthe mechanics of customers switching between F and C based onthe difference in attractiveness of offerings, Adiff = Fattr � Cattr.AdiffSensi was the proportional change in the rate at which C’scustomers switch over to F as a function of Adiff for positive valuesof Adiff. For negative values of Adiff, AdiffSensi regulates customerswitching from F to C. The greater the difference in attractivenessbetween F and C, the higher the rate at which customers switchfrom one to the other. However, there is also a saturation effect inthat defection of customers between F and C plateaus out for largevalues of Adiff [25,46]. Thus the graph of the customer switchingrate Adiffsensi, as a function of the difference in attractiveness Adiff,exhibits an S-shape that goes through the origin (0,0). We used thefunctional form AdiffSensi = a8 * Tanh(a9 * Adiff) because the hy-perbolic tangent function is a compact and common way ofcapturing such an S-shaped behavior. AdiffSensi had links toCcustout and Fcustout, controlling the flow of customers switchingaway from C or to F. F’s market share was computed asFshare = Fcust/(Fcust + Ccust).
The overall causal structure of Fig. 1 reflects the well-established perceive-react paradigm of competition referencedearlier and explicitly represents the impact of nonzero delays inperception and reaction. CDS1, FDS1, CDS2, FDS2, representedinvestments in IT that help reduce perception and reaction delays.The causal model of Fig. 1 links these investments to the transient
behavior and equilibrium values for Fshare, thus providing ameasure of the business value resulting from these investmentsand revealing the mechanics by which this value creation occurs.
4. Experimental results
The stock-flow model shown in Fig. 1, populated with thefunctional forms discussed in the preceding section, was imple-mented using Vensim1 SD software [71]. The aim of theseexperiments is to determine not only the equilibrium and transientbehavior of Fshare but also the underlying mechanics causingthem. The experiments also illustrate our approach to quantifyingthe business value of digital systems used for competitiveresponsiveness and making a business case for them. We alsodraw managerial implications about the business value of IT thatfirms can expect to realize under competitive conditions.
4.1. Baseline parameters and initial values
The values of key variables were normalized to lie between zeroand one, with each anchor point having an appropriate interpre-tation. Normalization facilitated a comparison of policy outcomesand enabled us to see general patterns of behavior that are notinfluenced by absolute values associated with specific circum-stances. Provided the end points of the normalization have clearinterpretations, the simulation results generated by the normal-ized values can also be given a clear physical interpretation. ThusFcust = 1 means that F has all the customers in the market. Ccap = 1represents an ideal best configuration of capabilities for C whereasCcap = 0 represents an absence of capabilities. A conceptualcontinuum of capability was assumed between these two anchorpoints. Thus, in our experiments, both competing firms could, inprinciple, reach the same ideal best capability given a sufficientlylong time period. Of course, at any one point in time, they may havevastly different capabilities. Similarly, Fattr and Cattr rangebetween 0 and 1. They represent anchor points on a conceptual
CDS_low-FDS_Low11111
00000
55
5
55 5
5 55
4
4 4
4
4 4 4 4 4
3 3
3 3
3
33
3 3
2 2
2
2 22
2 2 2
11
1
1
11 1 1 1 1
0 8 16 24 32 40 48 56 64 72 80 88 96 10 4Time (Week)
Fshare 1 1 1 1 1 1 1 1Ccap 2 2 2 2 2 2 2 2 2CpFcap 3 3 3 3 3 3 3 3 3Fcap 4 4 4 4 4 4 4 4 4FpCcap 5 5 5 5 5 5 5 5 5
Fig. 2. Dynamics – low DS investment levels.
CDS_Med-FDS_Med11111
00000
5 5
55
55 5 5 5
4
4 4
4 4 4 4 4 4
3
33
3
3 3 3 3 3
2 2
22
22 2 2 2
11
1
11 1 1 1 1 1
0 8 16 24 32 40 48 56 64 72 80 88 96 10 4Time (Week)
A. Dutta et al. / Information & Management 51 (2014) 762–773768
continuum of attractiveness, with 1 representing an ideal point. Theconcept of ‘ideal points’ in the evaluation of products by customers iswell established in the marketing literature [23]. CDS1, CDS2, FDS1
and FDS2, likewise, range between 0 and 1, with 1 representing thehighest investment that could reasonably be contemplated by eithercompetitor. As a consequence of normalizing key variables to liebetween zero and one, many of the coefficients of the functionalrelationships between cause and effect also must be set to one. Thesevalues are shown in Table 1. Because many digital systemssimultaneously help reduce perception and reaction delays,3 forsimplicity we set CDS1 = CDS2 and FDS1 = FDS2 in the simulationruns, and represented them by CDS and FDS.
F and C were set to be identical in their initial capabilities andeach had the same initial number of customers. Customers wereassumed moderately sensitive to differences in attractiveness ofthe competing offerings. Although competing firms often do notstart out as identical, we deliberately made them identical in theexperiments. Otherwise, when there were changes in transientbehavior or equilibrium outcomes, it would have been difficult toisolate the impact of initial conditions from that of perception/reaction delays, compromising the objective of our study. Thus theinitial values are Fcust = 0.5, Fcap = Ccap = 0.2, CDS = FDS = 0.1,AdiffSensi = 0.5. If the baseline scenario persists and neitherparticipant makes a move, equilibrium holds and F and C eachcontinue to enjoy a 50% market share indefinitely.
4.2. Dynamic behavior of competitive outcome
In the first set of experiments, F makes a first move byintroducing a step increase in its capability at T = 10. The dynamicbehavior of competitive outcomes, represented by Fshare, is thenexamined for different combinations of investment in IT by the twocompetitors.
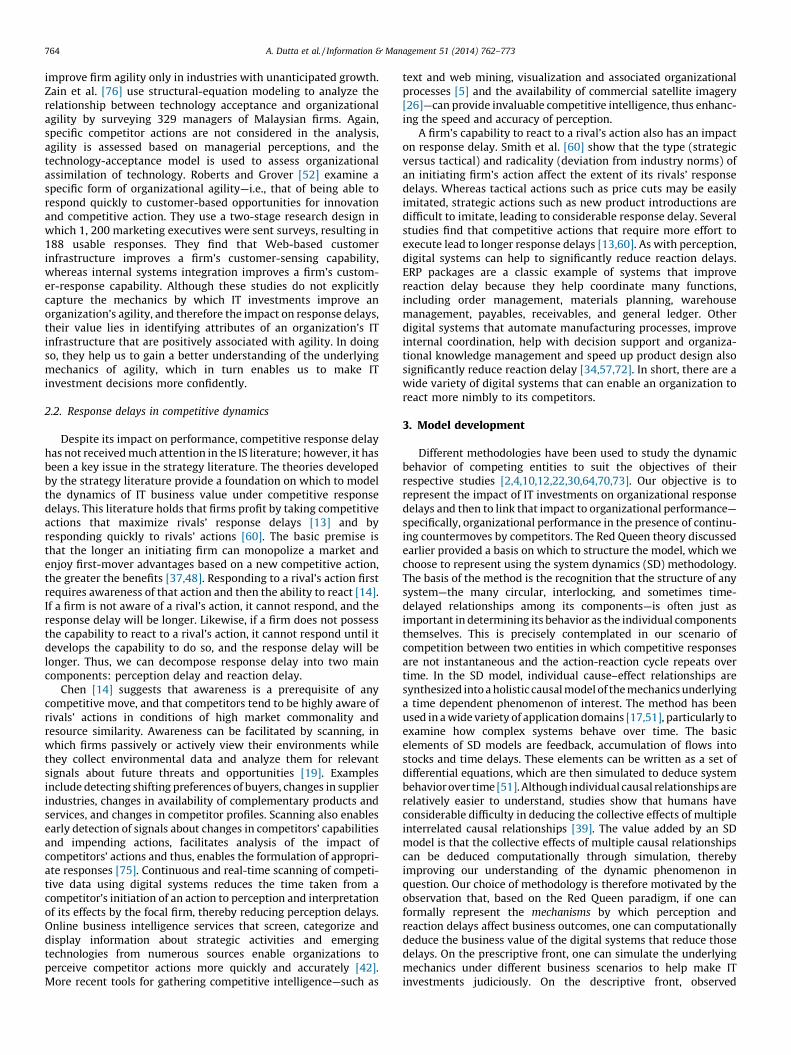
Case#1-Baseline(CDS = Low, FDS = Low): Here, both C and Fhave low levels of investment in digital systems for perception andreaction (CDS = FDS = 0.1). Fig. 2 shows the resulting behavior ofFshare and that of Fcap, Ccap, FpCcap and CpFcap (F’s capability, C’scapability, F’s perception of C’s capability and C’s perception of F’scapability, respectively).
Fig. 2 shows the short-lived nature of the first-moveradvantage, not unlike the FedEx-UPS rivalry. Fshare (Line#1) startsat 0.5, the equilibrium condition, and increases rapidly when Fincreases Fcap at T = 10 (Line#4). This is because F has suddenlyincreased its capability, resulting in its offering being moreattractive than that of C and more customers switching over toF. C’s perception of F’s change in capability is neither instantaneousnor perfect—notice the random variations in CpFcap (Line#3) andthat it starts to rise only several periods after T = 10. The increase inFshare causes C, following Eq. (5) in Table 1, to respond byincreasing its own capability. However, reaction takes time,resulting in Ccap (Line#2) increasing several periods after T = 10.During this ‘catch up’ period, F continues to win at the expense of C,as seen in the increase in Fshare until about T = 24. Interestingly,although first-mover F has won thus far, its winnings do not last.After T = 24, Fshare begins to drop, indicating that C has not onlystemmed the gains of the first mover but also is actually regainingsome of its lost ground. This follows from the second feedback loopidentified in Section 3, which causes C to react to F. In fact, ataround T = 38 Fshare dips below 0.5, indicating that C has beatenfirst-mover F in market share. C continues to beat F in market shareuntil about T = 44, at which time F starts to recover. This time, F is
3 For instance, a Customer Relationship Management (CRM) system can alert F to
actions by competitor C via the feedback or complaints received from customers.
The customer behavior and preference data collected by the same CRM may also
simultaneously enable F to react to C’s moves.
playing catch-up, in part due to its own perception and reactiondelays. In equilibrium, Fshare goes back to approximately 0.5because over the long run, F and C catch up with one another. Thus,in this scenario, first-mover F’s gain in market share wastemporary, but it did come out ahead of C in total gains overthe duration of the game. This follows from the observation thatthe area of the Fshare curve above the Fshare = 0.5 reference line isgreater than the area below. Note also that the business value ofthe capability increase was realized completely during thetransient phase. This important insight is revealed because theSD methodology explicitly focused on modeling the delay andtransient behavior.
This ‘overshoot’ and ‘undershoot’ in Fshare is primarily aconsequence of perception and reaction delays. It is well knownthat delays generate oscillatory behavior in physical and socialsystems [51]. C responds by aiming to match F’s increasedcapability, but because of C’s perception delay it continues toincrease capability even after F has stopped increasing itscapability. Moreover, Ccap continues to increase for a short timebecause planned increases take time to manifest, due to reactiondelays. By overshooting, Ccap becomes greater than Fcap, whichenables C to recapture some lost ground. When C becomes morecapable than F, F responds using the same type of mechanics,which explains the rise back to Fshare = 0.5 from T = 44 onwards.
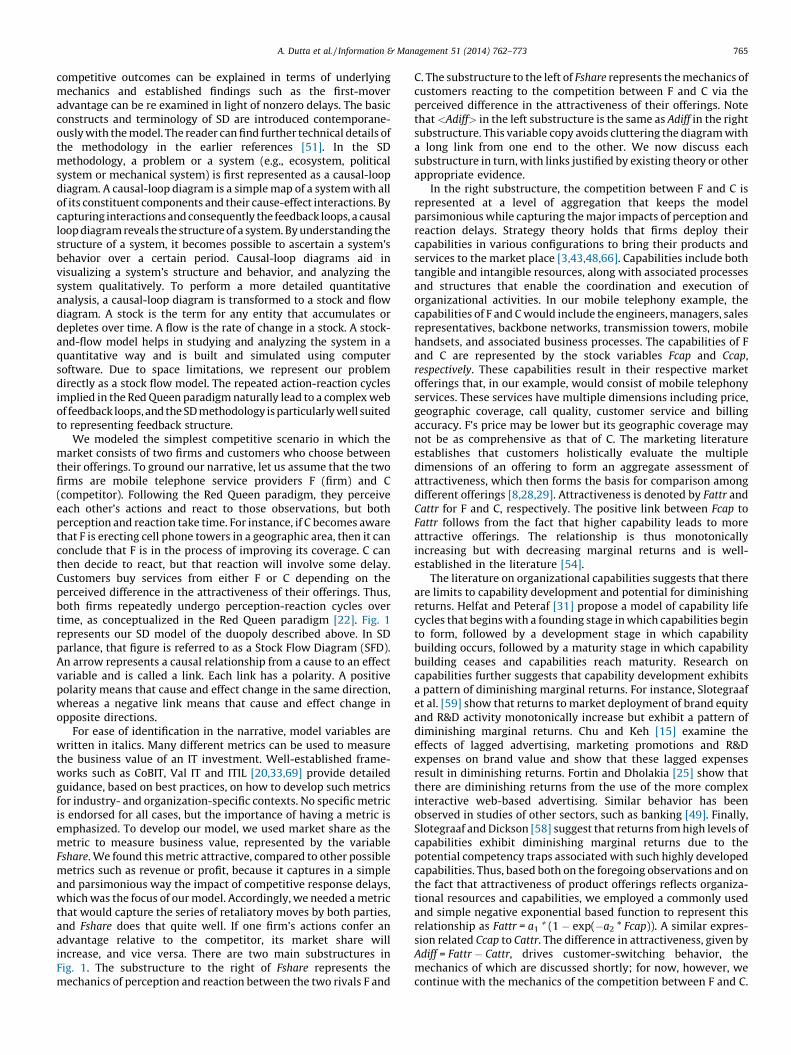
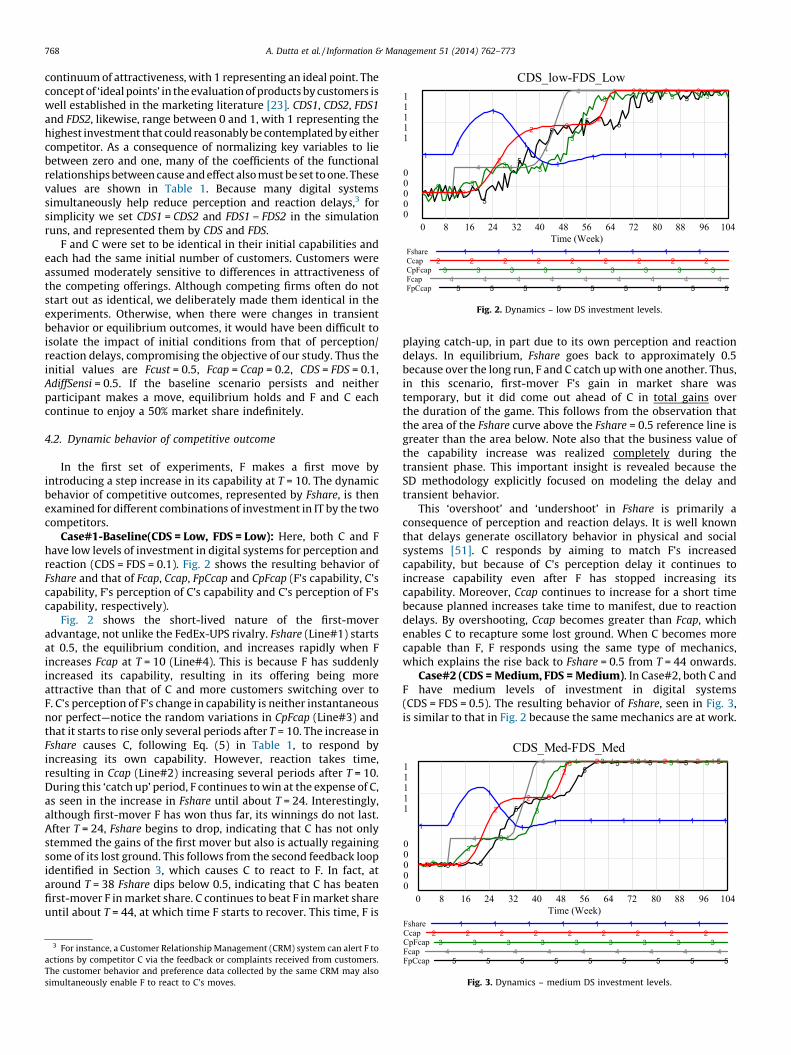
Case#2 (CDS = Medium, FDS = Medium). In Case#2, both C andF have medium levels of investment in digital systems(CDS = FDS = 0.5). The resulting behavior of Fshare, seen in Fig. 3,is similar to that in Fig. 2 because the same mechanics are at work.
Fshare 1 1 1 1 1 1 1 1Ccap 2 2 2 2 2 2 2 2 2CpFcap 3 3 3 3 3 3 3 3 3Fcap 4 4 4 4 4 4 4 4 4FpCcap 5 5 5 5 5 5 5 5 5
Fig. 3. Dynamics – medium DS investment levels.
CDS_High -FDS_High11111
00000
5
5
5
5
5 5 5 5 5
4
4
4
44 4 4 4 4
3
33
33
3 3 3 3
2 2
22
2 2 2 2 2
11
11 1 1 1 1 1 1
0 8 16 24 32 40 48 56 64 72 80 88 96 104Time (Week)
Fshare 1 1 1 1 1 1 1 1Ccap 2 2 2 2 2 2 2 2 2CpFcap 3 3 3 3 3 3 3 3 3Fcap 4 4 4 4 4 4 4 4 4FpCcap 5 5 5 5 5 5 5 5 5
Fig. 4. Dynamics – high DS investment levels.
CDS_High-FDS_Low11111
00000
5 5
55
5 5 5 5 5
4
4 4
44 4 4 4 4
3
3 3
3
3 3 3 3 3
2 2
2 2
2 2 2 2 2
11 1
11 1 1 1 1 1
0 8 16 24 32 40 48 56 64 72 80 88 96 104Time (Week)
Fshare 1 1 1 1 1 1 1 1Ccap 2 2 2 2 2 2 2 2 2CpFcap 3 3 3 3 3 3 3 3 3Fcap 4 4 4 4 4 4 4 4 4FpCcap 5 5 5 5 5 5 5 5 5
Fig. 5. Dynamics – C_High, F_Low DS investment.
A. Dutta et al. / Information & Management 51 (2014) 762–773 769
Perception and reaction delays can again be seen in the temporalbehavior of Fcap, Ccap, FpCcap because F and C perceive and react toone another. However, in this scenario, F maintains its gain inFshare over the long term, as seen by the equilibrium value ofFshare (Line#1) being greater than 0.5. The reason is that C, despitereacting faster than in Case#1, is unable to win back customerswho switched over to F during the first move because F is now alsoreacting faster than it did in Case#1(CDS and FDS are both = 0.5).This behavior suggests that a threshold effect is at work in thatfirst-mover advantage could be sustained if the investment indigital systems by this mover exceeds a particular threshold.
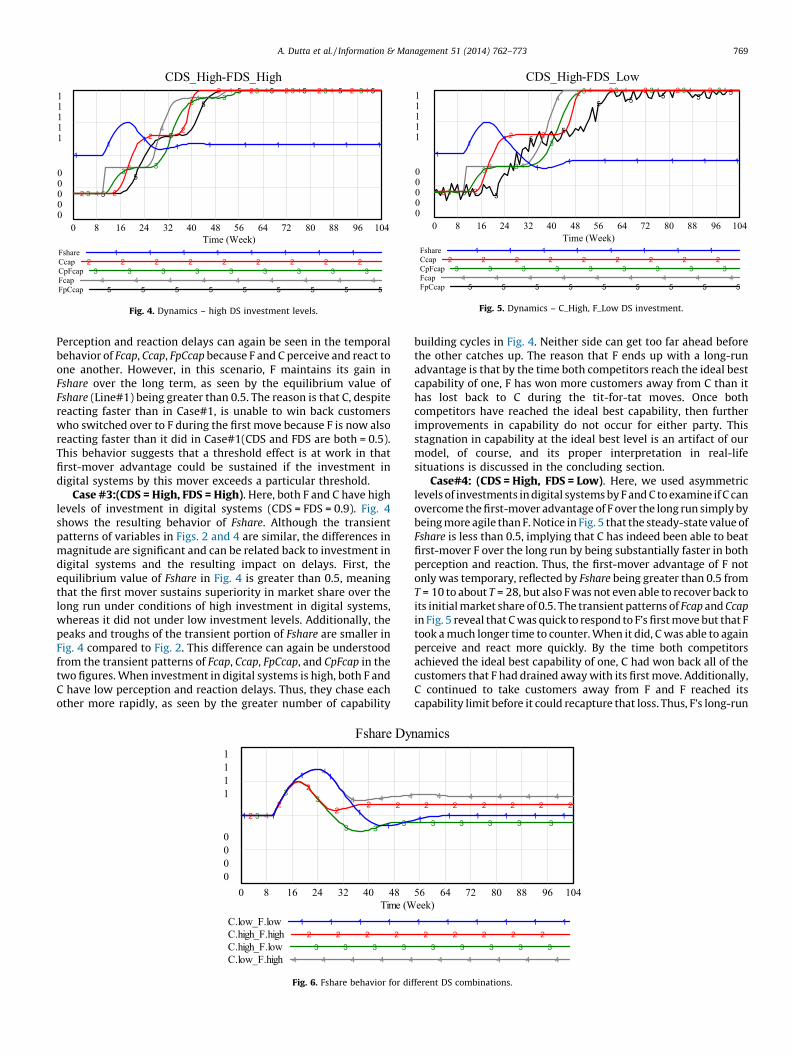
Case #3:(CDS = High, FDS = High). Here, both F and C have highlevels of investment in digital systems (CDS = FDS = 0.9). Fig. 4shows the resulting behavior of Fshare. Although the transientpatterns of variables in Figs. 2 and 4 are similar, the differences inmagnitude are significant and can be related back to investment indigital systems and the resulting impact on delays. First, theequilibrium value of Fshare in Fig. 4 is greater than 0.5, meaningthat the first mover sustains superiority in market share over thelong run under conditions of high investment in digital systems,whereas it did not under low investment levels. Additionally, thepeaks and troughs of the transient portion of Fshare are smaller inFig. 4 compared to Fig. 2. This difference can again be understoodfrom the transient patterns of Fcap, Ccap, FpCcap, and CpFcap in thetwo figures. When investment in digital systems is high, both F andC have low perception and reaction delays. Thus, they chase eachother more rapidly, as seen by the greater number of capability
Fshare Dy1111
0000
4
44
4 4 4
3
33
3 33 2
2
2
22 2
1 1
1 1
1
1
0 8 16 24 32 40 48 Tim e (W
C.low_F.low 1 1 1 1C.high _F.high 2 2 2 2C.high _F.low 3 3 3 3C.low_F.high 4 4 4 4 4
Fig. 6. Fshare behavior for di
building cycles in Fig. 4. Neither side can get too far ahead beforethe other catches up. The reason that F ends up with a long-runadvantage is that by the time both competitors reach the ideal bestcapability of one, F has won more customers away from C than ithas lost back to C during the tit-for-tat moves. Once bothcompetitors have reached the ideal best capability, then furtherimprovements in capability do not occur for either party. Thisstagnation in capability at the ideal best level is an artifact of ourmodel, of course, and its proper interpretation in real-lifesituations is discussed in the concluding section.
Case#4: (CDS = High, FDS = Low). Here, we used asymmetriclevels of investments in digital systems by F and C to examine if C canovercome the first-mover advantage of F over the long run simply bybeing more agile than F. Notice in Fig. 5 that the steady-state value ofFshare is less than 0.5, implying that C has indeed been able to beatfirst-mover F over the long run by being substantially faster in bothperception and reaction. Thus, the first-mover advantage of F notonly was temporary, reflected by Fshare being greater than 0.5 fromT = 10 to about T = 28, but also F was not even able to recover back toits initial market share of 0.5. The transient patterns of Fcap and Ccap
in Fig. 5 reveal that C was quick to respond to F’s first move but that Ftook a much longer time to counter. When it did, C was able to againperceive and react more quickly. By the time both competitorsachieved the ideal best capability of one, C had won back all of thecustomers that F had drained away with its first move. Additionally,C continued to take customers away from F and F reached itscapability limit before it could recapture that loss. Thus, F’s long-run
nam ics
4 4 4 4 4
3 3 3 3 3
2 2 2 2 2 2
1 1 1 1 1 1
56 64 72 80 88 96 104eek)1 1 1 1 1 12 2 2 2 23 3 3 3 34 4 4 4 4
fferent DS combinations.
CDS1.00.90.80.70.60.50.40.30.20.10
Mea
ns F
shar
e
0.65
0.60
0.55
0.50
0.45
.10
.20
.30
.40
.50
.60
.70
.80
.901.00
FDS
The Effect of FDS an d CDS on Fsh are at Low Customer Sensitivit y
Fig. 7. Effect of FDS and CDS on Fshare – low customer sensitivity.
A. Dutta et al. / Information & Management 51 (2014) 762–773770
market share is less than 0.5, despite being the first mover.Therefore, Case#5 indicates that there may be some merit to being avery agile follower rather than a first, but slow, mover.
Fig. 6 compares the dynamic behavior of Fshare under differentcombinations of investment in digital systems. It reveals patternsin both the steady-state value of Fshare and its transient behavior.The results show that a competitor may, in the long run, be able tostop or reverse the gains of a first mover by investing more indigital systems to reduce its perception and reaction delaysrelative to the first mover. We can also see that the magnitude oftransient gains or losses in market share experienced by thecompetitors increases with delay. In other words, higher invest-ment in digital systems can enable C to limit the extent oftemporary gain achieved by the first mover.
In many studies of IT value, the emphasis is on equilibrium orlong-term outcomes. Our experiments show that it is just asimportant to understand the transient behavior of business
CDS.6.50.40.30.20.10
Mea
n Fs
hare
0.65
0.60
0.55
0.50
0.45
0.40
0.35
The Effect of FDS an d CDS on Fsh
Fig. 8. Effect of FDS and CDS on Fsh
outcomes, for example, Fshare, resulting from IT investments.We draw this conclusion because although the model simulatesthe long-term (T = 104) consequence of a first move by F, in reality,the interaction among firms is a sequence of such games, and onegame may ‘start’ before the previous one has reached steady state.Thus, an analysis of business value of an IT investment may need tofocus primarily on transient behavior in highly competitiveenvironments.
4.3. Analysis of equilibrium outcomes
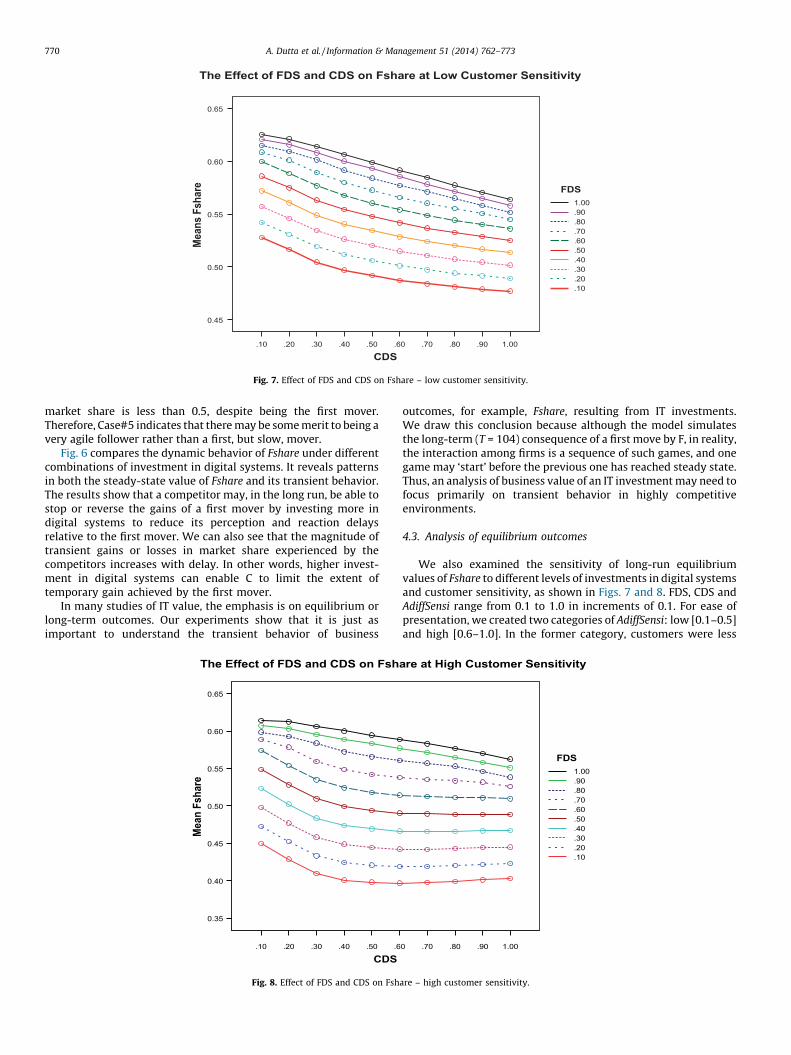
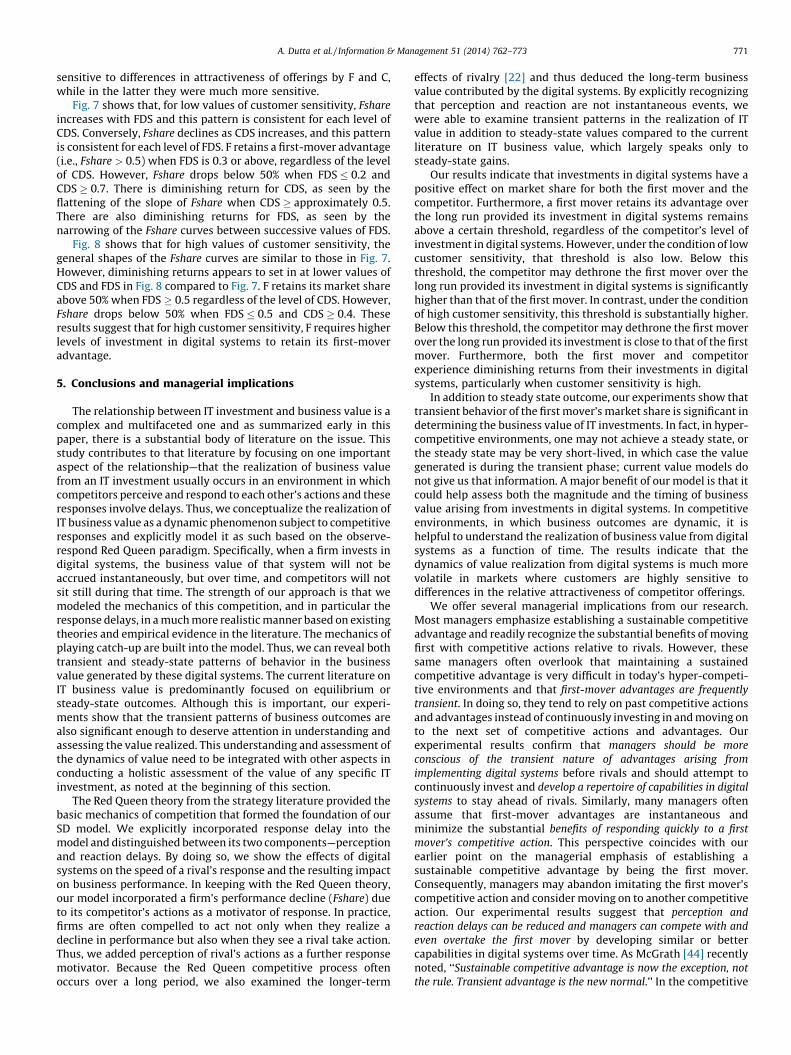
We also examined the sensitivity of long-run equilibriumvalues of Fshare to different levels of investments in digital systemsand customer sensitivity, as shown in Figs. 7 and 8. FDS, CDS andAdiffSensi range from 0.1 to 1.0 in increments of 0.1. For ease ofpresentation, we created two categories of AdiffSensi: low [0.1–0.5]and high [0.6–1.0]. In the former category, customers were less
1.00.90.80.700
.10
.20
.30
.40
.50
.60
.70
.80
.901.00
FDS
are at High Customer Sens itivit y
are – high customer sensitivity.
A. Dutta et al. / Information & Management 51 (2014) 762–773 771
sensitive to differences in attractiveness of offerings by F and C,while in the latter they were much more sensitive.
Fig. 7 shows that, for low values of customer sensitivity, Fshare
increases with FDS and this pattern is consistent for each level ofCDS. Conversely, Fshare declines as CDS increases, and this patternis consistent for each level of FDS. F retains a first-mover advantage(i.e., Fshare > 0.5) when FDS is 0.3 or above, regardless of the levelof CDS. However, Fshare drops below 50% when FDS � 0.2 andCDS � 0.7. There is diminishing return for CDS, as seen by theflattening of the slope of Fshare when CDS � approximately 0.5.There are also diminishing returns for FDS, as seen by thenarrowing of the Fshare curves between successive values of FDS.
Fig. 8 shows that for high values of customer sensitivity, thegeneral shapes of the Fshare curves are similar to those in Fig. 7.However, diminishing returns appears to set in at lower values ofCDS and FDS in Fig. 8 compared to Fig. 7. F retains its market shareabove 50% when FDS � 0.5 regardless of the level of CDS. However,Fshare drops below 50% when FDS � 0.5 and CDS � 0.4. Theseresults suggest that for high customer sensitivity, F requires higherlevels of investment in digital systems to retain its first-moveradvantage.
5. Conclusions and managerial implications
The relationship between IT investment and business value is acomplex and multifaceted one and as summarized early in thispaper, there is a substantial body of literature on the issue. Thisstudy contributes to that literature by focusing on one importantaspect of the relationship—that the realization of business valuefrom an IT investment usually occurs in an environment in whichcompetitors perceive and respond to each other’s actions and theseresponses involve delays. Thus, we conceptualize the realization ofIT business value as a dynamic phenomenon subject to competitiveresponses and explicitly model it as such based on the observe-respond Red Queen paradigm. Specifically, when a firm invests indigital systems, the business value of that system will not beaccrued instantaneously, but over time, and competitors will notsit still during that time. The strength of our approach is that wemodeled the mechanics of this competition, and in particular theresponse delays, in a much more realistic manner based on existingtheories and empirical evidence in the literature. The mechanics ofplaying catch-up are built into the model. Thus, we can reveal bothtransient and steady-state patterns of behavior in the businessvalue generated by these digital systems. The current literature onIT business value is predominantly focused on equilibrium orsteady-state outcomes. Although this is important, our experi-ments show that the transient patterns of business outcomes arealso significant enough to deserve attention in understanding andassessing the value realized. This understanding and assessment ofthe dynamics of value need to be integrated with other aspects inconducting a holistic assessment of the value of any specific ITinvestment, as noted at the beginning of this section.
The Red Queen theory from the strategy literature provided thebasic mechanics of competition that formed the foundation of ourSD model. We explicitly incorporated response delay into themodel and distinguished between its two components—perceptionand reaction delays. By doing so, we show the effects of digitalsystems on the speed of a rival’s response and the resulting impacton business performance. In keeping with the Red Queen theory,our model incorporated a firm’s performance decline (Fshare) dueto its competitor’s actions as a motivator of response. In practice,firms are often compelled to act not only when they realize adecline in performance but also when they see a rival take action.Thus, we added perception of rival’s actions as a further responsemotivator. Because the Red Queen competitive process oftenoccurs over a long period, we also examined the longer-term
effects of rivalry [22] and thus deduced the long-term businessvalue contributed by the digital systems. By explicitly recognizingthat perception and reaction are not instantaneous events, wewere able to examine transient patterns in the realization of ITvalue in addition to steady-state values compared to the currentliterature on IT business value, which largely speaks only tosteady-state gains.
Our results indicate that investments in digital systems have apositive effect on market share for both the first mover and thecompetitor. Furthermore, a first mover retains its advantage overthe long run provided its investment in digital systems remainsabove a certain threshold, regardless of the competitor’s level ofinvestment in digital systems. However, under the condition of lowcustomer sensitivity, that threshold is also low. Below thisthreshold, the competitor may dethrone the first mover over thelong run provided its investment in digital systems is significantlyhigher than that of the first mover. In contrast, under the conditionof high customer sensitivity, this threshold is substantially higher.Below this threshold, the competitor may dethrone the first moverover the long run provided its investment is close to that of the firstmover. Furthermore, both the first mover and competitorexperience diminishing returns from their investments in digitalsystems, particularly when customer sensitivity is high.
In addition to steady state outcome, our experiments show thattransient behavior of the first mover’s market share is significant indetermining the business value of IT investments. In fact, in hyper-competitive environments, one may not achieve a steady state, orthe steady state may be very short-lived, in which case the valuegenerated is during the transient phase; current value models donot give us that information. A major benefit of our model is that itcould help assess both the magnitude and the timing of businessvalue arising from investments in digital systems. In competitiveenvironments, in which business outcomes are dynamic, it ishelpful to understand the realization of business value from digitalsystems as a function of time. The results indicate that thedynamics of value realization from digital systems is much morevolatile in markets where customers are highly sensitive todifferences in the relative attractiveness of competitor offerings.
We offer several managerial implications from our research.Most managers emphasize establishing a sustainable competitiveadvantage and readily recognize the substantial benefits of movingfirst with competitive actions relative to rivals. However, thesesame managers often overlook that maintaining a sustainedcompetitive advantage is very difficult in today’s hyper-competi-tive environments and that first-mover advantages are frequently
transient. In doing so, they tend to rely on past competitive actionsand advantages instead of continuously investing in and moving onto the next set of competitive actions and advantages. Ourexperimental results confirm that managers should be more
conscious of the transient nature of advantages arising from
implementing digital systems before rivals and should attempt tocontinuously invest and develop a repertoire of capabilities in digital
systems to stay ahead of rivals. Similarly, many managers oftenassume that first-mover advantages are instantaneous andminimize the substantial benefits of responding quickly to a first
mover’s competitive action. This perspective coincides with ourearlier point on the managerial emphasis of establishing asustainable competitive advantage by being the first mover.Consequently, managers may abandon imitating the first mover’scompetitive action and consider moving on to another competitiveaction. Our experimental results suggest that perception and
reaction delays can be reduced and managers can compete with and
even overtake the first mover by developing similar or bettercapabilities in digital systems over time. As McGrath [44] recentlynoted, ‘‘Sustainable competitive advantage is now the exception, not
the rule. Transient advantage is the new normal.’’ In the competitive
A. Dutta et al. / Information & Management 51 (2014) 762–773772
dynamics of digital systems, we concur and submit that managersshould accept this ‘‘new normal’’ of transient advantage.
Early in this paper, we noted the availability of best practicesframeworks, such as ITIL Val IT and COBIT, that outline systematicways of examining the multiple facets of IT business value inspecific instances. Our findings on the dynamics of IT businessvalue can be assimilated into those frameworks at several levels.For instance, Val IT has general guiding principles and morespecific processes as part of its governance framework. Oneexample of a guiding principle is that ‘IT enabled investments aremanaged through their full economic life cycle’. Clearly, thisguiding principle recognizes that IT business value is not a staticphenomenon, but instead is realized over time. Otherwise, therewould be no need to manage it over its life cycle. Our findingsabout the transient nature of first-mover advantage, or thepotential advantage of being an agile follower rather than aninnovator, are directly relevant to applying this guiding principle.Another guiding principle is ‘Value delivery practices recognizethat there are different categories of investments that will beevaluated and managed differently’. In other words, all ITinvestment opportunities are not created equal and must beevaluated differently. Our work highlights the contribution of IT toorganizational agility and offers a way to quantify and evaluatethat benefit, and thus can inform this guiding principle. When onedrops down to processes, Val-IT has several areas for which ourfindings would be informative. For instance, one of the processesidentified under portfolio management is to ‘evaluate and selectprojects to fund’. Our findings can directly inform such a process.Other frameworks such as COBIT and ITIL also describe principles,processes, tasks and checklists with the aim of delivering valuefrom IT investments. Although specifics vary, there is a fair degreeof conceptual commonality across these different frameworks andour work can inform the other frameworks in a manner similar tothat outlined for Val-IT.
In closing, it is worth observing that the importance oforganizational agility, coupled with our ubiquitous dependenceon IT, has initiated an examination of agile IT infrastructures in theIS literature [63]. In other words, the literature examines whatstructures of software, hardware and networking building blocksallow organizations to adapt their IT infrastructure speedily torespond quickly to changes in the competitive environment. Aswith all models, ours has its simplifications that suggest directionsfor extensions. Our model assumes homogeneity in customerpreferences when in reality, all customers do not have the samepreference patterns for quality. This means that coefficients a8 anda9 shown in Table 1 need to be changed from constants toprobability distributions. Additionally, we could obtain a morerefined understanding of competitive dynamics by progressivedisaggregation of the attractiveness construct. A first step would beto decompose attractiveness into price and quality. This wouldallow the model to capture differential reactions to the twodimensions. For example, it could allow a competitor to reactimmediately to a price move by a rival, but experience a longerdelay when reacting to a quality improvement. The modeling ofdelay can also be customized for specific circumstances. Forinstance, if the competitive setting is such that when an action istaken, the rival perceives the action gradually, one can use third-order delay functions (in reality, this is the most commonoccurrence). Conversely, in certain environments, although actionsare perceived after some delay, they are perceived all at onceinstead of gradually. In this situation, one would use infinite orderdelay functions. One could also conduct additional experiments toexplore competitive outcomes under asymmetric initial condi-tions. In general, the causal model and its implementation usingthe SD methodology provides a conceptual and computationalplatform on which to explore competitive dynamics and the
impact of digital systems on this phenomenon, thereby providinganother framework for assessing the business value of ITinvestments.
References
[1] S. Altschuller, D. Gelb, T. Henry, IT as a resource for competitive agility: an analysisof firm performance during industry turbulence, J. Int. Technol. Inf. Manag. 19(January (1)), 2010, pp. 39–40.
[2] S. Bandyopadhyay, J.M. Barron, A.R. Chaturvedi, Competition among sellers inonline exchanges, Inf. Syst. Res. 16 (1), 2005, pp. 47–60.
[3] S.L. Berman, J. Down, C.W.L. Hill, Tacit knowledge as a source of competitiveadvantage in the National Basketball Association, Acad. Manag. J. 45 (1), 2002, pp.13–31.
[4] G. Bhatt, V. Grover, Types of information technology capabilities and their role incompetitive advantage: an empirical study, J. Manag. Inf. Syst. 22 (2), 2005, pp.253–277.
[5] I. Bose, R. Pal, A. Ye, ERP and SCM systems integration: the case of a valvemanufacturer in China, Inf. Manag. 45 (4), 2008, p. 233.
[6] C.V. Brown, Examining the emergence of hybrid IS governance solutions: evidencefrom a single case site, Inf. Syst. Res. 8 (March (1)), 1997, pp. 69–94.
[7] C.V. Brown, S.L. Magill, Alignment of the IS function with the enterprise: toward amodel of antecedents, MIS Q. 18 (December (4)), 1994, pp. 371–403.
[8] J.C. Butler, J.S. Dyer, J. Jia, K. Tomak, Enabling E-transactions with multi-attributepreference models, Eur. J. Oper. Res. 186 (2), 2008, p. 748.
[9] L. Carrol, The Annotated Alice: Alice’s Adventures In Wonderland And ThroughThe Looking-Glass, New American Library, New York, 1960.
[10] R. Casadesus-Masanell, D.B. Yoffie, Wintel: cooperation and conflict, Manag. Sci.53 (4), 2007, pp. 584–598.
[11] M. Chau, B. Shiu, I. Chan, H. Chen, Redips: backlink search and analysis on the webfor business intelligence analysis, J. Am. Soc. Inf. Sci. Technol. 58 (3), 2007, p. 351.
[12] R. Chellappa, N. Saraf, Alliances, rivalry, and firm performance in enterprisesystems software markets: a social network approach, Inf. Syst. Res. 21 (4),2010, pp. 849–871.
[13] M.J. Chen, K.G. Smith, C.M. Grimm, Action characteristics as predictors of com-petitive responses, Manag. Sci. 38, 1992, pp. 439–455.
[14] M.J. Chen, Competitor analysis and interfirm rivalry: toward a theoretical inte-gration, Acad. Manag. Rev. 21, 1996, pp. 100–134.
[15] S. Chu, H.T. Keh, Brand value creation: analysis of the interbrand-business weekbrand value rankings, Mark. Lett. 17, 2006, pp. 323–331.
[16] COBIT 5, COBIT 5 A Business Framework for The Governance and Management ofEnterprise IT, ISACA, http://www.isaca.org/COBIT/Pages/default.aspx (accessed24.09.13)
[17] R.G. Coyle, System Dynamics Modeling: A Practical Approach, Chapman & Hall,London, UK, 1996.
[18] K. Coyne, J. Horn, How companies respond to competitors: a Mckinsey globalsurvey, McKinsey Q. April 2008, pp. 1–9.
[19] R.L. Daft, K.E. Weick, Toward a model of organizations as interpretation systems,Acad. Manag. Rev. 9, 1984, pp. 284–295.
[20] S. De Haes, W. Van Grembergen, R.S. Debreceny, COBIT 5 and enterprise gover-nance of information technology: building blocks and research opportunities, J.Inf. Syst. 27 (1), 2013, p. 307.
[21] D. Demirhan, J. Varghese, S. Raghunathan, Information technology investmentstrategies under declining technology cost, J. Manag. Inf. Syst. 22 (3), 2006, pp.321–350.
[22] P.J. Derfus, P.G. Maggitti, C.M. Grimm, K.G. Smith, The red queen effect: competi-tive actions and firm performance, Acad. Manag. J. 51 (1), 2008, pp. 61–80.
[23] W. Desarbo, A. Atalay, D. Lebaron, S. Blanchard, Estimating multiple consumersegment ideal points from context-dependent survey data, J. Consum. Res. 35 (1),2008, p. 142.
[24] D.F. Feeny, B. Ives, In search of sustainability: reaping long-term advantage frominvestments in information technology, J. Manag. Inf. Syst. 7 (1), 1990, pp. 27–46.
[25] D.R. Fortin, R.R. Dholakia, Interactivity and vividness effects on social presenceand involvement with a web-based advertisement, J. Bus. Res. 58 (3), 2005, pp.387–396.
[26] C.M. Gayton, Commercial satellite imagery: CI, KM, and trade secret law, VINE 37(2), 2007, pp. 192–206.
[27] R. Gibbons, Game Theory for Applied Economists, Princeton University Press,Princeton, New Jersey, 1992.
[28] T.J. Gilbride, G.M. Allenby, A choice model with conjunctive, disjunctive andcompensatory screening rules, Mark. Sci. 23 (3), 2004, pp. 391–406.
[29] D. Grether, L. Wilde, An analysis of conjunctive choice: theory and experiments, J.Consum. Res. 10 (4), 1984, pp. 373–385.
[30] K. Han, Y.B. Chang, J. Hahn, Information technology spillover and productivity: therole of information technology intensity and competition, J. Manag. Inf. Syst. 28(1), 2011, pp. 115–146.
[31] C.E. Helfat, M.A. Peteraf, The dynamic resource based view: capability lifecycles,Strateg. Manag. J. 24 (10), 2003, pp. 997–1010.
[32] P. Huang, T. Ouyang, S. Pan, T. Chou, The role of IT in achieving operational agility:a case study of Haier, China, Int. J. Inf. Manag. 32 (3), 2012, p. 294.
[33] ITIL, Information Technology Infrastructure Library, http://www.itil-officialsite.-com/.(accessed 23.09.13).
[34] P. Karuppuswamy, G. Sundararaj, D. Elangovan, Application of computerisedmaintenance management system coupled with risk management techniques
A. Dutta et al. / Information & Management 51 (2014) 762–773 773
for performance improvement of manufacturing systems, Int. J. Bus. Perform.Manag. 9 (1), 2007, pp. 7–21.
[35] M. Kearns, M.L. Littman, S. Singh, Graphical models for game theory, Proc. Of 17thConf. on Uncertainty in Artificial Intelligence, Morgan Kaufmann, San Francisco,2001.
[36] K.N. Lau, K.H. Lee, Y. Ho, Text mining for the hotel industry, Cornell Hotel Restaur.Adm. Q. 46 (3), 2005, p. 344., 19.
[37] M.B. Lieberman, D.B. Montgomery, First-mover advantages, Strateg. Manag. J. 9,1988, pp. 41–58.
[38] W.T. Lina, B.B.M. Shao, The business value of information technology and inputssubstitution: the productivity paradox revisited, Decis. Support Syst. 42 (2), 2006,p. 493.
[39] A. Lomi, E.R. Larsen, A. Ginsberg, Adaptive learning in organizations: a systemdynamics-based exploration, J. Manag. 23 (4), 1997, pp. 561–582.
[40] E. Loukis, I. Sapounas, K. Aivalis, The effect of generalized competition andstrategy on the business value of information and communication technologies,J. Enterprise Inf. Manag. 21 (1), 2008, pp. 24–38.
[41] Y. Lu, K. Ramamurthy, Understanding the link between information technologycapability and organizational agility: an empirical examination, MIS Q. 35 (4),2011, p. 931.
[42] J. Luftman, H. Zadeh, Key information technology and management issues 2010–11: an international study, J. Inf. Technol. 26 (3), 2011, pp. 193–204.
[43] J.T. Mahoney, J.R. Pandain, The resource-based view within the conversation ofstrategic management, Strateg. Manag. J. 13 (5), 1992, pp. 935–952.
[44] R.G. McGrath, Transient advantage, Harv. Bus. Rev. 91 (6), 2013, pp. 62–70.[45] N. Melville, K. Kraemer, V. Gurbaxani, Review: information technology and
organizational performance: an integrative model of IT business value, MIS Q.28 (2), 2004, pp. 283–322.
[46] R. Narasimhan, S. Ghosh, D. Mendez, A dynamic model of product quality andpricing decisions, Decis. Sci. 24 (5), 1993, p. 893.
[47] S. Nazir, A. Pinsonneault, IT and firm agility: an electronic integration perspective,J. Assoc. Inf. Syst. 13 (3), 2012, pp. 150–171.
[48] R. Nelson, S. Winter, An Evolutionary Theory of Economic Change, HarvardUniversity Press, Cambridge, MA, 1982.
[49] T.L. Powers, W. Hahn, Skill and resource based competitive methods: impact onfirm performance, J. Serv. Mark. 16 (2), 2002, pp. 113–124.
[50] J. Quan, Q. Hu, P.J. Hart, Information technology investments and firms’performance – a duopoly perspective, J. Manag. Inf. Syst. 20 (3), 2004, pp.121–158.
[51] G. Richardson, Modeling for Management, Dartmouth Publishing Co, AldershotUK, 1996.
[52] N. Roberts, V. Grover, Leveraging information technology infrastructure to facili-tate a firm’s customer agility and competitive activity: an empirical investigation,J. Manag. Inf. Syst. 28 (Spring (4)), 2012, pp. 231–270.
[53] A.J. Robson, Complex evolutionary systems and the Red Queen, Econ. J. 115, 2005,pp. F211–F224.
[54] R.T. Rust, A.J. Zahorik, T.L. Keiningham, Return on quality: making service qualityfinancially accountable, J. Mark. 59, 1995, pp. 58–70.
[55] V. Sambamurthy, R.W. Zmud, Arrangements for information technologygovernance: a theory of multiple contingencies, MIS Q. 23 (June (2)), 1999, pp.261–290.
[56] L. Santamarıa-Sanchez, M. Nunez-Nickel, S. Gago-Rodrıguez, The role played byinterdependences in ERP implementations: an empirical analysis of criticalfactors that minimize elapsed time, Inf. Manag. 47 (2), 2010, p. 87.
[57] R. Shortland, R. Scarfe, Data mining applications in BT, BT Technol. J. 25 (July (3–4)), 2007, p. 272., (6 pages).
[58] R.J. Slotegraaf, P.R. Dickson, The paradox of a marketing planning capability, J.Acad. Mark. Sci. 32 (4), 2004, pp. 371–385.
[59] R.J. Slotegraaf, C. Moorman, J.J. Inman, The role of firm resources in returns tomarket deployment, J. Mark. Res. 40 (3), 2003, pp. 295–309.
[60] K.G. Smith, C.M. Grimm, M.J. Gannon, Dynamics of Competitive Strategy, SagePublications, London, 1992.
[61] K.G. Smith, W.J. Ferrier, H. Ndofor, Competitive dynamics research: critique andfuture directions, in: M. Hitt, R.E. Freeman, J. Harrison (Eds.), Handbook ofStrategic Management, Blackwell, Oxford, 2001, pp. 315–361.
[62] R.E. Spekman, R.F. Bruner, L. Crowder, The Package War: Fedex vs. UPS, Case(Field) Product#: UV0015, 1996 (February 15).
[63] P. Tallon, Inside the adaptive enterprise: an information technology capabilitiesperspective on business process agility, Inf. Technol. Manag. 9 (1), 2008, pp. 21–36.
[64] P. Tallon, A. Pinsonneault, Competing perspectives on the link between strategicinformation technology alignment and organizational agility: insights from amediation model, MIS Q. 35 (2), 2011, p. 463.
[65] C. Tan, X. Yang, H. Xu, An investigation of the word-processing software marketwar in South Korea: a game-theoretic approach, Inf. Manag. 47 (2), 2010, p. 96.
[66] D.J. Teece, G. Pisano, A. Shuen, Dynamic capabilities and strategic management,Strateg. Manag. J. 18 (7), 1997, pp. 509–533.
[67] M.E. Thatcher, D.E. Pingry, Understanding the business value of informationtechnology investments: theoretical evidence from alternative market and coststructures, J. Manag. Inf. Syst. 21 (2), 2004, pp. 61–85.
[68] F. Ubeda, J.F. Wilkins, The Red Queen theory of recombination hotspots, J. Evol.Biol. 24 (March (3)), 2011, pp. 541–553.
[69] Val-IT, Val IT Framework for Business Technology Management, ISACA, http://www.isaca.org/Knowledge-Center/Val-IT-IT-Value-Delivery-/Pages/Val-IT1.asp-x?utm_source=multiple&utm_medium=multiple&utm_content=friendly&utm_-campaign=valit (accessed 23.09.13).
[70] A.H. Van de Ven, Running in packs to develop knowledge-intensive technologies,MIS Q. 29 (2), 2005, pp. 365–378.
[71] Ventana, Vensim PLE, Ventana Systems Inc., Harvard, Massachusetts, 2012,http://www.vensim.com.
[72] R. Vignesh, R. Suganthan, K. Prakasan, Development of CAD models fromsketches: a case study for automotive applications, Proc. Inst. Mech. Eng. PartD J. Automob. Eng. 221 (D1), 2007, pp. 41–47.
[73] E.T.G. Wang, J.C.F. Tai, H.L. Wei, A virtual integration theory of improved supply-chain performance, J. Manag. Inf. Syst. 23 (2), 2006, pp. 41–64.
[74] H.J. Watson, B.H. Wixom, J.A. Hoffer, R. Anderson-Lehman, A.M. Reynolds, Real-time business intelligence: best practices at Continental Airlines, Inf. Syst. Manag.23 (1), 2006, p. 7.
[75] M. Yasai-Ardekani, P.C. Nystrom, Design for environmental scanning systems:tests of a contingency theory, Manag. Sci. 42 (2), 1996, pp. 187–204.
[76] M. Zain, R.C. Rose, I. Adbullah, M. Masrom, The relationship between informationtechnology acceptance and organizational agility in Malaysia, Inf. Manag. 42 (6),2005, pp. 829–839.