Embed Size (px)
Citation preview
- 1 -
Information Overview Booklet
Fall 2016 – Winter 2017
with Pertinent Longitudinal Information
July 1, 2017
Prepared and Compiled by
Nick Baker, Director of Institutional Research
Mission Statement: Kirtland will provide innovative educational
opportunities to enhance student lives and build stronger
communities.
Vision Statement: Kirtland will be the first choice for learner
centered education guiding students and communities toward success.
- 2 -
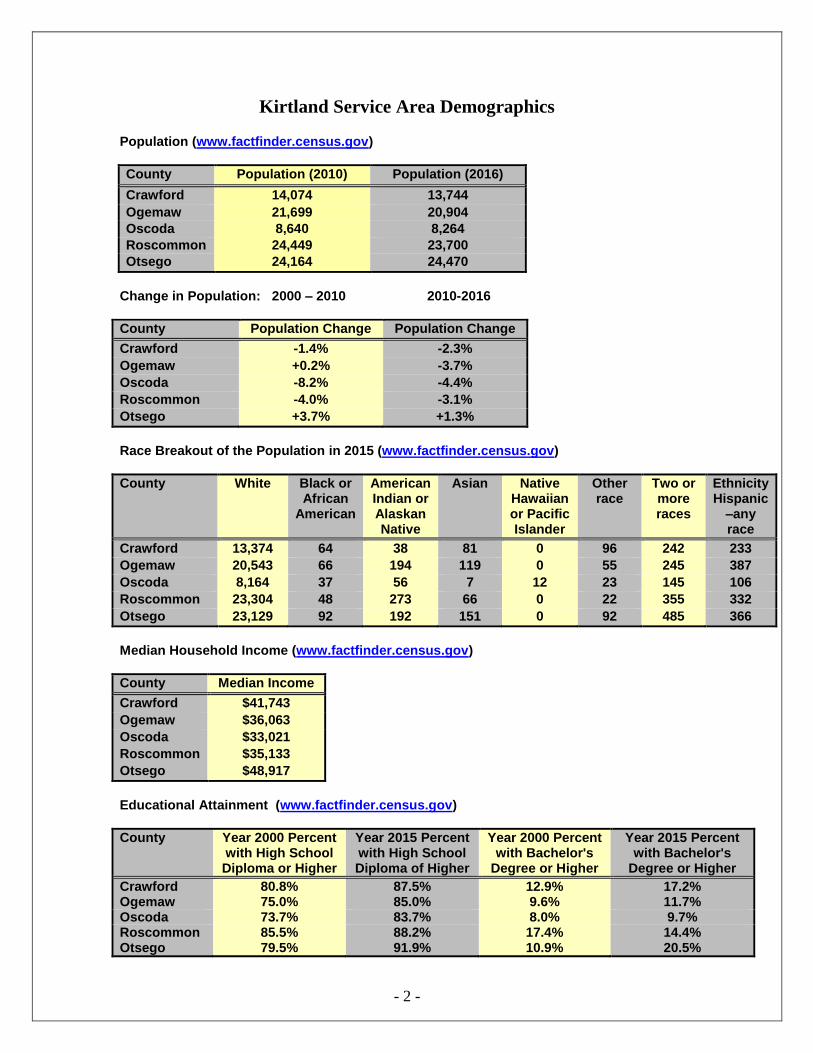
Kirtland Service Area Demographics
Population (www.factfinder.census.gov)
County Population (2010) Population (2016)
Crawford 14,074 13,744
Ogemaw 21,699 20,904
Oscoda 8,640 8,264
Roscommon 24,449 23,700
Otsego 24,164 24,470
Change in Population: 2000 – 2010 2010-2016
County Population Change Population Change
Crawford -1.4% -2.3%
Ogemaw +0.2% -3.7%
Oscoda -8.2% -4.4%
Roscommon -4.0% -3.1%
Otsego +3.7% +1.3%
Race Breakout of the Population in 2015 (www.factfinder.census.gov)
County White Black or African
American
American Indian or Alaskan Native
Asian Native Hawaiian or Pacific Islander
Other race
Two or more races
Ethnicity Hispanic
–any race
Crawford 13,374 64 38 81 0 96 242 233
Ogemaw 20,543 66 194 119 0 55 245 387
Oscoda 8,164 37 56 7 12 23 145 106
Roscommon 23,304 48 273 66 0 22 355 332
Otsego 23,129 92 192 151 0 92 485 366
Median Household Income (www.factfinder.census.gov)
County Median Income
Crawford $41,743
Ogemaw $36,063
Oscoda $33,021
Roscommon $35,133
Otsego $48,917
Educational Attainment (www.factfinder.census.gov)
County Year 2000 Percent with High School Diploma or Higher
Year 2015 Percent with High School Diploma of Higher
Year 2000 Percent with Bachelor's
Degree or Higher
Year 2015 Percent with Bachelor's
Degree or Higher
Crawford 80.8% 87.5% 12.9% 17.2% Ogemaw 75.0% 85.0% 9.6% 11.7% Oscoda 73.7% 83.7% 8.0% 9.7% Roscommon 85.5% 88.2% 17.4% 14.4% Otsego 79.5% 91.9% 10.9% 20.5%
- 3 -
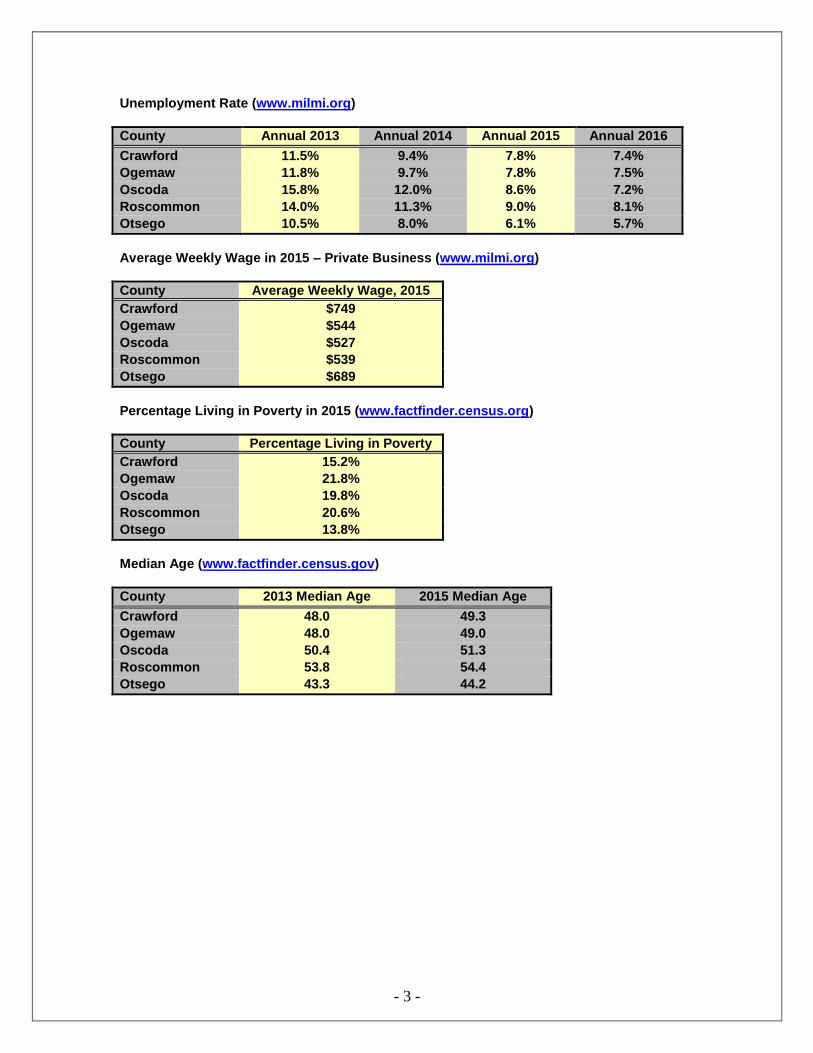
Unemployment Rate (www.milmi.org)
County Annual 2013 Annual 2014 Annual 2015 Annual 2016
Crawford 11.5% 9.4% 7.8% 7.4%
Ogemaw 11.8% 9.7% 7.8% 7.5%
Oscoda 15.8% 12.0% 8.6% 7.2%
Roscommon 14.0% 11.3% 9.0% 8.1%
Otsego 10.5% 8.0% 6.1% 5.7%
Average Weekly Wage in 2015 – Private Business (www.milmi.org)
County Average Weekly Wage, 2015
Crawford $749
Ogemaw $544
Oscoda $527
Roscommon $539
Otsego $689
Percentage Living in Poverty in 2015 (www.factfinder.census.org)
County Percentage Living in Poverty
Crawford 15.2%
Ogemaw 21.8%
Oscoda 19.8%
Roscommon 20.6%
Otsego 13.8%
Median Age (www.factfinder.census.gov)
County 2013 Median Age 2015 Median Age
Crawford 48.0 49.3
Ogemaw 48.0 49.0
Oscoda 50.4 51.3
Roscommon 53.8 54.4
Otsego 43.3 44.2
- 4 -
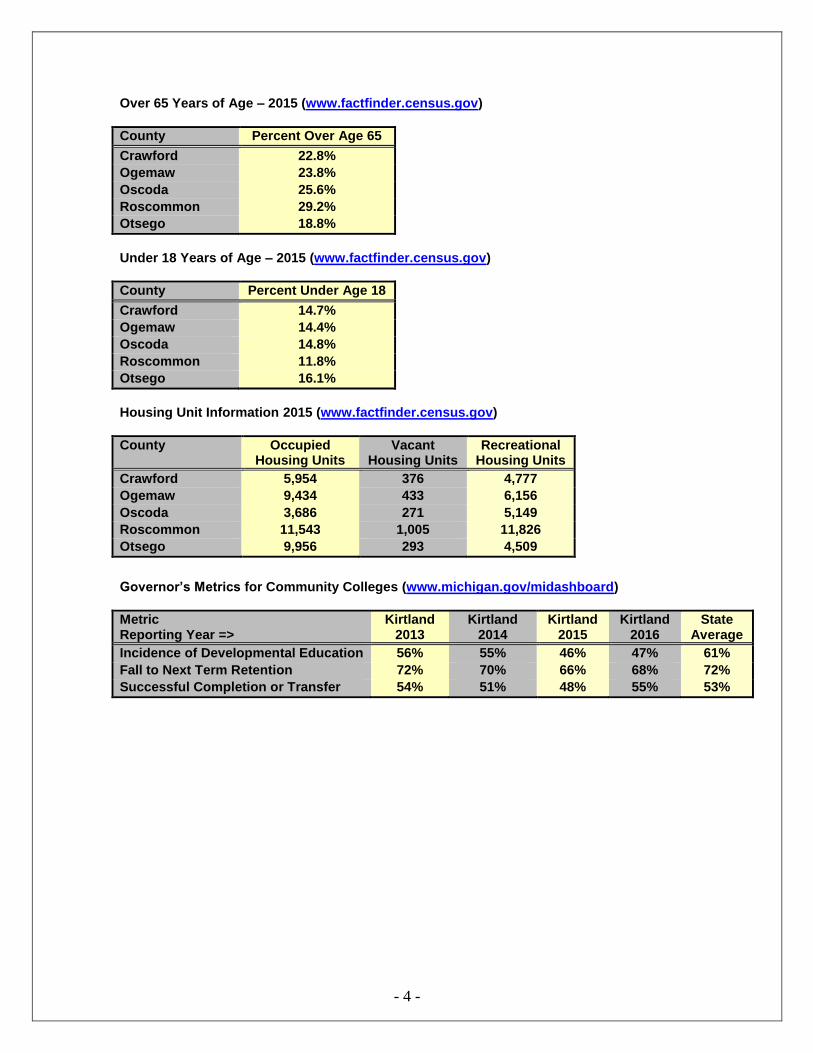
Over 65 Years of Age – 2015 (www.factfinder.census.gov)
County Percent Over Age 65
Crawford 22.8%
Ogemaw 23.8%
Oscoda 25.6%
Roscommon 29.2%
Otsego 18.8%
Under 18 Years of Age – 2015 (www.factfinder.census.gov)
County Percent Under Age 18
Crawford 14.7%
Ogemaw 14.4%
Oscoda 14.8%
Roscommon 11.8%
Otsego 16.1%
Housing Unit Information 2015 (www.factfinder.census.gov)
County Occupied Housing Units
Vacant Housing Units
Recreational Housing Units
Crawford 5,954 376 4,777
Ogemaw 9,434 433 6,156
Oscoda 3,686 271 5,149
Roscommon 11,543 1,005 11,826
Otsego 9,956 293 4,509
Governor’s Metrics for Community Colleges (www.michigan.gov/midashboard)
Metric Reporting Year =>
Kirtland 2013
Kirtland 2014
Kirtland 2015
Kirtland 2016
State Average
Incidence of Developmental Education 56% 55% 46% 47% 61%
Fall to Next Term Retention 72% 70% 66% 68% 72%
Successful Completion or Transfer 54% 51% 48% 55% 53%
- 5 -
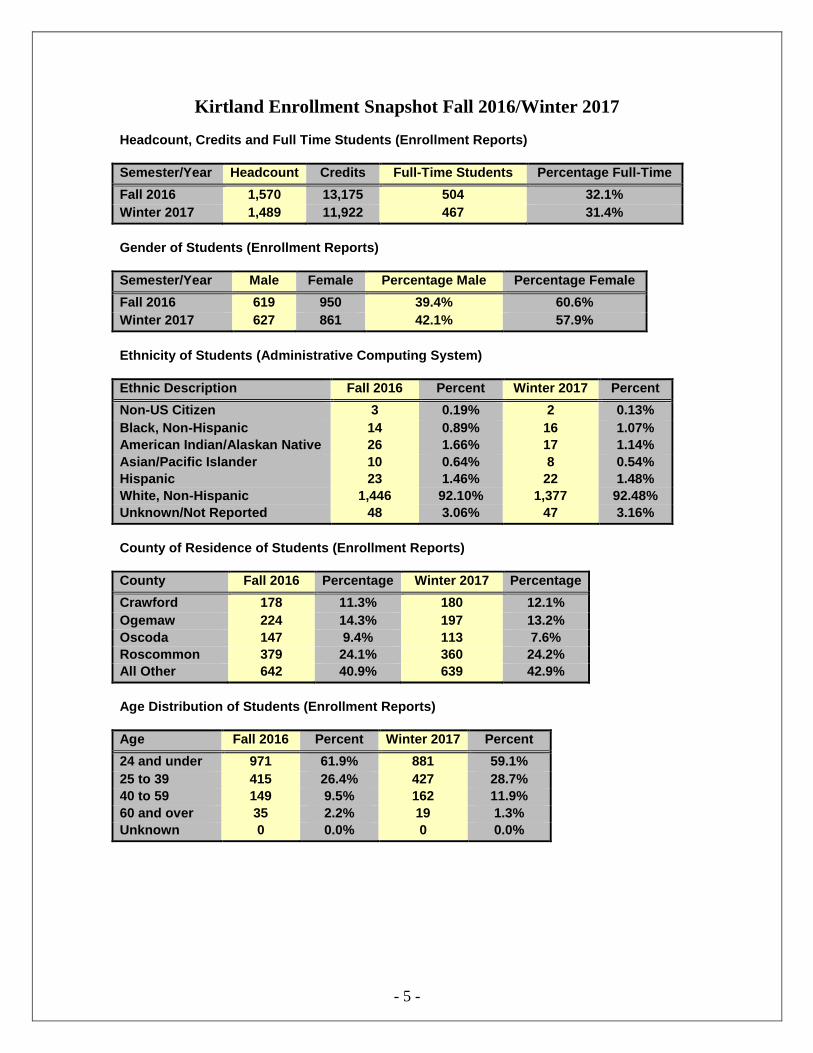
Kirtland Enrollment Snapshot Fall 2016/Winter 2017
Headcount, Credits and Full Time Students (Enrollment Reports)
Semester/Year Headcount Credits Full-Time Students Percentage Full-Time
Fall 2016 1,570 13,175 504 32.1%
Winter 2017 1,489 11,922 467 31.4%
Gender of Students (Enrollment Reports)
Semester/Year Male Female Percentage Male Percentage Female
Fall 2016 619 950 39.4% 60.6%
Winter 2017 627 861 42.1% 57.9%
Ethnicity of Students (Administrative Computing System)
Ethnic Description Fall 2016 Percent Winter 2017 Percent
Non-US Citizen 3 0.19% 2 0.13%
Black, Non-Hispanic 14 0.89% 16 1.07%
American Indian/Alaskan Native 26 1.66% 17 1.14%
Asian/Pacific Islander 10 0.64% 8 0.54%
Hispanic 23 1.46% 22 1.48%
White, Non-Hispanic 1,446 92.10% 1,377 92.48%
Unknown/Not Reported 48 3.06% 47 3.16%
County of Residence of Students (Enrollment Reports)
County Fall 2016 Percentage Winter 2017 Percentage
Crawford 178 11.3% 180 12.1%
Ogemaw 224 14.3% 197 13.2%
Oscoda 147 9.4% 113 7.6%
Roscommon 379 24.1% 360 24.2%
All Other 642 40.9% 639 42.9%
Age Distribution of Students (Enrollment Reports)
Age Fall 2016 Percent Winter 2017 Percent
24 and under 971 61.9% 881 59.1%
25 to 39 415 26.4% 427 28.7%
40 to 59 149 9.5% 162 11.9%
60 and over 35 2.2% 19 1.3%
Unknown 0 0.0% 0 0.0%
- 6 -
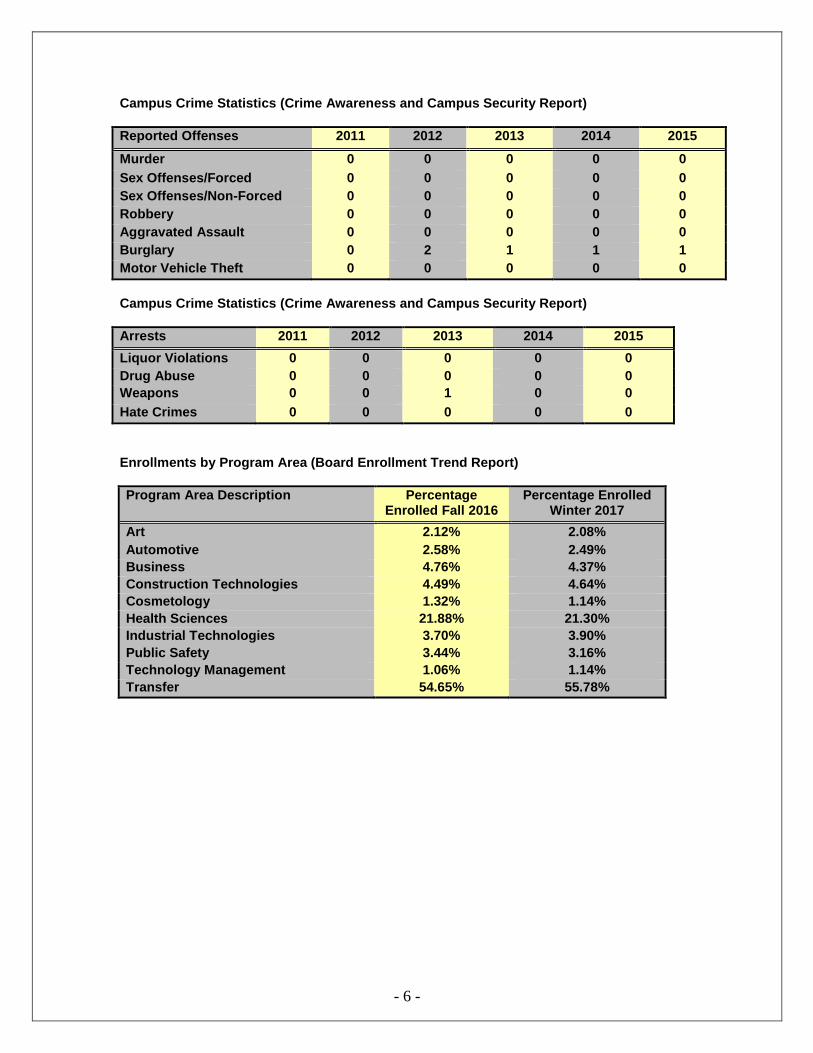
Campus Crime Statistics (Crime Awareness and Campus Security Report)
Reported Offenses 2011 2012 2013 2014 2015
Murder 0 0 0 0 0
Sex Offenses/Forced 0 0 0 0 0
Sex Offenses/Non-Forced 0 0 0 0 0
Robbery 0 0 0 0 0
Aggravated Assault 0 0 0 0 0
Burglary 0 2 1 1 1
Motor Vehicle Theft 0 0 0 0 0
Campus Crime Statistics (Crime Awareness and Campus Security Report)
Arrests 2011 2012 2013 2014 2015
Liquor Violations 0 0 0 0 0
Drug Abuse 0 0 0 0 0
Weapons 0 0 1 0 0
Hate Crimes 0 0 0 0 0
Enrollments by Program Area (Board Enrollment Trend Report)
Program Area Description Percentage Enrolled Fall 2016
Percentage Enrolled Winter 2017
Art 2.12% 2.08%
Automotive 2.58% 2.49%
Business 4.76% 4.37%
Construction Technologies 4.49% 4.64%
Cosmetology 1.32% 1.14%
Health Sciences 21.88% 21.30%
Industrial Technologies 3.70% 3.90%
Public Safety 3.44% 3.16%
Technology Management 1.06% 1.14%
Transfer 54.65% 55.78%
- 7 -
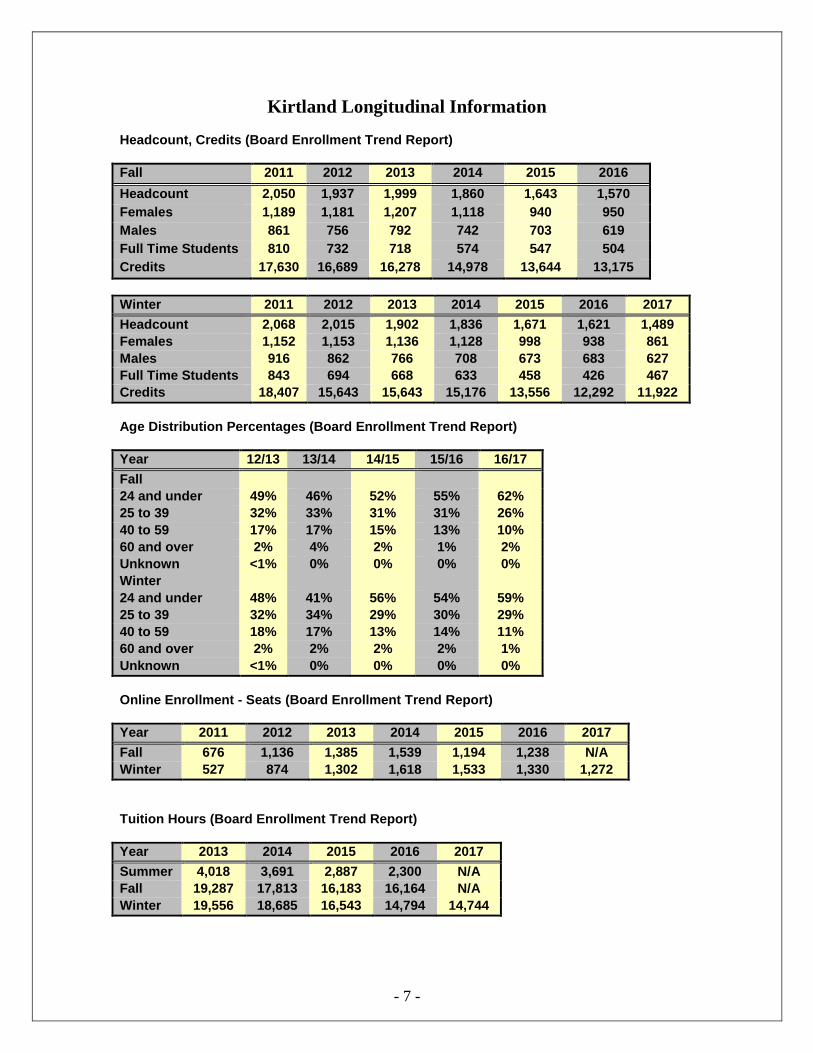
Kirtland Longitudinal Information Headcount, Credits (Board Enrollment Trend Report)
Fall 2011 2012 2013 2014 2015 2016
Headcount 2,050 1,937 1,999 1,860 1,643 1,570
Females 1,189 1,181 1,207 1,118 940 950
Males 861 756 792 742 703 619
Full Time Students 810 732 718 574 547 504
Credits 17,630 16,689 16,278 14,978 13,644 13,175
Winter 2011 2012 2013 2014 2015 2016 2017
Headcount 2,068 2,015 1,902 1,836 1,671 1,621 1,489
Females 1,152 1,153 1,136 1,128 998 938 861
Males 916 862 766 708 673 683 627
Full Time Students 843 694 668 633 458 426 467
Credits 18,407 15,643 15,643 15,176 13,556 12,292 11,922
Age Distribution Percentages (Board Enrollment Trend Report)
Year 12/13 13/14 14/15 15/16 16/17
Fall
24 and under 49% 46% 52% 55% 62%
25 to 39 32% 33% 31% 31% 26%
40 to 59 17% 17% 15% 13% 10%
60 and over 2% 4% 2% 1% 2%
Unknown <1% 0% 0% 0% 0%
Winter
24 and under 48% 41% 56% 54% 59%
25 to 39 32% 34% 29% 30% 29%
40 to 59 18% 17% 13% 14% 11%
60 and over 2% 2% 2% 2% 1%
Unknown <1% 0% 0% 0% 0%
Online Enrollment - Seats (Board Enrollment Trend Report)
Year 2011 2012 2013 2014 2015 2016 2017
Fall 676 1,136 1,385 1,539 1,194 1,238 N/A
Winter 527 874 1,302 1,618 1,533 1,330 1,272
Tuition Hours (Board Enrollment Trend Report)
Year 2013 2014 2015 2016 2017
Summer 4,018 3,691 2,887 2,300 N/A
Fall 19,287 17,813 16,183 16,164 N/A
Winter 19,556 18,685 16,543 14,794 14,744
- 8 -
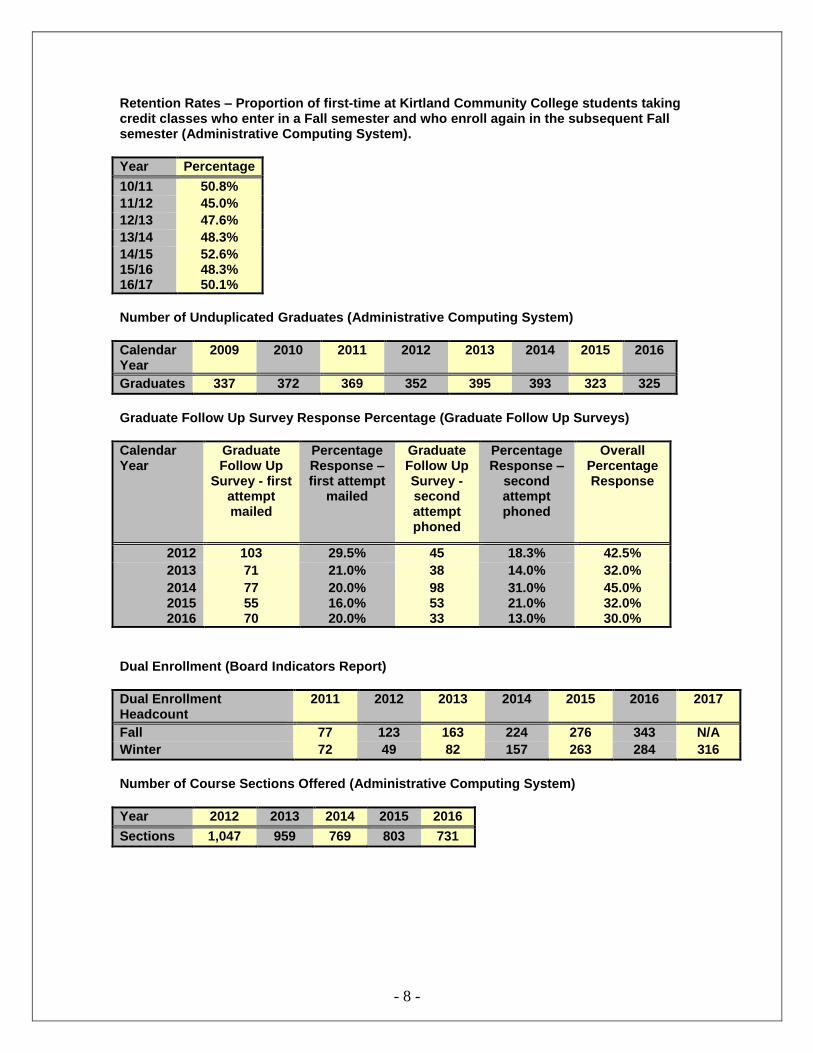
Retention Rates – Proportion of first-time at Kirtland Community College students taking credit classes who enter in a Fall semester and who enroll again in the subsequent Fall semester (Administrative Computing System).
Year Percentage
10/11 50.8%
11/12 45.0%
12/13 47.6%
13/14 48.3%
14/15 15/16 16/17
52.6% 48.3% 50.1%
Number of Unduplicated Graduates (Administrative Computing System)
Calendar Year
2009 2010 2011 2012 2013 2014 2015 2016
Graduates 337 372 369 352 395 393 323 325
Graduate Follow Up Survey Response Percentage (Graduate Follow Up Surveys)
Calendar Year
Graduate Follow Up
Survey - first attempt mailed
Percentage Response – first attempt
mailed
Graduate Follow Up Survey - second attempt phoned
Percentage Response –
second attempt phoned
Overall Percentage Response
2012 103 29.5% 45 18.3% 42.5%
2013 71 21.0% 38 14.0% 32.0%
2014 2015 2016
77 55 70
20.0% 16.0% 20.0%
98 53 33
31.0% 21.0% 13.0%
45.0% 32.0% 30.0%
Dual Enrollment (Board Indicators Report)
Dual Enrollment Headcount
2011 2012 2013 2014 2015 2016 2017
Fall 77 123 163 224 276 343 N/A
Winter 72 49 82 157 263 284 316
Number of Course Sections Offered (Administrative Computing System)
Year 2012 2013 2014 2015 2016
Sections 1,047 959 769 803 731
- 9 -
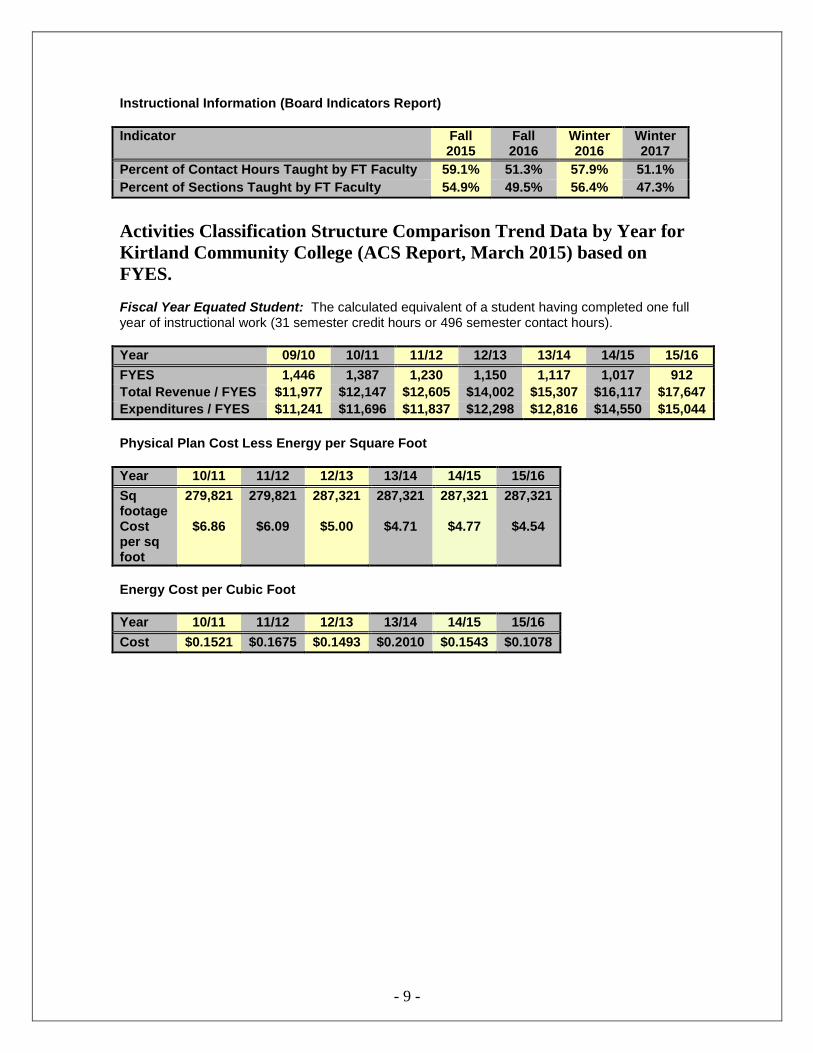
Instructional Information (Board Indicators Report)
Indicator Fall 2015
Fall 2016
Winter 2016
Winter 2017
Percent of Contact Hours Taught by FT Faculty 59.1% 51.3% 57.9% 51.1%
Percent of Sections Taught by FT Faculty 54.9% 49.5% 56.4% 47.3%
Activities Classification Structure Comparison Trend Data by Year for
Kirtland Community College (ACS Report, March 2015) based on
FYES. Fiscal Year Equated Student: The calculated equivalent of a student having completed one full year of instructional work (31 semester credit hours or 496 semester contact hours).
Year 09/10 10/11 11/12 12/13 13/14 14/15 15/16
FYES 1,446 1,387 1,230 1,150 1,117 1,017 912
Total Revenue / FYES $11,977 $12,147 $12,605 $14,002 $15,307 $16,117 $17,647
Expenditures / FYES $11,241 $11,696 $11,837 $12,298 $12,816 $14,550 $15,044
Physical Plan Cost Less Energy per Square Foot
Year 10/11 11/12 12/13 13/14 14/15 15/16
Sq footage Cost per sq foot
279,821
$6.86
279,821
$6.09
287,321
$5.00
287,321
$4.71
287,321
$4.77
287,321
$4.54
Energy Cost per Cubic Foot
Year 10/11 11/12 12/13 13/14 14/15 15/16
Cost $0.1521 $0.1675 $0.1493 $0.2010 $0.1543 $0.1078
- 10 -
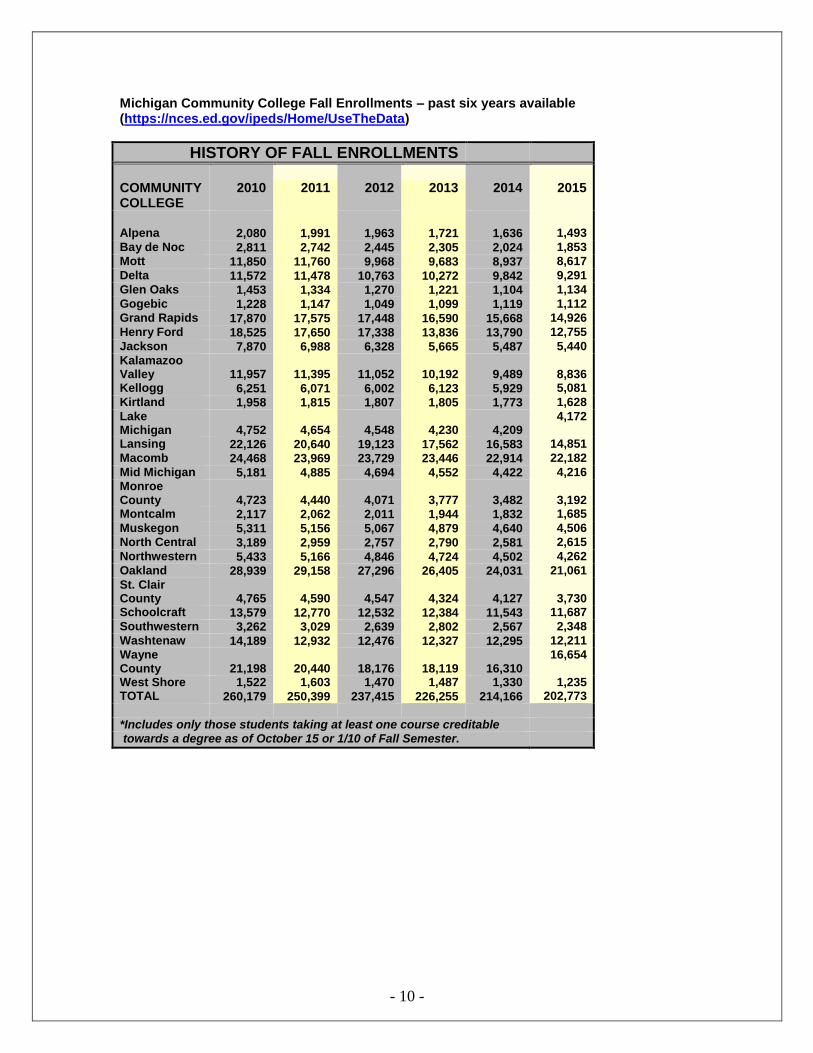
Michigan Community College Fall Enrollments – past six years available (https://nces.ed.gov/ipeds/Home/UseTheData)
HISTORY OF FALL ENROLLMENTS
COMMUNITY COLLEGE
2010 2011 2012 2013 2014 2015
Alpena 2,080 1,991 1,963 1,721 1,636 1,493
Bay de Noc 2,811 2,742 2,445 2,305 2,024 1,853
Mott 11,850 11,760 9,968 9,683 8,937 8,617
Delta 11,572 11,478 10,763 10,272 9,842 9,291
Glen Oaks 1,453 1,334 1,270 1,221 1,104 1,134
Gogebic 1,228 1,147 1,049 1,099 1,119 1,112
Grand Rapids 17,870 17,575 17,448 16,590 15,668 14,926
Henry Ford 18,525 17,650 17,338 13,836 13,790 12,755
Jackson 7,870 6,988 6,328 5,665 5,487 5,440
Kalamazoo Valley 11,957 11,395 11,052 10,192 9,489
8,836
Kellogg 6,251 6,071 6,002 6,123 5,929 5,081
Kirtland 1,958 1,815 1,807 1,805 1,773 1,628
Lake Michigan 4,752 4,654 4,548 4,230 4,209
4,172
Lansing 22,126 20,640 19,123 17,562 16,583 14,851
Macomb 24,468 23,969 23,729 23,446 22,914 22,182
Mid Michigan 5,181 4,885 4,694 4,552 4,422 4,216
Monroe County 4,723 4,440 4,071 3,777 3,482
3,192
Montcalm 2,117 2,062 2,011 1,944 1,832 1,685
Muskegon 5,311 5,156 5,067 4,879 4,640 4,506
North Central 3,189 2,959 2,757 2,790 2,581 2,615
Northwestern 5,433 5,166 4,846 4,724 4,502 4,262
Oakland 28,939 29,158 27,296 26,405 24,031 21,061
St. Clair County 4,765 4,590 4,547 4,324 4,127
3,730
Schoolcraft 13,579 12,770 12,532 12,384 11,543 11,687
Southwestern 3,262 3,029 2,639 2,802 2,567 2,348
Washtenaw 14,189 12,932 12,476 12,327 12,295 12,211
Wayne County 21,198 20,440 18,176 18,119 16,310
16,654
West Shore 1,522 1,603 1,470 1,487 1,330 1,235 TOTAL 260,179 250,399 237,415 226,255 214,166 202,773
*Includes only those students taking at least one course creditable
towards a degree as of October 15 or 1/10 of Fall Semester.
- 11 -
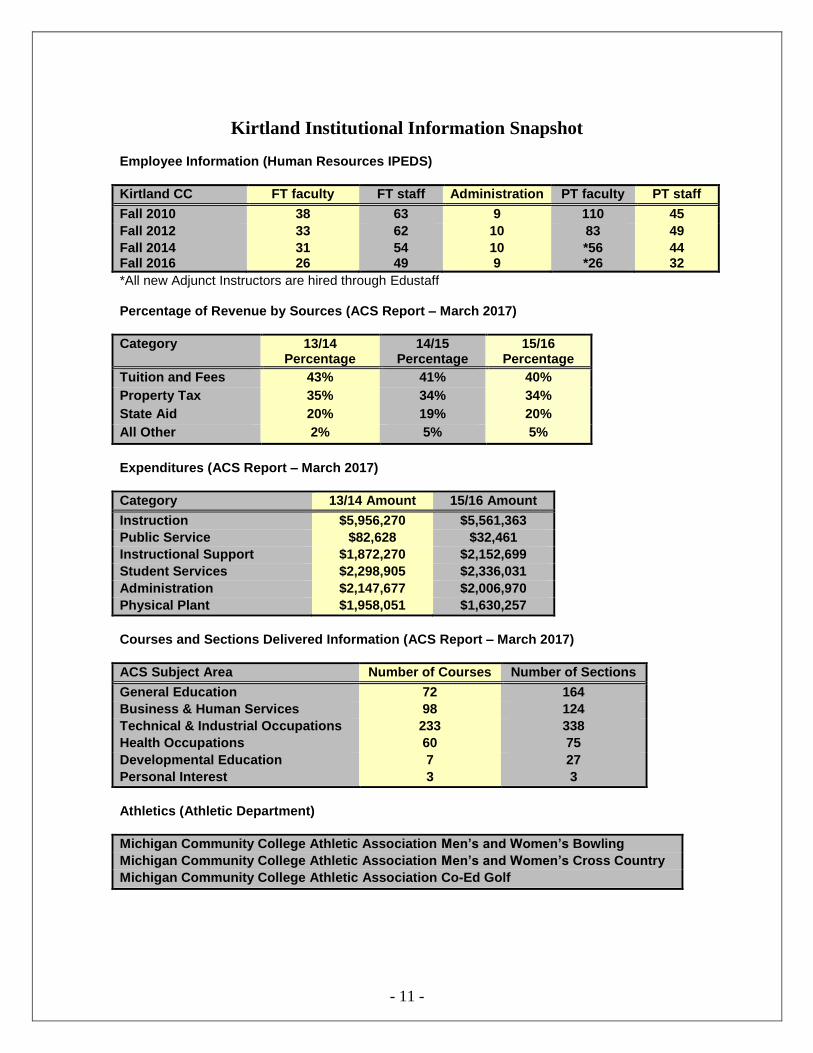
Kirtland Institutional Information Snapshot
Employee Information (Human Resources IPEDS)
Kirtland CC FT faculty FT staff Administration PT faculty PT staff
Fall 2010 38 63 9 110 45
Fall 2012 33 62 10 83 49
Fall 2014 Fall 2016
31 26
54 49
10 9
*56 *26
44 32
*All new Adjunct Instructors are hired through Edustaff Percentage of Revenue by Sources (ACS Report – March 2017)
Category 13/14 Percentage
14/15 Percentage
15/16 Percentage
Tuition and Fees 43% 41% 40%
Property Tax 35% 34% 34%
State Aid 20% 19% 20%
All Other 2% 5% 5%
Expenditures (ACS Report – March 2017)
Category 13/14 Amount 15/16 Amount
Instruction $5,956,270 $5,561,363
Public Service $82,628 $32,461
Instructional Support $1,872,270 $2,152,699
Student Services $2,298,905 $2,336,031
Administration $2,147,677 $2,006,970
Physical Plant $1,958,051 $1,630,257
Courses and Sections Delivered Information (ACS Report – March 2017)
ACS Subject Area Number of Courses Number of Sections
General Education 72 164
Business & Human Services 98 124
Technical & Industrial Occupations 233 338
Health Occupations 60 75
Developmental Education 7 27
Personal Interest 3 3
Athletics (Athletic Department)
Michigan Community College Athletic Association Men’s and Women’s Bowling
Michigan Community College Athletic Association Men’s and Women’s Cross Country
Michigan Community College Athletic Association Co-Ed Golf
- 12 -
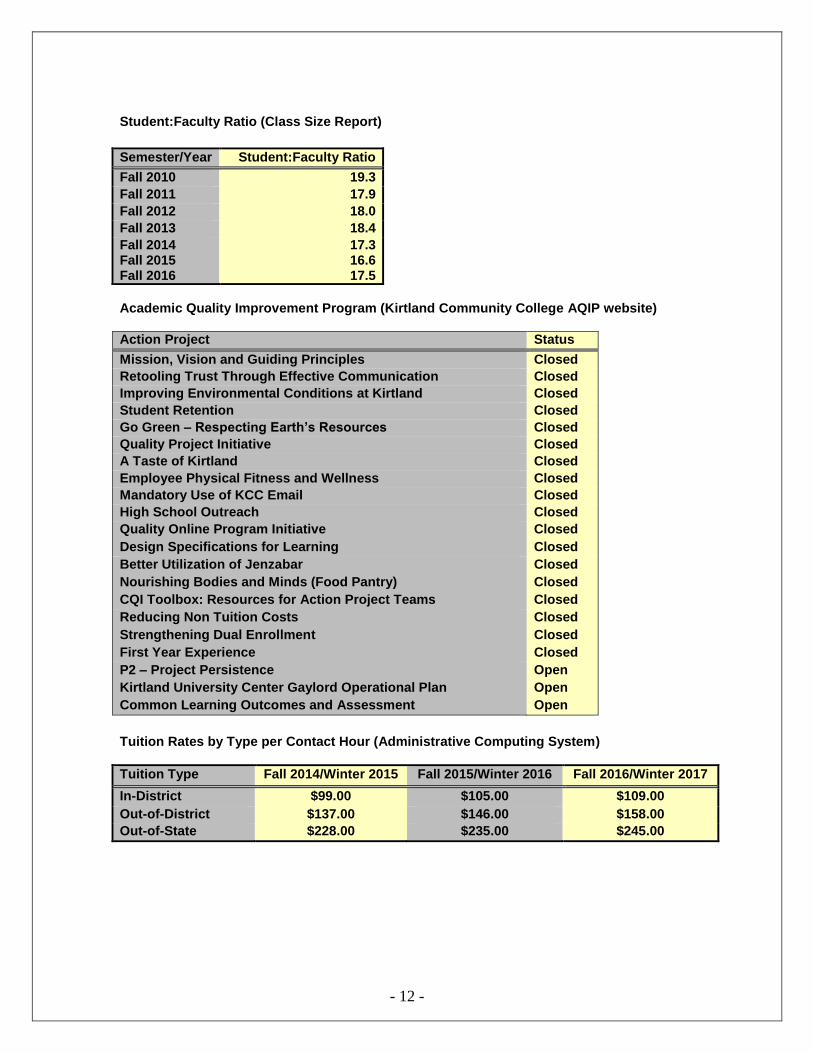
Student:Faculty Ratio (Class Size Report)
Semester/Year Student:Faculty Ratio
Fall 2010 19.3
Fall 2011 17.9
Fall 2012 18.0
Fall 2013 18.4
Fall 2014 Fall 2015 Fall 2016
17.3 16.6 17.5
Academic Quality Improvement Program (Kirtland Community College AQIP website)
Action Project Status
Mission, Vision and Guiding Principles Closed
Retooling Trust Through Effective Communication Closed
Improving Environmental Conditions at Kirtland Closed
Student Retention Closed
Go Green – Respecting Earth’s Resources Closed
Quality Project Initiative Closed
A Taste of Kirtland Closed
Employee Physical Fitness and Wellness Closed
Mandatory Use of KCC Email Closed
High School Outreach Closed
Quality Online Program Initiative
Design Specifications for Learning
Closed
Closed
Better Utilization of Jenzabar
Nourishing Bodies and Minds (Food Pantry)
CQI Toolbox: Resources for Action Project Teams
Closed
Closed
Closed
Reducing Non Tuition Costs
Strengthening Dual Enrollment
First Year Experience
Closed
Closed
Closed
P2 – Project Persistence
Kirtland University Center Gaylord Operational Plan
Open
Open
Common Learning Outcomes and Assessment Open
Tuition Rates by Type per Contact Hour (Administrative Computing System)
Tuition Type Fall 2014/Winter 2015 Fall 2015/Winter 2016 Fall 2016/Winter 2017
In-District $99.00 $105.00 $109.00
Out-of-District $137.00 $146.00 $158.00
Out-of-State $228.00 $235.00 $245.00
- 13 -
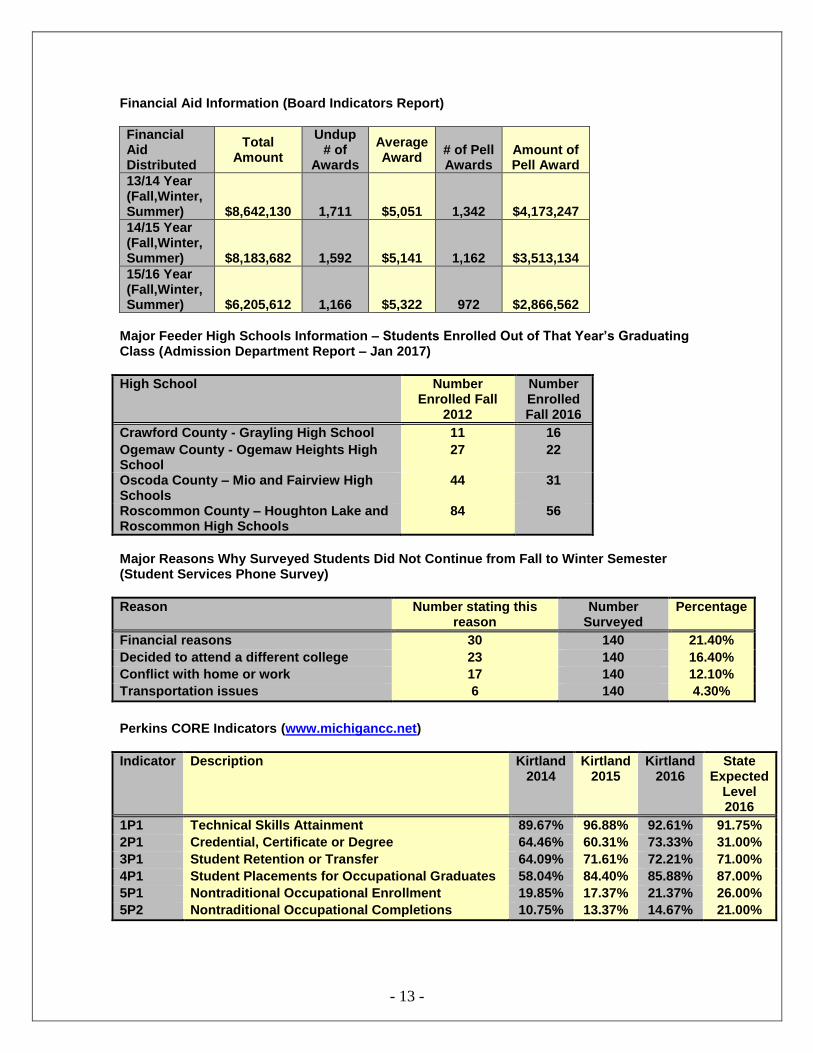
Financial Aid Information (Board Indicators Report)
Financial Aid Distributed
Total Amount
Undup # of
Awards
Average Award
# of Pell Awards
Amount of Pell Award
13/14 Year (Fall,Winter, Summer) $8,642,130 1,711 $5,051 1,342 $4,173,247
14/15 Year (Fall,Winter, Summer) $8,183,682 1,592 $5,141 1,162 $3,513,134
15/16 Year (Fall,Winter, Summer) $6,205,612 1,166 $5,322 972 $2,866,562
Major Feeder High Schools Information – Students Enrolled Out of That Year’s Graduating Class (Admission Department Report – Jan 2017)
High School Number Enrolled Fall
2012
Number Enrolled Fall 2016
Crawford County - Grayling High School 11 16
Ogemaw County - Ogemaw Heights High School
27 22
Oscoda County – Mio and Fairview High Schools
44 31
Roscommon County – Houghton Lake and Roscommon High Schools
84 56
Major Reasons Why Surveyed Students Did Not Continue from Fall to Winter Semester (Student Services Phone Survey)
Reason Number stating this reason
Number Surveyed
Percentage
Financial reasons 30 140 21.40%
Decided to attend a different college 23 140 16.40%
Conflict with home or work 17 140 12.10%
Transportation issues 6 140 4.30%
Perkins CORE Indicators (www.michigancc.net)
Indicator Description Kirtland 2014
Kirtland 2015
Kirtland 2016
State Expected
Level 2016
1P1 Technical Skills Attainment 89.67% 96.88% 92.61% 91.75%
2P1 Credential, Certificate or Degree 64.46% 60.31% 73.33% 31.00%
3P1 Student Retention or Transfer 64.09% 71.61% 72.21% 71.00%
4P1 Student Placements for Occupational Graduates 58.04% 84.40% 85.88% 87.00%
5P1 Nontraditional Occupational Enrollment 19.85% 17.37% 21.37% 26.00%
5P2 Nontraditional Occupational Completions 10.75% 13.37% 14.67% 21.00%
- 14 -
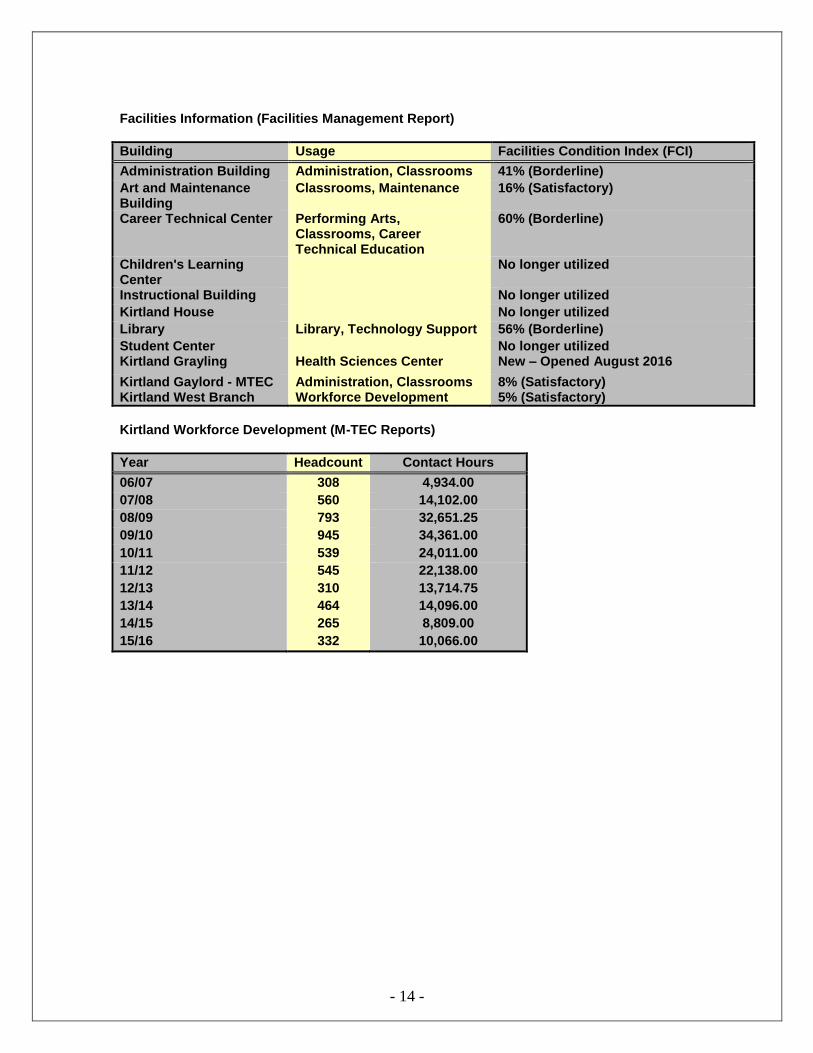
Facilities Information (Facilities Management Report)
Building Usage Facilities Condition Index (FCI)
Administration Building Administration, Classrooms 41% (Borderline)
Art and Maintenance Building
Classrooms, Maintenance 16% (Satisfactory)
Career Technical Center Performing Arts, Classrooms, Career Technical Education
60% (Borderline)
Children's Learning Center
No longer utilized
Instructional Building No longer utilized
Kirtland House No longer utilized
Library Library, Technology Support 56% (Borderline)
Student Center Kirtland Grayling
Health Sciences Center
No longer utilized New – Opened August 2016
Kirtland Gaylord - MTEC Kirtland West Branch
Administration, Classrooms Workforce Development
8% (Satisfactory) 5% (Satisfactory)
Kirtland Workforce Development (M-TEC Reports)
Year Headcount Contact Hours
06/07 308 4,934.00
07/08 560 14,102.00
08/09 793 32,651.25
09/10 945 34,361.00
10/11 539 24,011.00
11/12 545 22,138.00
12/13
13/14
14/15
15/16
310
464
265
332
13,714.75
14,096.00
8,809.00
10,066.00
- 15 -
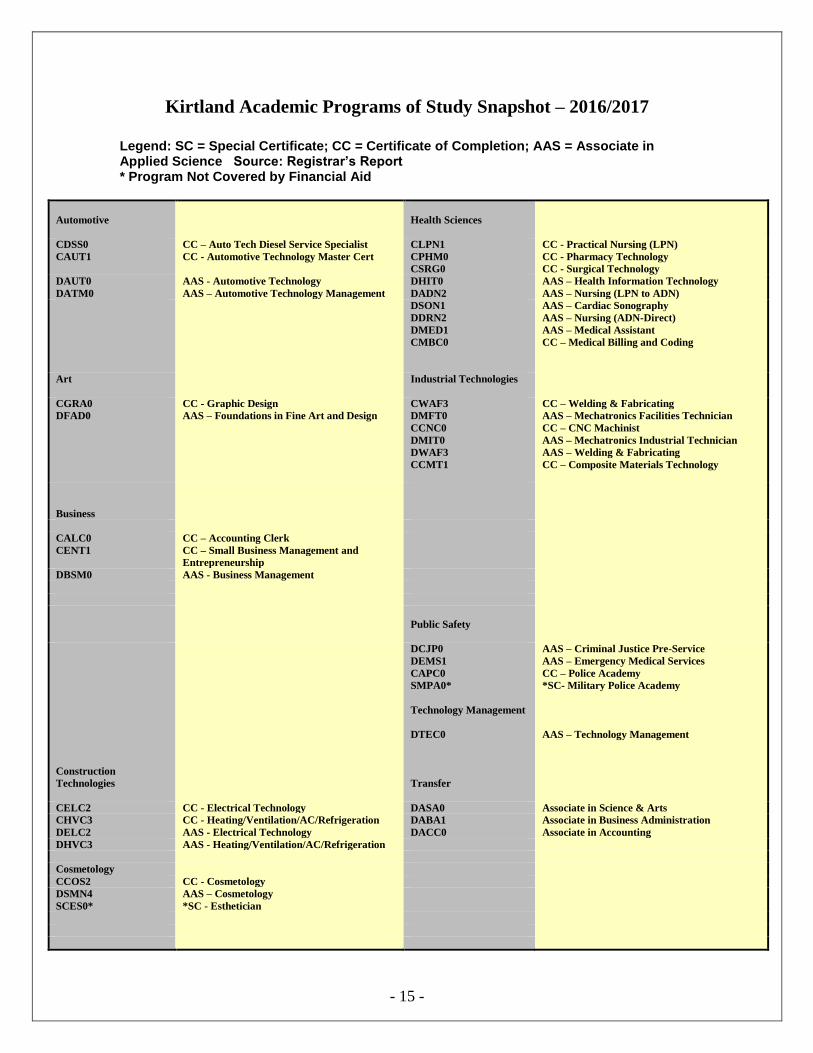
Kirtland Academic Programs of Study Snapshot – 2016/2017
Legend: SC = Special Certificate; CC = Certificate of Completion; AAS = Associate in Applied Science Source: Registrar’s Report * Program Not Covered by Financial Aid
Automotive
Health Sciences
CDSS0
CAUT1
CC – Auto Tech Diesel Service Specialist
CC - Automotive Technology Master Cert
CLPN1
CPHM0
CSRG0
CC - Practical Nursing (LPN)
CC - Pharmacy Technology
CC - Surgical Technology
DAUT0
DATM0
AAS - Automotive Technology
AAS – Automotive Technology Management
DHIT0
DADN2
AAS – Health Information Technology
AAS – Nursing (LPN to ADN)
DSON1
DDRN2
DMED1
CMBC0
AAS – Cardiac Sonography
AAS – Nursing (ADN-Direct)
AAS – Medical Assistant
CC – Medical Billing and Coding
Art Industrial Technologies
CGRA0
DFAD0
CC - Graphic Design
AAS – Foundations in Fine Art and Design
CWAF3
DMFT0
CCNC0
CC – Welding & Fabricating
AAS – Mechatronics Facilities Technician
CC – CNC Machinist
DMIT0
DWAF3
CCMT1
AAS – Mechatronics Industrial Technician
AAS – Welding & Fabricating
CC – Composite Materials Technology
Business
CALC0
CENT1
CC – Accounting Clerk
CC – Small Business Management and
Entrepreneurship
DBSM0 AAS - Business Management
Public Safety
DCJP0
DEMS1
AAS – Criminal Justice Pre-Service
AAS – Emergency Medical Services
Construction
Technologies
CAPC0
SMPA0*
Technology Management
DTEC0
Transfer
CC – Police Academy
*SC- Military Police Academy
AAS – Technology Management
CELC2 CC - Electrical Technology DASA0 Associate in Science & Arts
CHVC3 CC - Heating/Ventilation/AC/Refrigeration DABA1 Associate in Business Administration
DELC2 AAS - Electrical Technology DACC0 Associate in Accounting
DHVC3 AAS - Heating/Ventilation/AC/Refrigeration
Cosmetology
CCOS2 CC - Cosmetology
DSMN4
SCES0*
AAS – Cosmetology
*SC - Esthetician
- 16 -
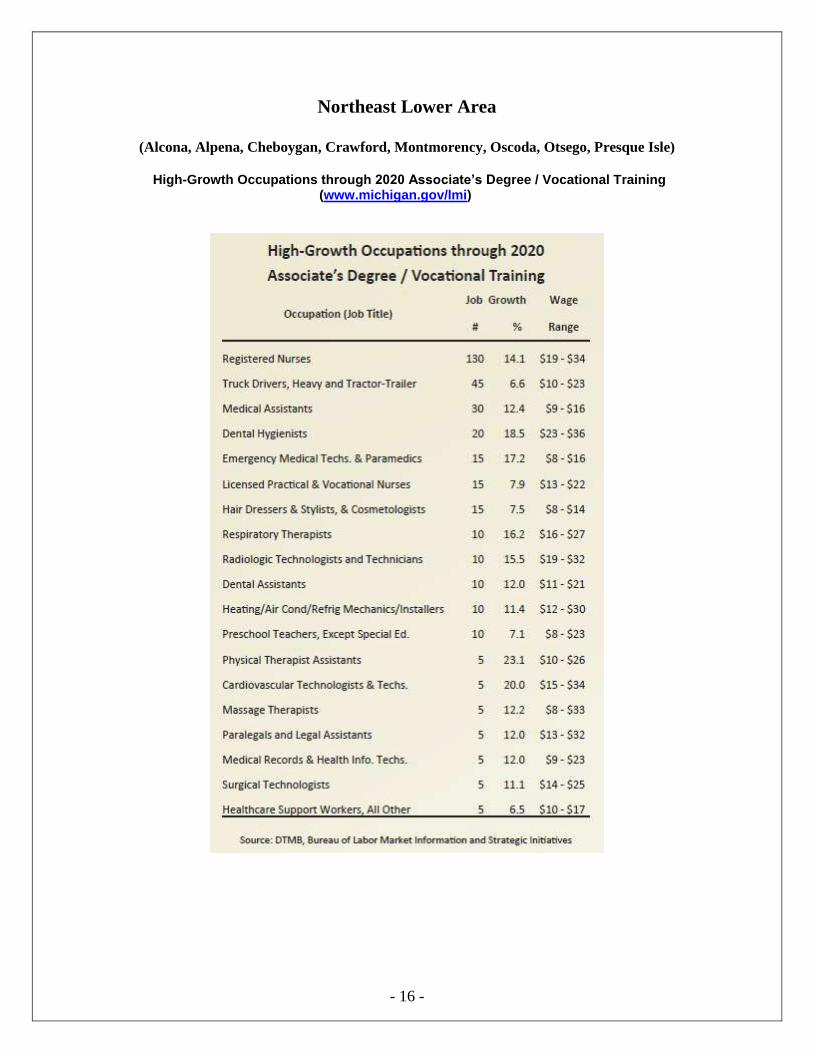
Northeast Lower Area
(Alcona, Alpena, Cheboygan, Crawford, Montmorency, Oscoda, Otsego, Presque Isle)
High-Growth Occupations through 2020 Associate’s Degree / Vocational Training (www.michigan.gov/lmi)
- 17 -
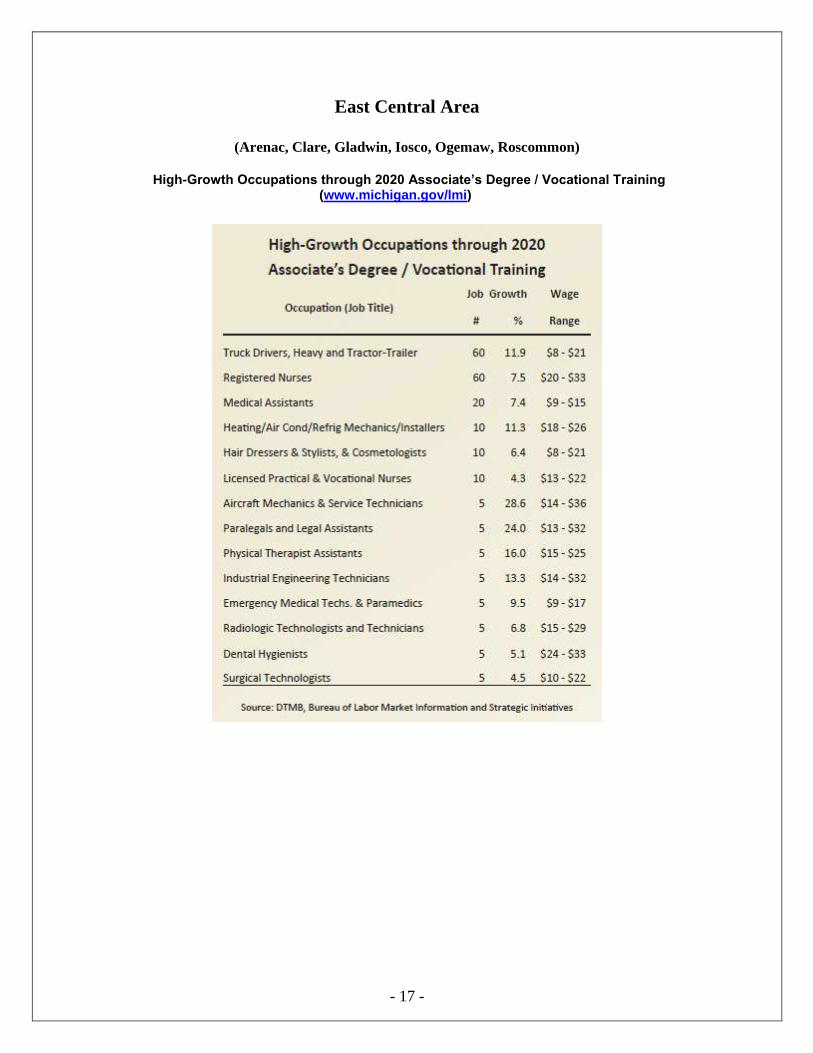
East Central Area
(Arenac, Clare, Gladwin, Iosco, Ogemaw, Roscommon)
High-Growth Occupations through 2020 Associate’s Degree / Vocational Training (www.michigan.gov/lmi)
- 18 -
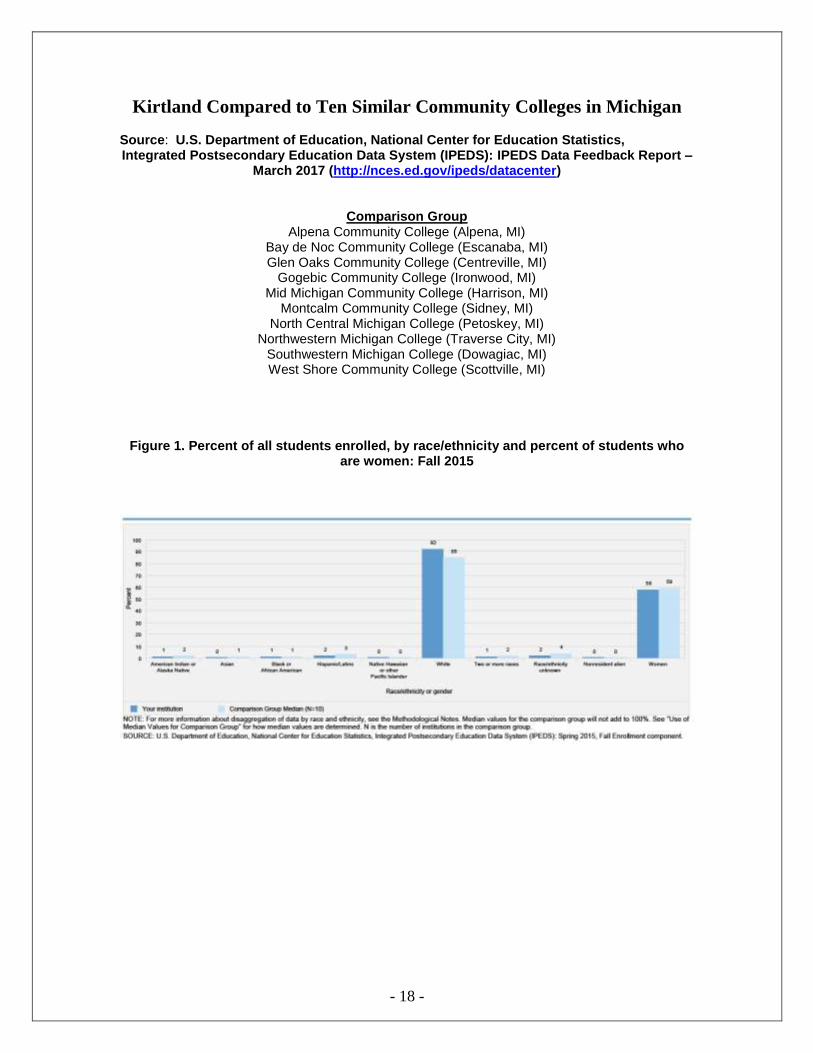
Kirtland Compared to Ten Similar Community Colleges in Michigan Source: U.S. Department of Education, National Center for Education Statistics, Integrated Postsecondary Education Data System (IPEDS): IPEDS Data Feedback Report –
March 2017 (http://nces.ed.gov/ipeds/datacenter)
Comparison Group Alpena Community College (Alpena, MI)
Bay de Noc Community College (Escanaba, MI) Glen Oaks Community College (Centreville, MI)
Gogebic Community College (Ironwood, MI) Mid Michigan Community College (Harrison, MI)
Montcalm Community College (Sidney, MI) North Central Michigan College (Petoskey, MI)
Northwestern Michigan College (Traverse City, MI) Southwestern Michigan College (Dowagiac, MI) West Shore Community College (Scottville, MI)
Figure 1. Percent of all students enrolled, by race/ethnicity and percent of students who are women: Fall 2015

- 19 -
Figure 2. Unduplicated 12-month headcount (2014-15), total FTE enrollment (2014–15), and full- and part-time fall enrollment (Fall 2015)
Figure 3. Number of degrees or certificates awarded, by level: Academic year 2014-15
- 20 -
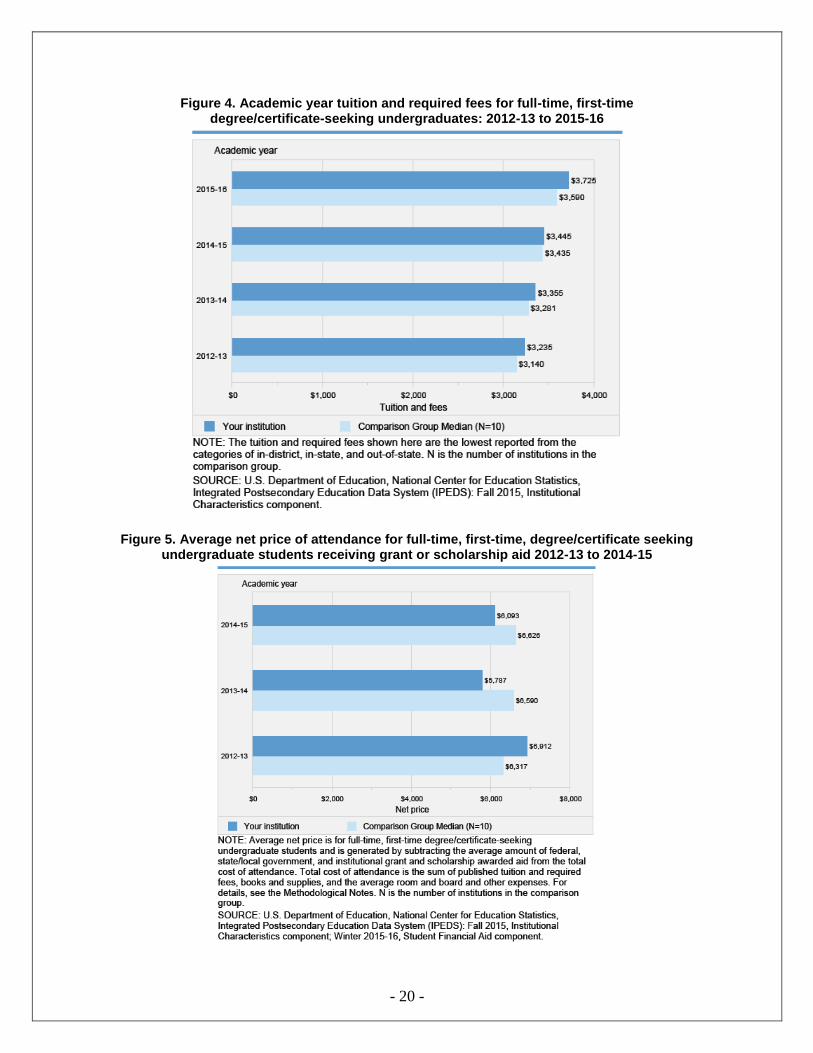
Figure 4. Academic year tuition and required fees for full-time, first-time degree/certificate-seeking undergraduates: 2012-13 to 2015-16
Figure 5. Average net price of attendance for full-time, first-time, degree/certificate seeking
undergraduate students receiving grant or scholarship aid 2012-13 to 2014-15
- 21 -
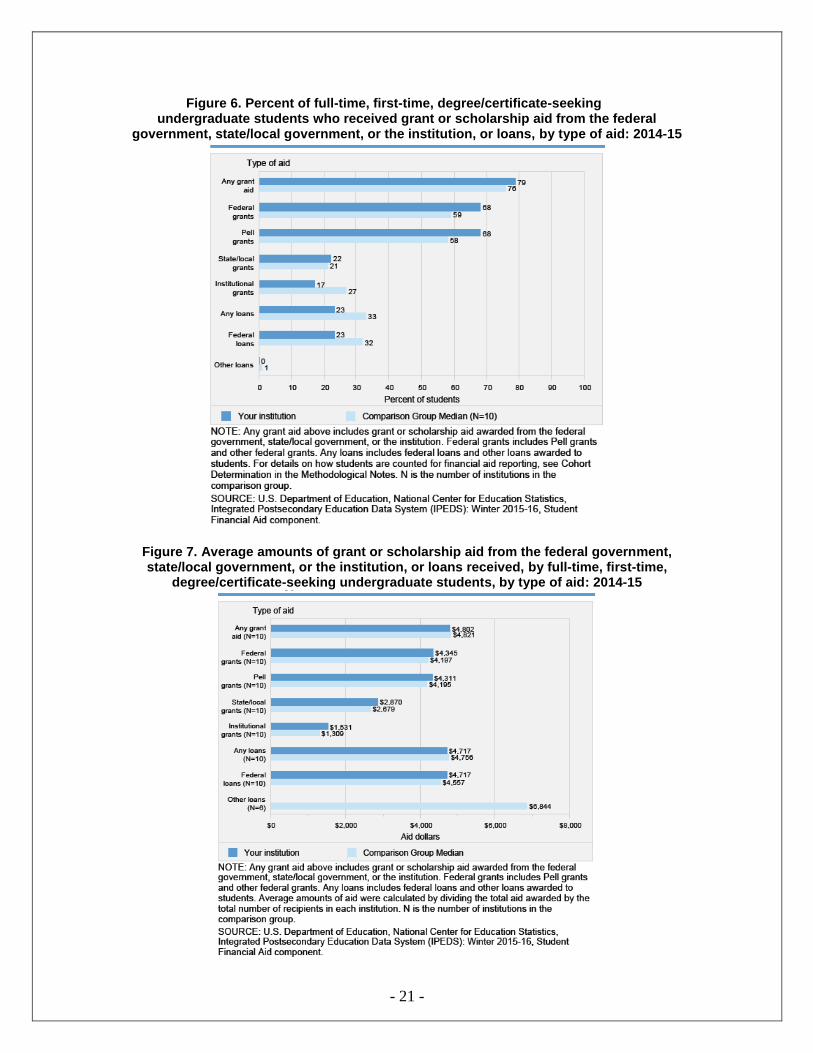
Figure 6. Percent of full-time, first-time, degree/certificate-seeking undergraduate students who received grant or scholarship aid from the federal
government, state/local government, or the institution, or loans, by type of aid: 2014-15
Figure 7. Average amounts of grant or scholarship aid from the federal government, state/local government, or the institution, or loans received, by full-time, first-time,
degree/certificate-seeking undergraduate students, by type of aid: 2014-15
- 22 -
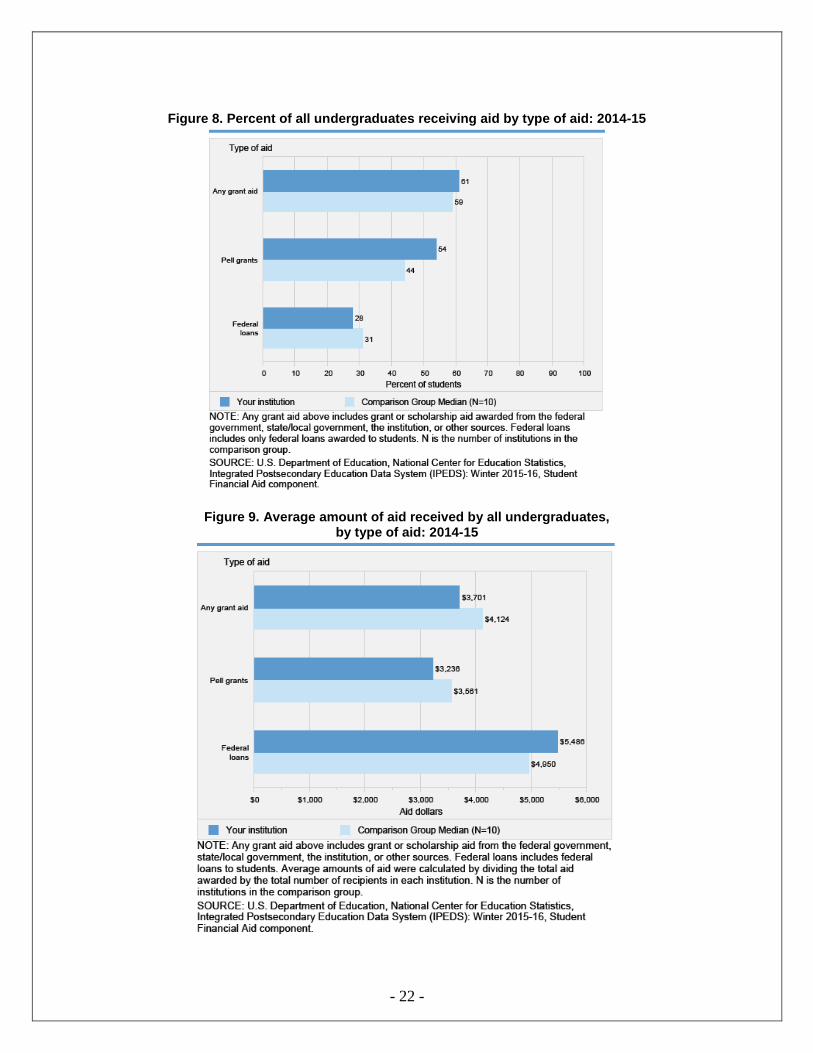
Figure 8. Percent of all undergraduates receiving aid by type of aid: 2014-15
Figure 9. Average amount of aid received by all undergraduates, by type of aid: 2014-15
- 23 -
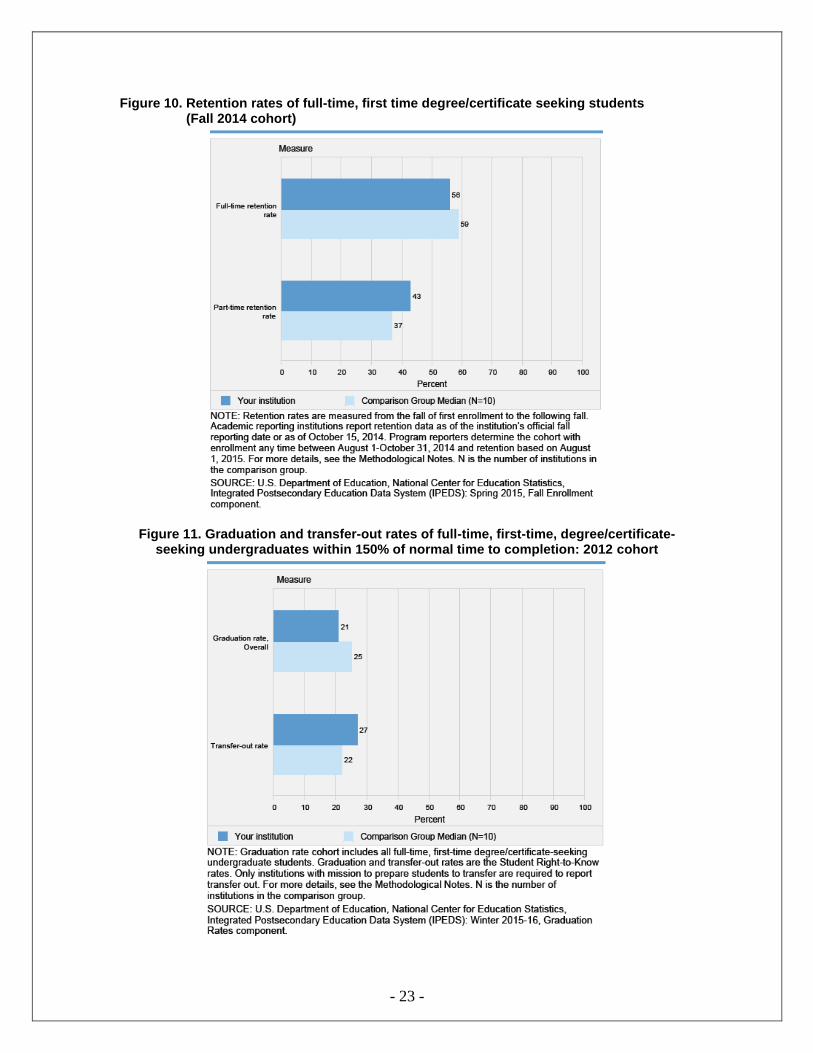
Figure 10. Retention rates of full-time, first time degree/certificate seeking students (Fall 2014 cohort)
Figure 11. Graduation and transfer-out rates of full-time, first-time, degree/certificate-seeking undergraduates within 150% of normal time to completion: 2012 cohort
- 24 -
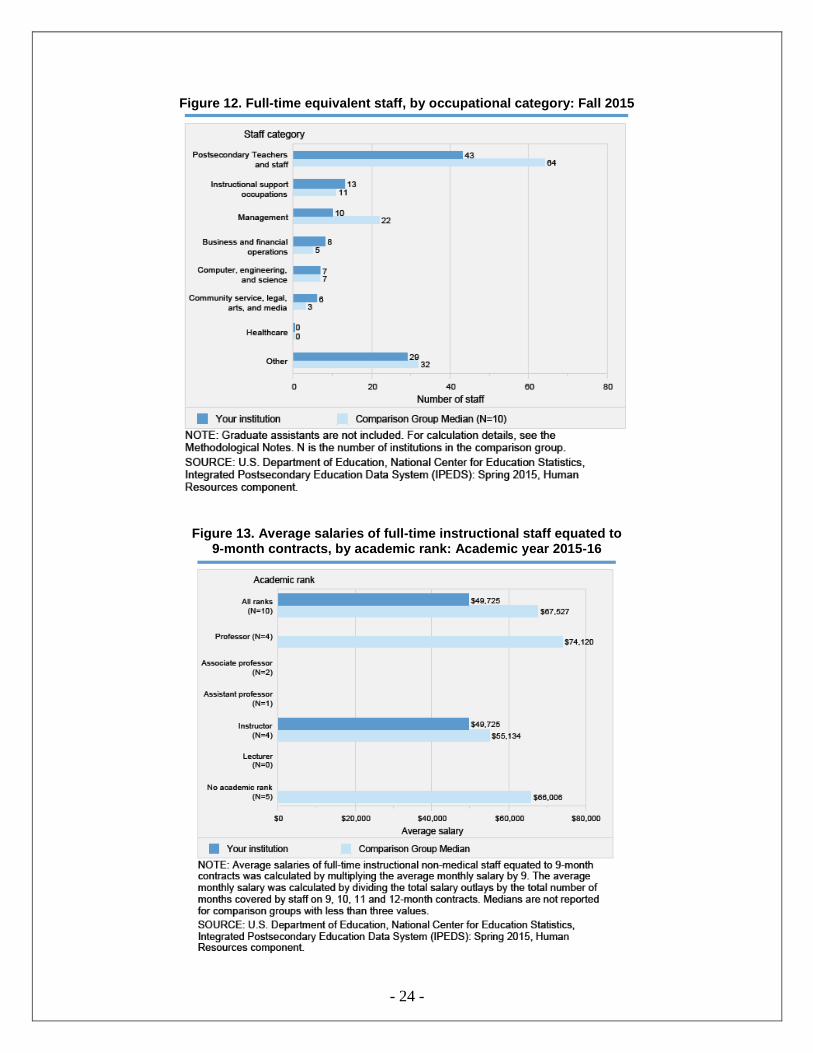
Figure 12. Full-time equivalent staff, by occupational category: Fall 2015
Figure 13. Average salaries of full-time instructional staff equated to 9-month contracts, by academic rank: Academic year 2015-16
- 25 -
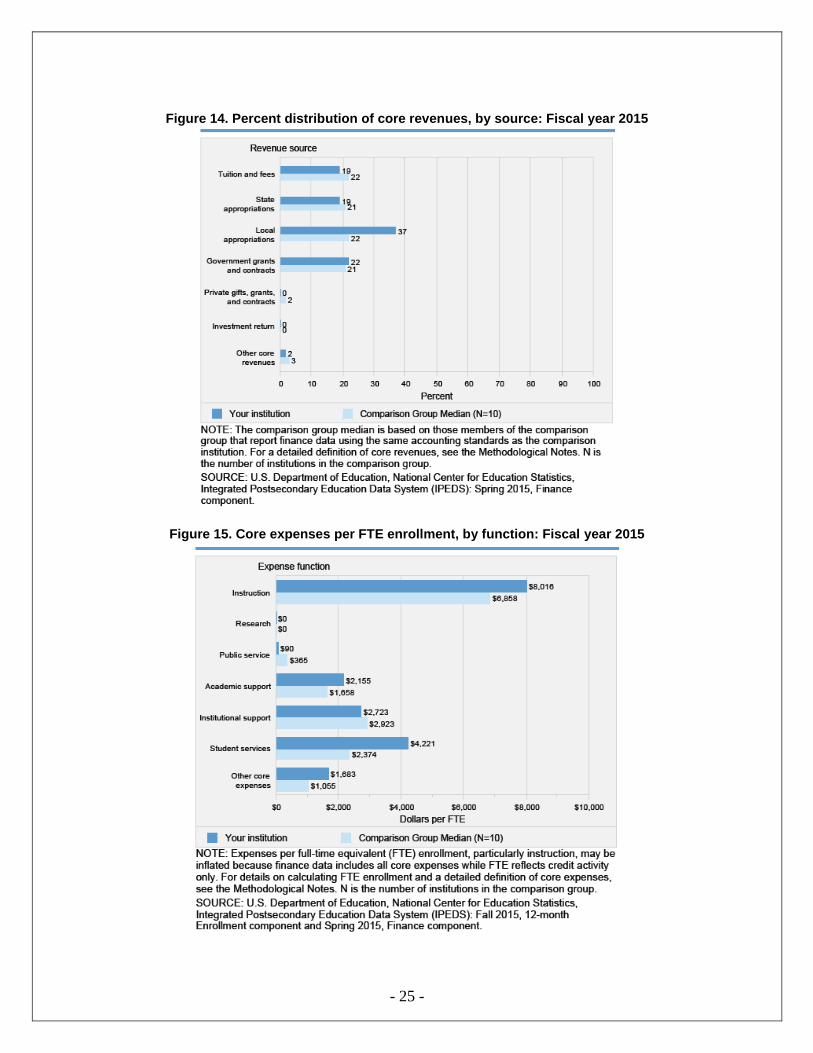
Figure 14. Percent distribution of core revenues, by source: Fiscal year 2015
Figure 15. Core expenses per FTE enrollment, by function: Fiscal year 2015
- 26 -
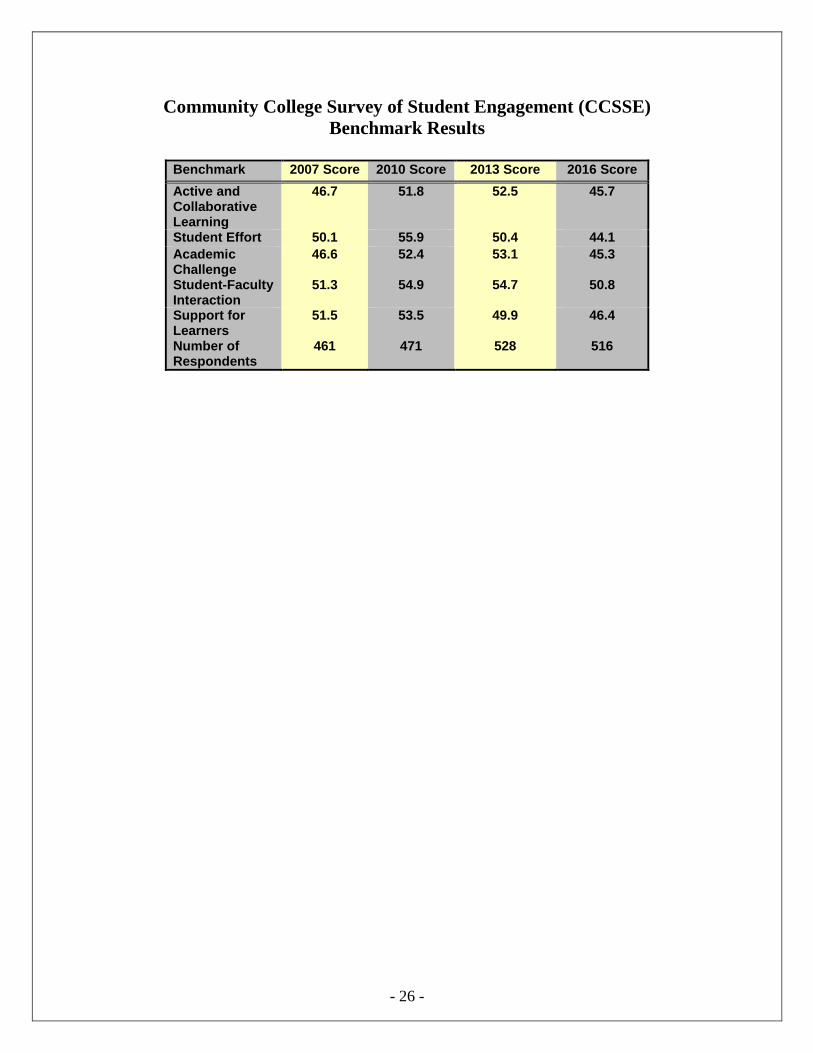
Community College Survey of Student Engagement (CCSSE)
Benchmark Results
Benchmark 2007 Score 2010 Score 2013 Score 2016 Score
Active and Collaborative Learning
46.7 51.8 52.5 45.7
Student Effort 50.1 55.9 50.4 44.1
Academic Challenge
46.6 52.4 53.1 45.3
Student-Faculty Interaction
51.3 54.9 54.7 50.8
Support for Learners Number of Respondents
51.5
461
53.5
471
49.9
528
46.4
516
- 27 -
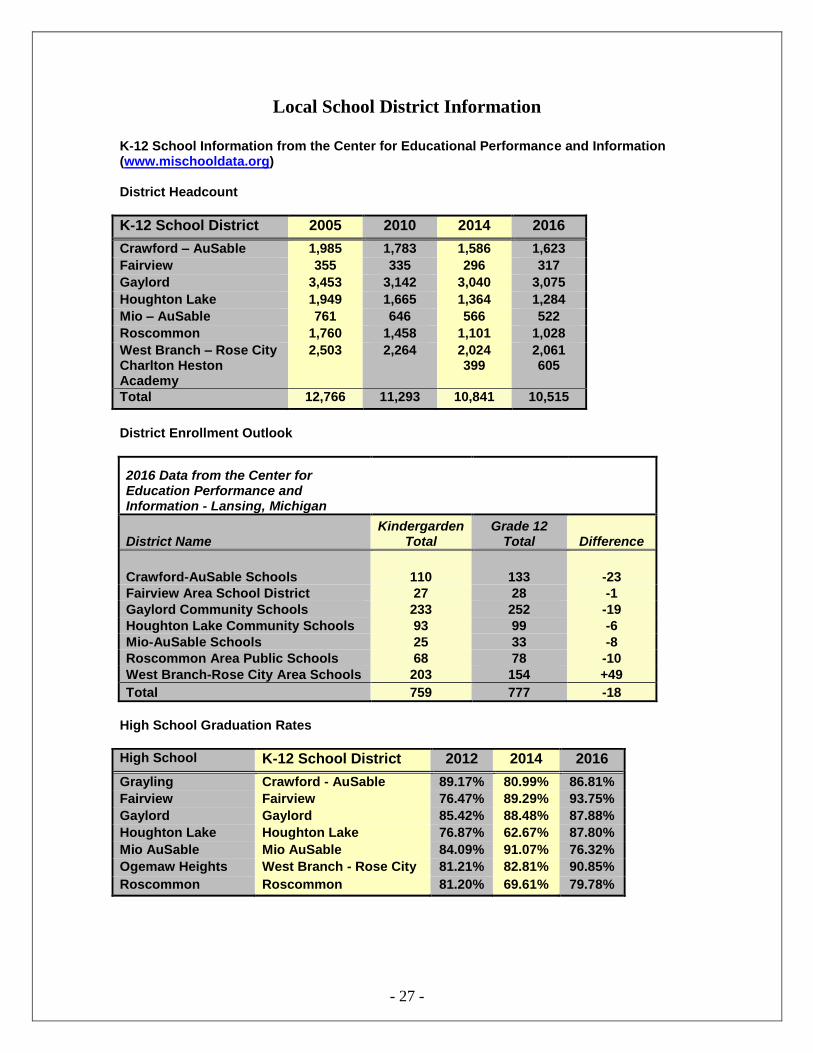
Local School District Information
K-12 School Information from the Center for Educational Performance and Information (www.mischooldata.org) District Headcount
K-12 School District 2005 2010 2014 2016
Crawford – AuSable 1,985 1,783 1,586 1,623
Fairview 355 335 296 317
Gaylord 3,453 3,142 3,040 3,075
Houghton Lake 1,949 1,665 1,364 1,284
Mio – AuSable 761 646 566 522
Roscommon 1,760 1,458 1,101 1,028
West Branch – Rose City Charlton Heston Academy
2,503 2,264 2,024 399
2,061 605
Total 12,766 11,293 10,841 10,515
District Enrollment Outlook
2016 Data from the Center for Education Performance and Information - Lansing, Michigan
District Name Kindergarden
Total Grade 12
Total Difference
Crawford-AuSable Schools 110 133 -23
Fairview Area School District 27 28 -1
Gaylord Community Schools 233 252 -19
Houghton Lake Community Schools 93 99 -6
Mio-AuSable Schools 25 33 -8
Roscommon Area Public Schools 68 78 -10
West Branch-Rose City Area Schools 203 154 +49
Total 759 777 -18
High School Graduation Rates
High School K-12 School District 2012 2014 2016
Grayling Crawford - AuSable 89.17% 80.99% 86.81%
Fairview Fairview 76.47% 89.29% 93.75%
Gaylord Gaylord 85.42% 88.48% 87.88%
Houghton Lake Houghton Lake 76.87% 62.67% 87.80%
Mio AuSable Mio AuSable 84.09% 91.07% 76.32%
Ogemaw Heights West Branch - Rose City 81.21% 82.81% 90.85%
Roscommon Roscommon 81.20% 69.61% 79.78%
- 28 -
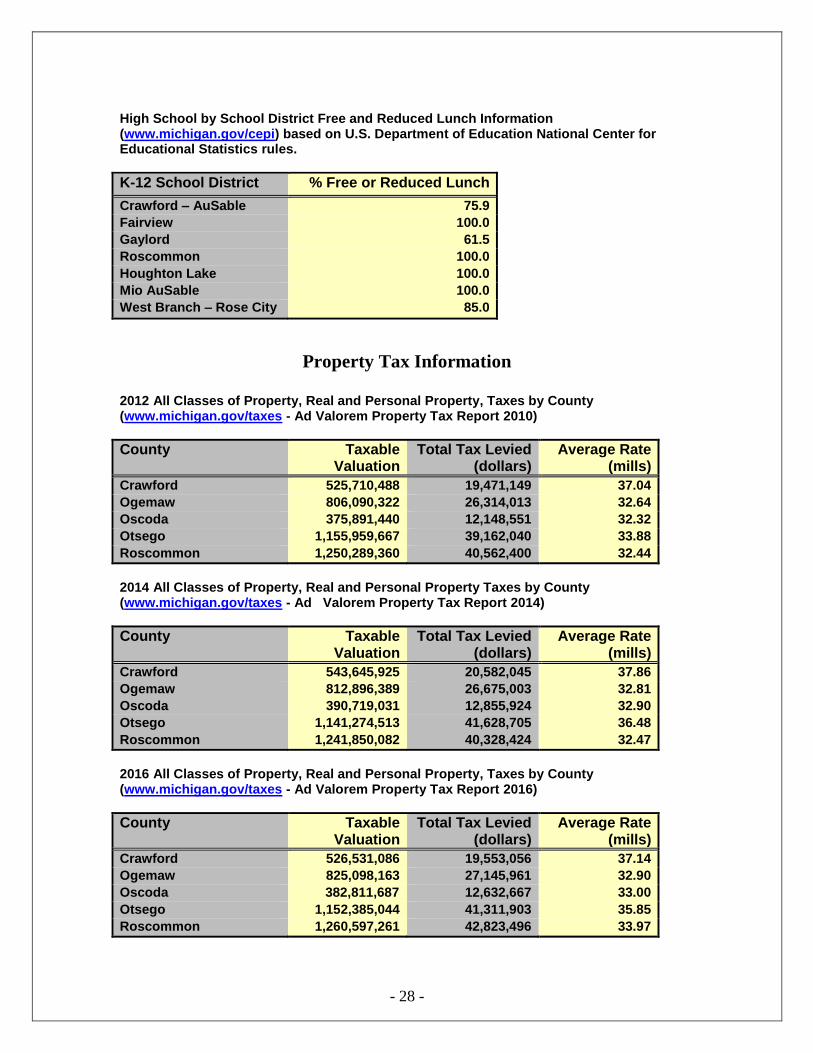
High School by School District Free and Reduced Lunch Information (www.michigan.gov/cepi) based on U.S. Department of Education National Center for Educational Statistics rules.
K-12 School District % Free or Reduced Lunch
Crawford – AuSable 75.9
Fairview 100.0
Gaylord 61.5
Roscommon 100.0
Houghton Lake 100.0
Mio AuSable 100.0
West Branch – Rose City 85.0
Property Tax Information
2012 All Classes of Property, Real and Personal Property, Taxes by County (www.michigan.gov/taxes - Ad Valorem Property Tax Report 2010)
County Taxable Valuation
Total Tax Levied (dollars)
Average Rate (mills)
Crawford 525,710,488 19,471,149 37.04
Ogemaw 806,090,322 26,314,013 32.64
Oscoda 375,891,440 12,148,551 32.32
Otsego 1,155,959,667 39,162,040 33.88
Roscommon 1,250,289,360 40,562,400 32.44
2014 All Classes of Property, Real and Personal Property Taxes by County (www.michigan.gov/taxes - Ad Valorem Property Tax Report 2014)
County Taxable Valuation
Total Tax Levied (dollars)
Average Rate (mills)
Crawford 543,645,925 20,582,045 37.86
Ogemaw 812,896,389 26,675,003 32.81
Oscoda 390,719,031 12,855,924 32.90
Otsego 1,141,274,513 41,628,705 36.48
Roscommon 1,241,850,082 40,328,424 32.47
2016 All Classes of Property, Real and Personal Property, Taxes by County (www.michigan.gov/taxes - Ad Valorem Property Tax Report 2016)
County Taxable Valuation
Total Tax Levied (dollars)
Average Rate (mills)
Crawford 526,531,086 19,553,056 37.14
Ogemaw 825,098,163 27,145,961 32.90
Oscoda 382,811,687 12,632,667 33.00
Otsego 1,152,385,044 41,311,903 35.85
Roscommon 1,260,597,261 42,823,496 33.97
- 29 -
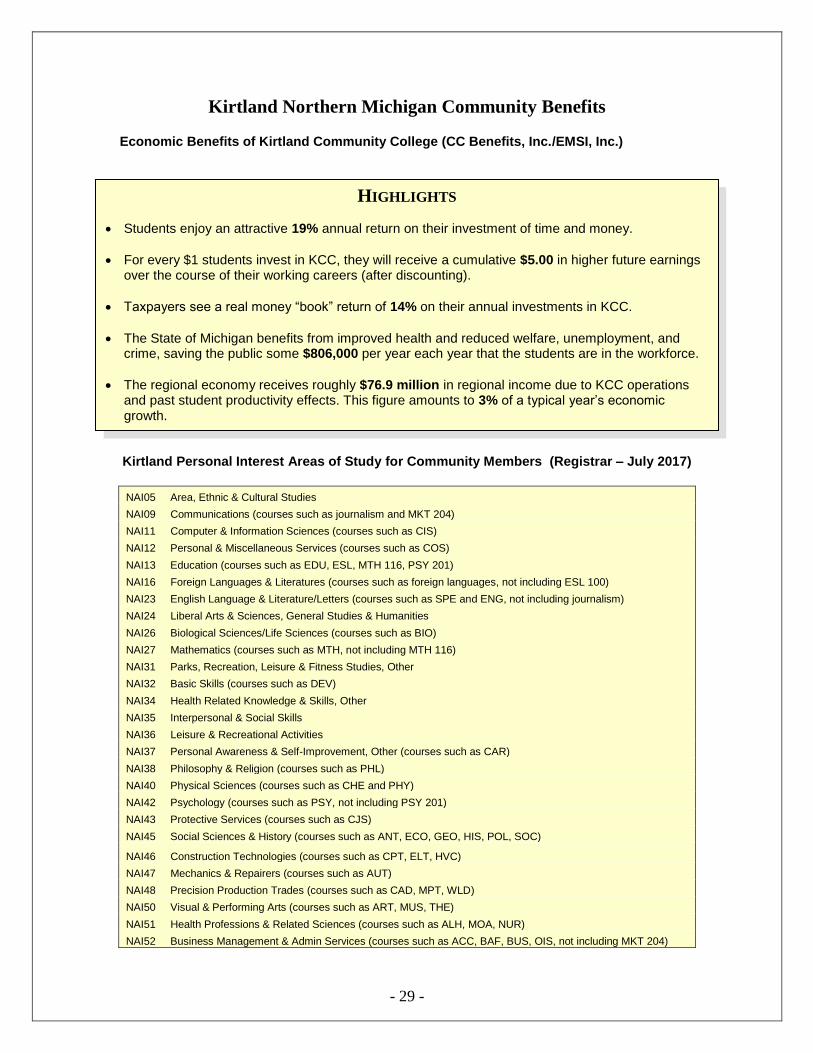
HIGHLIGHTS
Students enjoy an attractive 19% annual return on their investment of time and money.
For every $1 students invest in KCC, they will receive a cumulative $5.00 in higher future earnings over the course of their working careers (after discounting).
Taxpayers see a real money “book” return of 14% on their annual investments in KCC.
The State of Michigan benefits from improved health and reduced welfare, unemployment, and crime, saving the public some $806,000 per year each year that the students are in the workforce.
The regional economy receives roughly $76.9 million in regional income due to KCC operations and past student productivity effects. This figure amounts to 3% of a typical year’s economic growth.
Kirtland Northern Michigan Community Benefits Economic Benefits of Kirtland Community College (CC Benefits, Inc./EMSI, Inc.)
Kirtland Personal Interest Areas of Study for Community Members (Registrar – July 2017)
NAI05 Area, Ethnic & Cultural Studies
NAI09 Communications (courses such as journalism and MKT 204)
NAI11 Computer & Information Sciences (courses such as CIS)
NAI12 Personal & Miscellaneous Services (courses such as COS)
NAI13 Education (courses such as EDU, ESL, MTH 116, PSY 201)
NAI16 Foreign Languages & Literatures (courses such as foreign languages, not including ESL 100)
NAI23 English Language & Literature/Letters (courses such as SPE and ENG, not including journalism)
NAI24 Liberal Arts & Sciences, General Studies & Humanities
NAI26 Biological Sciences/Life Sciences (courses such as BIO)
NAI27 Mathematics (courses such as MTH, not including MTH 116)
NAI31 Parks, Recreation, Leisure & Fitness Studies, Other
NAI32 Basic Skills (courses such as DEV)
NAI34 Health Related Knowledge & Skills, Other
NAI35 Interpersonal & Social Skills
NAI36 Leisure & Recreational Activities
NAI37 Personal Awareness & Self-Improvement, Other (courses such as CAR)
NAI38 Philosophy & Religion (courses such as PHL)
NAI40 Physical Sciences (courses such as CHE and PHY)
NAI42 Psychology (courses such as PSY, not including PSY 201)
NAI43 Protective Services (courses such as CJS)
NAI45 Social Sciences & History (courses such as ANT, ECO, GEO, HIS, POL, SOC)
NAI46 Construction Technologies (courses such as CPT, ELT, HVC)
NAI47 Mechanics & Repairers (courses such as AUT)
NAI48 Precision Production Trades (courses such as CAD, MPT, WLD)
NAI50 Visual & Performing Arts (courses such as ART, MUS, THE)
NAI51 Health Professions & Related Sciences (courses such as ALH, MOA, NUR)
NAI52 Business Management & Admin Services (courses such as ACC, BAF, BUS, OIS, not including MKT 204)
- 30 -
For more information about Kirtland Community College: Visit our website home page: www.kirtland.edu For Admissions visit: http://www.kirtland.edu/admissions For Paying For College – Tuition and Fees visit: http://www.kirtland.edu/paying-for-college/tuition-and-fees For our Higher Learning Commission Accreditation information visit: http://www.hlcommission.org For information about Kirtland programs of study visit: http://www.kirtland.edu/programs-we-offer For information about Kirtland’s budget visit: http://www.kirtland.edu/business-office#budget-transparency For other reports and survey results information visit: http://www.kirtland.edu/about-kirtland/institutional-reports-and-surveys For consumer/student-right-to-know information visit: http://www.kirtland.edu/consumer-student-right-to-know-disclosure-information For Kirtland’s Mission and Vision visit: http://www.kirtland.edu/about-kirtland/vision-mission
To Learn More About Kirtland’s Extension Locations: Kirtland – Gaylord MTEC visit: http://www.kirtland.edu/mtec Kirtland – Grayling Health Science Center visit: http://www.kirtland.edu/health-science-center Kirtland – West Branch visit: http://www.kirtland.edu/west-branch