Embed Size (px)
Citation preview
Bélanger | Van Slyke | Crossler
Information Systemsfor BusinessAn Experiential Approach
ProspectPress
Edition 4.0

Information Systems for Business
An Experiential Approach
Edition 4.0
APPENDICES A–K
France BélangerVirginia Tech
Craig Van SlykeLouisiana Tech University
Robert E. CrosslerWashington State University

Copyright © 2022 Prospect Press, Inc. All rights reserved.
No part of this publication may be reproduced, stored in a retrieval system or transmitted in any form or by any means, electronic, mechanical, photocopying, recording, scanning or otherwise, except as permitted under Sections 107 or 108 of the 1976 United States Copyright Act, without either the prior written permission of the Publisher, or authorization through payment of the appropriate per-copy fee to the Copyright Clearance Center, Inc. 222 Rosewood Drive, Danvers, MA 01923, website www .copyright.com. Requests to the Publisher for permission should be addressed to the Permissions Department, Prospect Press, 47 Prospect Parkway, Burlington, VT 05401 or email [email protected].
Founded in 2014, Prospect Press serves the academic discipline of Information Systems by publishing essential and innovative textbooks across the curriculum including introductory, emerging, and upper-level courses. Prospect Press offers reasonable prices by selling directly to students. Prospect Press provides tight relationships among authors, publisher, and adopters that many larger publishers are unable to offer. Based in Burlington, Vermont, Prospect Press distributes titles worldwide. We welcome new authors to send proposals or inquiries to [email protected].
Editor: Beth Lang GolubProduction Management: Peter Holm, Sterling Hill ProductionsCopyeditor: Carl Quesnel, Assurance EditorialCover Design: Annie Clark
eTextbook:Edition 4.0ISBN: 978-1-943153-87-9Available from Redshelf and VitalSource
Printed Paperback:Edition 4.0ISBN: 978-1-943153-88-6Available from Redshelf
For more information, visit https://www.prospectpressvt.com/textbooks/belanger-information -systems-for-business-4-0.

Contents
Appendix A: Computer Hardware A1
Appendix B: Computer Software A11
Appendix C: Access Fundamentals A23
Appendix D: Advanced Access A35
Appendix E: Advanced Database Concepts A51
Appendix F: Excel Fundamentals A69
Appendix G: Advanced Excel A81
Appendix H: Networking Basics A99
Appendix I: Security and Privacy A111
Appendix J: Funding Information Technology A125
Appendix K: Managing IS Projects A133

Appendix A
Computer HardwareLearning Objectives
By reading and completing the activities in this appendix, you will be able to:
• Discuss the history of computing hardware and systems• Identify the major hardware components of information systems• Identify the various types of input and output technologies and their uses• Describe the main types of primary and secondary storage technologies
and their characteristics
Appendix Outline
IntroductionComputer Hardware GenerationsComputer Hardware PlatformsFocusing Story: Convergence
Learning Activity A.1: What Do I Want for a PC?Hardware Components
Learning Activity A.2: Is Moore’s Law Accurate?Learning Activity A.3: A Chip for My PC?Learning Activity A.4: Life in the 3-D World
Introduction
The focusing story provides an example of how the utilization of computers has changed as a result of convergence. Convergence can be defined as the tendency for different technological systems to evolve toward performing similar tasks. An exam-ple of convergence is using a single device to handle media, Internet, entertainment, and telephony needs. While convergence is constantly changing the computing landscape, it occurs as the result of the functionality of its parts. In this appendix, we present a discussion of the various hardware components that enable computers to perform as they do. These building blocks provide the foundation for the converged technologies we enjoy today.
Computer Hardware Generations
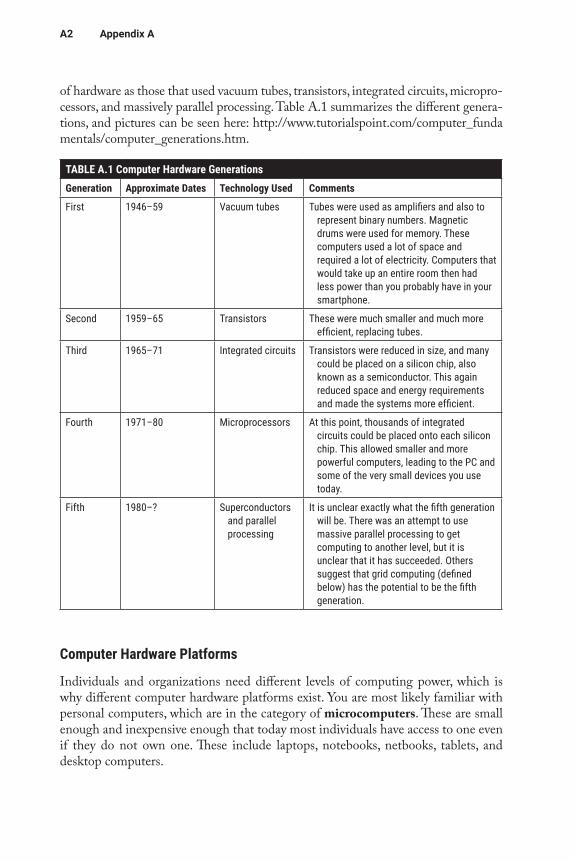
Hardware refers to the physical equipment involved in the input, processing, output, storage, and control activities of an information system. Hardware for information systems has evolved over the years. Today, we usually refer to the five main generations
A2 Appendix A
of hardware as those that used vacuum tubes, transistors, integrated circuits, micropro-cessors, and massively parallel processing. Table A.1 summarizes the different genera-tions, and pictures can be seen here: http://www.tutorialspoint.com/computer_funda mentals/computer_generations.htm.
Computer Hardware Platforms
Individuals and organizations need different levels of computing power, which is why different computer hardware platforms exist. You are most likely familiar with personal computers, which are in the category of microcomputers. These are small enough and inexpensive enough that today most individuals have access to one even if they do not own one. These include laptops, notebooks, netbooks, tablets, and desktop computers.
TABLE A.1 Computer Hardware GenerationsGeneration Approximate Dates Technology Used Comments
First 1946–59 Vacuum tubes Tubes were used as amplifiers and also to represent binary numbers. Magnetic drums were used for memory. These computers used a lot of space and required a lot of electricity. Computers that would take up an entire room then had less power than you probably have in your smartphone.
Second 1959–65 Transistors These were much smaller and much more efficient, replacing tubes.
Third 1965–71 Integrated circuits Transistors were reduced in size, and many could be placed on a silicon chip, also known as a semiconductor. This again reduced space and energy requirements and made the systems more efficient.
Fourth 1971–80 Microprocessors At this point, thousands of integrated circuits could be placed onto each silicon chip. This allowed smaller and more powerful computers, leading to the PC and some of the very small devices you use today.
Fifth 1980–? Superconductors and parallel processing
It is unclear exactly what the fifth generation will be. There was an attempt to use massive parallel processing to get computing to another level, but it is unclear that it has succeeded. Others suggest that grid computing (defined below) has the potential to be the fifth generation.
ComputerHardware A3
F O C U S I N G S T O R Y
ConvergenceWhen you check email, visit Web pages, communicate with friends, talk on the phone, and take pictures, you are likely doing so on an individual device—your smartphone. This ability to use one device to accomplish all these tasks is a somewhat new phenomenon as the re-sult of convergence. When one of us was an undergraduate student in the late 1990s, the Internet was a fairly new technology, as were email and Web pages. To send email or visit Web pages, you would often use a computer in the computer lab (for two main reasons: first, not many undergraduates owned personal computers because of their cost, and second, the Internet was much faster in a lab than dial-up at home). When friends wanted to communi-cate, they would either call each other on the phone or seek out one another and communi-cate face-to-face. At that time, some students carried pagers so that they could know if they needed to go find a phone to return a phone call. Pictures were often taken with cameras that required film, which had to be developed into printed pictures.
Today, the tasks that used to require a number of different devices have converged so that they can be completed all on the same device. For example, a smartphone allows you to perform all the tasks discussed above and then some. Likewise, tablet computers, such as the iPad, are a result of convergence. They allow you to perform many functions all on one compact and portable device. Unfortunately, with the convergence of devices often comes a trade-off in quality, resulting in some people desiring to have a single-function device for some functions. For example, tablet computers have not replaced laptops for many individ-uals because of the difficulty of typing on the touch screen. As a result, people will either add a keyboard (partly defeating the goal of convergence) or also own a laptop for times when they need to be productive. Similarly, the quality of pictures taken with cameras on smart-phones is not up to the quality of stand-alone digital cameras. What you want to accomplish with the pictures may dictate whether you also own a separate digital camera.
FocusingQuestions1. List all the tasks you can perform with a smartphone.2. Identify how these tasks would have been completed prior to them converg-
ing into a smartphone.3. Identify advantages that this convergence has created for individuals and
then for businesses.4. Identify challenges this has created for businesses as well as examples of
when businesses may want to utilize single-function devices.
L E A R N I N G A C T I V I T Y A . 1
WhatDoIWantforaPC?In this activity, you will “build” your own computer at the Dell website. Go to http://www .dell.com and use the Products menu, then select “Laptops for Business.” Select a laptop computer and then hit the Customize & Buy button. Identify all the options presented to you and which ones you would decide to pay for. Bring your final configuration to class.
In class, be prepared to discuss the following:
1. Which options were available to customize?2. How did you decide whether to pay for certain options?3. Which options would you change if this laptop was to be used for your
business, which runs 24/7 (24 hours per day; 7 days per week)?
A4 Appendix A
In organizations, however, you are likely to find large computer hardware plat-forms such as midrange computers and mainframe computers. Some specific organi-zations even have supercomputers. Midrange computers, also called minicomputers, are often used as servers (see Chapter 7). They offer much greater computing capacity than personal computers and can therefore be accessed and used by several users simultaneously. When organizations need substantial computing—for example, to process billing transactions for a telecommunication company—they tend to use mainframes, or large computers that can handle many thousands of users and/or transactions at the same time. While you may hear that the age of the mainframe is over, you would be surprised to find that most large corporations use mainframes extensively today. Supercomputers, on the other hand, are meant for organizations that need excessive processing capacities and speed. For example, models to predict weather require such levels of processing, as do analyses of genetic data. It is possible to achieve great processing power with smaller (e.g., midrange) computers by loosely connecting them together with middleware. This is referred to as grid computing, where computing resources from different locations, organizations, or domains are loosely combined to achieve their goal.
For personal computers, there is also an important categorization you might encounter: personal computers are often classified as thin clients or thick clients. This refers to the level of processing that is performed on the personal computer. In a thick client, the personal computer is involved with much more processing and storage activities, whereas in a thin client, the personal computer performs less processing and storage and instead uses a server to handle most processing. Some of you or your friends might have used a Chromebook, the most common example of a thin client.
Hardware Components
The main categories of hardware include the CPU, storage technologies, input tech-nologies, and output technologies.
L E A R N I N G A C T I V I T Y A . 2
IsMoore’sLawAccurate?For this activity, you need to identify what Moore’s law is and conduct research on it. Determine whether it has been accurate over the years. Be prepared to discuss these questions in class:
1. What is Moore’s law?2. Has it been accurate over the years?3. What has made it possible to sustain Moore’s law so far?4. What is the future of Moore’s law?
ComputerHardware A5
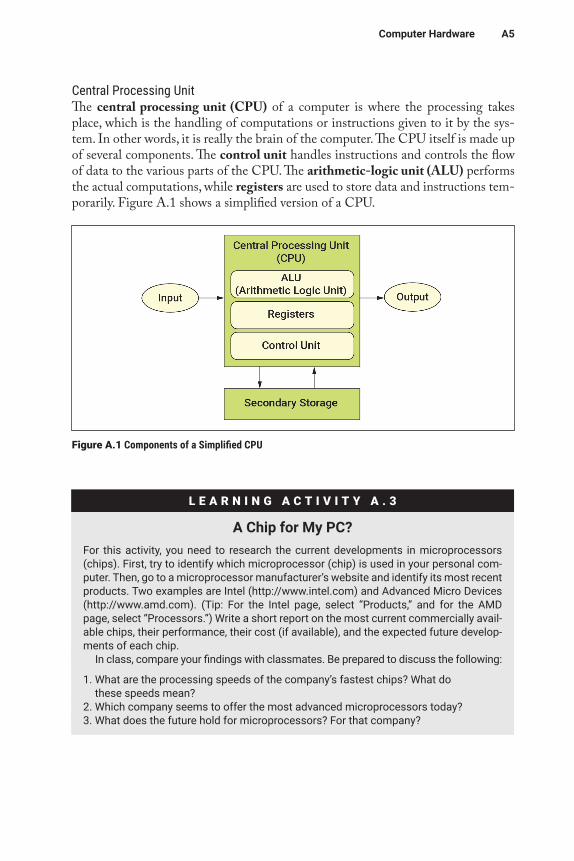
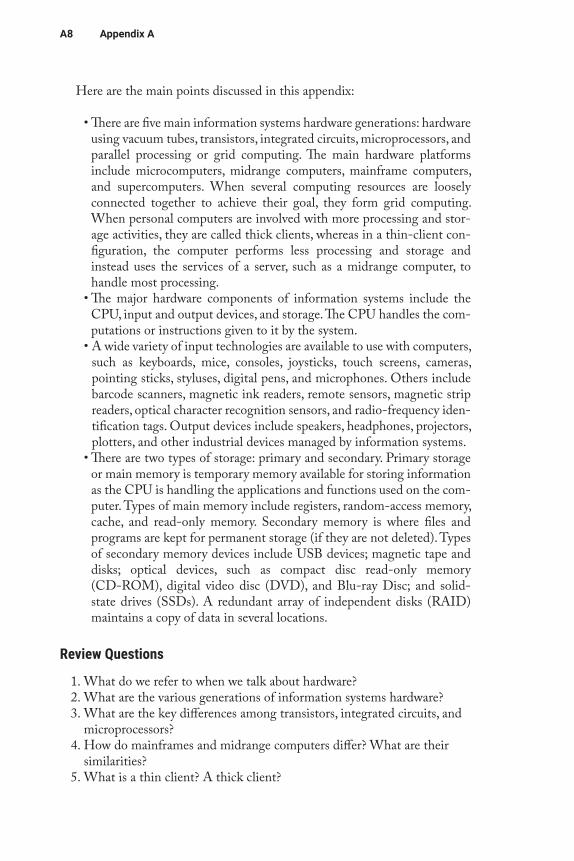
Central Processing UnitThe central processing unit (CPU) of a computer is where the processing takes place, which is the handling of computations or instructions given to it by the sys-tem. In other words, it is really the brain of the computer. The CPU itself is made up of several components. The control unit handles instructions and controls the flow of data to the various parts of the CPU. The arithmetic-logic unit (ALU) performs the actual computations, while registers are used to store data and instructions tem-porarily. Figure A.1 shows a simplified version of a CPU.
L E A R N I N G A C T I V I T Y A . 3
AChipforMyPC?For this activity, you need to research the current developments in microprocessors (chips). First, try to identify which microprocessor (chip) is used in your personal com-puter. Then, go to a microprocessor manufacturer’s website and identify its most recent products. Two examples are Intel (http://www.intel.com) and Advanced Micro Devices (http://www.amd.com). (Tip: For the Intel page, select “Products,” and for the AMD page, select “Processors.”) Write a short report on the most current commercially avail-able chips, their performance, their cost (if available), and the expected future develop-ments of each chip.
In class, compare your findings with classmates. Be prepared to discuss the following:
1. What are the processing speeds of the company’s fastest chips? What do these speeds mean?
2. Which company seems to offer the most advanced microprocessors today?3. What does the future hold for microprocessors? For that company?
Figure A.1 Components of a Simplified CPU
A6 Appendix A
Input and Output DevicesA wide variety of input technologies are available to use with computers. You prob-ably frequently use keyboards and mice, or maybe consoles and joysticks for playing games. Many other input devices—such as touch screens, cameras, styluses, digital pens, and even microphones for voice recognition—are used to interact with various devices. When you use a kiosk, you use touch-screen technology. When you write on a tablet PC like the Microsoft Surface Pro, you most likely use a stylus. Your smart-phone likely uses a touch screen. Still other devices provide inputs to information systems without human interaction, such as barcode scanners, magnetic ink readers, remote sensors, magnetic stripe readers, chip readers, optical character recognition sensors, and even the radio-frequency identification tags discussed in Chapter 12.
There are also many output devices, such as the monitors and printers you may use every day. Other output devices include voice devices like speakers and head-phones, projectors, plotters, and other industrial devices managed by information systems. Today, we are seeing an increasing number of devices that use three-dimen-sional outputs, such as 3-D displays and 3-D printers. Many universities have “maker labs” that have workstations where you can design a product, which you print on a 3-D printer. The prices of basic 3-D printers have dropped to the point where they are affordable for home use.
Storage TechnologiesPeople often look at two factors in deciding which personal computer to buy: pro-cessing power and memory. Processing power depends on the CPU used, as described in the previous section. Memory actually refers to two types of storage technologies related to the computer: primary and secondary memory.
Primary storage or main memory represents the amount of temporary memory available for storing information as the CPU is handling the applications and func-tions used on the computer. The types of information stored in main memory include data to be used for processing, instructions for the CPU to process the data, and applications that are used by the computer. The main memory can affect the perfor-mance of your computer if, for example, you have a small amount available but typ-
L E A R N I N G A C T I V I T Y A . 4
Lifeinthe3-DWorldMost of the devices we are familiar with are two-dimensional devices. However, the world of 3-D is becoming mainstream today, with many television sets offering 3-D screens. They used to require geeky glasses but are getting close to the point where such glasses won’t be required. This is the new world of 3-D. However, 3-D is not limited to television. There are now many 3-D displays, as well as 3-D printers, 3-D semiconduc-tors, and virtual reality headsets and devices, such as the Oculus Rift and Samsung Gear VR. Select one of these 3-D technologies and perform research. Write a short es-say about how the technology works, what its main advantages and disadvantages are, and what you find most surprising about the technology.
ComputerHardware A7
ically try to run many applications (open programs) at the same time. The types of main memory include registers (briefly mentioned when talking about the CPU), random-access memory (RAM), and cache. RAM is the one that best describes main memory—small amounts of data or parts of applications being stored while in use for processing. Cache is used for storing data that are used more often (instead of leaving them in secondary storage) to improve computer performance. All these are managed by the computer’s operating system and are considered volatile, in that they are cleared when the computer is turned off. An additional type of memory is read-only memory (ROM), which is a storage location for critical instructions that is nonvolatile.
Secondary memory, also called permanent memory, is where you store your files and programs. While it takes longer for the computer to access secondary storage, it is considered permanent in that saved files are not removed when the power is turned off. Many devices are used for secondary storage, and the cost of these devices con-tinues to go down every year. You are familiar with small USB devices described in the book. Over very few years, their cost remained relatively low and stable while their capacity went from 128 Kb to 128 GB and more today. The same is true for larger devices. Technologies for secondary storage also include magnetic tape (not many today) and disks and optical devices, such as compact disc read-only memory (CD-ROM), digital video disc (DVD), and Blu-ray Disc. Newer devices are gain-ing popularity in optical storage, such as holographic memory that uses three dimensions to store data.
Solid-state drives (SSDs) have become popular, especially for lightweight lap-tops and portable storage. Traditional drives are mechanical, with one or more plat-ters (a small, circular magnetic plate that stores data) that rotate rapidly while a read-write head moves back and forth along the platter to read or store data. In contrast, SSDs have no moving parts; they store data on semiconductors, much like USB thumb drives. SSDs are lighter and much faster than traditional drives, use less power, and are more reliable. However, an SSD is more expensive than a traditional drive with the same storage capacity.
For large companies that have multiple storage devices and huge amounts of data, making sure the data are not lost is very important. Many organizations therefore use something called a redundant array of independent disks (RAID) to ensure that the data are stored redundantly, which provides organizations with a way to make sure they have access to the data if something happens to one of their storage devices (since a copy of the data is maintained on a different disk). This allows the company to continue operations with little to no downtime.
Summary
In this appendix, we discussed basic concepts related to information systems hard-ware, starting with different hardware generations and platforms. We then discussed the hardware components of an information system, starting with the central pro-cessing unit (CPU) and continuing with input and output devices and storage.
A8 Appendix A
Here are the main points discussed in this appendix:
• There are five main information systems hardware generations: hardware using vacuum tubes, transistors, integrated circuits, microprocessors, and parallel processing or grid computing. The main hardware platforms include microcomputers, midrange computers, mainframe computers, and supercomputers. When several computing resources are loosely connected together to achieve their goal, they form grid computing. When personal computers are involved with more processing and stor-age activities, they are called thick clients, whereas in a thin-client con-figuration, the computer performs less processing and storage and instead uses the services of a server, such as a midrange computer, to handle most processing.
• The major hardware components of information systems include the CPU, input and output devices, and storage. The CPU handles the com-putations or instructions given to it by the system.
• A wide variety of input technologies are available to use with computers, such as keyboards, mice, consoles, joysticks, touch screens, cameras, pointing sticks, styluses, digital pens, and microphones. Others include barcode scanners, magnetic ink readers, remote sensors, magnetic strip readers, optical character recognition sensors, and radio-frequency iden-tification tags. Output devices include speakers, headphones, projectors, plotters, and other industrial devices managed by information systems.
• There are two types of storage: primary and secondary. Primary storage or main memory is temporary memory available for storing information as the CPU is handling the applications and functions used on the com-puter. Types of main memory include registers, random-access memory, cache, and read-only memory. Secondary memory is where files and programs are kept for permanent storage (if they are not deleted). Types of secondary memory devices include USB devices; magnetic tape and disks; optical devices, such as compact disc read-only memory (CD-ROM), digital video disc (DVD), and Blu-ray Disc; and solid- state drives (SSDs). A redundant array of independent disks (RAID) maintains a copy of data in several locations.
Review Questions
1. What do we refer to when we talk about hardware? 2. What are the various generations of information systems hardware? 3. What are the key differences among transistors, integrated circuits, and
microprocessors? 4. How do mainframes and midrange computers differ? What are their
similarities? 5. What is a thin client? A thick client?
ComputerHardware A9
6. What is a supercomputer? 7. What is grid computing? 8. What are the components of a CPU? 9. What are the different types of memory or storage? 10. What is RAID storage, and what is its purpose?
Reflection Questions
1. What is the most important thing you learned in this appendix? Why is it important?
2. What topics are unclear? What about them is unclear? 3. What relationships do you see between what you learned in this appendix
and what you learned in other parts of the text? 4. How is the material in this appendix related to the material in Appendix B? 5. Explain how a mainframe is similar to and different from a supercom-
puter. 6. Explain how the computer generations presented in Table A.1 support
the ideas proposed by Moore’s law. 7. What is the difference between grid computing and distributed comput-
ing? 8. Why is there a need for primary storage, such as registers or cache? 9. What relations can you draw between the functioning of the CPU and
security threats discussed in the book? 10. Why do you think we are seeing increasing storage capacities on devices
at such low costs?
Glossary
Arithmetic-logic unit (ALU): The component of the CPU that performs the actual com-putations.
Blu-ray: A type of secondary memory device that uses optical technology that super-seded the DVD.
Cache: Memory used for storing data that are used more often to improve computer performance.
Central processing unit (CPU): The component of a computer where the processing or handling of computations or instructions is done.
Compact disc read-only memory (CD-ROM): A type of secondary memory device that uses optical technology.
Control unit: The component of the CPU that handles instructions and controls the flow of data to the various parts of the CPU.
Convergence: The tendency for different technological systems to evolve toward per-forming similar tasks.
Digital video disc (DVD): A type of secondary memory device that uses optical technol-ogy that superseded the CD-ROM.
A10 Appendix A
Grid computing: Computing resources from different locations, organizations, or do-mains loosely combined to achieve their goal.
Hardware: The physical equipment involved in the input, processing, output, storage, and control activities of an information system.
Holographic memory: A type of secondary memory device that uses three dimensions to store data.
Integrated circuits: The third generation of information system hardware; include many transistors.
Magnetic tape and disks: A type of secondary memory technology.Mainframes: Large computers that can handle many thousands of users and/or trans-
actions at the same time.Microcomputers: Small computers for individual use; include laptops, notebooks, tab-
lets, and desktop computers.Microprocessors: The fourth generation of information system hardware; include
thousands of integrated circuits; currently used in most computers.Midrange computers: Computers that offer greater computing capacity than personal
computers and can be accessed and used by several users simultaneously. Also called minicomputers.
Networked computers: Thin clients.Primary storage: Represents temporary memory available for storing information as
the CPU is handling the applications and functions used on the computer. Also called main memory.
Random-access memory (RAM): Memory where small amounts of data or parts of ap-plications are stored while in use for processing.
Read-only memory (ROM): Nonvolatile memory where critical instructions are stored.Redundant array of independent disks (RAID): A type of secondary memory where a
copy of data is maintained on several disks to ensure that the data are stored re-dundantly.
Registers: Components of the CPU used to store data and instructions temporarily.Secondary memory: Memory where files and programs are stored. Also called perma-
nent memory.Solid-state drive (SSD): A secondary storage device that stores data on semiconductors
rather than magnetic platters.Supercomputers: Very large computers meant for organizations that need excessive
processing capacities and speed.Superconductors: The fifth generation of information system hardware; allow parallel
processing; few devices currently available.Thick client: A personal computer with substantial processing and storage facilities.Thin client: A personal computer performing less processing and storage, instead us-
ing a server, such as a midrange computer, to handle most processing.Transistors: The second generation of information system hardware; smaller and
more efficient than vacuum tubes.Vacuum tubes: The first generation of information systems hardware.
Appendix B
Computer SoftwareLearning Objectives
By reading and completing the activities in this appendix, you will be able to:
• Distinguish between system software and application software• Describe the relationship between system software and application soft-
ware• Describe the main functions of an operating system• Describe the purpose of utility software• Name and describe several frequently used kinds of utility software• Use four dimensions to classify application software• Explain the concept of an “app store” and why they are important to
mobile operating system companies
Appendix Outline
IntroductionTypes of SoftwareFocusing Story: Installation of Software
Learning Activity B.1: Why Did You Choose Your Operating System?Learning Activity B.2: Find a Utility
ApplicationsLearning Activity B.3: Classify Applications
App StoresLearning Activity B.4: Find an AppLearning Activity B.5: App Usage
Introduction
Throughout this book, we have discussed many different kinds of software. This appendix gives you some additional information about software, including descrip-tions of some types of software not discussed elsewhere in the book. Software is an organized set of data and instructions that govern the operation of a computer. Pro-cedures for using a computer are also considered part of software.
Types of Software
There are two major categories of software: system software and application software. Usually, you use a computer to complete some task—write a paper, look something up
A12 Appendix B
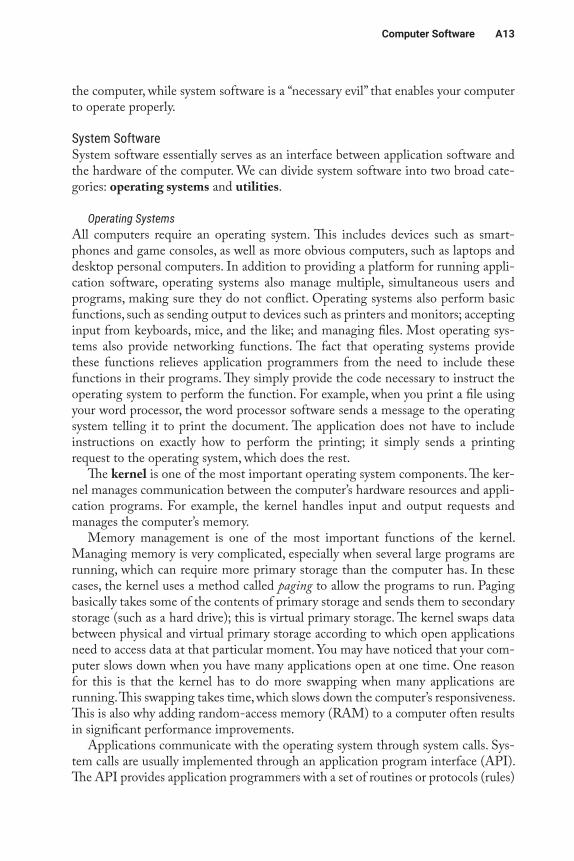
on the Web, send an email, or play a game. Application software lets you perform these tasks; it is software that includes the computer programs and procedures necessary to carry out some specific task. When you use a computer, most of the time you are interacting with application software. However, the application software cannot operate without system software. System software controls the operation of the com-
puter’s hardware. It also serves as the platform on which application software operates. Figure B.1 shows the relation-ship between application software and system software.
While system software is usually transparent to the user, it is sometimes necessary to interact directly with sys-tem software. Usually this happens when you need to perform some house-keeping chore, such as uninstalling soft-ware; deleting, copying, or moving files; or scanning your computer for viruses and/or spyware. The point to remember is that application software lets you accomplish what you want to do with
F O C U S I N G S T O R Y
InstallationofSoftwareMost of us use numerous apps (application software packages) on our smartphones and tablets. These apps allow us to play games, access social media, read e-books, send text messages, check email, and perform numerous other tasks. As is the case with any comput-ing device, the usefulness of the device is a function of the apps on it. Imagine having an iPhone but using it for nothing more than phone calls. The popularity of smartphone apps is shown by the millions of apps in the Google Play Store and Apple App Store. Apps are so useful that there’s an old geek joke that goes something like this: What do you call a comput-er without application software? The answer: A boat anchor. Don’t worry if you didn’t laugh; the joke is usually funny only to old geeks. The point of the joke is that apps are what make computing devices useful, whether the device is a laptop, smartphone, tablet, or mainframe. This was true in the earliest days of computing, and it will remain true in the future.
FocusingQuestionsThink about the first issue, the ease with which software can be pirated, and answer the fol-lowing questions:
1. What are your favorite apps on your smartphone or tablet? Why are they your favorites? In other words, what do they let you do on your device?
2. What are your most-used applications on your computer? What do these apps let you do?
3. How do the two lists compare? Are there differences in what you do on your smartphone, tablet, and computer?
Figure B.1 Relationships among Application Soft-ware, System Software, and Hardware
ComputerSoftware A13
the computer, while system software is a “necessary evil” that enables your computer to operate properly.
System SoftwareSystem software essentially serves as an interface between application software and the hardware of the computer. We can divide system software into two broad cate-gories: operating systems and utilities.
Operating SystemsAll computers require an operating system. This includes devices such as smart-phones and game consoles, as well as more obvious computers, such as laptops and desktop personal computers. In addition to providing a platform for running appli-cation software, operating systems also manage multiple, simultaneous users and programs, making sure they do not conflict. Operating systems also perform basic functions, such as sending output to devices such as printers and monitors; accepting input from keyboards, mice, and the like; and managing files. Most operating sys-tems also provide networking functions. The fact that operating systems provide these functions relieves application programmers from the need to include these functions in their programs. They simply provide the code necessary to instruct the operating system to perform the function. For example, when you print a file using your word processor, the word processor software sends a message to the operating system telling it to print the document. The application does not have to include instructions on exactly how to perform the printing; it simply sends a printing request to the operating system, which does the rest.
The kernel is one of the most important operating system components. The ker-nel manages communication between the computer’s hardware resources and appli-cation programs. For example, the kernel handles input and output requests and manages the computer’s memory.
Memory management is one of the most important functions of the kernel. Managing memory is very complicated, especially when several large programs are running, which can require more primary storage than the computer has. In these cases, the kernel uses a method called paging to allow the programs to run. Paging basically takes some of the contents of primary storage and sends them to secondary storage (such as a hard drive); this is virtual primary storage. The kernel swaps data between physical and virtual primary storage according to which open applications need to access data at that particular moment. You may have noticed that your com-puter slows down when you have many applications open at one time. One reason for this is that the kernel has to do more swapping when many applications are running. This swapping takes time, which slows down the computer’s responsiveness. This is also why adding random-access memory (RAM) to a computer often results in significant performance improvements.
Applications communicate with the operating system through system calls. Sys-tem calls are usually implemented through an application program interface (API). The API provides application programmers with a set of routines or protocols (rules)
A14 Appendix B
for asking the kernel to perform a task. While this makes programmers’ work easier, it also ensures a more consistent experience for users. For example, the process for saving a document has the same look and feel for almost all Windows programs. This is because most developers of Windows-based applications use the Windows API to perform the task of saving a file.
Windows 10, Apple’s macOS, Chrome OS, and Linux are popular personal com-puter operating systems. (Note that there are many different distributions of Linux, such as Ubuntu and Fedora.) Windows in its various forms still holds a large portion of the PC operating system market. As of July 2020, Windows held more than 77% of the market. Google’s Android and Apple’s iOS are popular operating systems for smartphones. Larger computers, such as mainframes, run a variety of operating sys-tems, including Unix, IBM’s z/OS, Solaris, Linux, and HP-UX. Many operating systems are based on the Unix operating system. Examples include Linux, macOS, Solaris, and HP-UX.
Which is the best operating system? That is largely a matter of opinion. Most have their advantages and disadvantages, and all accomplish essentially the same tasks. The most important thing to consider when choosing an operating system is whether the application programs you need can run on the operating system. For example, if you absolutely must have Microsoft Access, you need to run some version of Windows. If GarageBand is a must for you, then you have to use macOS. If the applications you need run on multiple operating systems, then the choice comes down to your preferred hardware and interface. For example, many people who pur-chase a Mac do so because they like the interface, while many Windows users prefer the wider choice of hardware available for Windows. The openness of the operating system is also a consideration. Proprietary operating systems such as Windows and macOS are controlled by a single company, whereas Linux is open source and there-fore is much more open.
Utility SoftwareUtility software consists of programs that perform tasks related to the management of a computer. As is the case with operating systems, few people would buy a com-puter just to run utility software. Rather, utilities help you manage your computer. Antivirus software is a good example. You would not buy a computer just to run antivirus software, but this utility helps keep your computer operating correctly by avoiding viruses.
L E A R N I N G A C T I V I T Y B . 1
WhyDidYouChooseYourOperatingSystem?What operating systems do you use for your PC and mobile phone? Why are you using these particular operating systems? How well do the two systems interact with one another? Write a one-page report that answers these questions. Compare your respons-es with another student.
ComputerSoftware A15
Distinguishing between operating systems software and utility software is some-times confusing. This is because many utility functions are now built into operating systems. Disk defragmenting software is an example. (Over time, hard drives can become fragmented, which means that data for a single file can be spread across different parts of the drive. This can hurt performance. Defragmenting software fixes this problem.) Defragmenting software is included in Microsoft Windows (look in the System Tools folder) but is also available as a separate utility. Years ago, it was only available as a utility.
The following are some popular examples of utility software:
• File compression and archiving: If you have ever received a “zipped” file, you probably needed an “unzipping” utility to extract the files from the .zip file. A .zip file serves two purposes. It compresses the included files so that they take up less space, and it also combines multiple files into a single file (the archive), which makes them easier to manage and share. Actually, .zip is only one form of file compression and archiving. Other examples include .cab, .rar, and .tar.gz. The last format (.tar.gz) is inter-esting because it combines an archiving format (.tar) with a compression format (.gz). Popular file compression and archiving utilities include WinZip, 7-Zip, and IZArc.
• Data backup: Data backup utilities make it easier for you to maintain a copy of your data to protect against data loss. Some operating systems include backup software, but this software is often limited in its func-tionality or is relatively hard to use. The ability to schedule regular backups is a feature of many backup utilities. Some backup utilities include the ability to create multivolume backups, which means that a single backup can be stored on multiple CDs or other media. Another useful backup feature is data compression, which allows the backup to use less space. However, it does make recovery a bit harder to perform. Backup utilities often give you the choice of doing a full backup (back up all data) or an incremental backup, which only backs up data that has changed since the last backup. One of the most interesting devel-opments in backup utilities is the growing popularity of cloud-based backup utilities. Some of these are dedicated backup utilities. For example, Carbonite (https://www.carbonite.com/home3/) provides automatic or scheduled incremental backups to a remote server. One of the interesting things about cloud-based backup is that your backup files are stored remotely, which gives you an additional layer of protec-tion (e.g., so physical damage to your home, like a natural disaster, doesn’t damage your backup). Security is a major concern for cloud-based backup, however. Dropbox (https://www.dropbox.com) is another cloud-based storage system that provides backup. Dropbox is primarily a file synchronization service, however. As a result, only files that are marked for synchronization are backed up.
A16 Appendix B
• Antimalware: Unfortunately, computer viruses, spyware, and other types of malware are a fact of life for many computer users. Utilities such as antivirus and antispyware software help protect us from malware. Most antimalware software runs in the background, continuously checking for potentially harmful software. In most cases, you can also run periodic scans to check your computer for malware. While there are threat- specific programs, several companies offer suites that protect against multiple threats. Examples of security suites include AVG, Kaspersky, Mc Afee, Norton, and F-Secure.
• System repair: System repair utilities, which are sometimes called system tune-up software, perform a variety of tasks intended to improve the performance of a computer. Over time, a computer can become sluggish for several reasons, including incorrect registry entries, a large number of temporary files, fragmented files, and unnecessary background processes. (The registry is a database of system configuration files.) System repair utilities clean up many of these problems. Some utilities address a spe-cific problem, while others are suites that address multiple issues. Be careful when using system repair utilities, as there is a chance that the software could make harmful changes. You should create a backup of important data prior to doing a system tune-up.
• System migration: Getting a new computer is exciting, until you think about the hassle of having to move your software, files, and settings to the new computer. This is usually a time-consuming, complex task. Sys-tem migration utilities help make this task easier. For example, PCmover attempts to move all your data, application software, and settings from one computer to another. Notice that we said “attempts.” In most cases, the migrations are not completely effective.
• File synchronization: Many computer users work on more than one com-puter. For example, many users have a desktop and laptop computer and use both regularly. If you have more than one computer, you have prob-ably experienced the frustration of needing a file that is on your other computer. The backup utilities that we discussed earlier are a one-way form of file synchronization. While this is helpful for backup, it is less useful if you are trying to use multiple computers. In these cases, two-way syncing is necessary. If you have a desktop and laptop, this means that files on your laptop are sent to the desktop, and vice versa. Some synchronization systems use removable storage media, such as a USB thumb drive, to keep the computers in sync. However, network-based synchronization is often easier and more effective. Dropbox, which we mentioned earlier, is an example of cloud-based synchronization. Some utilities, such as GoodSync, can synchronize using either a network server or a USB drive.
ComputerSoftware A17
Many other utilities exist. If you experience some problem related to the opera-tion of your computer, there is probably a utility that can help. While the utilities that we described focus on personal computers, there are also important utilities for other types of computers, such as mainframes.
Applications
Application software lets you perform specific tasks using a computer. Applica-tions range from large-scale systems, such as enterprise systems, to computer games. You learned about many different kinds of application software throughout the book. There is an almost endless array of application software available today, so understanding the range of applications can be challenging. To help you gain an understanding of application software, we present several dimensions that can be used to classify them. These are (1) business or personal-use software, (2) general productivity or special-purpose software, (3) horizontal- or vertical-market soft-ware, and (4) locally installed or cloud-based software. Note that this is not an exhaustive list of dimensions, but it is sufficient for our purposes. Also keep in mind that there are some gray areas. For example, photo editing software can be used by individuals (personal use) or by businesses.
• Business or personal-use software: Applications can be for business or per-sonal use. Most of the applications we describe in the book are business applications. Examples include ERP, customer relationship manage-ment, and supply chain management. Office suites, such as Microsoft Office, are also intended primarily for business use but blur the line, as this software is also often used for personal use as well. Personal-use software tends to be directed at pleasurable, entertainment-oriented uses. Examples include computer games, media players (such as iTunes), and photo viewers. Applications directed at hobbyists, such as software for keeping track of a family tree, would also be considered personal-use software.
L E A R N I N G A C T I V I T Y B . 2
FindaUtilityFor any three types of utility programs discussed above, find two specific examples of a utility program in that category. You may not use the examples provided in the text. For each utility program, provide the following:
1. The name2. A brief description of the utility3. The cost
A18 Appendix B
• General productivity or special-purpose software: General productivity software is less focused than special-purpose software. For example, an electronic spreadsheet application can be applied to many very different tasks. The same can be said for drawing software (such as Microsoft Visio), presentation software (such as Apple Keynote), and word proces-sors (such as Microsoft Word). Special-purpose software applications are more focused. These applications are intended to perform a more narrow set of tasks. Examples include software for accounting, computer- aided design, statistical analysis, inventory control, and customer rela-tionship management.
• Horizontal- or vertical-market software: Vertical-market software is soft-ware that is customized for use in a particular industry. Examples include software for electronic medical records, property management, manufac-turing systems, and vehicle fleet management. Some of this software is very narrowly focused. In contrast, horizontal-market software can be used across a wide range of industries. CRM is an example, since it can be applied to almost any industry. Interestingly, horizontal-market soft-ware is sometimes customized for particular industries. Salesforce.com, for example, can be customized to meet the needs of industries ranging from financial services to media.
• Locally installed or cloud-based software: A few years ago, we would not have included this dimension. Today, however, there is a growing trend of accessing applications through the Internet (or other network) rather than having them installed locally. (Being installed locally means that the software is installed on the user’s computer.) The CRM application offered by Salesforce.com is an example of a cloud-based application. Google Docs is another example. Microsoft and Apple both provide cloud-based storage and applications. Spotify is a cloud-based music system that allows you to access many songs and playlists across devices. As discussed in Chapter 7, there are many advantages to cloud-based
L E A R N I N G A C T I V I T Y B . 3
ClassifyApplicationsPartner with another student. Classify each of the following applications on each of the four dimensions described above. Briefly explain each classification. Be prepared to share your responses with the class.
• Google Docs• Your school’s registration system• Microsoft Project (https://www.microsoft.com/en-us/microsoft-365/project/
project-management-software)• AutoCAD (http://www.autodesk.com/products/autocad/overview)• Evernote (http://www.evernote.com)
ComputerSoftware A19
applications, especially in terms of managing them. The main drawbacks to cloud-based software are the need to have an Internet connection and potential security vulnerabilities. As Internet access becomes more ubiq-uitous, we expect the use of cloud-based applications to grow.
App Stores
The rise of application stores is an interesting development in the world of computer applications. These “app stores” provide a relatively easy way to research, purchase, and install application software. App stores are primarily organized by companies that want to promote the use of their mobile operating systems. The most popular app store is Apple’s App Store. Others include Google Play, Amazon App Store, and Windows App Store. There are literally millions of applications in these stores. Apple’s App Store has more than 2,200,000 applications, while the Google Play app store includes more than 3,000,000 apps. App stores are widely used. Between Apple’s App Store and Google Play, there were just over 200 billion downloads in 2019 (Statista 2021).
The rise of app stores illustrates the importance of application software. The use-fulness of a computer, particularly tablets and smartphones, is driven by the breadth and quality of the application software that it can run. Without useful, usable appli-cations, a computer is little more than an expensive brick. Companies such as Apple and Google know this, so they provide an easy way to find and acquire applications for devices running their operating systems (iOS and Android, respectively). App stores have also promoted creativity by giving small developers a way to distribute their applications.
We need to make one final comment on app stores. Not all programs in an app store are application software. Many of the programs available in an app store are actually better classified as utility software. Backup software is just one example.
L E A R N I N G A C T I V I T Y B . 4
FindanAppVisit one of the app stores listed below. Find an application in each of the following categories. Briefly describe each application and list the price and the app store in which you found it.
App Category• Personal entertainment• General-purpose business• Industry specific (vertical)
App Stores• http://www.apple.com/app-store/• https://play.google.com/store• https://www.microsoft.com/en-us/store/apps/windows
A20 Appendix B
Summary
This appendix provided you with more information regarding computer software. Here are the main points discussed in this appendix:
• Software can be divided into two major categories: system software and application software.
• System software controls the operation of the computer’s hardware and provides a platform for operating application software.
• Application software assists users in performing some specific task using a computer.
• Operating systems provide a platform for running application software; providing networking functions; and managing users, programs, hard-ware, files, and memory.
• Utilities are small programs that perform computer management tasks.• Commonly used utilities include file compression and archiving, data
backup, antimalware (e.g., antivirus and antispyware), system repair, sys-tem migration, and file synchronization.
• Application software may be classified along four dimensions: (1) busi-ness or personal-use software, (2) general productivity or special- purpose software, (3) horizontal- or vertical-market software, and (4) locally installed or cloud-based software.
L E A R N I N G A C T I V I T Y B . 5
AppUsageWhile mobile phones are useful for making voice calls, most of us use our mobile phones for other purposes. As discussed earlier, software applications, or apps, give smartphones the ability to entertain us, keep us up-to-date on the news, take photos, get directions, and so much more. According to a 2017 report (Perez 2017), the average user uses 9 apps per day. However, in the United States, users have an average of around 90 apps on their phones. It is not unusual for a user to download an app, use it once, then forget it’s there. As you might imagine, app developers are very interested in what makes users keep using or abandon apps. For this learning activity, think about your own app use and answer the following questions. Be prepared to discuss your answers in class.
1. What apps do you use the most?2. How much time do you spend on these apps?3. Have you ever deleted an app after only a few uses? If so, why didn’t you
keep using the app?4. Have you ever downloaded an app and only used it once or twice and then
forgot it was there? If so, why didn’t you delete it?5. What are the main differences between the apps you use and those you
abandon? How do they differ with respect to usefulness and usability? Have you noticed other differences?
ComputerSoftware A21
• “App stores” are online repositories of applications for specific operating systems, which are usually, but not always, mobile operating systems.
• App stores are important to mobile operating systems companies because they facilitate finding and acquiring application software, which is critical to the usefulness of a mobile device.
Review Questions
1. Define the term software. 2. Name and briefly describe the two main categories of software. 3. Describe the relationship between system software and application
software. 4. Name and briefly describe the two categories of system software. 5. Name the main functions of an operating system. 6. What is the purpose of the operating system kernel? 7. Name three popular personal computer operating systems. 8. Name and briefly describe six examples of utility software. 9. Briefly describe four dimensions that can be used to classify application
software. 10. What are “app stores”? Name three app stores related to mobile operating
systems.
Reflection Questions
1. What is the most important thing you learned in this appendix? Why is it important?
2. What topics are unclear? What about them is unclear? 3. What relationships do you see between what you learned in this appendix
and what you learned in other parts of the text? 4. Why can system software be considered a “necessary evil”? 5. Explain why individual preferences are important when choosing an
operating system. 6. Explain why the choice of application software is important to the choice
of an operating system. 7. Some utilities have been added to operating systems (such as the disk
defragmenting software described in the text). Why would operating systems publishers add utilities to their operating systems?
8. Choose five software applications you use frequently. (Your instructor may give you specific applications.) Use the four dimensions discussed in the text to classify each application.
9. What are the pros and cons of vertical-market software when compared to horizontal-market software?
10. When Android phones were introduced, proponents of Apple’s mobile devices sometimes cited the large number of applications in the App
A22 Appendix B
Store as a reason to adopt the iPhone rather than an Android-based phone. (There were far fewer apps for Android then, although that situation has changed.) Do you think the number of available apps is a reason to adopt a particular mobile operating system? Explain your answer.
References
Dogtiev, A. 2018. “App Download and Usage Statistics.” Business of Apps, updated January 9. http://www.businessofapps.com/data/app-statistics/#2.
Perez, S. 2017. “Report: Smartphone Owners Are Using 9 Apps per Day, 30 per Month.” Tech Crunch, May 4. https://techcrunch.com/2017/05/04/report-smart phone-owners-are-using-9-apps-per-day-30-per-month/.
Statista. 2021. “Number of Mobile App Downloads Worldwide from 2016 to 2019 (in billions).” Statistics Portal, n.d. https://www.statista.com/statistics/271644/worldwide-free-and-paid-mobile-app-store-downloads/.
Glossary
Application software: Computer programs and procedures necessary for carrying out some specific task.
Horizontal-market software: Application software that can be used across a wide range of different industries.
Kernel: A main component of an operating system that directly controls a computer’s hardware and access to that hardware.
Operating system: Computer programs and data responsible for managing a comput-er’s hardware resources and providing a platform for the operation of application software.
Software: An organized set of data and instructions that governs the operation of a computer.
System software: Computer software that controls the operation of the computer and provides a platform on which application software operates.
Utility software: Small programs that perform tasks related to the management of a computer.
Vertical-market software: Application software that is customized for use in a particu-lar industry.
Appendix C
Access FundamentalsLearning Objectives
By reading and completing the activities in this appendix, you will be able to:
• Given a database logical schema, create a database in Microsoft Access, including the following:
• • Creating tables, fields, and a primary key• • Establishing relationships between tables
• Add records to a table
Appendix Outline
• Introduction• Creating a Database in Access• Creating Tables• Creating Relationships• Populating Tables with Data
Introduction
In this appendix, we will help you learn how to create and populate a database using Microsoft Access. While most of you will probably never create large databases as a major part of your jobs, it is useful to know how to create small databases. As dis-cussed in Chapter 5, using a database management system (such as Access) to store some types of data can be very useful. As a result, being able to create simple data-bases may be a handy skill in the future. Fortunately, personal-level database man-agement systems, such as Access, make it relatively easy to create a database.
Once you have a good database design, you need to be able to do a few key things when creating the database:
• Create tables• Create fields within tables• Choose the proper data type for each field (e.g., text, numeric, date/
time)• Establish relationships among tables
A24 Appendix C
Once the database is created, you will also need to know how to add records to the tables that make up the database.
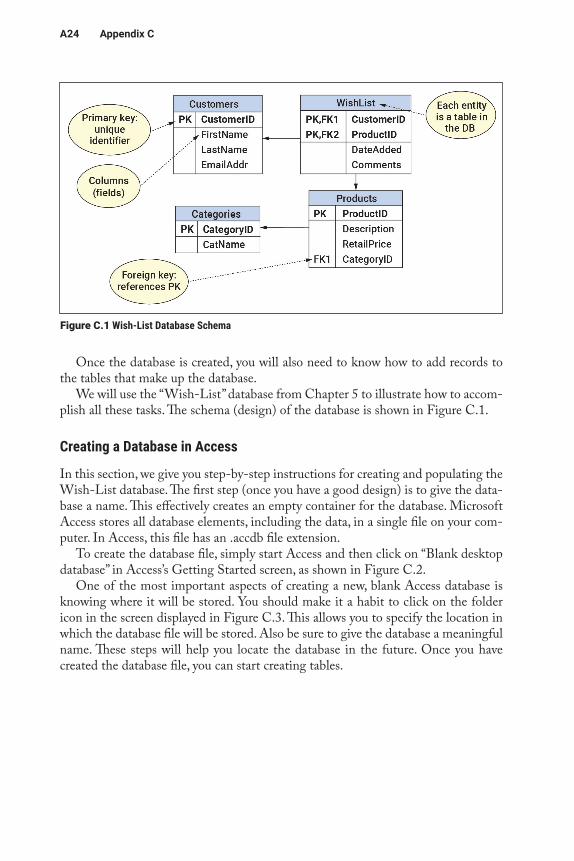
We will use the “Wish-List” database from Chapter 5 to illustrate how to accom-plish all these tasks. The schema (design) of the database is shown in Figure C.1.
Creating a Database in Access
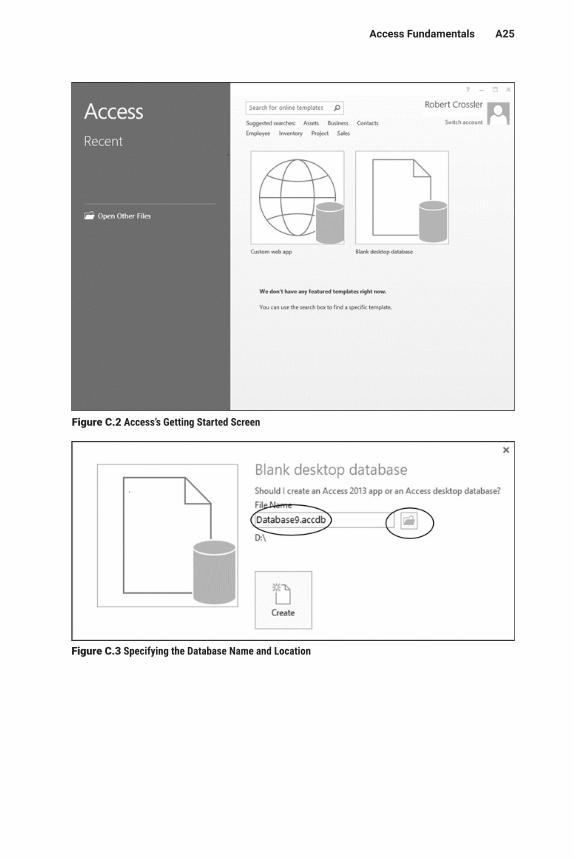
In this section, we give you step-by-step instructions for creating and populating the Wish-List database. The first step (once you have a good design) is to give the data-base a name. This effectively creates an empty container for the database. Microsoft Access stores all database elements, including the data, in a single file on your com-puter. In Access, this file has an .accdb file extension.
To create the database file, simply start Access and then click on “Blank desktop database” in Access’s Getting Started screen, as shown in Figure C.2.
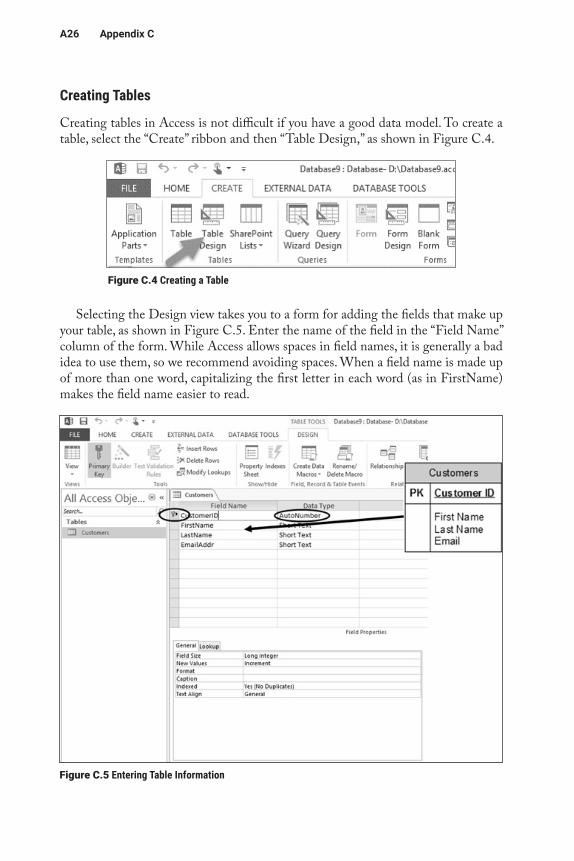
One of the most important aspects of creating a new, blank Access database is knowing where it will be stored. You should make it a habit to click on the folder icon in the screen displayed in Figure C.3. This allows you to specify the location in which the database file will be stored. Also be sure to give the database a meaningful name. These steps will help you locate the database in the future. Once you have created the database file, you can start creating tables.
Figure C.1 Wish-List Database Schema
AccessFundamentals A25
Figure C.2 Access’s Getting Started Screen
Figure C.3 Specifying the Database Name and Location
A26 Appendix C
Creating Tables
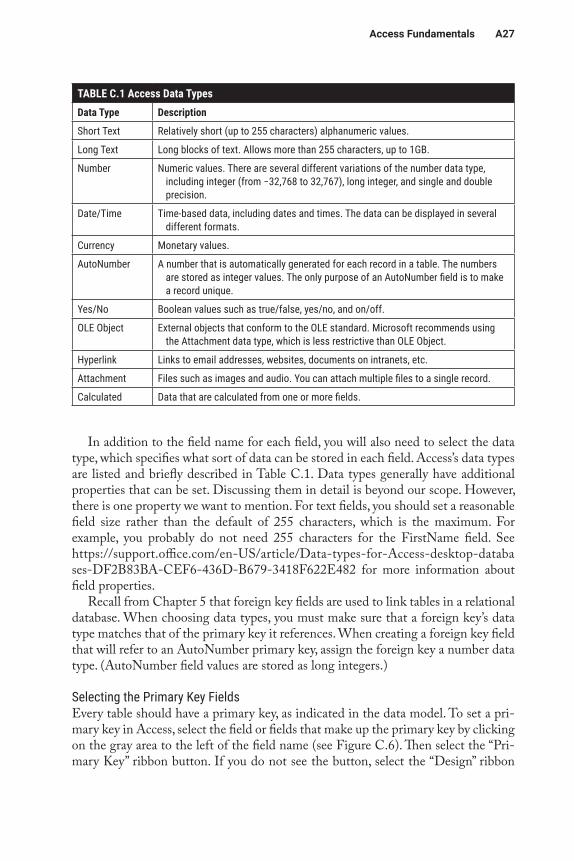
Creating tables in Access is not difficult if you have a good data model. To create a table, select the “Create” ribbon and then “Table Design,” as shown in Figure C.4.
Selecting the Design view takes you to a form for adding the fields that make up your table, as shown in Figure C.5. Enter the name of the field in the “Field Name” column of the form. While Access allows spaces in field names, it is generally a bad idea to use them, so we recommend avoiding spaces. When a field name is made up of more than one word, capitalizing the first letter in each word (as in FirstName) makes the field name easier to read.
Figure C.4 Creating a Table
Figure C.5 Entering Table Information
AccessFundamentals A27
In addition to the field name for each field, you will also need to select the data type, which specifies what sort of data can be stored in each field. Access’s data types are listed and briefly described in Table C.1. Data types generally have additional properties that can be set. Discussing them in detail is beyond our scope. However, there is one property we want to mention. For text fields, you should set a reasonable field size rather than the default of 255 characters, which is the maximum. For example, you probably do not need 255 characters for the FirstName field. See https://support.office.com/en-US/article/Data-types-for-Access-desktop-databa ses-DF2B83BA-CEF6-436D-B679-3418F622E482 for more information about field properties.
Recall from Chapter 5 that foreign key fields are used to link tables in a relational database. When choosing data types, you must make sure that a foreign key’s data type matches that of the primary key it references. When creating a foreign key field that will refer to an AutoNumber primary key, assign the foreign key a number data type. (AutoNumber field values are stored as long integers.)
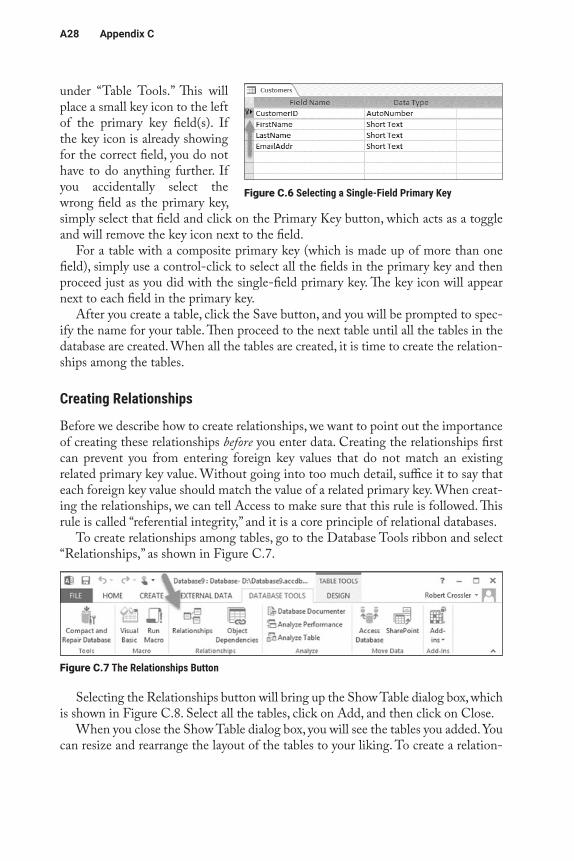
Selecting the Primary Key FieldsEvery table should have a primary key, as indicated in the data model. To set a pri-mary key in Access, select the field or fields that make up the primary key by clicking on the gray area to the left of the field name (see Figure C.6). Then select the “Pri-mary Key” ribbon button. If you do not see the button, select the “Design” ribbon
TABLE C.1 Access Data TypesData Type Description
Short Text Relatively short (up to 255 characters) alphanumeric values.
Long Text Long blocks of text. Allows more than 255 characters, up to 1GB.
Number Numeric values. There are several different variations of the number data type, including integer (from −32,768 to 32,767), long integer, and single and double precision.
Date/Time Time-based data, including dates and times. The data can be displayed in several different formats.
Currency Monetary values.
AutoNumber A number that is automatically generated for each record in a table. The numbers are stored as integer values. The only purpose of an AutoNumber field is to make a record unique.
Yes/No Boolean values such as true/false, yes/no, and on/off.
OLE Object External objects that conform to the OLE standard. Microsoft recommends using the Attachment data type, which is less restrictive than OLE Object.
Hyperlink Links to email addresses, websites, documents on intranets, etc.
Attachment Files such as images and audio. You can attach multiple files to a single record.
Calculated Data that are calculated from one or more fields.
A28 Appendix C
under “Table Tools.” This will place a small key icon to the left of the primary key field(s). If the key icon is already showing for the correct field, you do not have to do anything further. If you accidentally select the wrong field as the primary key, simply select that field and click on the Primary Key button, which acts as a toggle and will remove the key icon next to the field.
For a table with a composite primary key (which is made up of more than one field), simply use a control-click to select all the fields in the primary key and then proceed just as you did with the single-field primary key. The key icon will appear next to each field in the primary key.
After you create a table, click the Save button, and you will be prompted to spec-ify the name for your table. Then proceed to the next table until all the tables in the database are created. When all the tables are created, it is time to create the relation-ships among the tables.
Creating Relationships
Before we describe how to create relationships, we want to point out the importance of creating these relationships before you enter data. Creating the relationships first can prevent you from entering foreign key values that do not match an existing related primary key value. Without going into too much detail, suffice it to say that each foreign key value should match the value of a related primary key. When creat-ing the relationships, we can tell Access to make sure that this rule is followed. This rule is called “referential integrity,” and it is a core principle of relational databases.
To create relationships among tables, go to the Database Tools ribbon and select “Relationships,” as shown in Figure C.7.
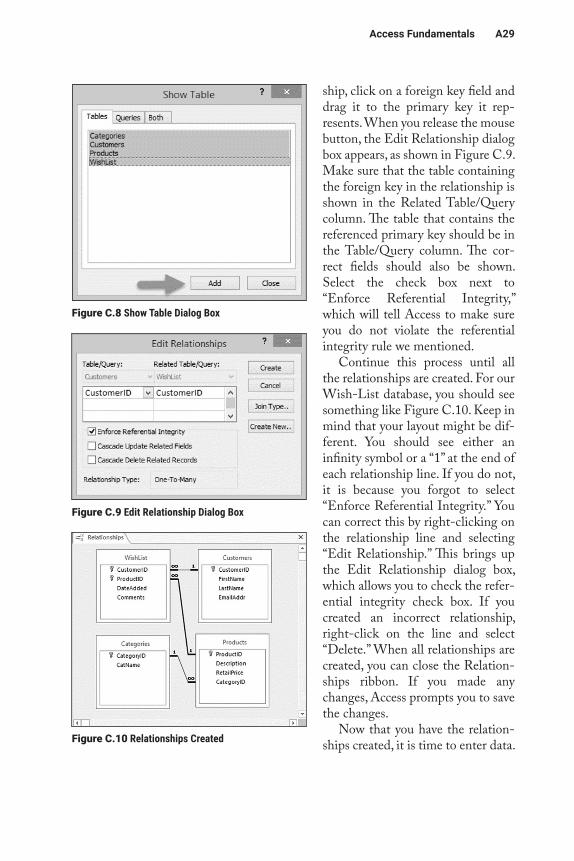
Selecting the Relationships button will bring up the Show Table dialog box, which is shown in Figure C.8. Select all the tables, click on Add, and then click on Close.
When you close the Show Table dialog box, you will see the tables you added. You can resize and rearrange the layout of the tables to your liking. To create a relation-
Figure C.6 Selecting a Single-Field Primary Key
Figure C.7 The Relationships Button
AccessFundamentals A29
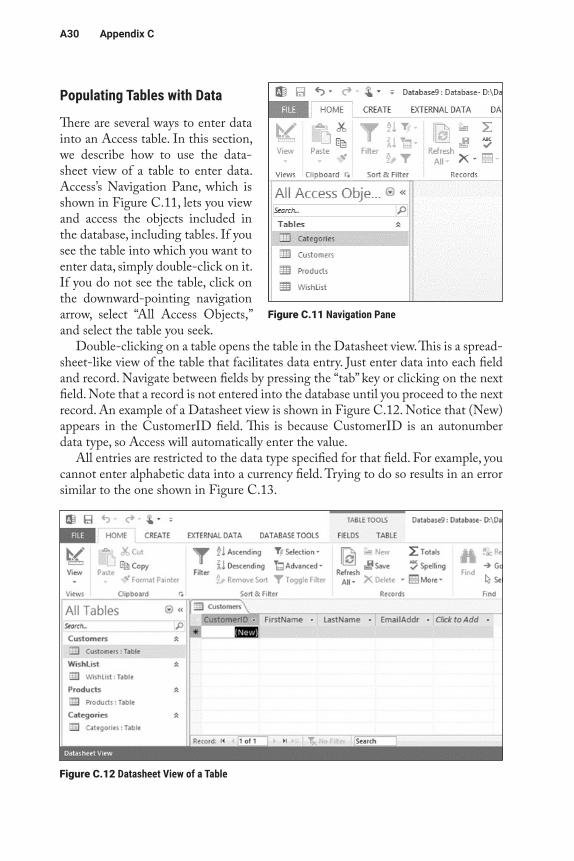
ship, click on a foreign key field and drag it to the primary key it rep-resents. When you release the mouse button, the Edit Relationship dialog box appears, as shown in Figure C.9. Make sure that the table containing the foreign key in the relationship is shown in the Related Table/Query column. The table that contains the referenced primary key should be in the Table/Query column. The cor-rect fields should also be shown. Select the check box next to “Enforce Referential Integrity,” which will tell Access to make sure you do not violate the referential integrity rule we mentioned.
Continue this process until all the relationships are created. For our Wish-List database, you should see something like Figure C.10. Keep in mind that your layout might be dif-ferent. You should see either an infinity symbol or a “1” at the end of each relationship line. If you do not, it is because you forgot to select “Enforce Referential Integrity.” You can correct this by right-clicking on the relationship line and selecting “Edit Relationship.” This brings up the Edit Relationship dialog box, which allows you to check the refer-ential integrity check box. If you created an incorrect relationship, right-click on the line and select “Delete.” When all relationships are created, you can close the Relation-ships ribbon. If you made any changes, Access prompts you to save the changes.
Now that you have the relation-ships created, it is time to enter data.
Figure C.8 Show Table Dialog Box
Figure C.9 Edit Relationship Dialog Box
Figure C.10 Relationships Created
A30 Appendix C
Populating Tables with Data
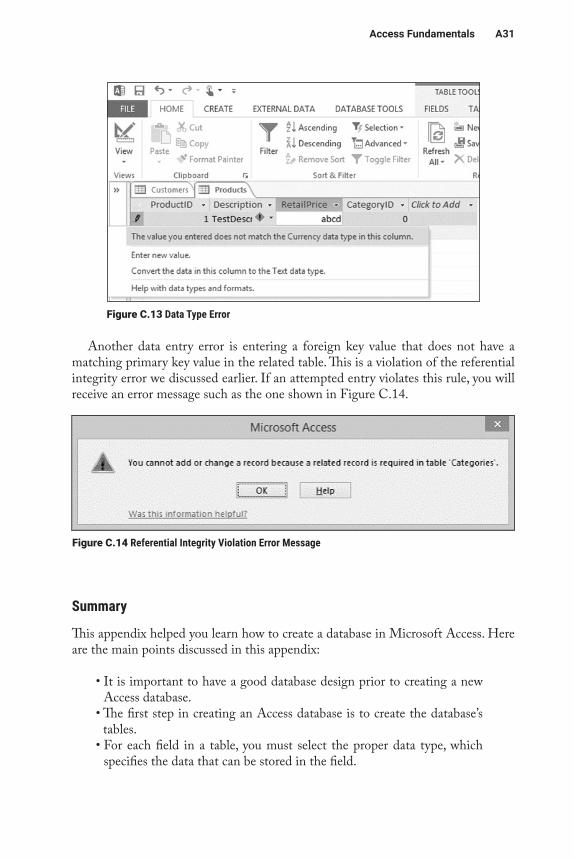
There are several ways to enter data into an Access table. In this section, we describe how to use the data-sheet view of a table to enter data. Access’s Navigation Pane, which is shown in Figure C.11, lets you view and access the objects included in the database, including tables. If you see the table into which you want to enter data, simply double-click on it. If you do not see the table, click on the downward-pointing navigation arrow, select “All Access Objects,” and select the table you seek.
Double-clicking on a table opens the table in the Datasheet view. This is a spread-sheet-like view of the table that facilitates data entry. Just enter data into each field and record. Navigate between fields by pressing the “tab” key or clicking on the next field. Note that a record is not entered into the database until you proceed to the next record. An example of a Datasheet view is shown in Figure C.12. Notice that (New) appears in the CustomerID field. This is because CustomerID is an autonumber data type, so Access will automatically enter the value.
All entries are restricted to the data type specified for that field. For example, you cannot enter alphabetic data into a currency field. Trying to do so results in an error similar to the one shown in Figure C.13.
Figure C.11 Navigation Pane
Figure C.12 Datasheet View of a Table
AccessFundamentals A31
Another data entry error is entering a foreign key value that does not have a matching primary key value in the related table. This is a violation of the referential integrity error we discussed earlier. If an attempted entry violates this rule, you will receive an error message such as the one shown in Figure C.14.
Summary
This appendix helped you learn how to create a database in Microsoft Access. Here are the main points discussed in this appendix:
• It is important to have a good database design prior to creating a new Access database.
• The first step in creating an Access database is to create the database’s tables.
• For each field in a table, you must select the proper data type, which specifies the data that can be stored in the field.
Figure C.13 Data Type Error
Figure C.14 Referential Integrity Violation Error Message
A32 Appendix C
• Each table should have a primary key. The primary key may be made up of one or more fields. When a primary key is made up of more than one field, it is called a composite primary key.
• It is important to create relationships among tables before entering data into the tables.
• The Datasheet view of a table allows you to enter data into the table.
Additional Learning Activities
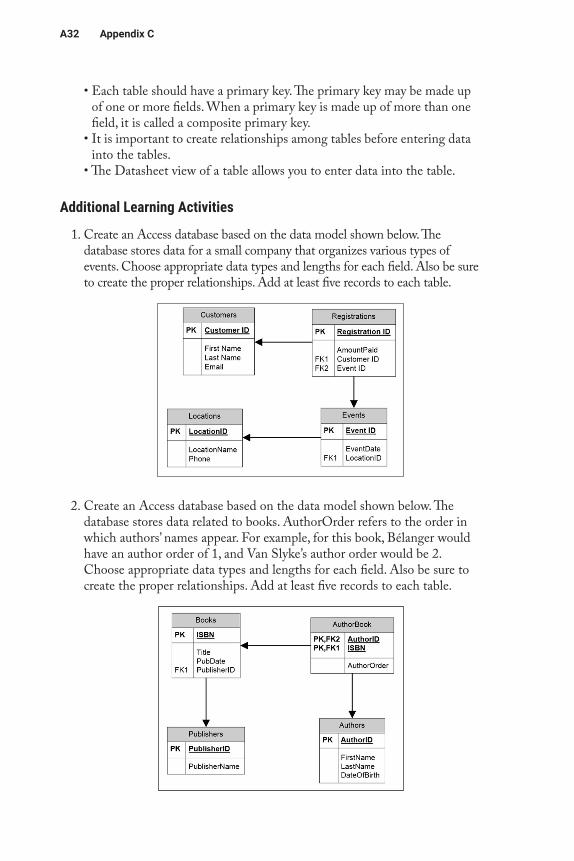
1. Create an Access database based on the data model shown below. The database stores data for a small company that organizes various types of events. Choose appropriate data types and lengths for each field. Also be sure to create the proper relationships. Add at least five records to each table.
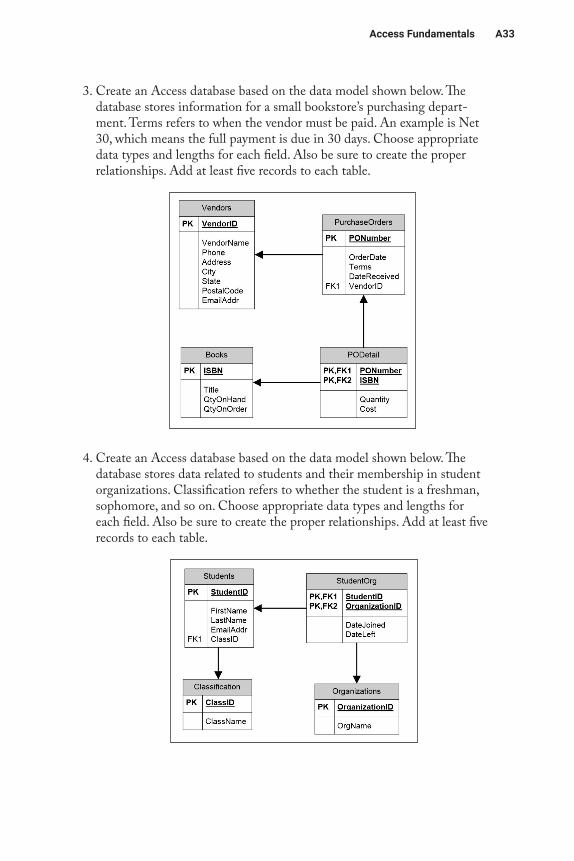
2. Create an Access database based on the data model shown below. The database stores data related to books. AuthorOrder refers to the order in which authors’ names appear. For example, for this book, Bélanger would have an author order of 1, and Van Slyke’s author order would be 2. Choose appropriate data types and lengths for each field. Also be sure to create the proper relationships. Add at least five records to each table.
AccessFundamentals A33
3. Create an Access database based on the data model shown below. The database stores information for a small bookstore’s purchasing depart-ment. Terms refers to when the vendor must be paid. An example is Net 30, which means the full payment is due in 30 days. Choose appropriate data types and lengths for each field. Also be sure to create the proper relationships. Add at least five records to each table.
4. Create an Access database based on the data model shown below. The database stores data related to students and their membership in student organizations. Classification refers to whether the student is a freshman, sophomore, and so on. Choose appropriate data types and lengths for each field. Also be sure to create the proper relationships. Add at least five records to each table.

Appendix D
Advanced AccessLearning Objectives
By reading and completing the activities in this appendix, you will be able to:
• Retrieve specified records from a database using Query by Example• Create simple forms based on a specification• Create simple reports based on a specification
Appendix Outline
• Introduction• Database Queries• Query by Example (QBE)• Forms• Reports
Introduction
In Appendix C, you learned how to create and populate a Microsoft Access database. In this appendix, we help you learn how to retrieve data using queries and how to create simple forms and reports. Forms are used to enter records into a database and to retrieve and display small amounts of data. Reports also display data but work better than forms for larger amounts of data.
Database Queries
A query is an operation that retrieves specified records from a database. For example, you could retrieve all records related to a particular order from an order processing database. You specify which records to retrieve based on criteria related to values of fields within one or more tables. These criteria use operators such as equals (=), greater than (>), and less than (<). More complex criteria use logical operators such as “and” and “or.”
Creating a query requires specifying three main things:
• The fields to retrieve• The tables from which to retrieve the data• Which records to include
A36 Appendix D
The first two items (fields and tables) make up what database experts call projec-tion, which is simply specifying which fields to include in a query. Since fields are contained in tables, projection also includes specifying tables. (You can’t really spec-ify fields without specifying tables.) Specifying which records to include is called selection in database-speak. There are two other important query operations: sorting and joining. We will discuss them later.
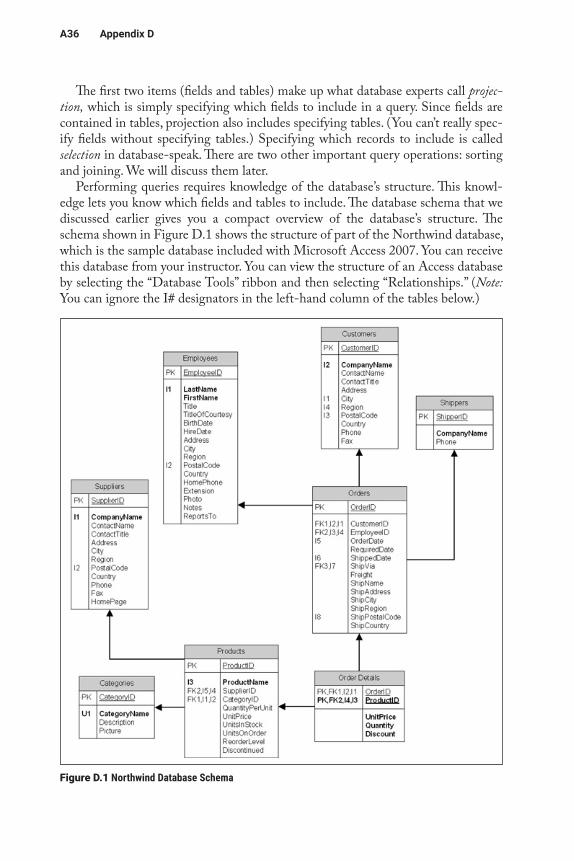
Performing queries requires knowledge of the database’s structure. This knowl-edge lets you know which fields and tables to include. The database schema that we discussed earlier gives you a compact overview of the database’s structure. The schema shown in Figure D.1 shows the structure of part of the Northwind database, which is the sample database included with Microsoft Access 2007. You can receive this database from your instructor. You can view the structure of an Access database by selecting the “Database Tools” ribbon and then selecting “Relationships.” (Note: You can ignore the I# designators in the left-hand column of the tables below.)
Figure D.1 Northwind Database Schema
AdvancedAccess A37
Query by Example (QBE)
Relational database management systems all include one or more query languages. A query language is a method and set of rules for creating queries. Access includes two query languages: Structured Query Language (SQL) and Query by Example (QBE). SQL is a very powerful language that is widely used for software applica-tions that interact with databases. Writing SQL queries is a specialized skill that is beyond our scope. QBE was designed to be an easier way to specify queries. While QBE is less powerful than SQL, it is easier to understand and is sufficient for many users. Because of this, we focus on QBE.
It is easier to understand QBE concepts if we work through an example. Our goal is to create a query that shows the following for all customers who are in the United Kingdom or Germany:
• CustomerID• CompanyName• City• Region• PostalCode• Country
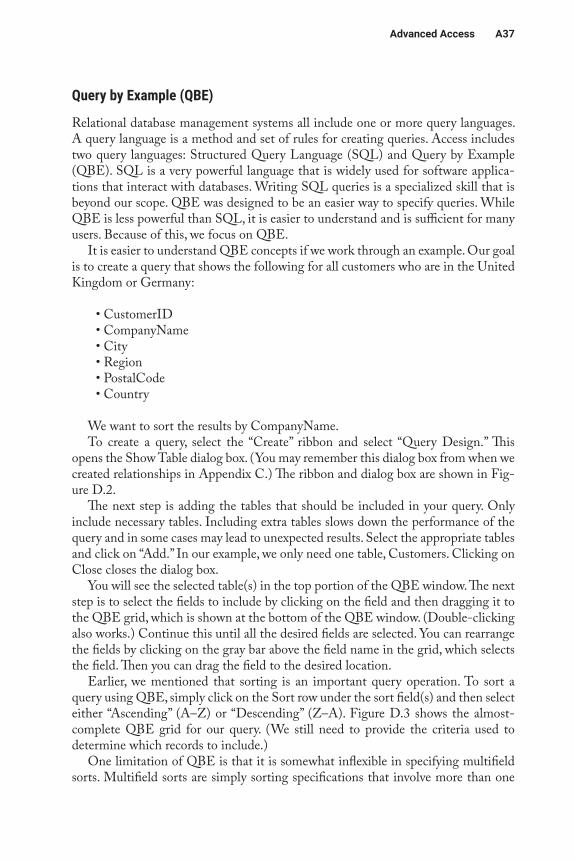
We want to sort the results by CompanyName.To create a query, select the “Create” ribbon and select “Query Design.” This
opens the Show Table dialog box. (You may remember this dialog box from when we created relationships in Appendix C.) The ribbon and dialog box are shown in Fig-ure D.2.
The next step is adding the tables that should be included in your query. Only include necessary tables. Including extra tables slows down the performance of the query and in some cases may lead to unexpected results. Select the appropriate tables and click on “Add.” In our example, we only need one table, Customers. Clicking on Close closes the dialog box.
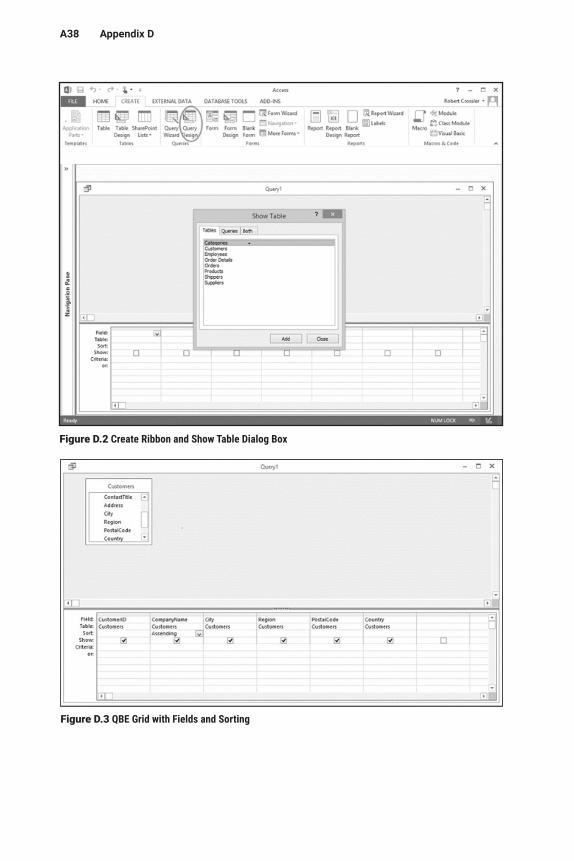
You will see the selected table(s) in the top portion of the QBE window. The next step is to select the fields to include by clicking on the field and then dragging it to the QBE grid, which is shown at the bottom of the QBE window. (Double-clicking also works.) Continue this until all the desired fields are selected. You can rearrange the fields by clicking on the gray bar above the field name in the grid, which selects the field. Then you can drag the field to the desired location.
Earlier, we mentioned that sorting is an important query operation. To sort a query using QBE, simply click on the Sort row under the sort field(s) and then select either “Ascending” (A–Z) or “Descending” (Z–A). Figure D.3 shows the almost- complete QBE grid for our query. (We still need to provide the criteria used to determine which records to include.)
One limitation of QBE is that it is somewhat inflexible in specifying multifield sorts. Multifield sorts are simply sorting specifications that involve more than one
A38 Appendix D
Figure D.2 Create Ribbon and Show Table Dialog Box
Figure D.3 QBE Grid with Fields and Sorting
AdvancedAccess A39
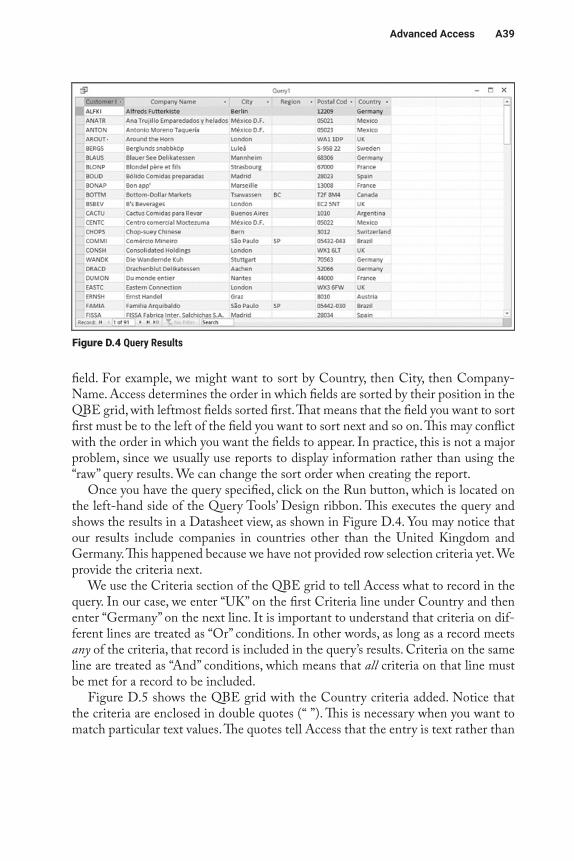
field. For example, we might want to sort by Country, then City, then Company-Name. Access determines the order in which fields are sorted by their position in the QBE grid, with leftmost fields sorted first. That means that the field you want to sort first must be to the left of the field you want to sort next and so on. This may conflict with the order in which you want the fields to appear. In practice, this is not a major problem, since we usually use reports to display information rather than using the “raw” query results. We can change the sort order when creating the report.
Once you have the query specified, click on the Run button, which is located on the left-hand side of the Query Tools’ Design ribbon. This executes the query and shows the results in a Datasheet view, as shown in Figure D.4. You may notice that our results include companies in countries other than the United Kingdom and Germany. This happened because we have not provided row selection criteria yet. We provide the criteria next.
We use the Criteria section of the QBE grid to tell Access what to record in the query. In our case, we enter “UK” on the first Criteria line under Country and then enter “Germany” on the next line. It is important to understand that criteria on dif-ferent lines are treated as “Or” conditions. In other words, as long as a record meets any of the criteria, that record is included in the query’s results. Criteria on the same line are treated as “And” conditions, which means that all criteria on that line must be met for a record to be included.
Figure D.5 shows the QBE grid with the Country criteria added. Notice that the criteria are enclosed in double quotes (“ ”). This is necessary when you want to match particular text values. The quotes tell Access that the entry is text rather than
Figure D.4 Query Results
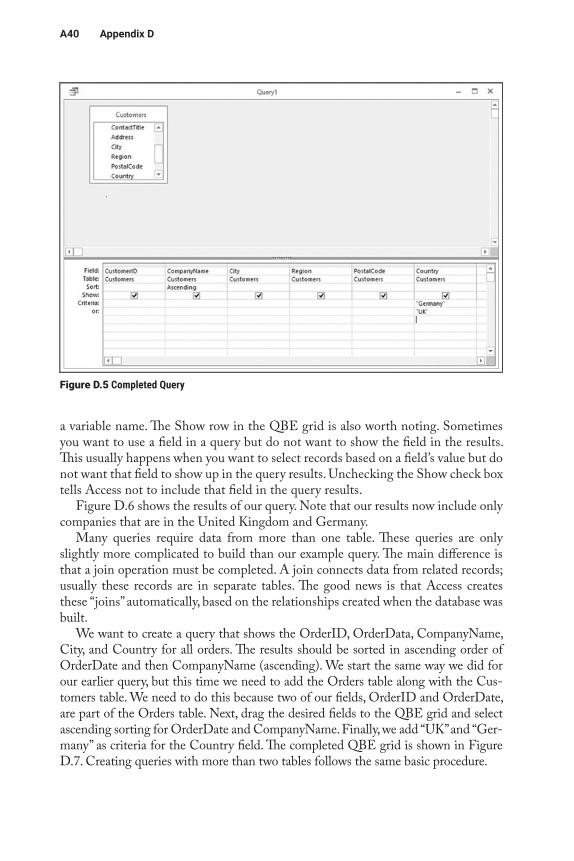
A40 Appendix D
a variable name. The Show row in the QBE grid is also worth noting. Sometimes you want to use a field in a query but do not want to show the field in the results. This usually happens when you want to select records based on a field’s value but do not want that field to show up in the query results. Unchecking the Show check box tells Access not to include that field in the query results.
Figure D.6 shows the results of our query. Note that our results now include only companies that are in the United Kingdom and Germany.
Many queries require data from more than one table. These queries are only slightly more complicated to build than our example query. The main difference is that a join operation must be completed. A join connects data from related records; usually these records are in separate tables. The good news is that Access creates these “joins” automatically, based on the relationships created when the database was built.
We want to create a query that shows the OrderID, OrderData, CompanyName, City, and Country for all orders. The results should be sorted in ascending order of OrderDate and then CompanyName (ascending). We start the same way we did for our earlier query, but this time we need to add the Orders table along with the Cus-tomers table. We need to do this because two of our fields, OrderID and OrderDate, are part of the Orders table. Next, drag the desired fields to the QBE grid and select ascending sorting for OrderDate and CompanyName. Finally, we add “UK” and “Ger-many” as criteria for the Country field. The completed QBE grid is shown in Figure D.7. Creating queries with more than two tables follows the same basic procedure.
Figure D.5 Completed Query
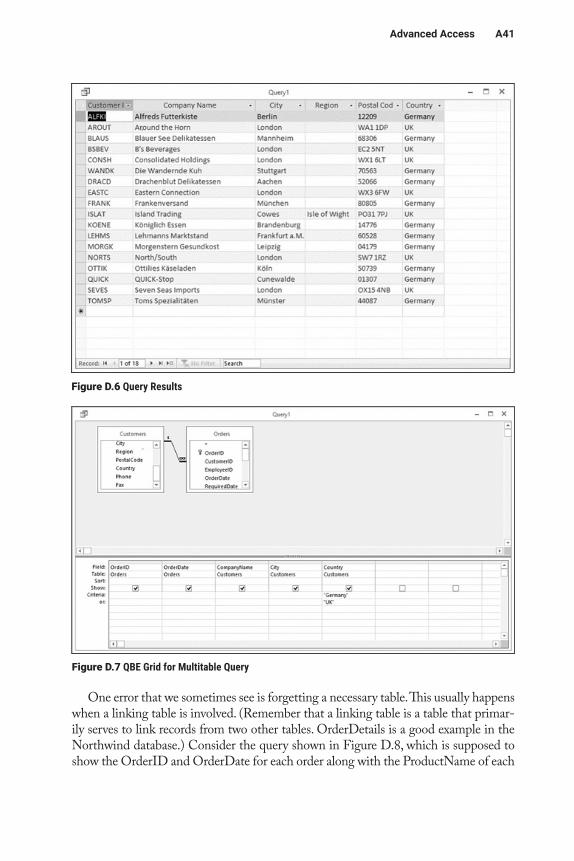
AdvancedAccess A41
One error that we sometimes see is forgetting a necessary table. This usually happens when a linking table is involved. (Remember that a linking table is a table that primar-ily serves to link records from two other tables. OrderDetails is a good example in the Northwind database.) Consider the query shown in Figure D.8, which is supposed to show the OrderID and OrderDate for each order along with the ProductName of each
Figure D.6 Query Results
Figure D.7 QBE Grid for Multitable Query
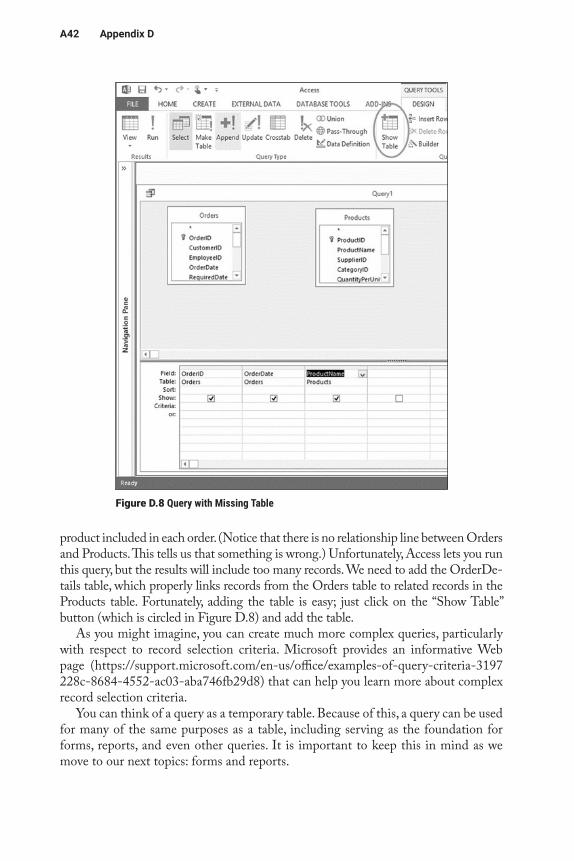
A42 Appendix D
product included in each order. (Notice that there is no relationship line between Orders and Products. This tells us that something is wrong.) Unfortunately, Access lets you run this query, but the results will include too many records. We need to add the OrderDe-tails table, which properly links records from the Orders table to related records in the Products table. Fortunately, adding the table is easy; just click on the “Show Table” button (which is circled in Figure D.8) and add the table.
As you might imagine, you can create much more complex queries, particularly with respect to record selection criteria. Microsoft provides an informative Web page (https://support.microsoft.com/en-us/office/examples-of-query-criteria-3197 228c-8684-4552-ac03-aba746fb29d8) that can help you learn more about complex record selection criteria.
You can think of a query as a temporary table. Because of this, a query can be used for many of the same purposes as a table, including serving as the foundation for forms, reports, and even other queries. It is important to keep this in mind as we move to our next topics: forms and reports.
Figure D.8 Query with Missing Table
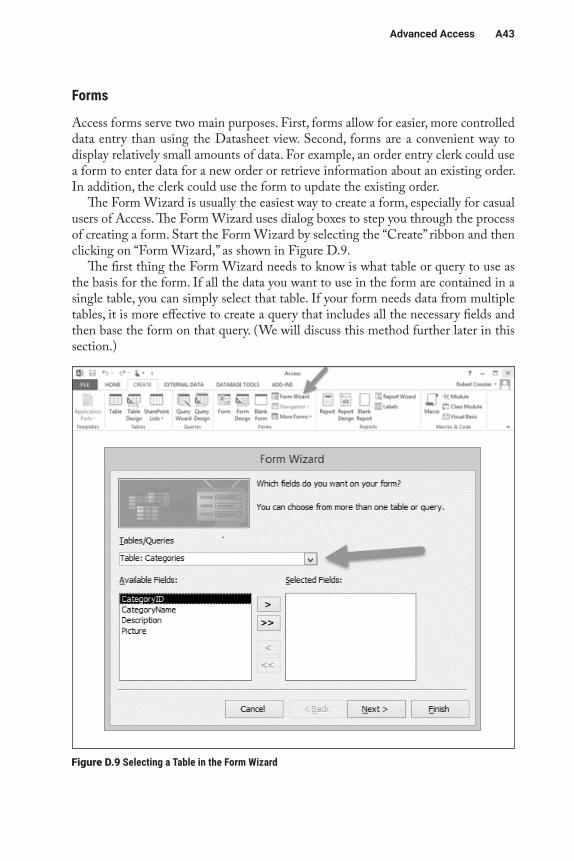
AdvancedAccess A43
Forms
Access forms serve two main purposes. First, forms allow for easier, more controlled data entry than using the Datasheet view. Second, forms are a convenient way to display relatively small amounts of data. For example, an order entry clerk could use a form to enter data for a new order or retrieve information about an existing order. In addition, the clerk could use the form to update the existing order.
The Form Wizard is usually the easiest way to create a form, especially for casual users of Access. The Form Wizard uses dialog boxes to step you through the process of creating a form. Start the Form Wizard by selecting the “Create” ribbon and then clicking on “Form Wizard,” as shown in Figure D.9.
The first thing the Form Wizard needs to know is what table or query to use as the basis for the form. If all the data you want to use in the form are contained in a single table, you can simply select that table. If your form needs data from multiple tables, it is more effective to create a query that includes all the necessary fields and then base the form on that query. (We will discuss this method further later in this section.)
Figure D.9 Selecting a Table in the Form Wizard
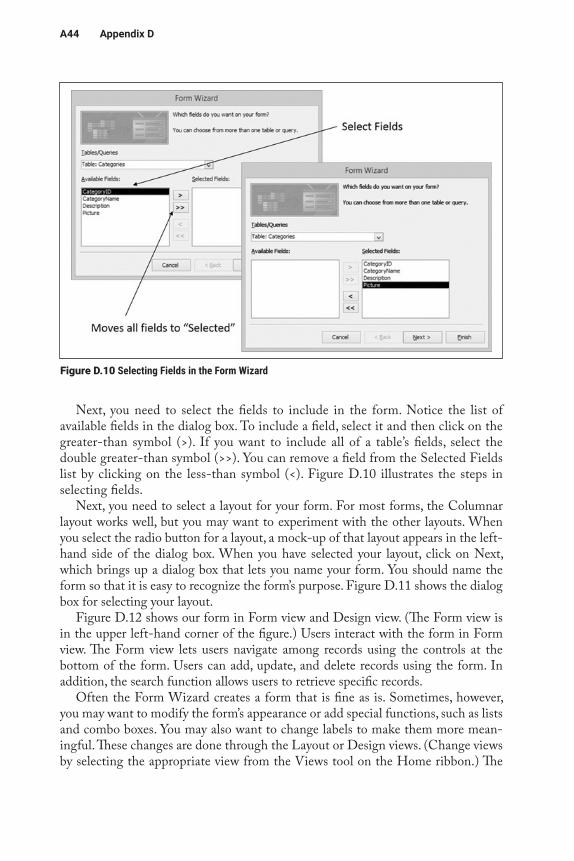
A44 Appendix D
Next, you need to select the fields to include in the form. Notice the list of available fields in the dialog box. To include a field, select it and then click on the greater- than symbol (>). If you want to include all of a table’s fields, select the double greater-than symbol (>>). You can remove a field from the Selected Fields list by clicking on the less-than symbol (<). Figure D.10 illustrates the steps in selecting fields.
Next, you need to select a layout for your form. For most forms, the Columnar layout works well, but you may want to experiment with the other layouts. When you select the radio button for a layout, a mock-up of that layout appears in the left-hand side of the dialog box. When you have selected your layout, click on Next, which brings up a dialog box that lets you name your form. You should name the form so that it is easy to recognize the form’s purpose. Figure D.11 shows the dialog box for selecting your layout.
Figure D.12 shows our form in Form view and Design view. (The Form view is in the upper left-hand corner of the figure.) Users interact with the form in Form view. The Form view lets users navigate among records using the controls at the bottom of the form. Users can add, update, and delete records using the form. In addition, the search function allows users to retrieve specific records.
Often the Form Wizard creates a form that is fine as is. Sometimes, however, you may want to modify the form’s appearance or add special functions, such as lists and combo boxes. You may also want to change labels to make them more mean-ingful. These changes are done through the Layout or Design views. (Change views by selecting the appropriate view from the Views tool on the Home ribbon.) The
Figure D.10 Selecting Fields in the Form Wizard
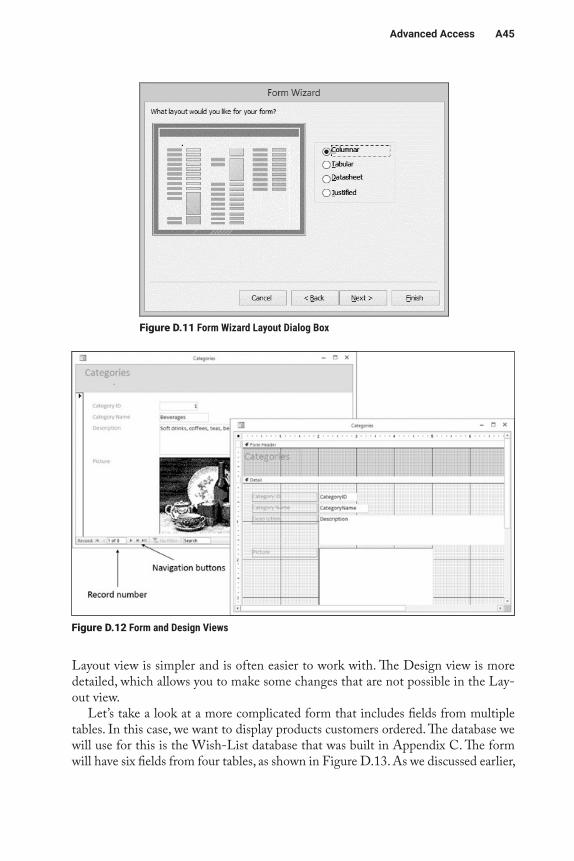
AdvancedAccess A45
Layout view is simpler and is often easier to work with. The Design view is more detailed, which allows you to make some changes that are not possible in the Lay-out view.
Let’s take a look at a more complicated form that includes fields from multiple tables. In this case, we want to display products customers ordered. The database we will use for this is the Wish-List database that was built in Appendix C. The form will have six fields from four tables, as shown in Figure D.13. As we discussed earlier,
Figure D.11 Form Wizard Layout Dialog Box
Figure D.12 Form and Design Views
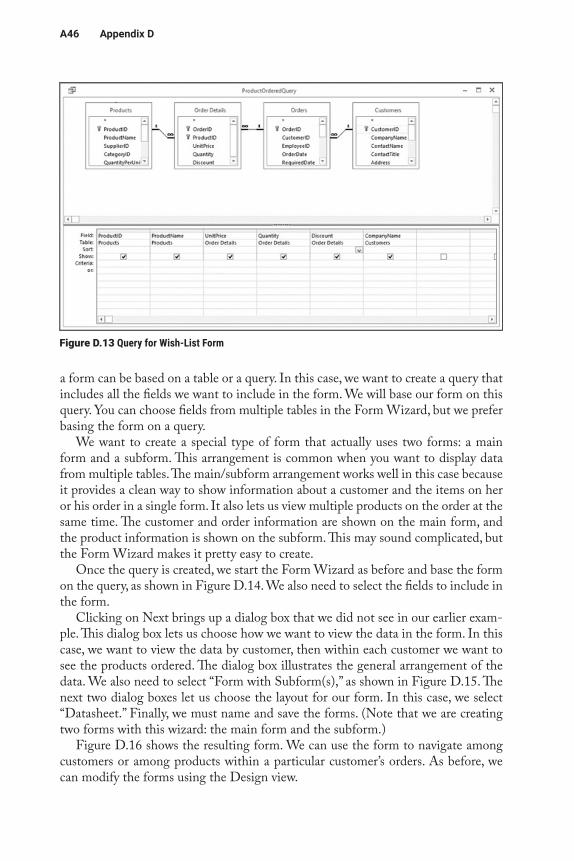
A46 Appendix D
a form can be based on a table or a query. In this case, we want to create a query that includes all the fields we want to include in the form. We will base our form on this query. You can choose fields from multiple tables in the Form Wizard, but we prefer basing the form on a query.
We want to create a special type of form that actually uses two forms: a main form and a subform. This arrangement is common when you want to display data from multiple tables. The main/subform arrangement works well in this case because it provides a clean way to show information about a customer and the items on her or his order in a single form. It also lets us view multiple products on the order at the same time. The customer and order information are shown on the main form, and the product information is shown on the subform. This may sound complicated, but the Form Wizard makes it pretty easy to create.
Once the query is created, we start the Form Wizard as before and base the form on the query, as shown in Figure D.14. We also need to select the fields to include in the form.
Clicking on Next brings up a dialog box that we did not see in our earlier exam-ple. This dialog box lets us choose how we want to view the data in the form. In this case, we want to view the data by customer, then within each customer we want to see the products ordered. The dialog box illustrates the general arrangement of the data. We also need to select “Form with Subform(s),” as shown in Figure D.15. The next two dialog boxes let us choose the layout for our form. In this case, we select “Datasheet.” Finally, we must name and save the forms. (Note that we are creating two forms with this wizard: the main form and the subform.)
Figure D.16 shows the resulting form. We can use the form to navigate among customers or among products within a particular customer’s orders. As before, we can modify the forms using the Design view.
Figure D.13 Query for Wish-List Form
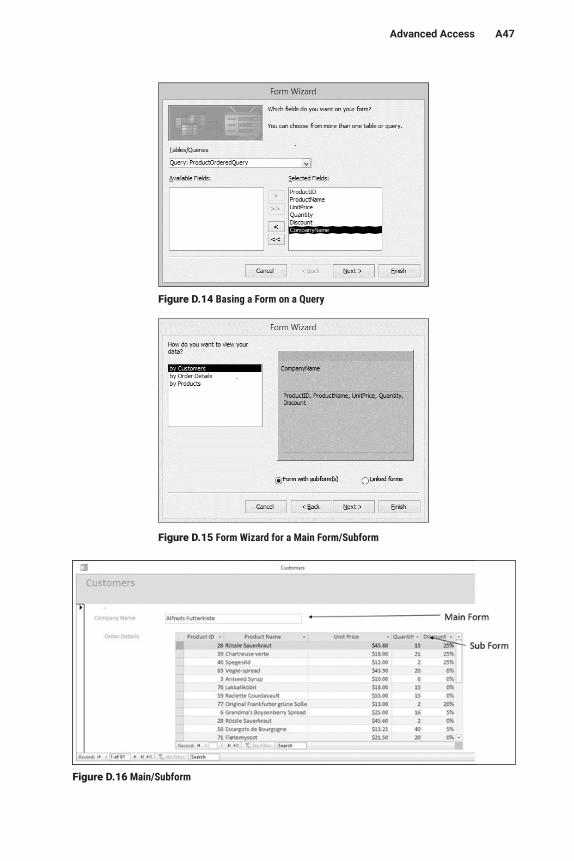
AdvancedAccess A47
Figure D.14 Basing a Form on a Query
Figure D.15 Form Wizard for a Main Form/Subform
Figure D.16 Main/Subform
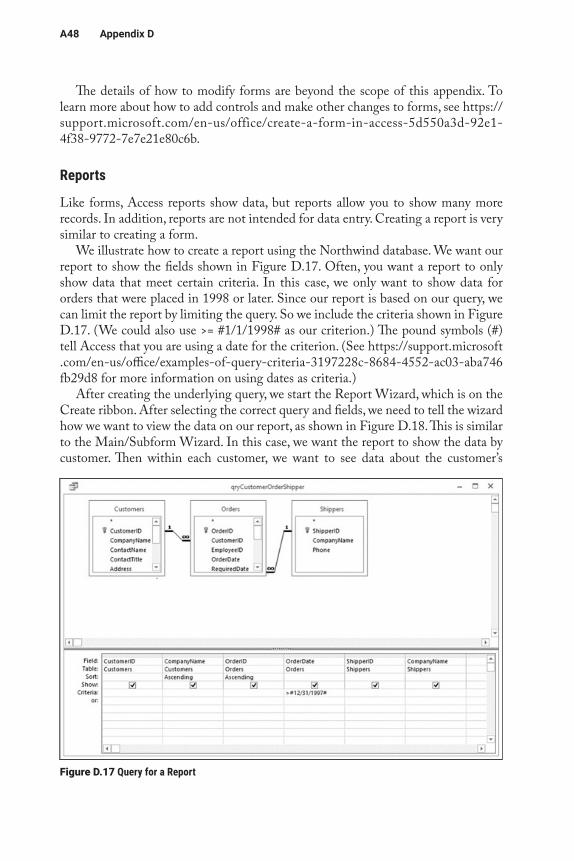
A48 Appendix D
The details of how to modify forms are beyond the scope of this appendix. To learn more about how to add controls and make other changes to forms, see https://support.microsoft.com/en-us/office/create-a-form-in-access-5d550a3d-92e1-4f38-9772-7e7e21e80c6b.
Reports
Like forms, Access reports show data, but reports allow you to show many more records. In addition, reports are not intended for data entry. Creating a report is very similar to creating a form.
We illustrate how to create a report using the Northwind database. We want our report to show the fields shown in Figure D.17. Often, you want a report to only show data that meet certain criteria. In this case, we only want to show data for orders that were placed in 1998 or later. Since our report is based on our query, we can limit the report by limiting the query. So we include the criteria shown in Figure D.17. (We could also use >= #1/1/1998# as our criterion.) The pound symbols (#) tell Access that you are using a date for the criterion. (See https://support.microsoft .com/en-us/office/examples-of-query-criteria-3197228c-8684-4552-ac03-aba746 fb29d8 for more information on using dates as criteria.)
After creating the underlying query, we start the Report Wizard, which is on the Create ribbon. After selecting the correct query and fields, we need to tell the wizard how we want to view the data on our report, as shown in Figure D.18. This is similar to the Main/Subform Wizard. In this case, we want the report to show the data by customer. Then within each customer, we want to see data about the customer’s
Figure D.17 Query for a Report
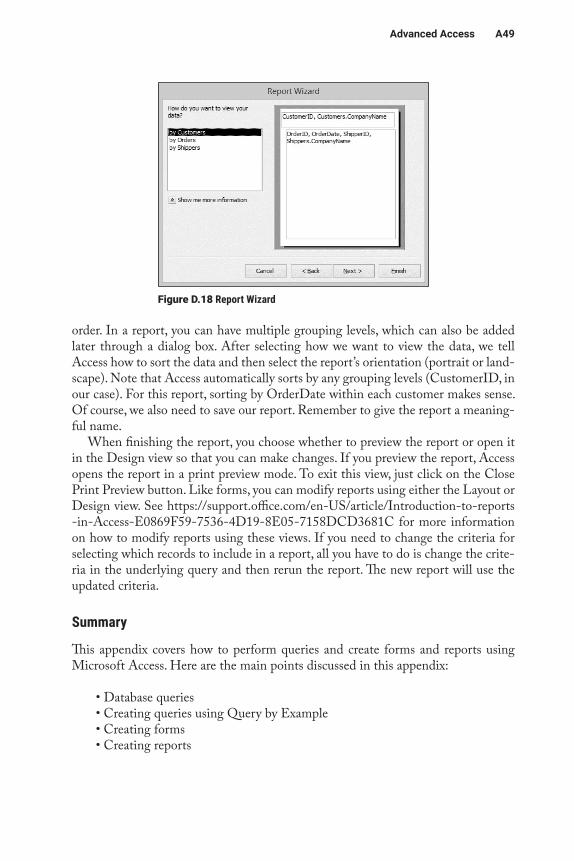
AdvancedAccess A49
order. In a report, you can have multiple grouping levels, which can also be added later through a dialog box. After selecting how we want to view the data, we tell Access how to sort the data and then select the report’s orientation (portrait or land-scape). Note that Access automatically sorts by any grouping levels (CustomerID, in our case). For this report, sorting by OrderDate within each customer makes sense. Of course, we also need to save our report. Remember to give the report a meaning-ful name.
When finishing the report, you choose whether to preview the report or open it in the Design view so that you can make changes. If you preview the report, Access opens the report in a print preview mode. To exit this view, just click on the Close Print Preview button. Like forms, you can modify reports using either the Layout or Design view. See https://support.office.com/en-US/article/Introduction-to-reports -in-Access-E0869F59-7536-4D19-8E05-7158DCD3681C for more information on how to modify reports using these views. If you need to change the criteria for selecting which records to include in a report, all you have to do is change the crite-ria in the underlying query and then rerun the report. The new report will use the updated criteria.
Summary
This appendix covers how to perform queries and create forms and reports using Microsoft Access. Here are the main points discussed in this appendix:
• Database queries• Creating queries using Query by Example• Creating forms• Creating reports
Figure D.18 Report Wizard
A50 Appendix D
Learning Activities
The following activities use the Northwind database, which is available from your instructor.
1. Create a query that shows the Country, City, CustomerID, and Customer CompanyName for all customers located in France, Spain, or Sweden. Sort the query by Country, then CompanyName.
2. Create a query that shows the ProductID, ProductName, and UnitPrice for all products with a UnitPrice greater than $50. Sort the query in descending order of UnitPrice.
3. Create a query that shows the CategoryName, ProductID, ProductName, and UnitPrice for all products in the Produce or Seafood categories. Sort the query in order of CategoryName, then ProductName.
4. Create a query that shows the Supplier CompanyName, CategoryName, ProductID, and ProductName for all products in the Produce or Seafood categories. Sort the query in order of Supplier CompanyName, then CategoryName, then ProductName.
5. Create a query that shows the OrderID, OrderDate, Customer Company-Name, and Country for all orders placed by customers in the United Kingdom. Sort the query by CompanyName.
6. Create a query that shows the OrderID, OrderDate, Customer Company-Name, ProductName, Quantity, and UnitPrice for all products included in the order. Use UnitPrice from the Order Details table (not the Products table). Only show orders from the companies named “Lonesome Pine Restaurant” or “Rattlesnake Canyon Grocery.” Sort the query by Order-Date, then CompanyName.
7. Create a form that will let you enter data for all fields included in the Customers table.
8. Create a form that shows the CategoryID, CategoryName, and Descrip-tion for each category, along with the ProductID, ProductName, and UnitPrice for all products in that category. The form should have Cate-gory in the main form and Products in the subform.
9. Create a well-formatted report that shows the data from the query in Activity #2.
10. Create a well-formatted report that shows the Supplier’s CompanyName, CategoryName, ProductName, and UnitPrice for all products.
11. Create a well-formatted report that shows the data from the query in Activity #6.
Appendix E
Advanced Database ConceptsLearning Objectives
By reading and completing the activities in this appendix, you will be able to:
• Define terms related to conceptual data modeling• Understand the elements of a conceptual data model• Develop a conceptual data model based on business rules
Appendix Outline
IntroductionThe Entity-Relationship Diagram
Learning Activity E.1: Interpreting an ERDLearning Activity E.2: Reading Relationships in an ERD
Creating an E-R Diagram
Introduction
The ability of a database designer to understand and model the information that an organization uses is a critical design skill. Data modelers use a variety of tools and techniques to understand an organization’s data. To understand how to properly model data, you must become familiar with a modeling approach known as entity- relationship modeling, which is the subject of this chapter.
Entity-relationship (E-R) modeling is one approach to semantic modeling. When database designers attempt to understand and represent meaning, they are engaged in semantic modeling, which can help in making database design more systematic. Although a number of approaches to semantic modeling exist, this appendix focuses on E-R modeling.
E-R modeling, introduced by Chen (1976), consists of a number of activities that help database designers understand the objects the organization wants to store information about, the important characteristics of these objects, and the associa-tions among various objects. Although most of you probably will not design and develop a database from scratch, many of you may be involved in teams that help database experts design complex databases and data warehouses. Having some knowledge of the process will help you be a more effective team member.
A52 Appendix E
The Entity-Relationship Diagram
The end result of E-R modeling is the E-R diagram (ERD), a graphic representa-tion of the logical structure of a database. An ERD serves several purposes. First, the database analyst/designer gains a better understanding of the information to be con-tained in the database through the process of constructing the ERD. Second, the ERD serves as a documentation tool. Finally, the ERD is used to communicate the logical structure of the database to users.
The E-R modeling process identifies three basic elements: entities, attributes, and relationships. These are described in the following sections.
EntitiesThe concept of an entity is similar to the concept of a table, which we discussed in Chapter 5. An entity is a thing that can be distinctly identified (Chen 1976). In database design, entities are the “things” about which the database stores informa-tion. Entities can include, but are not limited to, the following:
• Tangible items, such as equipment• Concepts, such as accounts• People, such as employees• Events, such as sales• Places, such as business locations
The term entity type refers to a number of related items, while an entity instance refers to a single occurrence of an entity type. For example, employee number 12345 refers to a single occurrence, or entity instance, of the entity EMPLOYEE. The term entity refers to entity type. In addition, note that the term entity occurrence is some-times used rather than entity instance.
AttributesAn attribute is a single data value that describes a characteristic of an entity. Other terms, such as data item and field (which we used in Chapter 5), describe the same essential concept.
Each entity has a corresponding set of attributes that represent the information about the entity that the organization is interested in. For example, a university may wish to know the name, address, phone number, and primary email address of each student. Put in database terms, STUDENT is the entity of interest, and NAME, ADDRESS, PHONE, and EMAIL are the attributes of interest.
Primary KeysEvery entity must have a primary key. The primary key is an attribute or combina-tion of attributes that uniquely identifies an instance of the entity. In other words, no
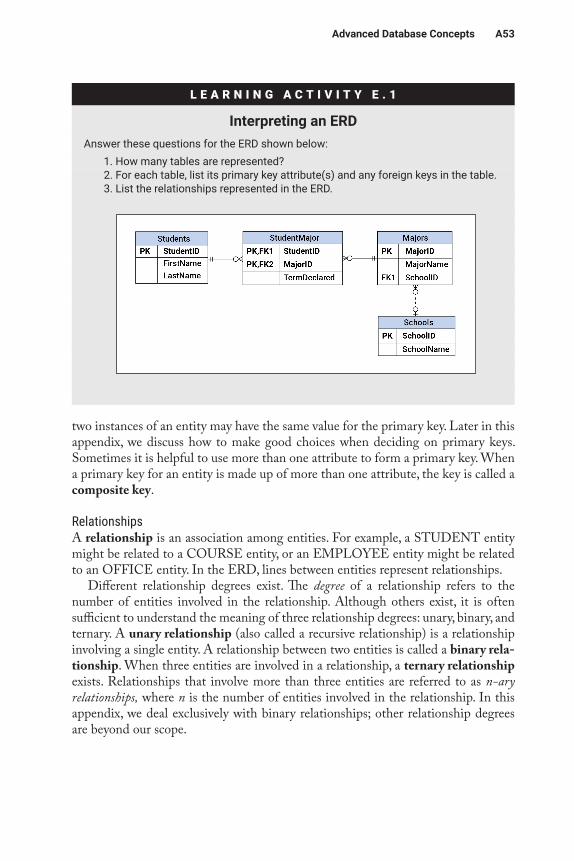
AdvancedDatabaseConcepts A53
two instances of an entity may have the same value for the primary key. Later in this appendix, we discuss how to make good choices when deciding on primary keys. Sometimes it is helpful to use more than one attribute to form a primary key. When a primary key for an entity is made up of more than one attribute, the key is called a composite key.
RelationshipsA relationship is an association among entities. For example, a STUDENT entity might be related to a COURSE entity, or an EMPLOYEE entity might be related to an OFFICE entity. In the ERD, lines between entities represent relationships.
Different relationship degrees exist. The degree of a relationship refers to the number of entities involved in the relationship. Although others exist, it is often sufficient to understand the meaning of three relationship degrees: unary, binary, and ternary. A unary relationship (also called a recursive relationship) is a relationship involving a single entity. A relationship between two entities is called a binary rela-tionship. When three entities are involved in a relationship, a ternary relationship exists. Relationships that involve more than three entities are referred to as n-ary relationships, where n is the number of entities involved in the relationship. In this appendix, we deal exclusively with binary relationships; other relationship degrees are beyond our scope.
L E A R N I N G A C T I V I T Y E . 1
InterpretinganERDAnswer these questions for the ERD shown below:
1. How many tables are represented?2. For each table, list its primary key attribute(s) and any foreign keys in the table.3. List the relationships represented in the ERD.
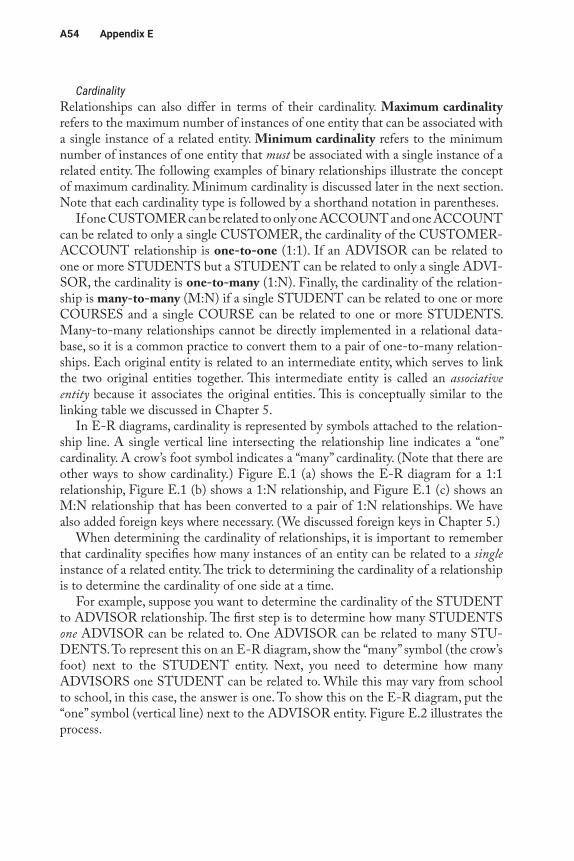
A54 Appendix E
CardinalityRelationships can also differ in terms of their cardinality. Maximum cardinality refers to the maximum number of instances of one entity that can be associated with a single instance of a related entity. Minimum cardinality refers to the minimum number of instances of one entity that must be associated with a single instance of a related entity. The following examples of binary relationships illustrate the concept of maximum cardinality. Minimum cardinality is discussed later in the next section. Note that each cardinality type is followed by a shorthand notation in parentheses.
If one CUSTOMER can be related to only one ACCOUNT and one ACCOUNT can be related to only a single CUSTOMER, the cardinality of the CUSTOMER- ACCOUNT relationship is one-to-one (1:1). If an ADVISOR can be related to one or more STUDENTS but a STUDENT can be related to only a single ADVI-SOR, the cardinality is one-to-many (1:N). Finally, the cardinality of the relation-ship is many-to-many (M:N) if a single STUDENT can be related to one or more COURSES and a single COURSE can be related to one or more STUDENTS. Many-to-many relationships cannot be directly implemented in a relational data-base, so it is a common practice to convert them to a pair of one-to-many relation-ships. Each original entity is related to an intermediate entity, which serves to link the two original entities together. This intermediate entity is called an associative entity because it associates the original entities. This is conceptually similar to the linking table we discussed in Chapter 5.
In E-R diagrams, cardinality is represented by symbols attached to the relation-ship line. A single vertical line intersecting the relationship line indicates a “one” cardinality. A crow’s foot symbol indicates a “many” cardinality. (Note that there are other ways to show cardinality.) Figure E.1 (a) shows the E-R diagram for a 1:1 relationship, Figure E.1 (b) shows a 1:N relationship, and Figure E.1 (c) shows an M:N relationship that has been converted to a pair of 1:N relationships. We have also added foreign keys where necessary. (We discussed foreign keys in Chapter 5.)
When determining the cardinality of relationships, it is important to remember that cardinality specifies how many instances of an entity can be related to a single instance of a related entity. The trick to determining the cardinality of a relationship is to determine the cardinality of one side at a time.
For example, suppose you want to determine the cardinality of the STUDENT to ADVISOR relationship. The first step is to determine how many STUDENTS one ADVISOR can be related to. One ADVISOR can be related to many STU-DENTS. To represent this on an E-R diagram, show the “many” symbol (the crow’s foot) next to the STUDENT entity. Next, you need to determine how many ADVISORS one STUDENT can be related to. While this may vary from school to school, in this case, the answer is one. To show this on the E-R diagram, put the “one” symbol (vertical line) next to the ADVISOR entity. Figure E.2 illustrates the process.
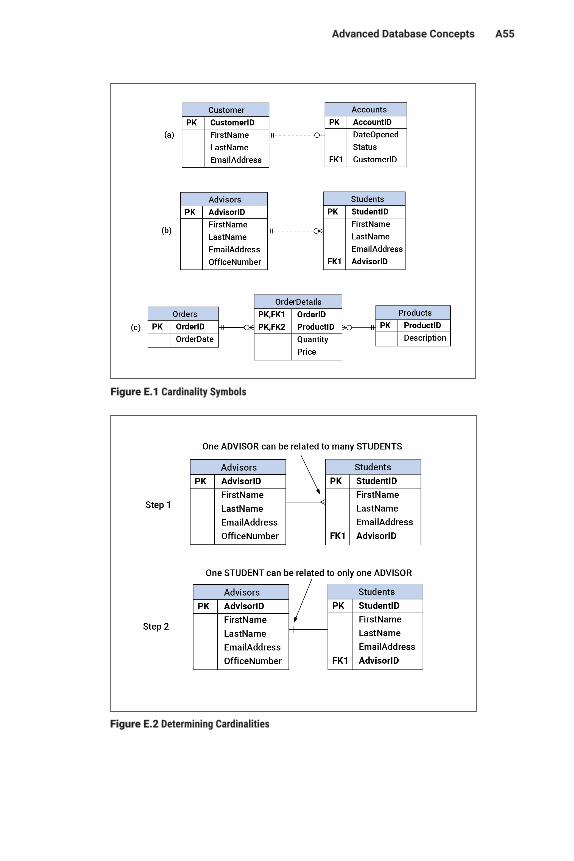
AdvancedDatabaseConcepts A55
Figure E.1 Cardinality Symbols
Figure E.2 Determining Cardinalities
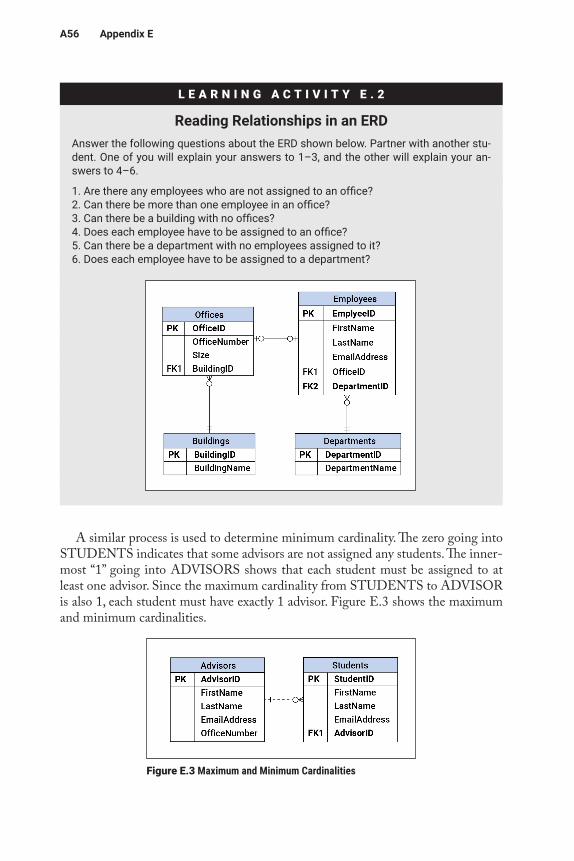
A56 Appendix E
A similar process is used to determine minimum cardinality. The zero going into STUDENTS indicates that some advisors are not assigned any students. The inner-most “1” going into ADVISORS shows that each student must be assigned to at least one advisor. Since the maximum cardinality from STUDENTS to ADVISOR is also 1, each student must have exactly 1 advisor. Figure E.3 shows the maximum and minimum cardinalities.
Figure E.3 Maximum and Minimum Cardinalities
L E A R N I N G A C T I V I T Y E . 2
ReadingRelationshipsinanERDAnswer the following questions about the ERD shown below. Partner with another stu-dent. One of you will explain your answers to 1–3, and the other will explain your an-swers to 4–6.
1. Are there any employees who are not assigned to an office?2. Can there be more than one employee in an office?3. Can there be a building with no offices?4. Does each employee have to be assigned to an office?5. Can there be a department with no employees assigned to it?6. Does each employee have to be assigned to a department?
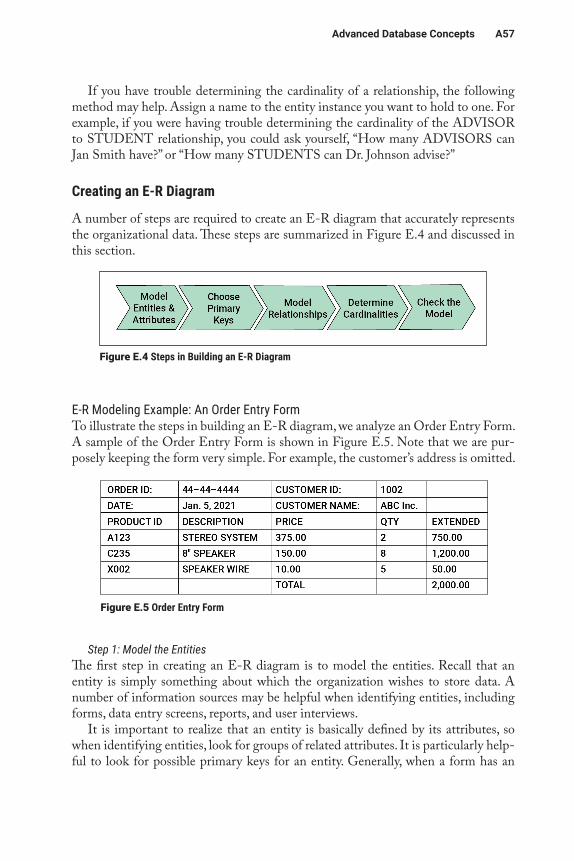
AdvancedDatabaseConcepts A57
If you have trouble determining the cardinality of a relationship, the following method may help. Assign a name to the entity instance you want to hold to one. For example, if you were having trouble determining the cardinality of the ADVISOR to STUDENT relationship, you could ask yourself, “How many ADVISORS can Jan Smith have?” or “How many STUDENTS can Dr. Johnson advise?”
Creating an E-R Diagram
A number of steps are required to create an E-R diagram that accurately represents the organizational data. These steps are summarized in Figure E.4 and discussed in this section.
E-R Modeling Example: An Order Entry FormTo illustrate the steps in building an E-R diagram, we analyze an Order Entry Form. A sample of the Order Entry Form is shown in Figure E.5. Note that we are pur-posely keeping the form very simple. For example, the customer’s address is omitted.
Step 1: Model the EntitiesThe first step in creating an E-R diagram is to model the entities. Recall that an entity is simply something about which the organization wishes to store data. A number of information sources may be helpful when identifying entities, including forms, data entry screens, reports, and user interviews.
It is important to realize that an entity is basically defined by its attributes, so when identifying entities, look for groups of related attributes. It is particularly help-ful to look for possible primary keys for an entity. Generally, when a form has an
Figure E.4 Steps in Building an E-R Diagram
Figure E.5 Order Entry Form
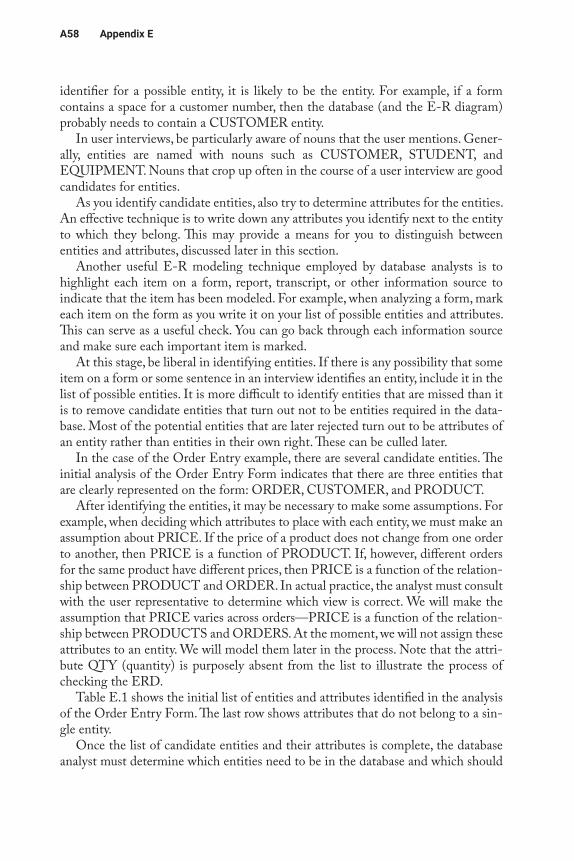
A58 Appendix E
identifier for a possible entity, it is likely to be the entity. For example, if a form contains a space for a customer number, then the database (and the E-R diagram) probably needs to contain a CUSTOMER entity.
In user interviews, be particularly aware of nouns that the user mentions. Gener-ally, entities are named with nouns such as CUSTOMER, STUDENT, and EQUIPMENT. Nouns that crop up often in the course of a user interview are good candidates for entities.
As you identify candidate entities, also try to determine attributes for the entities. An effective technique is to write down any attributes you identify next to the entity to which they belong. This may provide a means for you to distinguish between entities and attributes, discussed later in this section.
Another useful E-R modeling technique employed by database analysts is to highlight each item on a form, report, transcript, or other information source to indicate that the item has been modeled. For example, when analyzing a form, mark each item on the form as you write it on your list of possible entities and attributes. This can serve as a useful check. You can go back through each information source and make sure each important item is marked.
At this stage, be liberal in identifying entities. If there is any possibility that some item on a form or some sentence in an interview identifies an entity, include it in the list of possible entities. It is more difficult to identify entities that are missed than it is to remove candidate entities that turn out not to be entities required in the data-base. Most of the potential entities that are later rejected turn out to be attributes of an entity rather than entities in their own right. These can be culled later.
In the case of the Order Entry example, there are several candidate entities. The initial analysis of the Order Entry Form indicates that there are three entities that are clearly represented on the form: ORDER, CUSTOMER, and PRODUCT.
After identifying the entities, it may be necessary to make some assumptions. For example, when deciding which attributes to place with each entity, we must make an assumption about PRICE. If the price of a product does not change from one order to another, then PRICE is a function of PRODUCT. If, however, different orders for the same product have different prices, then PRICE is a function of the relation-ship between PRODUCT and ORDER. In actual practice, the analyst must consult with the user representative to determine which view is correct. We will make the assumption that PRICE varies across orders—PRICE is a function of the relation-ship between PRODUCTS and ORDERS. At the moment, we will not assign these attributes to an entity. We will model them later in the process. Note that the attri-bute QTY (quantity) is purposely absent from the list to illustrate the process of checking the ERD.
Table E.1 shows the initial list of entities and attributes identified in the analysis of the Order Entry Form. The last row shows attributes that do not belong to a sin-gle entity.
Once the list of candidate entities and their attributes is complete, the database analyst must determine which entities need to be in the database and which should
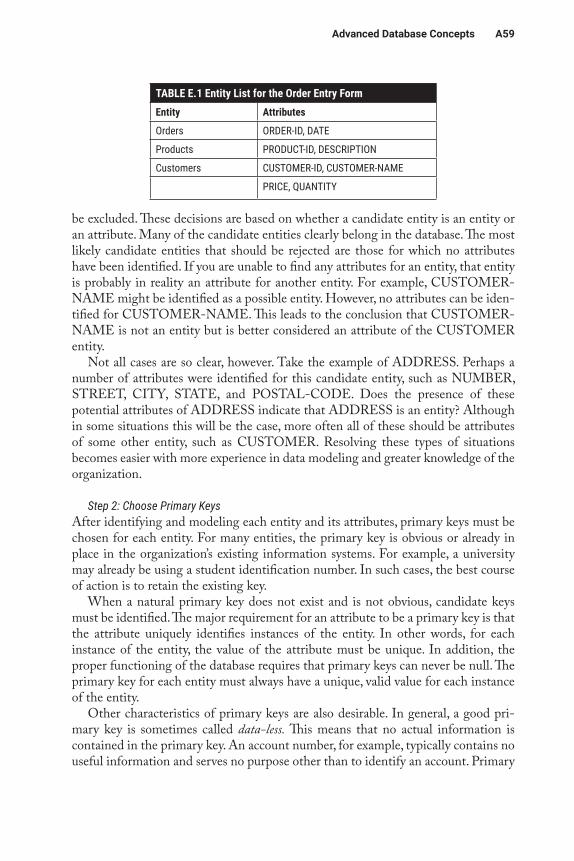
AdvancedDatabaseConcepts A59
be excluded. These decisions are based on whether a candidate entity is an entity or an attribute. Many of the candidate entities clearly belong in the database. The most likely candidate entities that should be rejected are those for which no attributes have been identified. If you are unable to find any attributes for an entity, that entity is probably in reality an attribute for another entity. For example, CUSTOMER -NAME might be identified as a possible entity. However, no attributes can be iden-tified for CUSTOMER-NAME. This leads to the conclusion that CUSTOMER -NAME is not an entity but is better considered an attribute of the CUSTOMER entity.
Not all cases are so clear, however. Take the example of ADDRESS. Perhaps a number of attributes were identified for this candidate entity, such as NUMBER, STREET, CITY, STATE, and POSTAL-CODE. Does the presence of these potential attributes of ADDRESS indicate that ADDRESS is an entity? Although in some situations this will be the case, more often all of these should be attributes of some other entity, such as CUSTOMER. Resolving these types of situations becomes easier with more experience in data modeling and greater knowledge of the organization.
Step 2: Choose Primary KeysAfter identifying and modeling each entity and its attributes, primary keys must be chosen for each entity. For many entities, the primary key is obvious or already in place in the organization’s existing information systems. For example, a university may already be using a student identification number. In such cases, the best course of action is to retain the existing key.
When a natural primary key does not exist and is not obvious, candidate keys must be identified. The major requirement for an attribute to be a primary key is that the attribute uniquely identifies instances of the entity. In other words, for each instance of the entity, the value of the attribute must be unique. In addition, the proper functioning of the database requires that primary keys can never be null. The primary key for each entity must always have a unique, valid value for each instance of the entity.
Other characteristics of primary keys are also desirable. In general, a good pri-mary key is sometimes called data-less. This means that no actual information is contained in the primary key. An account number, for example, typically contains no useful information and serves no purpose other than to identify an account. Primary
TABLE E.1 Entity List for the Order Entry FormEntity Attributes
Orders ORDER-ID, DATE
Products PRODUCT-ID, DESCRIPTION
Customers CUSTOMER-ID, CUSTOMER-NAME
PRICE, QUANTITY
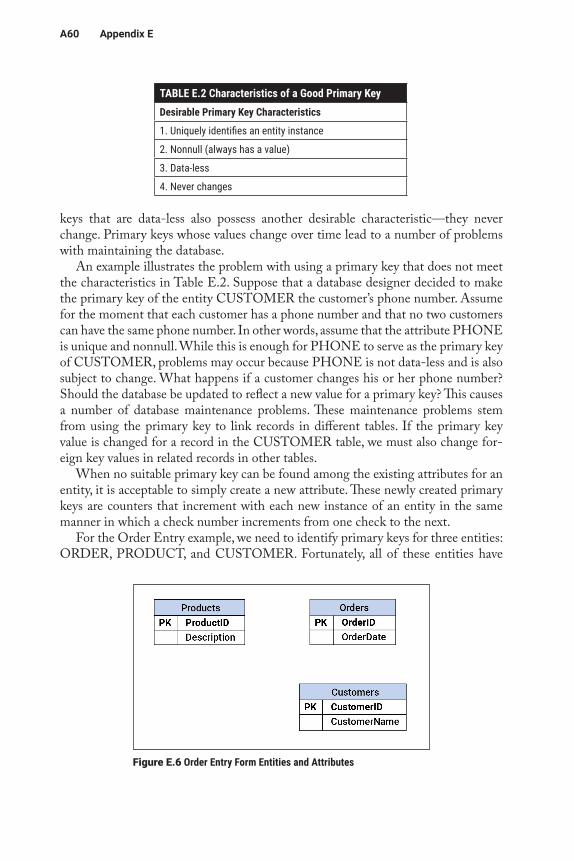
A60 Appendix E
keys that are data-less also possess another desirable characteristic—they never change. Primary keys whose values change over time lead to a number of problems with maintaining the database.
An example illustrates the problem with using a primary key that does not meet the characteristics in Table E.2. Suppose that a database designer decided to make the primary key of the entity CUSTOMER the customer’s phone number. Assume for the moment that each customer has a phone number and that no two customers can have the same phone number. In other words, assume that the attribute PHONE is unique and nonnull. While this is enough for PHONE to serve as the primary key of CUSTOMER, problems may occur because PHONE is not data-less and is also subject to change. What happens if a customer changes his or her phone number? Should the database be updated to reflect a new value for a primary key? This causes a number of database maintenance problems. These maintenance problems stem from using the primary key to link records in different tables. If the primary key value is changed for a record in the CUSTOMER table, we must also change for-eign key values in related records in other tables.
When no suitable primary key can be found among the existing attributes for an entity, it is acceptable to simply create a new attribute. These newly created primary keys are counters that increment with each new instance of an entity in the same manner in which a check number increments from one check to the next.
For the Order Entry example, we need to identify primary keys for three entities: ORDER, PRODUCT, and CUSTOMER. Fortunately, all of these entities have
TABLE E.2 Characteristics of a Good Primary KeyDesirable Primary Key Characteristics
1. Uniquely identifies an entity instance
2. Nonnull (always has a value)
3. Data-less
4. Never changes
Figure E.6 Order Entry Form Entities and Attributes
AdvancedDatabaseConcepts A61
attributes that make acceptable primary keys. For ORDER, ORDER-NO is a good choice for the primary key, for PRODUCT, PROD-ID makes an acceptable key, and CUSTOMER-ID is a good key for CUSTOMER. Notice that all of these satisfy our requirements for a primary key. They are unique for each occurrence of the entity, they will never be null, they are data-less, and they are not subject to change.
Once all the entities and their attributes and primary keys are identified, the actual drawing of the E-R diagram can begin. Figure E.6 shows the results for the Order Entry example. You might notice that the unassigned attributes from Table E.1 are missing. We will take care of this in a later step.
When all the entities, attributes, and primary keys are modeled, it is time to iden-tify and model the relationships among entities.
Step 3: Model RelationshipsRelationships among entities are a critical part of the E-R diagram. When these relationships are implemented in the database, they provide the links among the various tables that give the database its flexibility. To maximize the flexibility of a database, relationships must be properly identified and modeled.
Many relationships are relatively easy to recognize, such as those between ORDER and CUSTOMER or between STUDENT and COURSE. Others, how-ever, are less clear. Although becoming truly proficient at recognizing relationships requires experience and practice, there are some general guidelines that can help the database analyst recognize relationships.
When examining forms, reports, and entry screens, be on the lookout for entities whose attributes appear on the same form, report, or screen. Analysis of the Order Entry Form (Figure E.9) reveals three entities: CUSTOMER, ORDER, and PRODUCT. We can conclude that these entities may be related to one another. But how are they related? In cases where the form being analyzed only represents two entities, the relationship is fairly obvious—the relationship is between the two enti-ties. However, with the Order Entry Form, there are three entities represented. Fur-ther consideration is required to determine how these entities are related. Knowing something about the organization is particularly helpful in such situations.
In the case of the Order Entry Form example, ORDER and CUSTOMER are related, as are ORDER and PRODUCT. However, we know that there may not necessarily be a relationship between PRODUCT and CUSTOMER. Because both are related to ORDER, we can report which products are ordered by a particular customer.
In some cases, the analyst works from user interviews rather than forms. In these cases, the analyst can examine transcripts of user interviews to determine the rela-tionships among entities. Often, users mention related entities in the same sentence. Consider the excerpt from a user interview shown in Figure E.7. Notice how the user talks about orders and customers in the same sentence. Once ORDER and CUSTOMER are identified as entities, mentioning both in the same comment is a good indication that the entities are related.
A62 Appendix E
Once you identify relationships, you need to determine the cardinalities of the relationships.
Step 4: Determine CardinalitiesRecall that there are both maximum and minimum cardinalities. The maximum cardinality of a relationship is the number of instances of one entity in a relation-ship that can be related to a single instance of another entity in the relationship. In contrast, the minimum cardinality is the number of instances of one entity that must be related to a single instance of the related entity. Many novice database ana-lysts find determining the cardinalities of relationships more confusing than iden-tifying entities, attributes, and relationships. Thankfully, there are ways to make this task easier.
It is common to determine maximum cardinalities before minimum cardinali-ties. There are two parts to the maximum cardinality of a binary relationship, one for each entity. Recall the example of the ADVISOR-STUDENT relationship discussed earlier in this appendix. One ADVISOR can be related to many STU-DENTS. This indicates that the STUDENT side of the relationship has a “many” cardinality. This is only half of the relationship’s cardinality, however. To complete the cardinality, we must recognize that one STUDENT can be related to only a single ADVISOR. This tells us that the ADVISOR side of the relationship has a cardinality of one. Thus the cardinality of the ADVISOR-STUDENT relationship is one-to-many.
One technique that often helps analysts determine the proper cardinality of a relationship is to give the instance of the single-instance side of the relationship a name. For example, consider trying to determine the cardinality of the STUDENT- COURSE relationship. First, hold the STUDENT entity to a single instance to determine the cardinality of the COURSE side of the relationship. This is easier to do if, rather than saying “How many COURSES can a STUDENT be related to?” you say “How many COURSES can Mary Wilson be related to?” The answer, of course, is “many,” so the COURSE side of the relationship has a “many” cardinality. To determine the cardinality of the STUDENT side of the relationship, ask “How many students can be related to MIS380?” Once again, the answer is “many,” indi-cating that the STUDENT side of the relationship also has a “many” cardinality. When asking these cardinality questions, remember that you are always determining what cardinality symbol to draw next to the entity you are not holding to one instance.
ANALYST: What information do you need to know about orders?USER: Well, for each order, we need to know the ID number, the date of the
order number, and which customer placed the order.
Figure E.7 Excerpt from a User Interview
AdvancedDatabaseConcepts A63
Let’s return to the Order Entry Form example. There are two relationships: one between ORDER and PRODUCT and the other between CUSTOMER and ORDER. One instance of ORDER can be related to many instances of PRODUCT. In other words, one ORDER can contain many PRODUCTS. Thus the cardinality from ORDER to PRODUCT is many. Turning to the other side of the relationship, we can see that one instance of PRODUCT can be related to many instances of ORDER—a single PRODUCT can be on many ORDERS. So the cardinality from PRODUCT to ORDER is many. Combining the two sides gives us a many-to-many cardinality between ORDER and PRODUCT.
Now we must analyze the relationship between CUSTOMER and ORDER. A single ORDER can be related to only one CUSTOMER. In other words, a single ORDER can’t be placed by more than one CUSTOMER. This means that the car-dinality from ORDER to CUSTOMER is one. On the other side, a single CUS-TOMER can place many ORDERS, so the cardinality from CUSTOMER to ORDER is many, and we can say that the cardinality of the CUSTOMER- ORDER relationship is one-to-many.
Now the minimum cardinalities must be determined. Both maximum and mini-mum cardinalities are determined by business rules. However, cardinalities are sometimes less obvious than others when the analyst does not have good knowledge of the organization. For example, it is relatively easy to determine that an ORDER must be related to at least one CUSTOMER, indicating that the minimum cardi-nality from ORDER to CUSTOMER is one. The same can be said for ORDER and PRODUCT. But must a CUSTOMER be related to at least one ORDER? This is less clear. Maybe the organization allows customers to set up accounts prior to placing their first order. In this case, the minimum cardinality from CUSTOMER to ORDER is zero. We will make this assumption for the Order Entry Form exam-ple. The situation is similar for the minimum cardinality from PRODUCT to ORDER. It is reasonable to assume that we have products that have not been ordered yet. If this is allowed, then the minimum cardinality from PRODUCT to ORDER is zero.
Assumptions should only be temporary in actual practice. The analyst may have to make assumptions to be able to proceed with the analysis, but it is critical that the validity of the assumptions be checked with the users before completing the analysis.
If you have any many-to-many relationships, you must convert them to associa-tive entities. In our example, the relationship between orders and products is a many-to-many relationship. This relationship becomes an entity, which we will call ORDERDETAILS. Recall that earlier we determined that PRICE and QUAN-TITY were functions of this relationship. Because of this, we assign these attributes to the ORDERDETAILS entity. Figure E.8 shows the Order Entry E-R diagram with maximum and minimum cardinalities indicated. It is now time for the last step in the E-R diagramming process, checking the model.
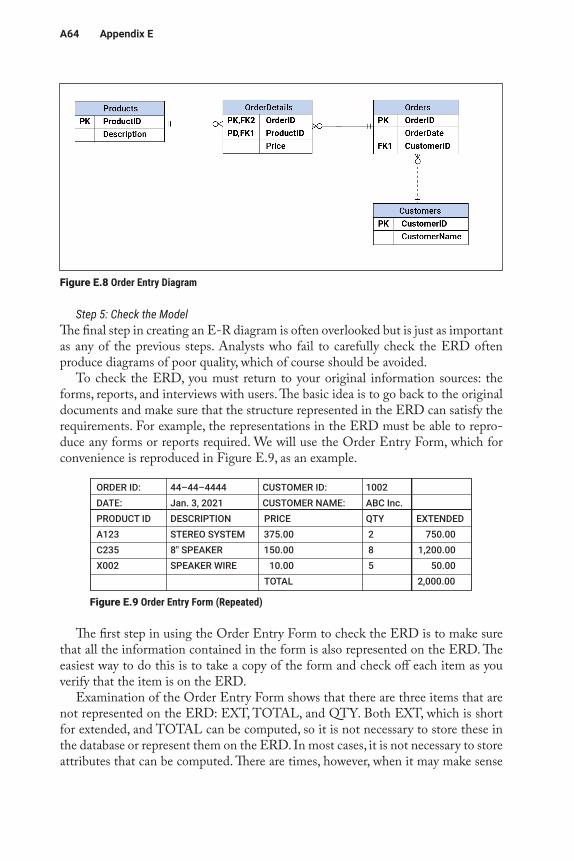
A64 Appendix E
Step 5: Check the ModelThe final step in creating an E-R diagram is often overlooked but is just as important as any of the previous steps. Analysts who fail to carefully check the ERD often produce diagrams of poor quality, which of course should be avoided.
To check the ERD, you must return to your original information sources: the forms, reports, and interviews with users. The basic idea is to go back to the original documents and make sure that the structure represented in the ERD can satisfy the requirements. For example, the representations in the ERD must be able to repro-duce any forms or reports required. We will use the Order Entry Form, which for convenience is reproduced in Figure E.9, as an example.
The first step in using the Order Entry Form to check the ERD is to make sure that all the information contained in the form is also represented on the ERD. The easiest way to do this is to take a copy of the form and check off each item as you verify that the item is on the ERD.
Examination of the Order Entry Form shows that there are three items that are not represented on the ERD: EXT, TOTAL, and QTY. Both EXT, which is short for extended, and TOTAL can be computed, so it is not necessary to store these in the database or represent them on the ERD. In most cases, it is not necessary to store attributes that can be computed. There are times, however, when it may make sense
Figure E.8 Order Entry Diagram
ORDER ID: 44–44–4444 CUSTOMER ID: 1002 DATE: Jan. 3, 2021 CUSTOMER NAME: ABC Inc. PRODUCT ID DESCRIPTION PRICE QTY EXTENDEDA123 STEREO SYSTEM 375.00 2 750.00C235 8″ SPEAKER 150.00 8 1,200.00X002 SPEAKER WIRE 10.00 5 50.00 TOTAL 2,000.00
Figure E.9 Order Entry Form (Repeated)
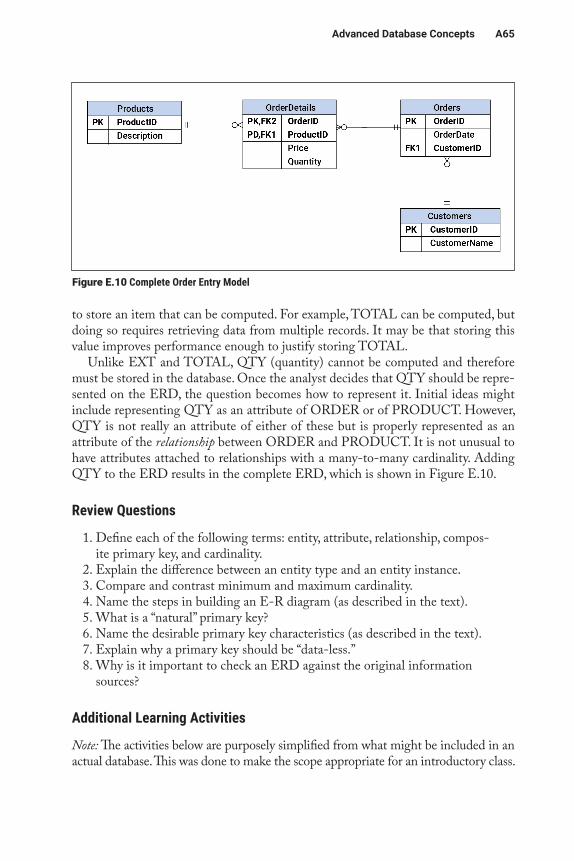
AdvancedDatabaseConcepts A65
to store an item that can be computed. For example, TOTAL can be computed, but doing so requires retrieving data from multiple records. It may be that storing this value improves performance enough to justify storing TOTAL.
Unlike EXT and TOTAL, QTY (quantity) cannot be computed and therefore must be stored in the database. Once the analyst decides that QTY should be repre-sented on the ERD, the question becomes how to represent it. Initial ideas might include representing QTY as an attribute of ORDER or of PRODUCT. However, QTY is not really an attribute of either of these but is properly represented as an attribute of the relationship between ORDER and PRODUCT. It is not unusual to have attributes attached to relationships with a many-to-many cardinality. Adding QTY to the ERD results in the complete ERD, which is shown in Figure E.10.
Review Questions
1. Define each of the following terms: entity, attribute, relationship, compos-ite primary key, and cardinality.
2. Explain the difference between an entity type and an entity instance. 3. Compare and contrast minimum and maximum cardinality. 4. Name the steps in building an E-R diagram (as described in the text). 5. What is a “natural” primary key? 6. Name the desirable primary key characteristics (as described in the text). 7. Explain why a primary key should be “data-less.” 8. Why is it important to check an ERD against the original information
sources?
Additional Learning Activities
Note: The activities below are purposely simplified from what might be included in an actual database. This was done to make the scope appropriate for an introductory class.
Figure E.10 Complete Order Entry Model
A66 Appendix E
1. Create an E-R diagram based on the purchase order form shown below. (Note: “Extended” is the extended cost, or quantity multiplied by cost.) State any assumptions that you made when creating the diagram.
2. Your friend wants your help in creating a database that will help her keep track of members of a student club. She wants to be able to track basic contact information for members, including names, primary email addresses, and on-campus addresses. In addition, she wants to track any leadership positions members currently hold. (She does not care about past positions.) Finally, she wants to store any other clubs to which members belong. Only the names of the other clubs need to be stored in the database. Create an E-R diagram that meets your friend’s require-ments. State any assumptions you made.
3. Create an E-R diagram that could be used to create a database to track your music collection. For each song, you need to know the title, artist(s), date published, and album on which the song appeared. Keep in mind that an artist can have multiple albums and that a song may involve more than one artist. Be sure to state any assumptions you make.
4. You want to create a database that can help you keep track of your movie collection. For each movie, you want to store the title of the movie; the year it was released; the name and nationality of the director; and the full names, nationalities, and birth dates of the female and male lead actors. You also want to store the genre of each movie (such as comedy, sci-fi, etc.). Create an E-R diagram that represents these requirements. State any assumptions you make.
References
Chen, P. P. 1976. “The entity–relationship model—Toward a unified view of data.” ACM Transactions on Database Systems 1(1): 9–36.
PURCHASE ORDER FORMPO No.: 12348 Date: 1/8/2021Vendor ID: 87459Name: Bithlo BooksAddress: 27 E. SR 50 Bithlo, FL 32158
ISBN Title QTY Cost Extended1-55860-294-1 Database Modeling & Design 5 10.00 50.003-12368-998-2 Guide to the Outback 7 12.00 84.002-78912-437-5 Sports Heroes of the 1700’s 2 16.25 32.50 TOTAL COST 166.50
AdvancedDatabaseConcepts A67
Glossary
Binary relationship: A relationship involving two entities.Business rule: A statement that defines or constrains an aspect of a business with the
intent of controlling behaviors within the business.Composite primary key: A primary key made up of two or more attributes.Entity: A thing that can be distinctly identified in a conceptual data model; the “thing”
about which one wants to store data in a database. Depending on the context, “entity” may refer to an entity type or an entity instance.
Entity instance: A single occurrence of an entity type.Entity-relationship modeling: The process of creating an entity-relationship diagram
(ERD).Entity type: A category or collection of entity instances.E-R diagram (ERD): A graphical representation of the conceptual structure of a data-
base.Many-to-many: A form of maximum cardinality indicating that more than one in-
stance of an entity can be related to more than one instance of a related entity.Maximum cardinality: The maximum number of instances of one entity that can be
associated with a single instance of a related entity.Minimum cardinality: The minimum number of instances of one entity that must be
associated with a single instance of a related entity.One-to-one: A form of maximum cardinality indicating that a single instance of an
entity can be related to only one instance of a related entity.One-to-many: A form of maximum cardinality indicating that a single instance of an
entity can be related to more than one instance of a related entity.Primary key: An attribute or set of attributes that uniquely identifies an instance of an
entity.Relationship: An association among entities or between instances of the same entity.Ternary relationship: A relationship involving three entities.Unary relationship: A relationship that includes only one entity; this represents a situ-
ation in which a record in a table is related to another record in the same table. Also known as a recursive relationship.

Appendix F
Excel FundamentalsLearning Objectives
By reading and completing the activities in this appendix, you will be able to:
• Navigate the Microsoft Excel interface• Work with cells and ranges of cells in Excel• Enter data, formulas, and functions• Choose and implement appropriate functions• Work with ranges of cells• Format a spreadsheet to improve readability• Appropriately choose between absolute and relative cell referencing• Create charts using Excel• Prepare a spreadsheet for printing
Appendix Outline
IntroductionExcel FundamentalsEditing and Formatting WorksheetsFunctions and FormulasChartsPrinting
Introduction
The purpose of this appendix is to help you gain fundamental hands-on spreadsheet skills. We discussed the purposes of electronic spreadsheets in Chapter 6 of the main text, and here we delve into how to actually use them. Although this appendix uses Microsoft Excel, many of the skills you will gain will transfer to other spreadsheet software, such as OpenOffice Calc, Google Sheets, and Numbers for Mac.
In the book, we explained that the power of a spreadsheet comes from the fact that it can store information as relationships among cells rather than as simple text or numbers. Of course, a spreadsheet can store numbers and text as well. Because the spreadsheet uses relationships when you change a value in a cell, all cells that depend on that value also change. So it is possible to update very complex spreadsheets quickly and accurately. Spreadsheets can be extremely complex, with tens of thou-sands of cells. In practice, the capacity of an Excel spreadsheet seems limitless. Of course, there are limits to the size and complexity that Excel can handle. Check out
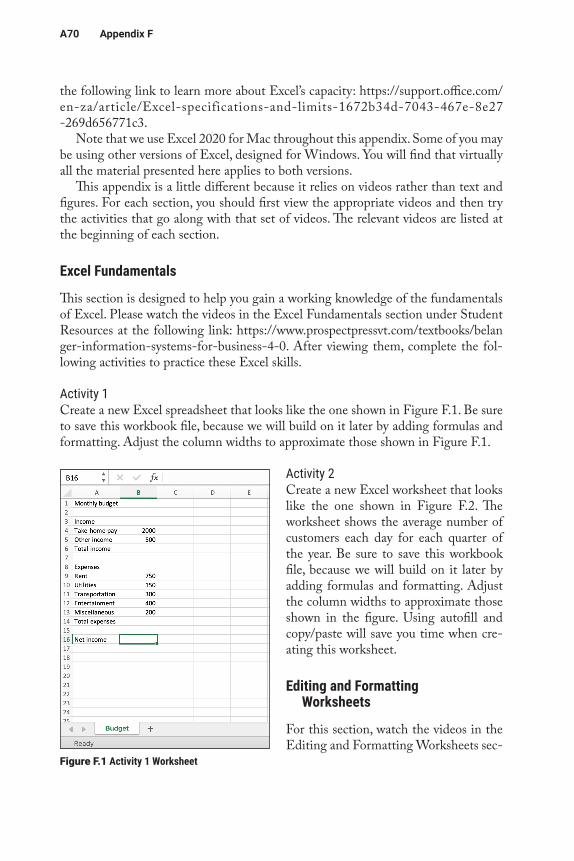
A70 Appendix F
the following link to learn more about Excel’s capacity: https://support.office.com/en-za/article/Excel-specifications-and-limits-1672b34d-7043-467e-8e27 -269d656771c3.
Note that we use Excel 2020 for Mac throughout this appendix. Some of you may be using other versions of Excel, designed for Windows. You will find that virtually all the material presented here applies to both versions.
This appendix is a little different because it relies on videos rather than text and figures. For each section, you should first view the appropriate videos and then try the activities that go along with that set of videos. The relevant videos are listed at the beginning of each section.
Excel Fundamentals
This section is designed to help you gain a working knowledge of the fundamentals of Excel. Please watch the videos in the Excel Fundamentals section under Student Resources at the following link: https://www.prospectpressvt.com/textbooks/belan ger-information-systems-for-business-4-0. After viewing them, complete the fol-lowing activities to practice these Excel skills.
Activity 1Create a new Excel spreadsheet that looks like the one shown in Figure F.1. Be sure to save this workbook file, because we will build on it later by adding formulas and formatting. Adjust the column widths to approximate those shown in Figure F.1.
Activity 2Create a new Excel worksheet that looks like the one shown in Figure F.2. The worksheet shows the average number of customers each day for each quarter of the year. Be sure to save this workbook file, because we will build on it later by adding formulas and formatting. Adjust the column widths to approximate those shown in the figure. Using autofill and copy/paste will save you time when cre-ating this worksheet.
Editing and Formatting Worksheets
For this section, watch the videos in the Editing and Formatting Worksheets sec-
Figure F.1 Activity 1 Worksheet
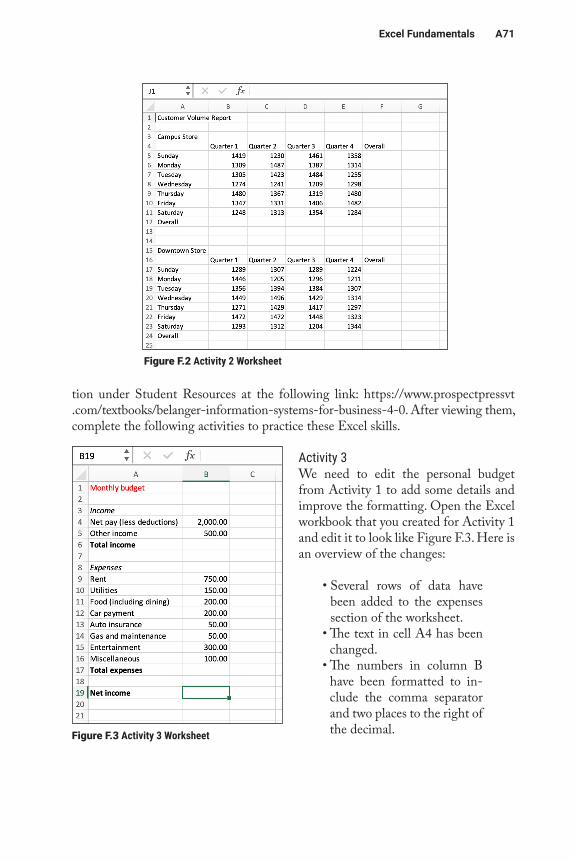
ExcelFundamentals A71
tion under Student Resources at the following link: https://www.prospectpressvt .com/textbooks/belanger-information-systems-for-business-4-0. After viewing them, complete the following activities to practice these Excel skills.
Activity 3We need to edit the personal budget from Activity 1 to add some details and improve the formatting. Open the Excel workbook that you created for Activity 1 and edit it to look like Figure F.3. Here is an overview of the changes:
• Several rows of data have been added to the expenses section of the worksheet.
• The text in cell A4 has been changed.
• The numbers in column B have been formatted to in-clude the comma separator and two places to the right of the decimal.
Figure F.2 Activity 2 Worksheet
Figure F.3 Activity 3 Worksheet
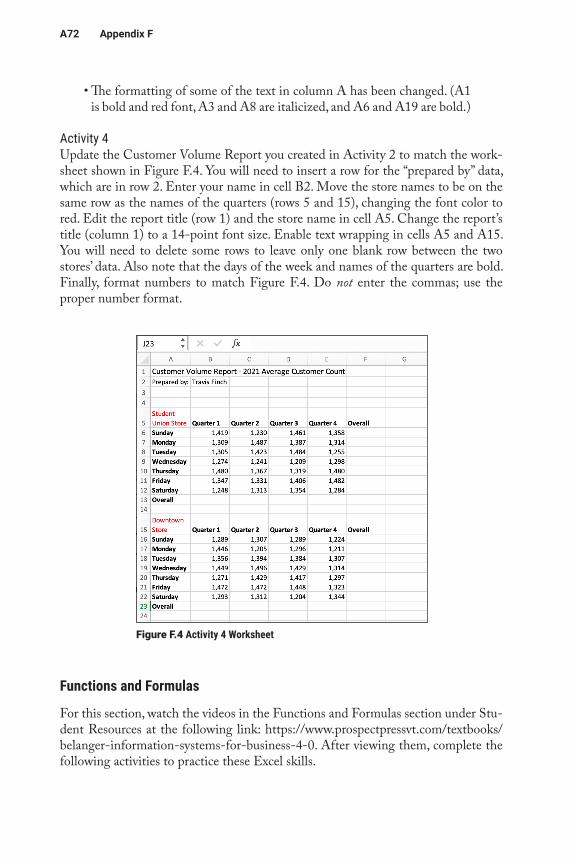
A72 Appendix F
• The formatting of some of the text in column A has been changed. (A1 is bold and red font, A3 and A8 are italicized, and A6 and A19 are bold.)
Activity 4Update the Customer Volume Report you created in Activity 2 to match the work-sheet shown in Figure F.4. You will need to insert a row for the “prepared by” data, which are in row 2. Enter your name in cell B2. Move the store names to be on the same row as the names of the quarters (rows 5 and 15), changing the font color to red. Edit the report title (row 1) and the store name in cell A5. Change the report’s title (column 1) to a 14-point font size. Enable text wrapping in cells A5 and A15. You will need to delete some rows to leave only one blank row between the two stores’ data. Also note that the days of the week and names of the quarters are bold. Finally, format numbers to match Figure F.4. Do not enter the commas; use the proper number format.
Functions and Formulas
For this section, watch the videos in the Functions and Formulas section under Stu-dent Resources at the following link: https://www.prospectpressvt.com/textbooks/belanger-information-systems-for-business-4-0. After viewing them, complete the following activities to practice these Excel skills.
Figure F.4 Activity 4 Worksheet
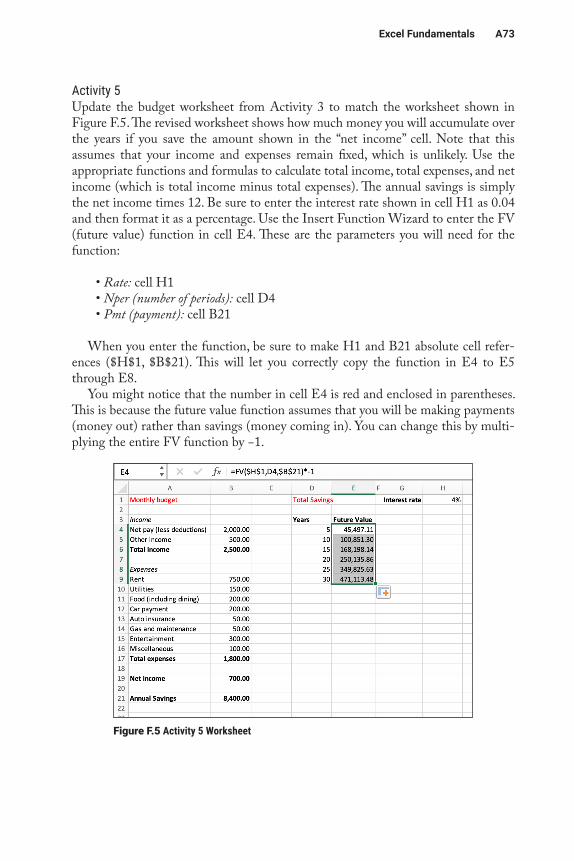
ExcelFundamentals A73
Activity 5Update the budget worksheet from Activity 3 to match the worksheet shown in Figure F.5. The revised worksheet shows how much money you will accumulate over the years if you save the amount shown in the “net income” cell. Note that this assumes that your income and expenses remain fixed, which is unlikely. Use the appropriate functions and formulas to calculate total income, total expenses, and net income (which is total income minus total expenses). The annual savings is simply the net income times 12. Be sure to enter the interest rate shown in cell H1 as 0.04 and then format it as a percentage. Use the Insert Function Wizard to enter the FV (future value) function in cell E4. These are the parameters you will need for the function:
• Rate: cell H1• Nper (number of periods): cell D4• Pmt (payment): cell B21
When you enter the function, be sure to make H1 and B21 absolute cell refer-ences ($H$1, $B$21). This will let you correctly copy the function in E4 to E5 through E8.
You might notice that the number in cell E4 is red and enclosed in parentheses. This is because the future value function assumes that you will be making payments (money out) rather than savings (money coming in). You can change this by multi-plying the entire FV function by −1.
Figure F.5 Activity 5 Worksheet
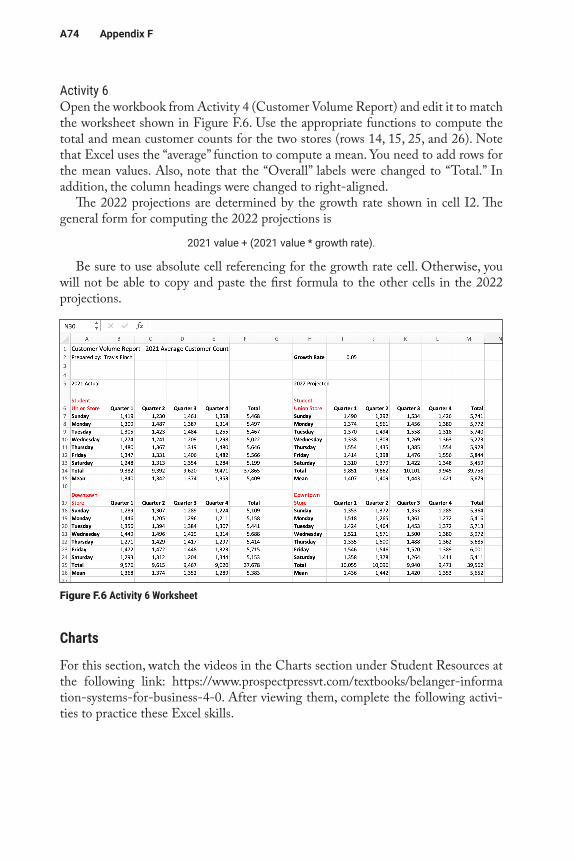
A74 Appendix F
Activity 6Open the workbook from Activity 4 (Customer Volume Report) and edit it to match the worksheet shown in Figure F.6. Use the appropriate functions to compute the total and mean customer counts for the two stores (rows 14, 15, 25, and 26). Note that Excel uses the “average” function to compute a mean. You need to add rows for the mean values. Also, note that the “Overall” labels were changed to “Total.” In addition, the column headings were changed to right-aligned.
The 2022 projections are determined by the growth rate shown in cell I2. The general form for computing the 2022 projections is
2021 value + (2021 value * growth rate).
Be sure to use absolute cell referencing for the growth rate cell. Otherwise, you will not be able to copy and paste the first formula to the other cells in the 2022 projections.
Charts
For this section, watch the videos in the Charts section under Student Resources at the following link: https://www.prospectpressvt.com/textbooks/belanger-informa tion-systems-for-business-4-0. After viewing them, complete the following activi-ties to practice these Excel skills.
Figure F.6 Activity 6 Worksheet
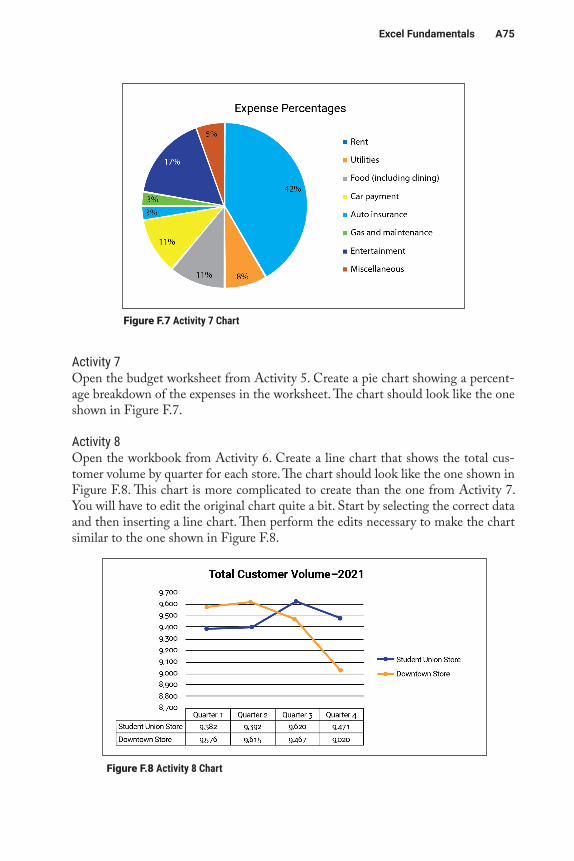
ExcelFundamentals A75
Activity 7Open the budget worksheet from Activity 5. Create a pie chart showing a percent-age breakdown of the expenses in the worksheet. The chart should look like the one shown in Figure F.7.
Activity 8Open the workbook from Activity 6. Create a line chart that shows the total cus-tomer volume by quarter for each store. The chart should look like the one shown in Figure F.8. This chart is more complicated to create than the one from Activity 7. You will have to edit the original chart quite a bit. Start by selecting the correct data and then inserting a line chart. Then perform the edits necessary to make the chart similar to the one shown in Figure F.8.
Figure F.7 Activity 7 Chart
Figure F.8 Activity 8 Chart
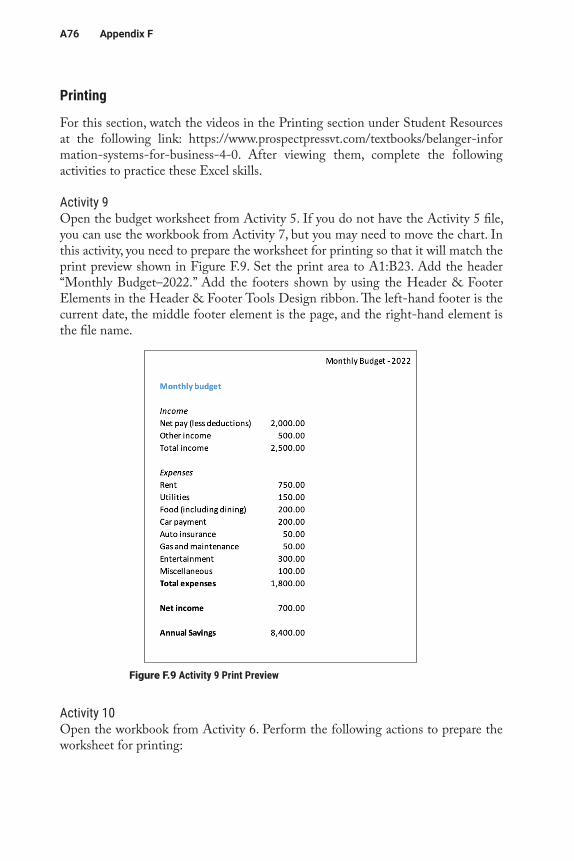
A76 Appendix F
Printing
For this section, watch the videos in the Printing section under Student Resources at the following link: https://www.prospectpressvt.com/textbooks/belanger-infor mation -systems-for-business-4-0. After viewing them, complete the following activities to practice these Excel skills.
Activity 9Open the budget worksheet from Activity 5. If you do not have the Activity 5 file, you can use the workbook from Activity 7, but you may need to move the chart. In this activity, you need to prepare the worksheet for printing so that it will match the print preview shown in Figure F.9. Set the print area to A1:B23. Add the header “Monthly Budget–2022.” Add the footers shown by using the Header & Footer Elements in the Header & Footer Tools Design ribbon. The left-hand footer is the current date, the middle footer element is the page, and the right-hand element is the file name.
Activity 10Open the workbook from Activity 6. Perform the following actions to prepare the worksheet for printing:
Figure F.9 Activity 9 Print Preview
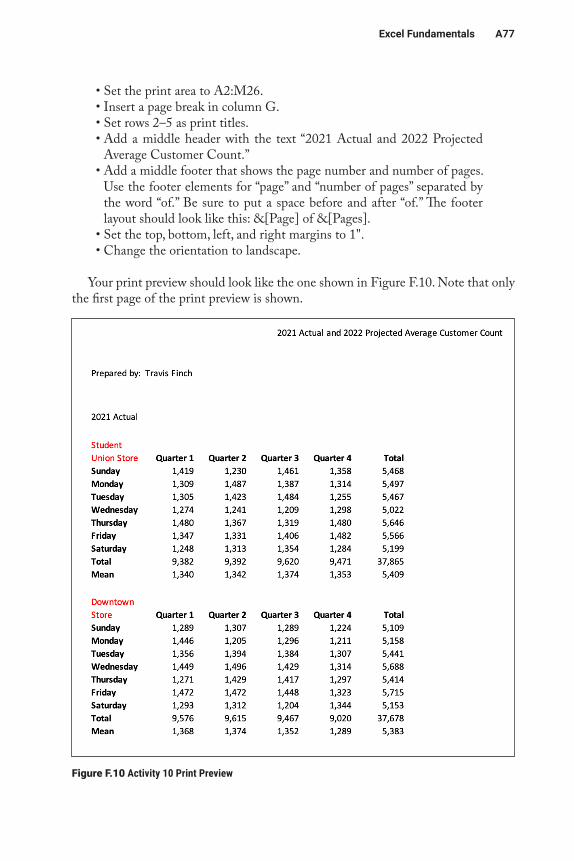
ExcelFundamentals A77
• Set the print area to A2:M26.• Insert a page break in column G.• Set rows 2–5 as print titles.• Add a middle header with the text “2021 Actual and 2022 Projected
Average Customer Count.”• Add a middle footer that shows the page number and number of pages.
Use the footer elements for “page” and “number of pages” separated by the word “of.” Be sure to put a space before and after “of.” The footer layout should look like this: &[Page] of &[Pages].
• Set the top, bottom, left, and right margins to 1".• Change the orientation to landscape.
Your print preview should look like the one shown in Figure F.10. Note that only the first page of the print preview is shown.
Figure F.10 Activity 10 Print Preview
A78 Appendix F
Additional Learning Activities
1. Download the file “Activity_Coffee.xlsx” and complete the worksheet by doing the following:
• Compute the yearly total for each product.• Compute the total (sum), mean, and median sales for each
quarter.• Format the worksheet to improve readability.• Format the total sales figures (column H) to have a green
background.• Create a chart showing for each product (a) the total sales for
the year and (b) the proportion of the total contributed by each quarter’s sales. This should be shown on one chart. (Hint: You should have one bar for each product.)
• Use the proper elements to add the file name and current date to the right- and left-hand footers.
• Format the worksheet to have 1" margins on the top, bottom, and each side.
• Change the page orientation to landscape. 2. Download the file “Activity_Coffee_MultiYear.xlsx” and complete the
worksheet by doing the following:• Add the title “Year-Over-Year Sales Report” to cell A1. Insert a
blank row below the title.• Format the title to be green text and a 14-point font size. (You
pick the font.)• Calculate the percentage change from year to year (2018 to
2019 and 2020 to 2021). Percentage change is computed using the following formula: (current year sales – last year sales) / (last year sales).
• Calculate the total sales for each customer.• Calculate the total, mean (average), and standard deviation for
each year.• Format the spreadsheet to improve readability.• Create a chart showing the contribution of each product to
2021 total sales.• Add useful header and footer elements. (Use your own judg-
ment.)• Format the worksheet to have 1" margins on the top and
bottom and 0.75" margins on each side.• Change the page orientation to landscape.
3. Download the file “Activity_ProductQuantitySold_Trend.xlsx” and complete the worksheet by doing the following:
• Compute the 2022 estimates for each revenue group using the
ExcelFundamentals A79
following formula: [2021 quantity sold + (2021 quantity sold * the increase estimate)]. The increase estimate is shown in cell B10.
• Insert a row between rows 8 and 9. Add the text “Mean” to column A of the new row.
• Use the appropriate functions to compute the total quantity sold for each year, the mean (average) quantity sold for each year, and the mean (average) quantity sold for each revenue group.
• Format the worksheet to improve readability.• Insert a header with the text “Quantity Sold
Report—2017–2022 (est.)”; this should be in the middle header position.
• Create a chart showing the quantity sold for each revenue group for each year. You should have one chart with multiple data series.
• Use the proper footer element to add today’s date as the middle footer.
• Set the top and bottom margins to 0.5" and set the left and right margins to 0.75".
• Set the page orientation to landscape. 4. Download the file “Activity_ProductSalesEstimates.xlsx” and complete
the worksheet by doing the following:• Calculate the 2022 estimates by adding the 2021 actual sales
times the increase factor to the 2021 actual sales for each product category. The general formula is [2021 sales + (2021 sales * increase factor)]. The increase factor is 0.05. You must use a formula to compute the estimates.
• For 2021 and 2022, calculate the total for each region and product category.
• Format the spreadsheet to improve readability.• Add useful header and footer elements. (Use your own judg-
ment.)• Format the worksheet to have 1" margins on the top and
bottom and 0.75" margins on each side.• Change the page orientation to landscape.
5. Download the file “Activity_EmployeeOverhead.xlsx” and complete the worksheet by doing the following:
• Compute the overhead and retirement for each employee. Overhead is computed as the salary multiplied by the overhead rate (cell I2); retirement is computed as the salary multiplied by the retirement rate (cell I3).
• Compute the total cost for each employee. Total cost is the sum of the salary, overhead, and retirement.

A80 Appendix F
• Compute total costs for each cost category (salary, overhead, retirement, and total costs).
• Format the worksheet to improve readability.• Set the print area to A1:I11.• Use the proper elements to add the file name and current date
to the right- and left-hand footers. The page number should be in the middle footer area.
• Format the worksheet to have 1" margins on the top, bottom, and each side.
• Change the page orientation to landscape.
Appendix G
Advanced ExcelLearning Objectives
By reading and completing the activities in this appendix, you will be able to:
• Create PivotTables using Microsoft Excel• Create scenarios using Microsoft Excel’s Scenario Manager• Perform Goal-Seek analysis using Microsoft Excel
Appendix Outline
IntroductionPivotTablesScenario ManagerGoal-Seek AnalysisLearning Activities
Introduction
Appendix F helped you learn the basics of using Microsoft Excel. This appendix will help you understand how to use some more advanced techniques, including Pivot-Tables, Scenario Manager, and Goal-Seek analysis. These techniques can help you analyze information so that you can make better decisions.
PivotTables
The PivotTable is among the most useful tools available in modern spreadsheet software. PivotTables allow you to quickly summarize large quantities of data. In addition, you can quickly and easily examine the data by various dimensions. For example, the district manager of a retail store chain may want to examine sales revenue by store or product category. This is easy to do with PivotTables. You can go even further and examine sales revenue for each product category and store combination. PivotTables seem complex and mysterious to many spreadsheet users. In reality, they are quite easy to create, as long as you understand a few basics, which we will cover.
PivotTables work best if you have well-structured data that are organized in con-tinuous rows and columns. An example is shown in Figure G.1. Notice that there are no blank rows or columns in the data. Having your data structured this way makes creating PivotTables easier.
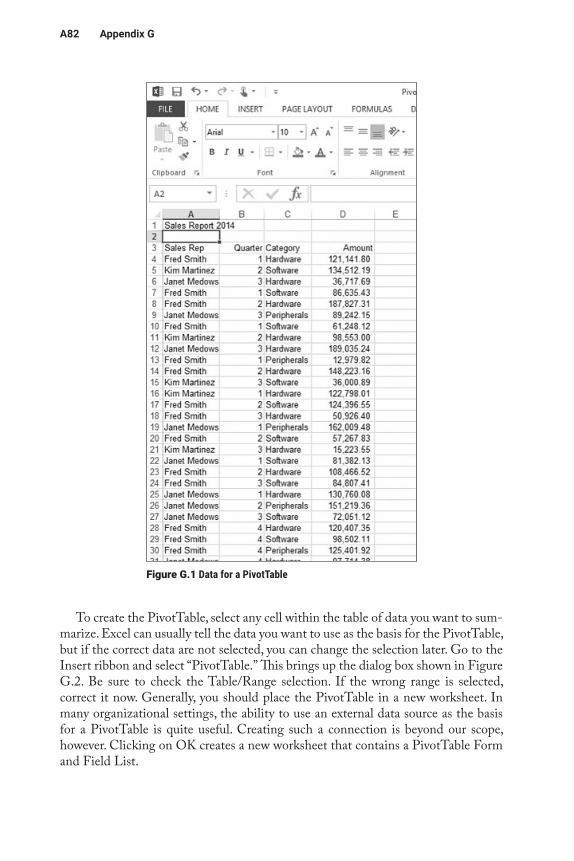
A82 Appendix G
To create the PivotTable, select any cell within the table of data you want to sum-marize. Excel can usually tell the data you want to use as the basis for the PivotTable, but if the correct data are not selected, you can change the selection later. Go to the Insert ribbon and select “PivotTable.” This brings up the dialog box shown in Figure G.2. Be sure to check the Table/Range selection. If the wrong range is selected, correct it now. Generally, you should place the PivotTable in a new worksheet. In many organizational settings, the ability to use an external data source as the basis for a PivotTable is quite useful. Creating such a connection is beyond our scope, however. Clicking on OK creates a new worksheet that contains a PivotTable Form and Field List.
Figure G.1 Data for a PivotTable
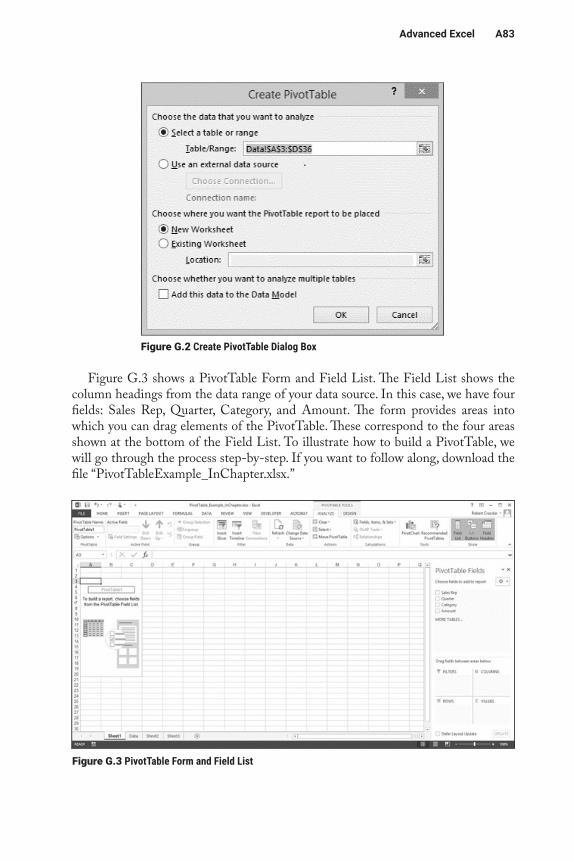
AdvancedExcel A83
Figure G.3 shows a PivotTable Form and Field List. The Field List shows the column headings from the data range of your data source. In this case, we have four fields: Sales Rep, Quarter, Category, and Amount. The form provides areas into which you can drag elements of the PivotTable. These correspond to the four areas shown at the bottom of the Field List. To illustrate how to build a PivotTable, we will go through the process step-by-step. If you want to follow along, download the file “PivotTableExample_InChapter.xlsx.”
Figure G.2 Create PivotTable Dialog Box
Figure G.3 PivotTable Form and Field List
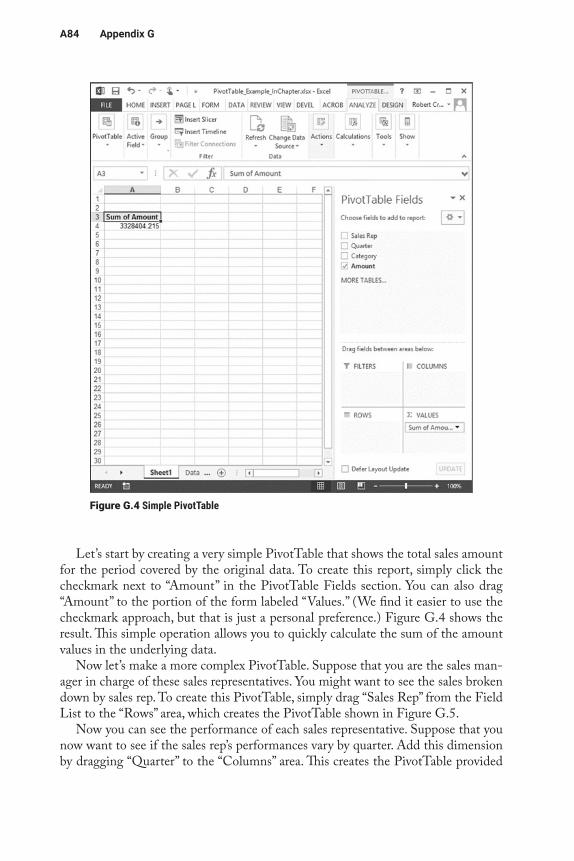
A84 Appendix G
Let’s start by creating a very simple PivotTable that shows the total sales amount for the period covered by the original data. To create this report, simply click the checkmark next to “Amount” in the PivotTable Fields section. You can also drag “Amount” to the portion of the form labeled “Values.” (We find it easier to use the checkmark approach, but that is just a personal preference.) Figure G.4 shows the result. This simple operation allows you to quickly calculate the sum of the amount values in the underlying data.
Now let’s make a more complex PivotTable. Suppose that you are the sales man-ager in charge of these sales representatives. You might want to see the sales broken down by sales rep. To create this PivotTable, simply drag “Sales Rep” from the Field List to the “Rows” area, which creates the PivotTable shown in Figure G.5.
Now you can see the performance of each sales representative. Suppose that you now want to see if the sales rep’s performances vary by quarter. Add this dimension by dragging “Quarter” to the “Columns” area. This creates the PivotTable provided
Figure G.4 Simple PivotTable
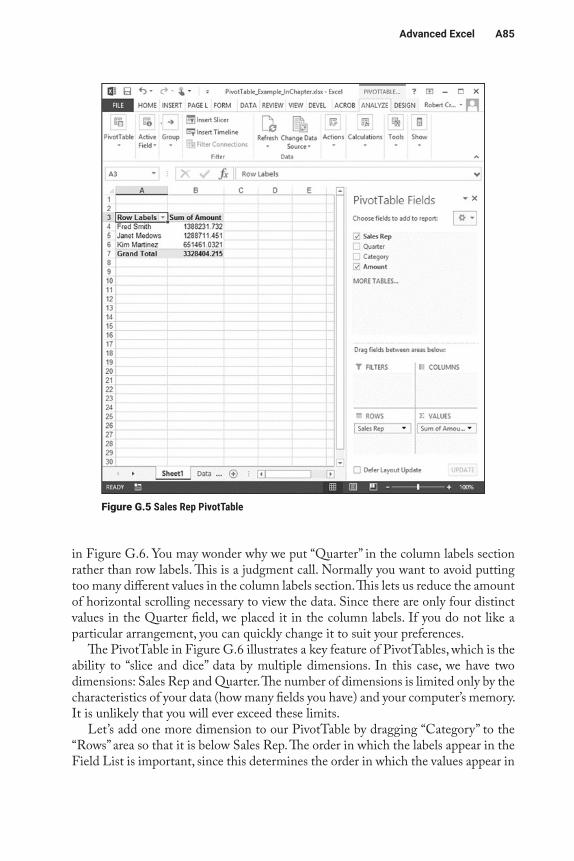
AdvancedExcel A85
in Figure G.6. You may wonder why we put “Quarter” in the column labels section rather than row labels. This is a judgment call. Normally you want to avoid putting too many different values in the column labels section. This lets us reduce the amount of horizontal scrolling necessary to view the data. Since there are only four distinct values in the Quarter field, we placed it in the column labels. If you do not like a particular arrangement, you can quickly change it to suit your preferences.
The PivotTable in Figure G.6 illustrates a key feature of PivotTables, which is the ability to “slice and dice” data by multiple dimensions. In this case, we have two dimensions: Sales Rep and Quarter. The number of dimensions is limited only by the characteristics of your data (how many fields you have) and your computer’s memory. It is unlikely that you will ever exceed these limits.
Let’s add one more dimension to our PivotTable by dragging “Category” to the “Rows” area so that it is below Sales Rep. The order in which the labels appear in the Field List is important, since this determines the order in which the values appear in
Figure G.5 Sales Rep PivotTable
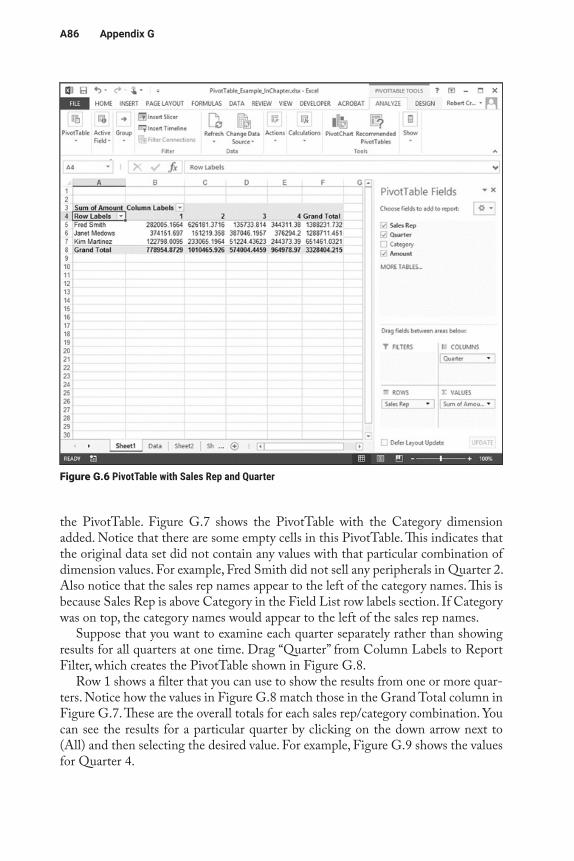
A86 Appendix G
the PivotTable. Figure G.7 shows the PivotTable with the Category dimension added. Notice that there are some empty cells in this PivotTable. This indicates that the original data set did not contain any values with that particular combination of dimension values. For example, Fred Smith did not sell any peripherals in Quarter 2. Also notice that the sales rep names appear to the left of the category names. This is because Sales Rep is above Category in the Field List row labels section. If Category was on top, the category names would appear to the left of the sales rep names.
Suppose that you want to examine each quarter separately rather than showing results for all quarters at one time. Drag “Quarter” from Column Labels to Report Filter, which creates the PivotTable shown in Figure G.8.
Row 1 shows a filter that you can use to show the results from one or more quar-ters. Notice how the values in Figure G.8 match those in the Grand Total column in Figure G.7. These are the overall totals for each sales rep/category combination. You can see the results for a particular quarter by clicking on the down arrow next to (All) and then selecting the desired value. For example, Figure G.9 shows the values for Quarter 4.
Figure G.6 PivotTable with Sales Rep and Quarter
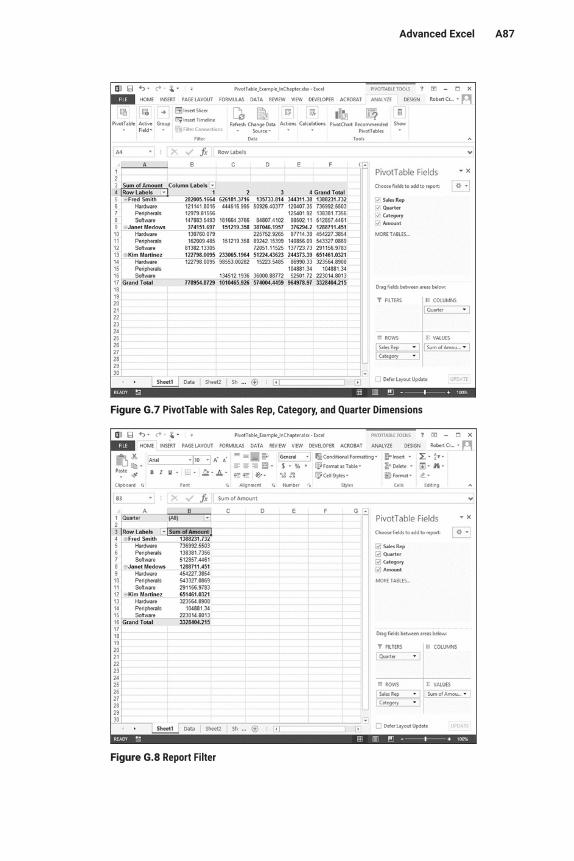
AdvancedExcel A87
Figure G.7 PivotTable with Sales Rep, Category, and Quarter Dimensions
Figure G.8 Report Filter
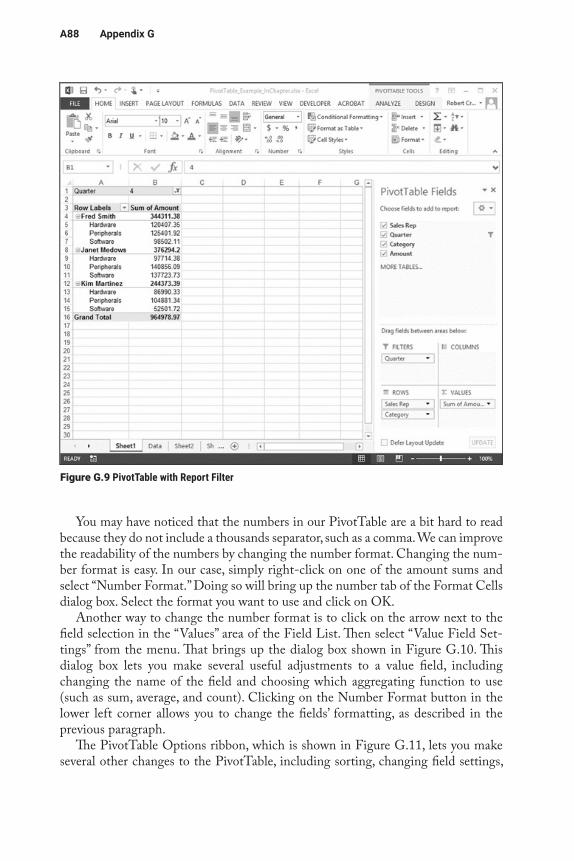
A88 Appendix G
You may have noticed that the numbers in our PivotTable are a bit hard to read because they do not include a thousands separator, such as a comma. We can improve the readability of the numbers by changing the number format. Changing the num-ber format is easy. In our case, simply right-click on one of the amount sums and select “Number Format.” Doing so will bring up the number tab of the Format Cells dialog box. Select the format you want to use and click on OK.
Another way to change the number format is to click on the arrow next to the field selection in the “Values” area of the Field List. Then select “Value Field Set-tings” from the menu. That brings up the dialog box shown in Figure G.10. This dialog box lets you make several useful adjustments to a value field, including changing the name of the field and choosing which aggregating function to use (such as sum, average, and count). Clicking on the Number Format button in the lower left corner allows you to change the fields’ formatting, as described in the previous paragraph.
The PivotTable Options ribbon, which is shown in Figure G.11, lets you make several other changes to the PivotTable, including sorting, changing field settings,
Figure G.9 PivotTable with Report Filter
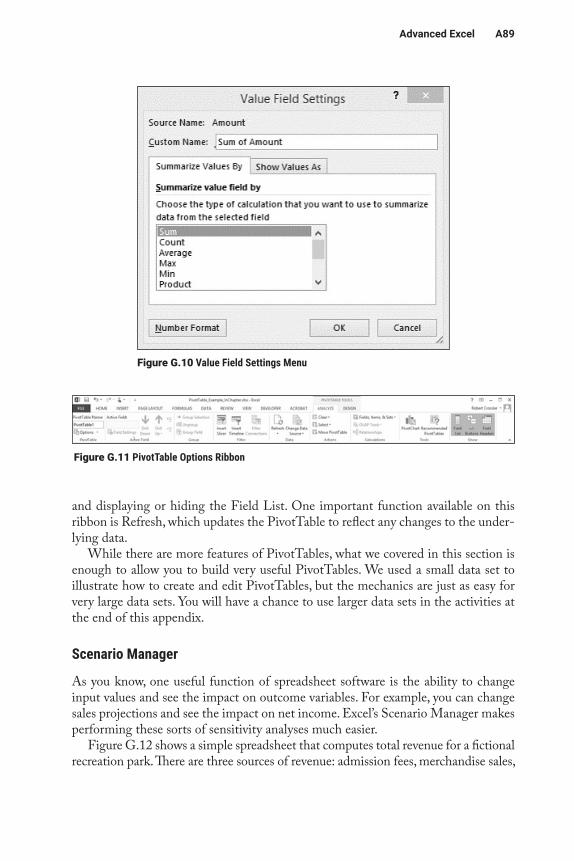
AdvancedExcel A89
and displaying or hiding the Field List. One important function available on this ribbon is Refresh, which updates the PivotTable to reflect any changes to the under-lying data.
While there are more features of PivotTables, what we covered in this section is enough to allow you to build very useful PivotTables. We used a small data set to illustrate how to create and edit PivotTables, but the mechanics are just as easy for very large data sets. You will have a chance to use larger data sets in the activities at the end of this appendix.
Scenario Manager
As you know, one useful function of spreadsheet software is the ability to change input values and see the impact on outcome variables. For example, you can change sales projections and see the impact on net income. Excel’s Scenario Manager makes performing these sorts of sensitivity analyses much easier.
Figure G.12 shows a simple spreadsheet that computes total revenue for a fictional recreation park. There are three sources of revenue: admission fees, merchandise sales,
Figure G.10 Value Field Settings Menu
Figure G.11 PivotTable Options Ribbon
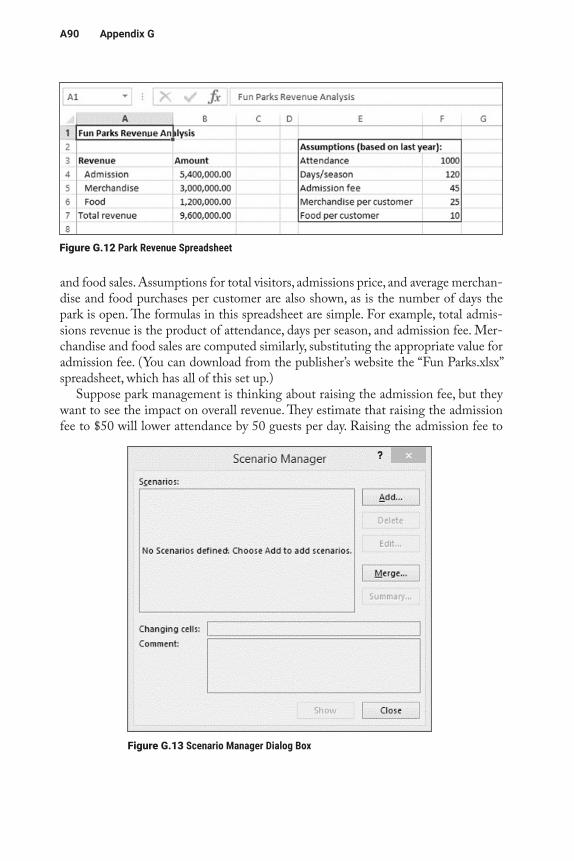
A90 Appendix G
and food sales. Assumptions for total visitors, admissions price, and average merchan-dise and food purchases per customer are also shown, as is the number of days the park is open. The formulas in this spreadsheet are simple. For example, total admis-sions revenue is the product of attendance, days per season, and admission fee. Mer-chandise and food sales are computed similarly, substituting the appropriate value for admission fee. (You can download from the publisher’s website the “Fun Parks.xlsx” spreadsheet, which has all of this set up.)
Suppose park management is thinking about raising the admission fee, but they want to see the impact on overall revenue. They estimate that raising the admission fee to $50 will lower attendance by 50 guests per day. Raising the admission fee to
Figure G.12 Park Revenue Spreadsheet
Figure G.13 Scenario Manager Dialog Box
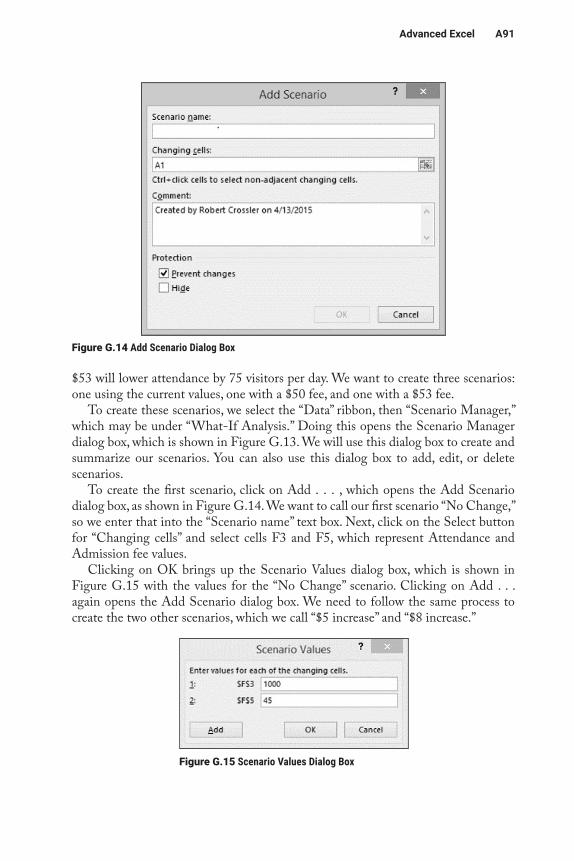
AdvancedExcel A91
$53 will lower attendance by 75 visitors per day. We want to create three scenarios: one using the current values, one with a $50 fee, and one with a $53 fee.
To create these scenarios, we select the “Data” ribbon, then “Scenario Manager,” which may be under “What-If Analysis.” Doing this opens the Scenario Manager dialog box, which is shown in Figure G.13. We will use this dialog box to create and summarize our scenarios. You can also use this dialog box to add, edit, or delete scenarios.
To create the first scenario, click on Add . . . , which opens the Add Scenario dialog box, as shown in Figure G.14. We want to call our first scenario “No Change,” so we enter that into the “Scenario name” text box. Next, click on the Select button for “Changing cells” and select cells F3 and F5, which represent Attendance and Admission fee values.
Clicking on OK brings up the Scenario Values dialog box, which is shown in Figure G.15 with the values for the “No Change” scenario. Clicking on Add . . . again opens the Add Scenario dialog box. We need to follow the same process to create the two other scenarios, which we call “$5 increase” and “$8 increase.”
Figure G.14 Add Scenario Dialog Box
Figure G.15 Scenario Values Dialog Box
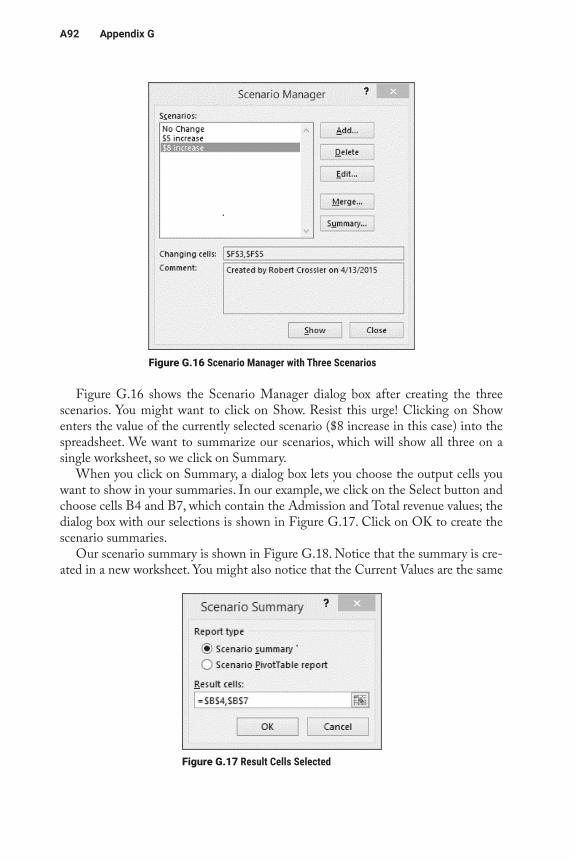
A92 Appendix G
Figure G.16 shows the Scenario Manager dialog box after creating the three scenarios. You might want to click on Show. Resist this urge! Clicking on Show enters the value of the currently selected scenario ($8 increase in this case) into the spreadsheet. We want to summarize our scenarios, which will show all three on a single worksheet, so we click on Summary.
When you click on Summary, a dialog box lets you choose the output cells you want to show in your summaries. In our example, we click on the Select button and choose cells B4 and B7, which contain the Admission and Total revenue values; the dialog box with our selections is shown in Figure G.17. Click on OK to create the scenario summaries.
Our scenario summary is shown in Figure G.18. Notice that the summary is cre-ated in a new worksheet. You might also notice that the Current Values are the same
Figure G.16 Scenario Manager with Three Scenarios
Figure G.17 Result Cells Selected
AdvancedExcel A93
as our No Change scenario. This occurred because one of our scenarios happened to have the same values as those that are currently in the worksheet. This won’t always be the case.
We can improve the summary by changing the formats of the numbers for the changing cells. We should also have more meaningful labels than $F$3. Because the summary is simply a worksheet, we can edit the text and formats in the normal way. Figure G.19 shows the edited summary. Better formatting of the original spread-sheet and naming our Changing Cells and Results Cells would have improved the readability of the original summary. Our scenarios are relatively simple, but the same process can be used to create more complex scenarios.
Figure G.18 Scenario Summaries
A94 Appendix G
Goal-Seek Analysis
Scenario Manager helped us examine how changes in input values impact outcome variables. Goal-Seek analysis reverses this; it lets you determine what input value leads to a desired outcome value. For example, we can use Goal Seek to determine what level of park attendance leads to a total revenue of $10,000,000. To perform this analysis, go to the Data ribbon and select “What-If Analysis,” then “Goal Seek.” This opens the Goal-Seek dialog box, which is shown in Figure G.20. “Set cell” is the cell containing our outcome value, and “By changing cell” is the input cell we want to analyze. One limitation of Goal Seek is that you can only have one input and one output cell.
Clicking on OK opens the Goal-Seek Status dialog box and changes “Set cell” and “By changing cell” to match the parameters entered in the Goal-Seek dialog box. Figure G.21 shows the spreadsheet and dialog box. Notice that F3 shows the
Figure G.19 Edited Scenario Summary
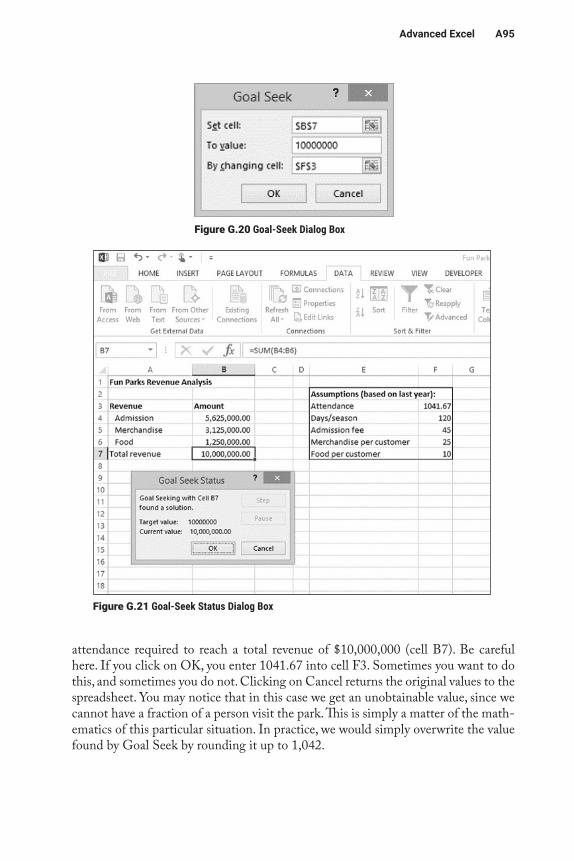
AdvancedExcel A95
attendance required to reach a total revenue of $10,000,000 (cell B7). Be careful here. If you click on OK, you enter 1041.67 into cell F3. Sometimes you want to do this, and sometimes you do not. Clicking on Cancel returns the original values to the spreadsheet. You may notice that in this case we get an unobtainable value, since we cannot have a fraction of a person visit the park. This is simply a matter of the math-ematics of this particular situation. In practice, we would simply overwrite the value found by Goal Seek by rounding it up to 1,042.
Figure G.20 Goal-Seek Dialog Box
Figure G.21 Goal-Seek Status Dialog Box
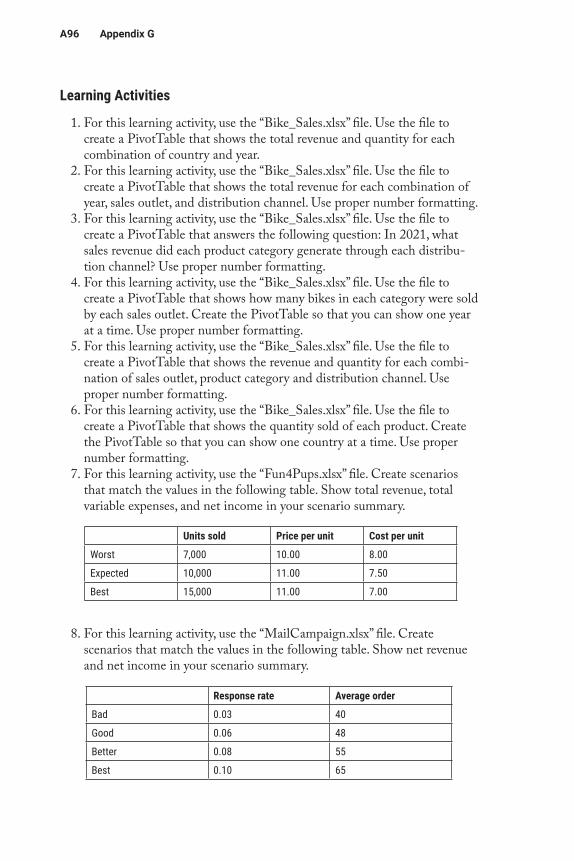
A96 Appendix G
Learning Activities
1. For this learning activity, use the “Bike_Sales.xlsx” file. Use the file to create a PivotTable that shows the total revenue and quantity for each combination of country and year.
2. For this learning activity, use the “Bike_Sales.xlsx” file. Use the file to create a PivotTable that shows the total revenue for each combination of year, sales outlet, and distribution channel. Use proper number formatting.
3. For this learning activity, use the “Bike_Sales.xlsx” file. Use the file to create a PivotTable that answers the following question: In 2021, what sales revenue did each product category generate through each distribu-tion channel? Use proper number formatting.
4. For this learning activity, use the “Bike_Sales.xlsx” file. Use the file to create a PivotTable that shows how many bikes in each category were sold by each sales outlet. Create the PivotTable so that you can show one year at a time. Use proper number formatting.
5. For this learning activity, use the “Bike_Sales.xlsx” file. Use the file to create a PivotTable that shows the revenue and quantity for each combi-nation of sales outlet, product category and distribution channel. Use proper number formatting.
6. For this learning activity, use the “Bike_Sales.xlsx” file. Use the file to create a PivotTable that shows the quantity sold of each product. Create the PivotTable so that you can show one country at a time. Use proper number formatting.
7. For this learning activity, use the “Fun4Pups.xlsx” file. Create scenarios that match the values in the following table. Show total revenue, total variable expenses, and net income in your scenario summary.
8. For this learning activity, use the “MailCampaign.xlsx” file. Create scenarios that match the values in the following table. Show net revenue and net income in your scenario summary.
Units sold Price per unit Cost per unit
Worst 7,000 10.00 8.00
Expected 10,000 11.00 7.50
Best 15,000 11.00 7.00
Response rate Average order
Bad 0.03 40
Good 0.06 48
Better 0.08 55
Best 0.10 65

AdvancedExcel A97
9. For this learning activity, use the “Fun4Pups.xlsx” file. Use the Goal-Seek tab. Perform a Goal-Seek analysis that shows the number of units sold required to generate $1,750 of net income. Be sure to click on OK to make the changes permanent.
10. For this learning activity, use the “MailCampaign.xlsx” file. Use the Goal-Seek tab. Perform a Goal-Seek analysis that shows the average order size necessary to break even (i.e., have a net income of zero).

Appendix H
Networking BasicsLearning Objectives
By reading and completing the activities in this appendix, you will be able to:
• Describe the concept and purposes of layered network models• Discuss the basic functioning of the OSI networking model• Explain how the TCP/IP networking protocol works• Describe the differences between IPv4 and IPv6
Appendix Outline
IntroductionNetworking Models and Protocols
Learning Activity H.1: To Communicate, Follow the ProtocolsLearning Activity H.2: What Is My IP Address?Learning Activity H.3: Have I Joined the IPv6 World Yet?
Introduction
To utilize the Internet and many of the online communications that many of you may take for granted, it is important to have the appropriate networking infrastructure in place. In this appendix, the details of how that infrastructure works are discussed.
Networking Models and Protocols
Networking protocols and models identify the rules for communication between computers. In other words, they provide guidelines or specifications for how com-puters can communicate over a network. These guidelines can include how data are formatted, addressed, transmitted, routed, and received at the destination. Different protocols exist for different types of communications between computers in differ-ent environments.
Most communication protocols make use of layers in their designs. The purpose of layers is to divide the work between various functions (of the communication pro-cess) and isolate higher layers from work done at lower layers. For example, the lowest layer in all protocols is the physical layer, which handles the physical communication, or sending of bits via electrical, light, or radio signals. Because its role is to emit sig-nals, it isolates the definitions of how messages are packaged at higher layers. Another example is the application layer, the highest layer, which provides application services
A100 AppendixH
like email or Web browsing without having to worry about the transmission part (handled by layers below it).
A wide variety of network protocols are available today. Some are proprietary (when the inner workings of the protocol are known only to the organization that has developed it). An example is Systems Network Architecture (SNA), which was developed by IBM. Many protocols, however, are open, such as TCP/IP. In this appendix, we review two of the main networking protocols or models: Open Sys-tems Interconnection, because it is an international networking model, and TCP/IP, because it is the main protocol behind the Internet.
Open Systems Interconnection (OSI) Networking ModelThe Open Systems Interconnection (OSI) model was defined by the International Standards Organization (ISO). It uses seven layers to define how communication is meant to occur between two computers on a network. As communication occurs, control of and responsibility for the communication are passed from layer to layer, starting at the application layer in the sending computer. Once the physical layer transmits the communication over the communication medium (wired or wireless, as seen in Chapter 7), it is received by the physical layer of the intended computer and then goes up the hierarchy of layers, as seen in Figure H.1.
As you can see in Figure H.1, each of the layers in the OSI networking model performs different functions. Imagine that the sending computer is your personal computer sending a request for a Web page to the receiving computer—in this case, a Web server. The browser sets up the communication, which is handled by the lower- level layers, packaging the communication into messages (at the transport layer), which are broken down into packets (at the network layer), then packaged into frames (at the data link layer), and then sent as bits by the physical layer. The receiving computer receives the bits, which are assembled into frames, which are unpacked into packets, which are assembled into messages, which are handled by the upper layers of the Web server. The various layers would function as follows (simpli-fied for ease of understanding):
L E A R N I N G A C T I V I T Y H . 1
ToCommunicate,FollowtheProtocolsIn this appendix, we will explore networking protocols and models. There are many networking protocols in use today, although two of the most well-known ones are the Open Systems Interconnection (OSI) model and the Transmission Control Protocol/ Internet Protocol (TCP/IP) networking protocol. Select one of them and trace its history. When was it developed or implemented? By whom? Why? What main changes, if any, were made to it over the years? Prepare a two- to three-page paper describing the histo-ry of your selected protocol. In class, form groups with people who have selected the same protocol as you. Compare your findings and then compare the two protocols across groups. What are the key similarities and differences?
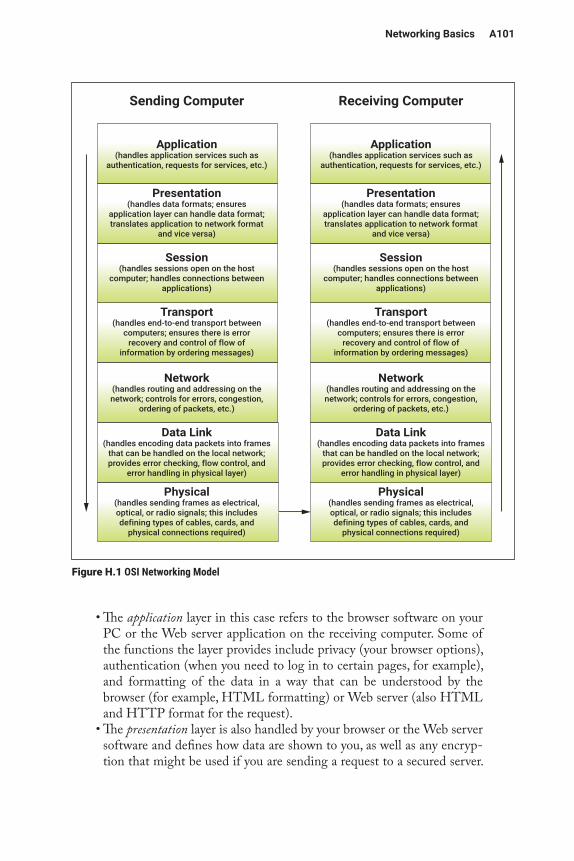
NetworkingBasics A101
• The application layer in this case refers to the browser software on your PC or the Web server application on the receiving computer. Some of the functions the layer provides include privacy (your browser options), authentication (when you need to log in to certain pages, for example), and formatting of the data in a way that can be understood by the browser (for example, HTML formatting) or Web server (also HTML and HTTP format for the request).
• The presentation layer is also handled by your browser or the Web server software and defines how data are shown to you, as well as any encryp-tion that might be used if you are sending a request to a secured server.
Sending Computer
Application(handles application services such as
authentication, requests for services, etc.)
Presentation(handles data formats; ensures
application layer can handle data format; translates application to network format
and vice versa)
Session(handles sessions open on the host
computer; handles connections between applications)
Transport(handles end-to-end transport between
computers; ensures there is error recovery and control of flow of
information by ordering messages)
Network(handles routing and addressing on the network; controls for errors, congestion,
ordering of packets, etc.)
Data Link(handles encoding data packets into frames
that can be handled on the local network; provides error checking, flow control, and
error handling in physical layer)
Physical(handles sending frames as electrical, optical, or radio signals; this includes defining types of cables, cards, and
physical connections required)
Receiving Computer
Application(handles application services such as
authentication, requests for services, etc.)
Presentation(handles data formats; ensures
application layer can handle data format; translates application to network format
and vice versa)
Session(handles sessions open on the host
computer; handles connections between applications)
Transport(handles end-to-end transport between
computers; ensures there is error recovery and control of flow of
information by ordering messages)
Network(handles routing and addressing on the network; controls for errors, congestion,
ordering of packets, etc.)
Data Link(handles encoding data packets into frames
that can be handled on the local network; provides error checking, flow control, and
error handling in physical layer)
Physical(handles sending frames as electrical, optical, or radio signals; this includes defining types of cables, cards, and
physical connections required)
Figure H.1 OSI Networking Model
A102 AppendixH
For the receiving computer, the presentation layer will ensure that the data received from the network layer are translated into a format that the application layer can understand (making the request understandable by the Web server application software).
• The session layer establishes, manages, and terminates connections between applications. On your personal computer, this would involve the various software running concurrently and interfacing to the browser as needed (like printing, for example).
• The transport layer, the first of the layers involved in the actual “commu-nication” part, then packages the communication into messages, ensur-ing that there are mechanisms in place for error recovery if something happens during the transmission and flow control to ensure the infor-mation is received in proper order. This is passed on to the network layer.
• The network layer then breaks down the messages given to it by the transport layer into smaller data units called packets. As part of packag-ing the information, the network layer adds addresses and sequencing information so that packets can be routed on the network. It also estab-lished a virtual circuit, or route, for the packets to get to the destination, taking into account network design and possible congestion, among other factors. This is passed on to the data link layer.
• The data link layer handles transmission on the local network. This involves encoding the packets into what are called frames. Frames have information specific to the type of local network used, whether wired or wireless. The data link layer handles other functions specific to the type of network being used, such as flow control of frames, synchronization of frames, and error control for the physical layer. (Information is added to frames so there can be some checking done at the receiving station that there were no errors in the transmission.) The frames are then trans-mitted via the physical layer.
• The physical layer converts the frames into their bit stream via electrical signals, light signals, or radio signals, depending on the type of network connection used. It then transmits them using the medium attached to the computer (via physical cables or wireless signals).
The OSI model, often called the Internet reference model, is well known but not really implemented in specific networking protocols. Its functioning, however, clearly describes the various roles that need to be performed by layers for communication to exist between two computers. Other networking models often map the OSI model to fewer layers, as will be discussed in the TCP/IP networking protocol.
TCP/IP Networking ProtocolTCP/IP, which is the core networking protocol used on the Internet, is really made up of two protocols: TCP and IP. TCP (Transmission Control Protocol) functions
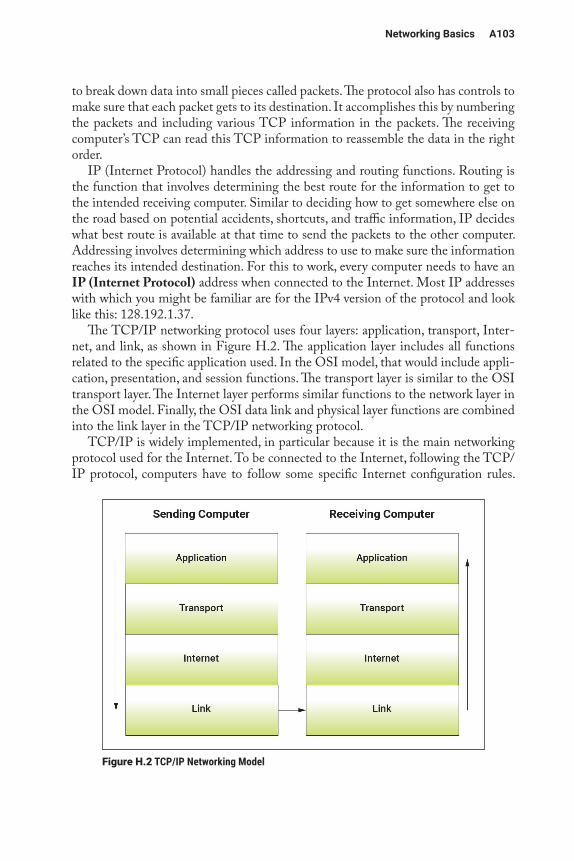
NetworkingBasics A103
to break down data into small pieces called packets. The protocol also has controls to make sure that each packet gets to its destination. It accomplishes this by numbering the packets and including various TCP information in the packets. The receiving computer’s TCP can read this TCP information to reassemble the data in the right order.
IP (Internet Protocol) handles the addressing and routing functions. Routing is the function that involves determining the best route for the information to get to the intended receiving computer. Similar to deciding how to get somewhere else on the road based on potential accidents, shortcuts, and traffic information, IP decides what best route is available at that time to send the packets to the other computer. Addressing involves determining which address to use to make sure the information reaches its intended destination. For this to work, every computer needs to have an IP (Internet Protocol) address when connected to the Internet. Most IP addresses with which you might be familiar are for the IPv4 version of the protocol and look like this: 128.192.1.37.
The TCP/IP networking protocol uses four layers: application, transport, Inter-net, and link, as shown in Figure H.2. The application layer includes all functions related to the specific application used. In the OSI model, that would include appli-cation, presentation, and session functions. The transport layer is similar to the OSI transport layer. The Internet layer performs similar functions to the network layer in the OSI model. Finally, the OSI data link and physical layer functions are combined into the link layer in the TCP/IP networking protocol.
TCP/IP is widely implemented, in particular because it is the main networking protocol used for the Internet. To be connected to the Internet, following the TCP/IP protocol, computers have to follow some specific Internet configuration rules.
Figure H.2 TCP/IP Networking Model
A104 AppendixH
Today, many computers are set to obtain this configuration dynamically, and we will discuss this later in this section. However, it is important to understand what role each configuration element plays.
To connect to the Internet, computers need to have an IP address, just like the one you identified in Learning Activity H.2. They also need a domain name server (DNS) address, subnet mask address, and gateway address. These various compo-nents are described below.
IP AddressAn IP address is composed of a computer and a domain address. The domain is the last part we normally see as .com, .edu, .net, and .ca. Most countries besides the United States tend to have their own domains, such as .uk, .fr, .cn, and so on. In reality, IP addresses are numbers, and a given address, such as 192.128.1.34, refers to a specific computer.
Domain Name Server (DNS)Most people would have a hard time remembering an actual IP address, such as the one above. That is why addresses, in particular websites, are given as names, such as http://www.espn.com. In the TCP/IP protocol, converting these easier-to-remember addresses, which cannot be used for actual communication, to their real address num-bers is the role of the domain name server (DNS). Your school probably has one or two DNS servers (a backup server is always recommended) dedicated to handling domain name requests. When a computer needs to send a message to another com-puter (not knowing the IP address), it requests that address from the DNS server. This is the process known as address resolution. The DNS server knows its local IP addresses. If the requested address is not one of its own, it will send a request to a root DNS server (higher up in the hierarchy of domains) until it gets the information requested. Of course, if you know the actual IP address of a website, you can request to connect directly to it.
L E A R N I N G A C T I V I T Y H . 2
WhatIsMyIPAddress?Every computer that connects to the Internet requires an IP address. What is your IP address? To find out what your current IP address is, go to http://whatismyipaddress .com/. Once you reach the page, click on the box on the map that says “Click for more details” and look at the information. Bring a copy of the report to class. Be prepared to discuss the following:
1. How is the website able to identify your IP address?2. Do you think it is accurate? How can you verify?3. How do they know your location? How accurate is it?
NetworkingBasics A105
Subnet MaskSubnets are small networks that when connected together make up the organiza-tion’s network. At your school, your department might have its own subnetwork, which is part of the school’s network. To facilitate the communication among com-puters within subnets and among subnets, the subnet mask is added to the TCP/IP configuration. The role of the subnet mask is to identify which computers are part of a computer’s subnet and which are not.
The typical subnet mask takes the form of 255.255.255.0. When translated into its 32-bit address, this is equal to 11111111111111111111111100000000, or, in other words, 24 “1” bits followed by eight “0” bits. Each 255 represents eight “1” bits. The subnet mask indicates that all computers that have the same first three bytes (first 24 bits), because of the three 255 numbers in their address, are part of the same subnet. When a computer wants to send a message to another computer, the TCP/IP protocol compares the address of the requesting computer with the address of the destination computer. Looking at the subnet mask, TCP/IP can then deter-mine whether the message should go outside the subnet (and be sent to a gateway). For example, if Computer 1, with IP address 128.173.175.49, wants to send a mes-sage to Computer 2, with IP address 128.173.175.89, and a subnet mask of 255.255.255.0 is used, the computer will conclude that Computer 2 is within its subnet, since the first three bytes of its address (128.173.175) are the same as the first three bytes of the destination computer’s address (128.173.175). If the receiving computer had an address of 128.173.188.32, then it would not be in the same sub-net, and the transmission would be sent to the gateway. However, if a subnet mask of 255.255.0.0 were used, then the receiving computer with an address of 128.173.188.32 would be in the same subnet, as only the first two bytes would need to match.
GatewayThe gateway address is the address of the router that controls access to the organiza-tion’s network. When a computer wants to communicate with a computer outside of
L E A R N I N G A C T I V I T Y H . 3
HaveIJoinedtheIPv6WorldYet?The addressing scheme for the Internet previously discussed is referred to as IPv4. A newer addressing scheme is available, called IPv6. Find out if you are able to use some of the IPv6 functions by going to http://www.test-ipv6.com. Click for more information on failed tests and then click on the technical information tab. Bring a copy of your re-port to class. Research some of the concepts related to IPv6 at ipv6.com, and be pre-pared to answer the following questions:
1. What are the tests more specifically trying to find out?2. How do they access the information about your computer?3. Why do you think you are able to or not able to use IPv6?
A106 AppendixH
the organization’s network, it needs the address of the gateway to know how to go outside the network. Any noninternal requests are then handled by the gateway.
Dynamic AddressingWhen computers are not constantly connected to the Internet, they do not need a permanent IP address. Instead, the computers request (from the Internet service provider) an IP address for the duration of the session. This is called dynamic addressing and is widely used by most Internet service providers and large organi-zations, such as your school.
IPv4 versus IPv6As stated in the book, Internet Protocol Version 4 or IPv4 is the older Internet addressing scheme, and it has now run out of addresses to give away. It operates at the network layer of the OSI protocol, or the network layer of the TCP/IP protocol. IPv4 addresses are 4 bytes long or 32 bits long. An actual address in computer lan-guage would be something like 10000000101011001010101100100101, which would be very hard to handle and remember. Therefore, addresses are split into 4 bytes, like this: 10000000 10101100 10101011 00100101. Each byte is then con-verted into its decimal equivalent and separated by a period, resulting in something like 128.173.171.37.
Because we have run out of addresses to connect computers or hosts to the net-works, IPv6 was developed. IPv6 has many addresses because it uses 128 bits as compared to the 32 bits in IPv4. It also was developed with the goal of addressing a few other problems. It includes better security, better quality of service (making sure packets are delivered properly), and better performance (by eliminating network address translation and improving traffic flow), among other improvements.
Summary
In this appendix, we explored some basic networking concepts that complement the material in Chapter 7. We started by describing what networking protocols and models are and how they make use of layers. We then discussed both the Open Sys-tems Interconnection (OSI) and Transmission Control Protocol/Internet Protocol (TCP/IP) networking models. Finally, we discussed the differences between IPv4 and IPv6.
Here are the main points discussed in this appendix:
• Networking protocols and models represent the rules for communica-tion between computers. Most network protocols make use of layers in their designs, which divide the work between various functions (of com-munication) and isolate higher layers from work done at lower layers.
• The Open Systems Interconnection (OSI) model was defined by the International Standards Organization (ISO). It uses seven layers to
NetworkingBasics A107
define how communication occurs between two computers on a net-work: application layer, presentation layer, session layer, transport layer, network layer, data link layer, and physical layer. As communication occurs, control of and responsibility for the communication is passed from layer to layer, starting at the application layer on the sending com-puter down the hierarchy to the physical layer. When the transmission is received at the physical layer of the intended computer, it goes back up the hierarchy of layers to the application layer. The OSI model is often called the Internet reference model.
• The TCP/IP networking protocol is the core networking protocol used on the Internet. It has two parts: TCP and IP. TCP (Transmission Con-trol Protocol) breaks down data into small pieces called packets, num-bers packets, and handles flow control. IP (Internet protocol) handles the addressing and routing functions, determining the best route for the information to get to the intended receiving computer and determining which address to use to make sure the information reaches its intended destination. The TCP/IP networking protocol uses four layers: applica-tion, transport, Internet, and link. TCP/IP configurations include an IP address, a domain name server (DNS) address, a gateway address, and a subnet mask address. When computers are not constantly connected to the Internet, they do not need a permanent IP address. Instead, the computers can request an IP address for the duration of their session to the Internet service provider, which is called dynamic addressing.
• Internet Protocol Version 4, or IPv4, is the older Internet addressing scheme, and it has now run out of addresses to give away. It operates at the network layer of the OSI protocol, or the network layer of the TCP/IP protocol. IPv4 addresses are 4 bytes long (32 bits). Because we have run out of addresses, in addition to solving a few other problems, IPv6 was developed. IPv6 has many addresses because it uses 128 bits as com-pared to the 32 bits in IPv4. It includes better security, better quality of service (making sure packets are delivered properly), and better perfor-mance (by eliminating network address translation and improving traf-fic flow), among other improvements.
Review Questions
1. What is a networking protocol? 2. What is the purpose of layers in a networking protocol or model? 3. What is a proprietary networking protocol? 4. Identify the layers in the Open Systems Interconnection (OSI) model. 5. What are the different units of data used (or packaged) at the physical,
data link, network, and transport layers of the OSI model?
A108 AppendixH
6. What are the functions of the two protocols that make up the TCP/IP protocol?
7. Identify the layers of the TCP/IP protocol and their functions. 8. Explain the role of the subnet mask, the DNS address, the gateway
address, and the IP address in connecting to the Internet. 9. What is dynamic addressing, and why is it needed? 10. What are the main differences between IPv4 and IPv6? Why did we need
IPv6?
Reflection Questions
1. What is the most important thing you learned in this appendix? Why is it important?
2. What topics are unclear? What about them is unclear? 3. What relationships do you see between what you learned in this appendix
and what you learned in other parts of the text? 4. Compare and contrast the TCP/IP and OSI networking models. Why do
you think the different models are proposed? 5. Explain why error checking seems to be performed at several layers in the
networking models we discussed. 6. Why is actual transmission only handled at the physical layer? 7. A computer has the following IP address: 128.156.3.41. It wants to send a
transmission to Computer A (IP address: 128.156.4.32) and Computer B (IP address: 128.154.5.31). Which computer will receive the transmission without going outside the subnet if the subnet mask is 255.255.0.0? What should the subnet mask be for all computers to be on the same subnet?
8. Create an actual IPv6 address. 9. Why is dynamic addressing so popular today? Identify a list of possible
advantages and disadvantages. 10. What do you think happens if an organization’s DNS server is down?
Glossary
Application layer: The layer in a networking protocol responsible for application func-tions such as privacy, authentication, and formatting.
Data link layer: The layer in a networking protocol responsible for handling transmis-sion on the local network, including encoding the packets into frames, providing flow control of frames, synchronizing frames, and providing error control for the physical layer.
Domain Name System (DNS): A server that performs address resolution, which is con-verting a named address to its actual IP address (numbers).
Dynamic addressing: When computers request an IP address for the duration of their session from the Internet provider instead of having a permanent address.
NetworkingBasics A109
Gateway: A router that controls access to an organization’s network.Internet Protocol Version 4 (IPv4): An older Internet addressing scheme composed of 4
bytes or 32 bits.Internet Protocol Version 6 (IPv6): A new Internet addressing scheme composed of 128
bits.Internet reference model: The name sometimes given to the OSI model.IP (Internet Protocol): A protocol that is part of TCP/IP. Its functions include handling
addressing and routing.IP address: The address needed to connect to the Internet, composed of a computer
and a domain address.Layers: A way to divide the work between various functions needed for communica-
tion and isolate higher layers from work done at lower layers in a network protocol.Networking model: Defines the rules for communication between computers, provid-
ing guidelines or specifications for how computers can communicate over a net-work.
Networking protocol: Defines the rules for communication between computers, pro-viding guidelines or specifications for how computers can communicate over a network.
Network layer: The layer in a networking protocol responsible for breaking messages into packets and handling addressing and routing functions.
Open Systems Interconnection (OSI) model: A networking model defined by the Inter-national Standards Organization (OSI) that uses seven layers.
Physical layer: The layer in a networking protocol responsible for converting frames into their bit stream via electrical signals, light signals, or radio signals, depending on the type of network connection used.
Presentation layer: The layer in a networking protocol responsible for handling pre-sentation services, such as defining how data are shown to you, encrypting, and translating data into a format the application layer can handle.
Session layer: The layer in a networking protocol responsible for establishing, manag-ing, and terminating connections between applications.
Subnet mask: Address used to identify which computers are part of a computer’s subnet and which are not.
Systems Network Architecture (SNA): A proprietary network protocol developed by IBM.
TCP (Transmission Control Protocol): A protocol that is part of TCP/IP. Its functions include breaking data into packets and providing end-to-end error control.
TCP/IP (Transmission Control Protocol/Internet Protocol): The networking protocol used on the Internet. It uses four layers.
Transport layer: The layer in a networking protocol responsible for packaging infor-mation into messages, providing error recovery, and providing flow control.

Appendix I
Security and PrivacyLearning Objectives
By reading and completing the activities in this appendix, you will be able to:
• Explain how to develop an information systems security plan• Discuss issues related to outsourcing of information systems security• Identify various information systems security protocols and standards• Describe jobs related to information systems security and certifications
available for information systems security professionals• Identify various information systems security and privacy organizations
Appendix Outline
IntroductionInformation Systems Security Plan
Learning Activity I.1: Managing Security or Risks?Learning Activity I.2: A Plan for IS SecurityLearning Activity I.3: What Do They Do? (IS Security Organizations)
Information Systems Security OrganizationsInformation Systems Security Jobs and Certifications
Learning Activity I.4: IS Security Jobs for MeInformation Privacy Organizations
Learning Activity I.5: What Do They Do? (Information Privacy Organizations)Learning Activity I.6: Privacy around the WorldLearning Activity I.7: Online Piracy
Introduction
In this appendix, we will discuss the details of security and privacy decisions with which organizations must regularly deal. By exploring these issues from an organiza-tion’s perspective, you will better understand how to ensure that risks are properly handled without them taking over all of an organization’s technology-related budget.
Information Systems Security Plan
An information systems (IS) security plan is a comprehensive document that iden-tifies the security threats an organization might face and all the controls imple-mented to address those threats. The plan also includes both information security
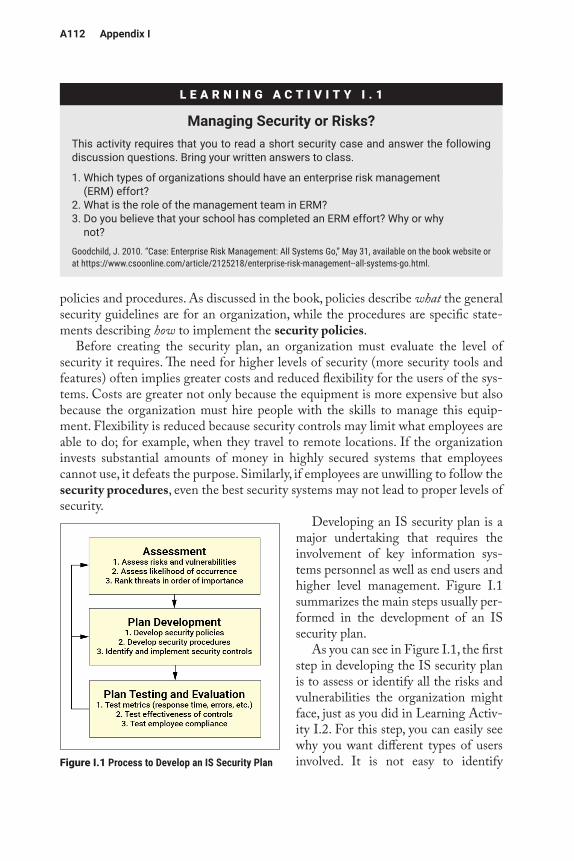
A112 Appendix I
policies and procedures. As discussed in the book, policies describe what the general security guidelines are for an organization, while the procedures are specific state-ments describing how to implement the security policies.
Before creating the security plan, an organization must evaluate the level of security it requires. The need for higher levels of security (more security tools and features) often implies greater costs and reduced flexibility for the users of the sys-tems. Costs are greater not only because the equipment is more expensive but also because the organization must hire people with the skills to manage this equip-ment. Flexibility is reduced because security controls may limit what employees are able to do; for example, when they travel to remote locations. If the organization invests substantial amounts of money in highly secured systems that employees cannot use, it defeats the purpose. Similarly, if employees are unwilling to follow the security procedures, even the best security systems may not lead to proper levels of security.
Developing an IS security plan is a major undertaking that requires the involvement of key information sys-tems personnel as well as end users and higher level management. Figure I.1 summarizes the main steps usually per-formed in the development of an IS security plan.
As you can see in Figure I.1, the first step in developing the IS security plan is to assess or identify all the risks and vulnerabilities the organization might face, just as you did in Learning Activ-ity I.2. For this step, you can easily see why you want different types of users involved. It is not easy to identify
L E A R N I N G A C T I V I T Y I . 1
ManagingSecurityorRisks?This activity requires that you to read a short security case and answer the following discussion questions. Bring your written answers to class.
1. Which types of organizations should have an enterprise risk management (ERM) effort?
2. What is the role of the management team in ERM?3. Do you believe that your school has completed an ERM effort? Why or why
not?
Goodchild, J. 2010. “Case: Enterprise Risk Management: All Systems Go,” May 31, available on the book website or at https://www.csoonline.com/article/2125218/enterprise-risk-management--all-systems-go.html.
Figure I.1 Process to Develop an IS Security Plan
SecurityandPrivacy A113
threats, although some common ones should be obvious: malicious attacks like hackers breaking into the systems, disasters (e.g., floods, fire), breakage (e.g., power loss, failures), or even viruses forwarded by careless employees. Human errors also need to be considered. Another difficulty with identifying threats is that all comput-ing environments of the organization need to be considered. This includes websites, intranets, communication circuits, servers, client computers, mobile devices, soft-ware, and people, to name a few. There are several ways to assess how the organiza-tion is doing related to those threats. For example, the organization can look at its system usage, events, and other alarm data in its logs or perform its own controlled security breaches to see if they are vulnerable. Finally, some people are critical to the operation of the system, and if these people are lost or incapacitated, this could pose a serious risk to the organization. After the risks are identified, they are ranked from most critical to least critical.
In the second phase of the process to develop an IS security plan, the organiza-tion needs to identify the security controls to be implemented, starting with the most critical risks. The controls are evaluated within the context of the broader secu-rity policies and procedures. Most technologies and controls are described in Chap-ter 8 of the book. The security plan will list which systems are in place to protect against each threat. Experts agree that automated enforcement mechanisms provide the best security. Such technologies provide automatic responses to security events (like disabling a user’s account automatically after a number of failed login attempts) or are able to detect, identify, and stop intruders before damage can be done, such as by using an entrapment server. As discussed, access control is also an important part of security. Therefore, the security plan will include information related to who has the right to access each service, how access is established, and what exceptions exist. Finally, the plan will also discuss disaster recovery.
After the development of the IS security plan, and periodically thereafter, the plan needs to be evaluated and tested. There are several ways to test a security plan. Organizations often use drills, where they create security breaches meant to test the actions taken (which should conform to the plan). Metrics are measured, such as
L E A R N I N G A C T I V I T Y I . 2
APlanforISSecuritySelect one of the following small businesses in your local environment or one assigned by your instructor:
• A local pizza shop• A 100-room hotel from a national chain• A local Internet café• A local office of a large accounting firm
In small groups, brainstorm all the potential information security risks this business could face. After you have completed the list, indicate the best ways to prevent these risks from occurring and then identify what the company should do if they indeed happen.
A114 Appendix I
how long it takes to get back online or how long it takes to resume normal business operations. Other evaluations exist to see if users are complying with security mea-sures or whether the controls are effective (e.g., whether attacks are being prevented, whether data are accurate). Since computing environments tend to change rapidly today, the security plan must be reevaluated regularly.
Fitzgerald and Dennis (1999) list the following features of a good security plan:
• The security controls should be as simple as possible.• It is always preferable to prevent a security breach than to detect and
correct it.• There must be a balance between security and usability so that the secu-
rity controls provide just enough security but do not prevent users from being able to perform their tasks. In a perfect world, everything would be secure, but who could get their job done?
• Security controls performed by computers are more reliable than those requiring human intervention.
• Security controls should apply to everyone in the organization.• Security controls should include clear specifications of responsibilities.• Security controls should be failure-safe, using some of the components
presented in the disaster recovery discussion in Chapter 8, for example. If they fail, the networks and systems should default to a condition in which everyone is denied access.
• Security controls should be well documented but not available to everyone.• A security policy should have clear goals and objectives.• A security policy should have not only policies but also enforcement
procedures.• Personnel roles should be clearly established in a security plan.
Outsourcing SecurityAs part of the IS security plan, the organization may wish to outsource some or all of its security functions. Is this wise? It depends on the organization and what is outsourced. For a small firm with very limited knowledge, it may make sense to outsource security to a specialized firm. Even for larger organizations, there are some key security functions that make sense to outsource, such as vulnerability scanning or forensics. Another function often outsourced is monitoring of firewalls and logs. One function that should not be outsourced is security management. Examples of managed security providers that do provide outsourcing services for security include VeriSign, Verizon Enterprise Solutions, and Qualys.
Information Systems Security Protocols and StandardsSecurity protocols are guidelines for how to protect information during transmis-sions, ensuring that communication is secure. A wide variety of protocols are avail-able for organizations to secure transmissions, both wired and wireless. Examples of
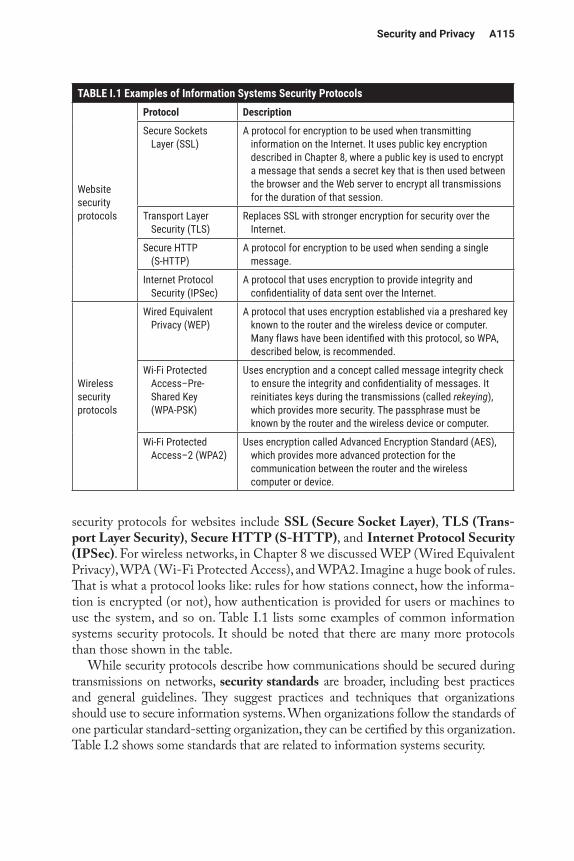
SecurityandPrivacy A115
security protocols for websites include SSL (Secure Socket Layer), TLS (Trans-port Layer Security), Secure HTTP (S-HTTP), and Internet Protocol Security (IPSec). For wireless networks, in Chapter 8 we discussed WEP (Wired Equivalent Privacy), WPA (Wi-Fi Protected Access), and WPA2. Imagine a huge book of rules. That is what a protocol looks like: rules for how stations connect, how the informa-tion is encrypted (or not), how authentication is provided for users or machines to use the system, and so on. Table I.1 lists some examples of common information systems security protocols. It should be noted that there are many more protocols than those shown in the table.
While security protocols describe how communications should be secured during transmissions on networks, security standards are broader, including best practices and general guidelines. They suggest practices and techniques that organizations should use to secure information systems. When organizations follow the standards of one particular standard-setting organization, they can be certified by this organization. Table I.2 shows some standards that are related to information systems security.
TABLE I.1 Examples of Information Systems Security Protocols
Website security protocols
Protocol Description
Secure Sockets Layer (SSL)
A protocol for encryption to be used when transmitting information on the Internet. It uses public key encryption described in Chapter 8, where a public key is used to encrypt a message that sends a secret key that is then used between the browser and the Web server to encrypt all transmissions for the duration of that session.
Transport Layer Security (TLS)
Replaces SSL with stronger encryption for security over the Internet.
Secure HTTP (S-HTTP)
A protocol for encryption to be used when sending a single message.
Internet Protocol Security (IPSec)
A protocol that uses encryption to provide integrity and confidentiality of data sent over the Internet.
Wireless security protocols
Wired Equivalent Privacy (WEP)
A protocol that uses encryption established via a preshared key known to the router and the wireless device or computer. Many flaws have been identified with this protocol, so WPA, described below, is recommended.
Wi-Fi Protected Access–Pre-Shared Key (WPA-PSK)
Uses encryption and a concept called message integrity check to ensure the integrity and confidentiality of messages. It reinitiates keys during the transmissions (called rekeying), which provides more security. The passphrase must be known by the router and the wireless device or computer.
Wi-Fi Protected Access–2 (WPA2)
Uses encryption called Advanced Encryption Standard (AES), which provides more advanced protection for the communication between the router and the wireless computer or device.
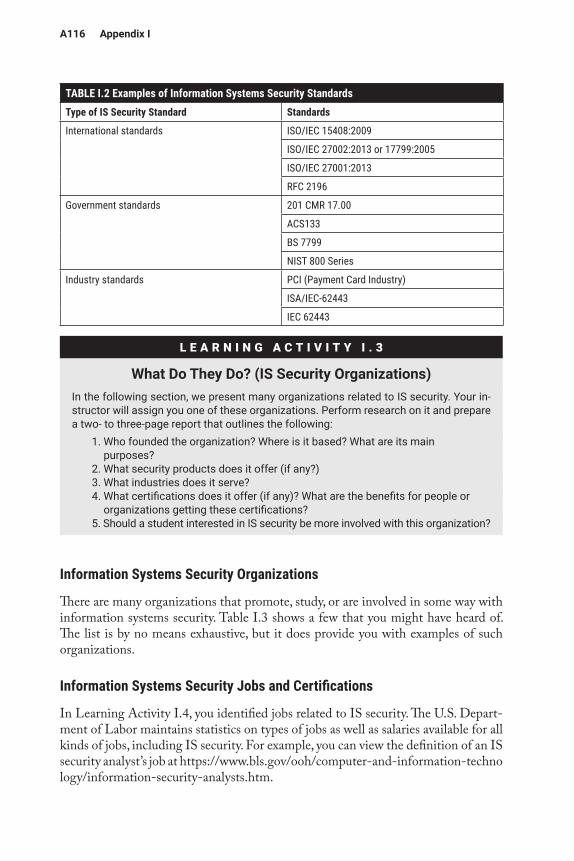
A116 Appendix I
Information Systems Security Organizations
There are many organizations that promote, study, or are involved in some way with information systems security. Table I.3 shows a few that you might have heard of. The list is by no means exhaustive, but it does provide you with examples of such organizations.
Information Systems Security Jobs and Certifications
In Learning Activity I.4, you identified jobs related to IS security. The U.S. Depart-ment of Labor maintains statistics on types of jobs as well as salaries available for all kinds of jobs, including IS security. For example, you can view the definition of an IS security analyst’s job at https://www.bls.gov/ooh/computer-and-information-techno logy/information-security-analysts.htm.
TABLE I.2 Examples of Information Systems Security StandardsType of IS Security Standard Standards
International standards ISO/IEC 15408:2009
ISO/IEC 27002:2013 or 17799:2005
ISO/IEC 27001:2013
RFC 2196
Government standards 201 CMR 17.00
ACS133
BS 7799
NIST 800 Series
Industry standards PCI (Payment Card Industry)
ISA/IEC-62443
IEC 62443
L E A R N I N G A C T I V I T Y I . 3
WhatDoTheyDo?(ISSecurityOrganizations)In the following section, we present many organizations related to IS security. Your in-structor will assign you one of these organizations. Perform research on it and prepare a two- to three-page report that outlines the following:
1. Who founded the organization? Where is it based? What are its main purposes?
2. What security products does it offer (if any?)3. What industries does it serve?4. What certifications does it offer (if any)? What are the benefits for people or
organizations getting these certifications?5. Should a student interested in IS security be more involved with this organization?
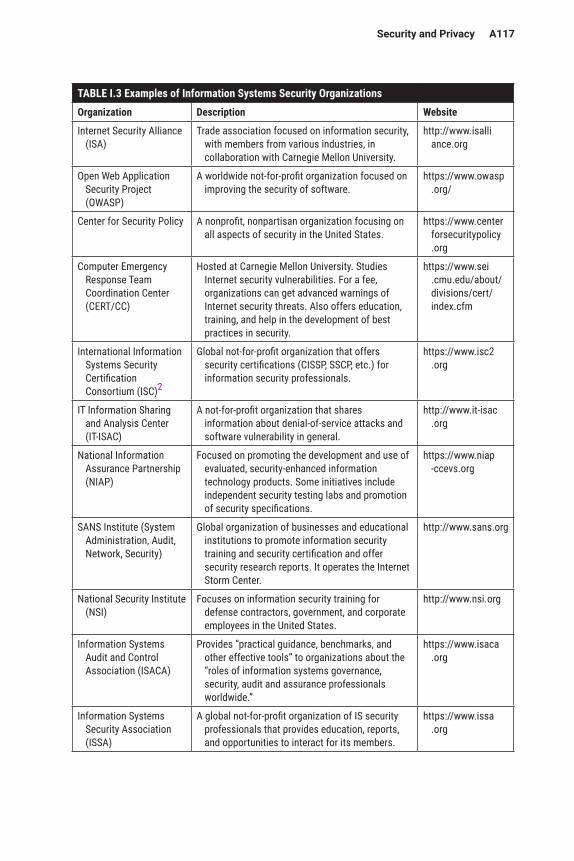
SecurityandPrivacy A117
TABLE I.3 Examples of Information Systems Security OrganizationsOrganization Description Website
Internet Security Alliance (ISA)
Trade association focused on information security, with members from various industries, in collaboration with Carnegie Mellon University.
http://www.isalli ance.org
Open Web Application Security Project (OWASP)
A worldwide not-for-profit organization focused on improving the security of software.
https://www.owasp .org/
Center for Security Policy A nonprofit, nonpartisan organization focusing on all aspects of security in the United States.
https://www.center forsecuritypolicy .org
Computer Emergency Response Team Coordination Center (CERT/CC)
Hosted at Carnegie Mellon University. Studies Internet security vulnerabilities. For a fee, organizations can get advanced warnings of Internet security threats. Also offers education, training, and help in the development of best practices in security.
https://www.sei .cmu.edu/about/divisions/cert/index.cfm
International Information Systems Security Certification Consortium (ISC)2
Global not-for-profit organization that offers security certifications (CISSP, SSCP, etc.) for information security professionals.
https://www.isc2 .org
IT Information Sharing and Analysis Center (IT-ISAC)
A not-for-profit organization that shares information about denial-of-service attacks and software vulnerability in general.
http://www.it-isac .org
National Information Assurance Partnership (NIAP)
Focused on promoting the development and use of evaluated, security-enhanced information technology products. Some initiatives include independent security testing labs and promotion of security specifications.
https://www.niap -ccevs.org
SANS Institute (System Administration, Audit, Network, Security)
Global organization of businesses and educational institutions to promote information security training and security certification and offer security research reports. It operates the Internet Storm Center.
http://www.sans.org
National Security Institute (NSI)
Focuses on information security training for defense contractors, government, and corporate employees in the United States.
http://www.nsi.org
Information Systems Audit and Control Association (ISACA)
Provides “practical guidance, benchmarks, and other effective tools” to organizations about the “roles of information systems governance, security, audit and assurance professionals worldwide.”
https://www.isaca .org
Information Systems Security Association (ISSA)
A global not-for-profit organization of IS security professionals that provides education, reports, and opportunities to interact for its members.
https://www.issa .org
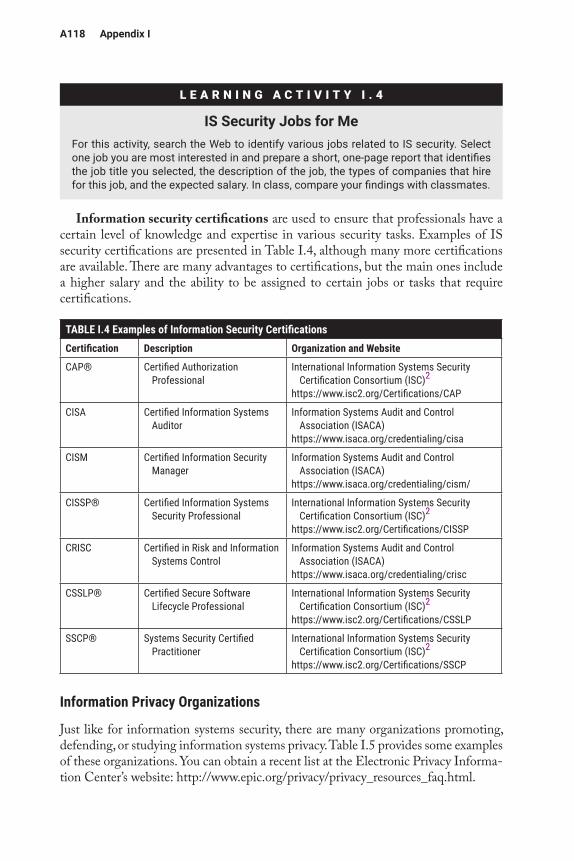
A118 Appendix I
Information security certifications are used to ensure that professionals have a certain level of knowledge and expertise in various security tasks. Examples of IS security certifications are presented in Table I.4, although many more certifications are available. There are many advantages to certifications, but the main ones include a higher salary and the ability to be assigned to certain jobs or tasks that require certifications.
Information Privacy Organizations
Just like for information systems security, there are many organizations promoting, defending, or studying information systems privacy. Table I.5 provides some examples of these organizations. You can obtain a recent list at the Electronic Privacy Informa-tion Center’s website: http://www.epic.org/privacy/privacy_resources_faq.html.
TABLE I.4 Examples of Information Security CertificationsCertification Description Organization and Website
CAP® Certified Authorization Professional
International Information Systems Security Certification Consortium (ISC)2
https://www.isc2.org/Certifications/CAP
CISA Certified Information Systems Auditor
Information Systems Audit and Control Association (ISACA)
https://www.isaca.org/credentialing/cisa
CISM Certified Information Security Manager
Information Systems Audit and Control Association (ISACA)
https://www.isaca.org/credentialing/cism/
CISSP® Certified Information Systems Security Professional
International Information Systems Security Certification Consortium (ISC)2
https://www.isc2.org/Certifications/CISSP
CRISC Certified in Risk and Information Systems Control
Information Systems Audit and Control Association (ISACA)
https://www.isaca.org/credentialing/crisc
CSSLP® Certified Secure Software Lifecycle Professional
International Information Systems Security Certification Consortium (ISC)2
https://www.isc2.org/Certifications/CSSLP
SSCP® Systems Security Certified Practitioner
International Information Systems Security Certification Consortium (ISC)2
https://www.isc2.org/Certifications/SSCP
L E A R N I N G A C T I V I T Y I . 4
ISSecurityJobsforMeFor this activity, search the Web to identify various jobs related to IS security. Select one job you are most interested in and prepare a short, one-page report that identifies the job title you selected, the description of the job, the types of companies that hire for this job, and the expected salary. In class, compare your findings with classmates.
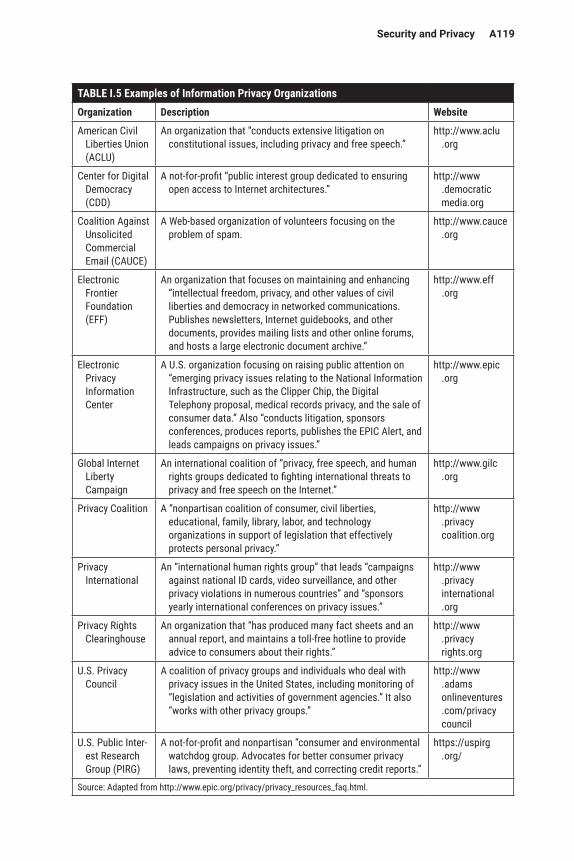
SecurityandPrivacy A119
TABLE I.5 Examples of Information Privacy OrganizationsOrganization Description Website
American Civil Liberties Union (ACLU)
An organization that “conducts extensive litigation on constitutional issues, including privacy and free speech.”
http://www.aclu .org
Center for Digital Democracy (CDD)
A not-for-profit “public interest group dedicated to ensuring open access to Internet architectures.”
http://www .democratic media.org
Coalition Against Unsolicited Commercial Email (CAUCE)
A Web-based organization of volunteers focusing on the problem of spam.
http://www.cauce .org
Electronic Frontier Foundation (EFF)
An organization that focuses on maintaining and enhancing “intellectual freedom, privacy, and other values of civil liberties and democracy in networked communications. Publishes newsletters, Internet guidebooks, and other documents, provides mailing lists and other online forums, and hosts a large electronic document archive.”
http://www.eff .org
Electronic Privacy Information Center
A U.S. organization focusing on raising public attention on “emerging privacy issues relating to the National Information Infrastructure, such as the Clipper Chip, the Digital Telephony proposal, medical records privacy, and the sale of consumer data.” Also “conducts litigation, sponsors conferences, produces reports, publishes the EPIC Alert, and leads campaigns on privacy issues.”
http://www.epic .org
Global Internet Liberty Campaign
An international coalition of “privacy, free speech, and human rights groups dedicated to fighting international threats to privacy and free speech on the Internet.”
http://www.gilc .org
Privacy Coalition A “nonpartisan coalition of consumer, civil liberties, educational, family, library, labor, and technology organizations in support of legislation that effectively protects personal privacy.”
http://www .privacy coalition.org
Privacy International
An “international human rights group” that leads “campaigns against national ID cards, video surveillance, and other privacy violations in numerous countries” and “sponsors yearly international conferences on privacy issues.”
http://www .privacy international .org
Privacy Rights Clearinghouse
An organization that “has produced many fact sheets and an annual report, and maintains a toll-free hotline to provide advice to consumers about their rights.”
http://www .privacy rights.org
U.S. Privacy Council
A coalition of privacy groups and individuals who deal with privacy issues in the United States, including monitoring of “legislation and activities of government agencies.” It also “works with other privacy groups.”
http://www .adams onlineventures .com/privacy council
U.S. Public Inter- est Research Group (PIRG)
A not-for-profit and nonpartisan “consumer and environmental watchdog group. Advocates for better consumer privacy laws, preventing identity theft, and correcting credit reports.”
https://uspirg .org/
Source: Adapted from http://www.epic.org/privacy/privacy_resources_faq.html.
A120 Appendix I
Summary
In this appendix, we explored additional concepts related to information security and privacy to complement the material in the book. We started by discussing the information systems security plan, including whether to outsource some security functions. We then discussed IS security protocols and standards before exploring IS security jobs and certifications. Finally, we discussed IS security and information privacy organizations. Here are the main points discussed in this appendix:
• A security plan is a comprehensive document that identifies the security threats a company might face and all the controls implemented to
L E A R N I N G A C T I V I T Y I . 5
WhatDoTheyDo?(InformationPrivacyOrganizations)In the following section, we present many organizations related to information privacy. Your instructor will assign you one of these organizations. Perform research on it and prepare a two- to three-page report that outlines the following:
1. Who founded the organization? Where is it based? What are its main purposes?
2. What privacy products does it offer (if any)?3. What industries does it serve?4. Should a student interested in information privacy be more involved with this
organization?
L E A R N I N G A C T I V I T Y I . 6
PrivacyaroundtheWorldInformation privacy issues vary widely around the world. For this activity, select a coun-try you are not very familiar with (or your instructor might assign you one) and perform research on its privacy laws or status. Summarize what you found in a paragraph or two to report to the class. You can use articles found in the trade press and also look at the Center for Democracy and Technology’s website on international privacy: https://cdt .org/insights/international-free-expression-on-the-internet-resources/.
L E A R N I N G A C T I V I T Y I . 7
OnlinePiracyThis activity helps you learn more about information piracy online. Go to the website of the Recording Industry Association of America: https://www.riaa.com/report-piracy/. Then write a short report answering the following questions:
1. What is online piracy and why is it a problem?2. Why is the music industry a leader in trying to control online piracy?3. What other environments would online piracy apply to?
SecurityandPrivacy A121
address those threats. The plan also includes both information systems security policies and procedures. Policies describe what the general secu-rity guidelines are for an organization. Procedures are specific statements describing how to implement the security policies. Developing an IS security plan has three main steps: (1) identifying and ranking the risks the organization might face, (2) identifying security controls to be implemented, and (3) testing and evaluating the plan periodically.
• Outsourcing some or all security functions depends on the expertise available in the organization. Some key security functions are often out-sourced, such as vulnerability scanning, forensics, and monitoring of firewalls and logs. One function that should never be outsourced is secu-rity management.
• Security protocols are guidelines for how to protect information during transmission, ensuring that communication is secure. A wide variety of protocols are available for organizations to secure transmissions, both wired and wireless. We briefly described SSL (Secure Socket Layer), TLS (Transport Layer Security), S-HTTP (secure HTTP), IPSec (Internet Protocol Security), WEP (Wired Equivalent Privacy), WPA (Wi-Fi Protected Access), and WPA2. Security standards include best practices and general guidelines regarding security.
• Information systems security certifications are used to ensure that pro-fessionals have a certain level of knowledge and expertise in various security tasks. Examples of IS security certification include CAP®, CISA, CISM, CISSP®, CRISC, CSSLP®, and SSCP®.
• There are many organizations that promote, study, or are involved in some way with information systems security. We reviewed a large number of them. An updated list can be obtained on the National Institute of Stan-dards and Technology’s security-focused website: http://csrc.nist.gov. Just like for information systems security, there are many organizations promoting, defending, or studying information systems privacy. A recent list can be obtained at the Electronic Privacy Information Center’s web-site: http://www.epic.org/privacy/privacy_resources_faq.html.
Review Questions
1. What is an information systems security plan? 2. What is the difference between information systems security policies and
procedures? 3. Why should organizations first evaluate the level of security they need
before developing their security plan? 4. What are the main phases in the development of an IS security plan? 5. When does it make sense for an organization to outsource IS security? 6. What IS security functions should never be outsourced?
A122 Appendix I
7. What is an IS security protocol? Give an example of one such protocol. 8. What is an IS security standard? Give an example of one such standard. 9. What is the purpose of IS security certifications? What are the advantages
for people who have those certifications? 10. What do most organizations related to information systems security have
in common? What about information privacy organizations?
Reflection Questions
1. What is the most important thing you learned in this appendix? Why is it important?
2. What topics are unclear? What about them is unclear? 3. What relationships do you see between what you learned in this appendix
and what you learned in other parts of the text? 4. Write a security policy statement regarding wireless network access at
your school and then write a security procedure related to that policy. 5. Why does the development of an IS security plan require involvement
from end users? 6. How does the IS security plan relate to risk management, discussed in
Learning Activity I.1 of this appendix and in the sections in Chapter 8 of the book?
7. How do IS security protocols relate to network protocols like TCP/IP or OSI, discussed in Appendix H?
8. What are differences and similarities between organizations being security certified and individuals being security certified?
9. With so many privacy organizations in existence, why are there still privacy concerns? Will privacy be less of an issue in the future?
10. Is online piracy an information security or an information privacy issue?
References
Fitzgerald, J., & A. Dennis. 1999. Business Data Communications and Networking. New York: John Wiley & Sons.
Glossary
CAP® (Certified Authorization Professional): Certification offered by the International Information Systems Security Certification Consortium (ISC)2.
Center for Security Policy: A nonprofit, nonpartisan organization focusing on all as-pects of security for the United States.
CISA (Certified Information Systems Auditor): Certification offered by the Information Systems Audit and Control Association (ISACA).
CISM (Certified Information Security Manager): Certification offered by the Information Systems Audit and Control Association (ISACA).
SecurityandPrivacy A123
CISSP® (Certified Information Systems Security Professional): Certification offered by the International Information Systems Security Certification Consortium (ISC)2.
Computer Emergency Response Team Coordination Center (CERT/CC): An organization studying Internet security vulnerabilities.
Computer Security Institute (CSI): An organization dedicated to serving and training information, computer, and network security professionals.
CRISC (Certified in Risk and Information Systems Control): Certification offered by the Information Systems Audit and Control Association (ISACA).
CSSLP® (Certified Secure Software Lifecycle Professional): Certification offered by the International Information Systems Security Certification Consortium (ISC)2.
Information security certifications: Certifications that ensure professionals have a cer-tain level of knowledge and expertise in various security tasks.
Information Systems Audit and Control Association (ISACA): An organization that pro-vides practical guidance, benchmarks, and other effective tools to organizations about the roles of information systems governance, security, audit, and assurance professionals worldwide.
Information Systems Security Association (ISSA): A global not-for-profit organization of IS security professionals that provides education, reports, and opportunities to interact for its members.
Information systems security plan: Comprehensive document that identifies the securi-ty threats a company might face and all the controls implemented to address those threats.
International Information Systems Security Certification Consortium (ISC)2: A global not-for-profit organization that offers security certifications (CISSP®, SSCP®, and CISSP-ISSEP®) for information security professionals.
Internet Protocol Security (IPSec): A protocol that uses encryption to provide integrity and confidentiality of data sent over the Internet.
Internet Security Alliance (ISA): A trade association focused on information security, with members from various industries, in collaboration with Carnegie Mellon University.
IT Information Sharing and Analysis Center (IT-ISAC): A not-for-profit that shares infor-mation about denial-of-service attacks and software vulnerability in general.
National Information Assurance Partnership (NIAP): An organization focused on promot-ing “the development and use of evaluated, security-enhanced information tech-nology (IT) products.”
National Security Institute (NSI): An organization focused on information security training for defense contractors, government, and corporate employees in the United States.
Qualys: An example of a managed security provider that provides outsourcing ser-vices for information security.
SANS Institute (System Administration, Audit, Network, Security): A global organization of businesses and educational institutions to promote information security training and security certification. Offers security research reports and operates the Inter-net Storm Center.
A124 Appendix I
Secure HTTP (S-HTTP): A protocol for encryption to be used when sending a single message.
Secure Sockets Layer (SSL): A protocol for encryption to be used when transmitting information on the Internet.
Security policies: Statements describing what the general security guidelines are for an organization.
Security procedures: Specific statements describing how to implement the security policies.
Security protocols: Guidelines for how to protect information during transmission, ensuring that communication is secure.
Security standards: Broad documents on how to perform information security, includ-ing best practices and general guidelines.
SSCP® (Systems Security Certified Practitioner): Certification offered by the Interna-tional Information Systems Security Certification Consortium (ISC)2.
Transport Layer Security (TLS): A protocol that replaces SSL with stronger encryption for security over the Internet.
VeriSign: An example of a managed security provider that provides outsourcing ser-vices for information security.
Wi-Fi Protected Access–Personal (WPA-PSK): A protocol that uses encryption and a concept called message integrity check to ensure the integrity and confidentiality of messages sent over wireless networks.
Wi-Fi Protected Access-2 (WPA2): A protocol that uses encryption called Advanced Encryption Standard (AES), which provides more advanced protection for com-munication between a router and a wireless computer or device on a wireless net-work.
Wired Equivalent Privacy (WEP): A protocol that uses encryption established via a pre-shared key known to a router and a wireless device or computer on a wireless network.
Appendix J
Funding Information TechnologyLearning Objectives
By reading and completing the activities in this appendix, you will be able to:
• Identify the main IS funding models and their advantages and disadvan-tages
• Discuss the different types of costs that are related to information sys-tems
• Explain how the total cost of ownership approach is used to identify IS costs
• Explain how the activity-based costing approach is used to identify IS costs
Appendix Outline
IntroductionFunding Methods for Information Technology
Learning Activity J.1: Chargeback in the Real WorldIdentifying Information Systems Costs
Learning Activity J.2: Information Systems CostsLearning Activity J.3: Activity-Based Costing versus Total Cost of Ownership
Introduction
Information systems expenditures within organizations, including the hardware, software, and people costs involved with providing information systems services to the various functional departments, must be paid for by a department or source of funding in the organization. One of the key roles of the Chief Information Officer (CIO) is ensuring that the information technology department within an organiza-tion receives its share of funds every year.
Funding Methods for Information Technology
There are three main methods of funding information systems within organizations, which describe how these costs are charged: overhead, chargeback, and allocation. Each method has its advantages and disadvantages, which are summarized in Table J.1. Not surprisingly, each method also has its proponents and detractors in various stakeholder groups in organizations.
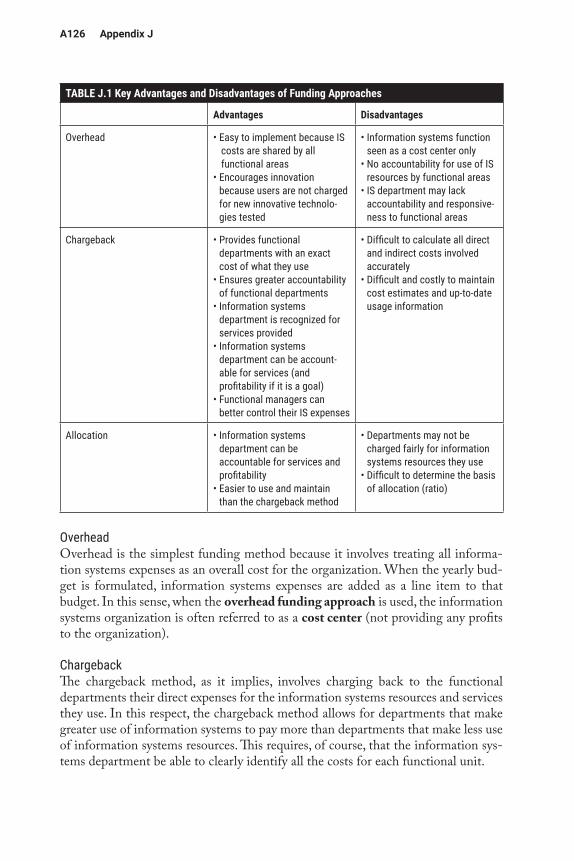
A126 AppendixJ
OverheadOverhead is the simplest funding method because it involves treating all informa-tion systems expenses as an overall cost for the organization. When the yearly bud-get is formulated, information systems expenses are added as a line item to that budget. In this sense, when the overhead funding approach is used, the information systems organization is often referred to as a cost center (not providing any profits to the organization).
ChargebackThe chargeback method, as it implies, involves charging back to the functional departments their direct expenses for the information systems resources and services they use. In this respect, the chargeback method allows for departments that make greater use of information systems to pay more than departments that make less use of information systems resources. This requires, of course, that the information sys-tems department be able to clearly identify all the costs for each functional unit.
TABLE J.1 Key Advantages and Disadvantages of Funding Approaches
Advantages Disadvantages
Overhead • Easy to implement because IS costs are shared by all functional areas
• Encourages innovation because users are not charged for new innovative technolo-gies tested
• Information systems function seen as a cost center only
• No accountability for use of IS resources by functional areas
• IS department may lack accountability and responsive-ness to functional areas
Chargeback • Provides functional departments with an exact cost of what they use
• Ensures greater accountability of functional departments
• Information systems department is recognized for services provided
• Information systems department can be account-able for services (and profitability if it is a goal)
• Functional managers can better control their IS expenses
• Difficult to calculate all direct and indirect costs involved accurately
• Difficult and costly to maintain cost estimates and up-to-date usage information
Allocation • Information systems department can be accountable for services and profitability
• Easier to use and maintain than the chargeback method
• Departments may not be charged fairly for information systems resources they use
• Difficult to determine the basis of allocation (ratio)
FundingInformationTechnology A127
AllocationThe allocation method also involves charging back expenses to the functional depart-ments for information systems resources and services. However, the amount of money charged to the functional departments is a function of a metric or ratio as opposed to the actual direct expenses of the departments. This metric can be based on the number of employees in the department, revenues the department generates, or any other indicator or ratio. In some respects, the allocation method provides a balance between the chargeback method and the overhead method.
Identifying Information Systems Costs
Before costs can be allocated or charged back to departments, or before an IS budget can even be established, it is important for costs to be clearly identified. Many approaches can be used to identify these costs. Two popular costing methods are activity-based costing (ABC) and the total cost of ownership (TCO), although ABC is becoming less prevalent in recent years because TCO provides a more com-plete picture of all costs involved, both direct and indirect.
Types of CostsExamples of costs that need to be identified for information systems include hard-ware, software, networking, and data costs (e.g., storage, backups). It is important to realize that there are also soft costs to identify, such as the people costs involved in technical support, software implementation, technology evaluation, or training of end users. Furthermore, just like in other areas of the organization, information sys-tems costs can be classified as direct or indirect costs (often called overhead costs). Direct costs are directly related to the production of a product or service. Indirect costs are not related to a product or service but rather to the overall functioning of the organization. Direct costs can be further divided into fixed costs, those that are directly related to a product or service but that are not dependent on the level of production of that product or service, and variable costs, which are related to the volume produced of the product or service.
L E A R N I N G A C T I V I T Y J . 1
ChargebackintheRealWorldFor this activity, you need to view the video “Cost Allocation Differences for Outsourcing vs. Traditional Companies,” available on YouTube: http://www.youtube.com/watch?v =ud59EbVSyIE&feature=related. As you watch the video, take notes, and be prepared to answer the following questions in a brief report:
1. What are the main differences between outsourcing companies and traditional product and service companies?
2. Why is there a difference in the chargeback approach for outsourcing companies versus traditional product and service companies?
A128 AppendixJ
Total Cost of OwnershipThe total cost of ownership (TCO) approach takes into consideration costs beyond the initial acquisition costs of hardware and software related to the implementation of an information system. These additional costs include the costs of personnel to set up and maintain the systems, the costs of training end users, the costs of upgrades to keep the system up to date, and so on. There are even costs involved when retiring information systems assets after their useful life. Those costs should also be included in the total cost of ownership calculation.
You can imagine that coming up with estimates for the total cost of ownership of information systems assets is a very difficult task, requiring a lot of information and assumptions. It is better done by individuals who have substantial experience with information systems and within the organization.
Activity-Based CostingActivity-based costing (ABC) uses the concept of activities to allocate overhead costs of information systems to each activity occurring in the organization. An activity could be a task, function, or process needed for the organization to develop or produce its products or services. The ABC approach would then assign these overhead costs to the products or services that are produced.
To use the ABC approach, the organization needs to identify the hardware, soft-ware, and people costs associated with each activity. This often includes calculating the amount of time spent on the activity by information systems personnel. For example, there are costs involved in setting up a system, testing it, and even evaluat-ing it before it is purchased. Those costs need to be recognized even if the system is
L E A R N I N G A C T I V I T Y J . 2
InformationSystemsCostsThis activity should be completed in small groups. Your group needs to identify all the costs associated with the implementation of a new website for a small local restaurant. Make sure to list all the costs you can think of and then classify them according to whether they are fixed expenses, variable costs based on volume, or overhead costs. Compare your answers across groups. As you will notice, it is very difficult to identify all costs, yet this is necessary for proper budgeting purposes.
L E A R N I N G A C T I V I T Y J . 3
Activity-BasedCostingVersusTotalCostofOwnershipUsing the manufacturing example at http://www.accountingcoach.com/activity-based -costing/explanation/1, develop your own example of how ABC could be used within the context of the implementation of an ERP system. Compare what you find with how it would be done using TCO. As an example, look here: https://www.business -case-analysis.com/total-cost-of-ownership.html.
FundingInformationTechnology A129
only one of the tools used in the development of the final product. For example, the evaluation of a firewall needed to protect the data that are used in the development of a consumer product would need to be recognized. The costs of the activity are then allocated to the products or services that are the results of that particular activity. To practice these two costing methods, please see Learning Activity J.3
Summary
In this appendix, we explored concepts related to how information systems costs are funded and calculated in organizations. We started by discussing the funding models for cost allocation within organizations. We then explored the types of costs and methods used to identify these costs.
Here are the main points discussed in this appendix:
• There are three main IS funding models: overhead, chargeback, and allocation. The overhead method treats all information systems expenses as an overall cost for the organization. It is easy to implement and encourages innovation. However, it provides no accountability for use of IS resources by functional areas, limits accountability for the IS department as well, and may reduce the responsiveness of the IS depart-ment to functional areas. The chargeback method involves charging back to the functional departments their expenses for the information systems resources and services they use. It provides more accurate costs to functional departments, ensures greater accountability of functional departments, provides recognition to the IS department for services provided, promotes accountability for the IS department, and allows functional managers to better control their IS expenses. However, it is difficult and costly to use. The allocation method also charges back expenses to the functional departments for information systems resources and services but is based on a fixed metric or ratio as opposed to the actual direct expenses related to the resources the department has used. It promotes accountability for the IS department and is easier to use than the chargeback method. However, functional departments may not be charged fairly for information systems resources they use, and it is difficult to determine the basis of allocation (ratio).
• The types of costs related to information systems include costs of hard-ware, software, networking, and data, as well as soft costs like the people costs involved in technical support, software implementation, technol-ogy evaluation, or training of end users. Costs can also be classified as direct costs or indirect (overhead) costs. Direct costs are directly related to the production of a product or service. Indirect costs are not related to a product or service but rather to the overall functioning of the organi-zation. Direct costs can be further divided into fixed costs, those that are
A130 AppendixJ
directly related to a product or service but that are not dependent on the level of production of that product or service, and variable costs, which are related to the volume produced of the product or service.
• The total cost of ownership (TCO) approach takes into consideration costs beyond acquisition of software, hardware, or any components of an information system.
• The activity-based costing (ABC) approach uses the concept of activities (tasks, functions, or processes) to allocate overhead costs of information systems to each activity needed for the organization to develop or pro-duce its products or services. The ABC approach requires these overhead costs to be assigned to the products or services that are produced.
Review Questions
1. What are three methods of funding information systems in organizations? 2. What are the main advantages and disadvantages of each of the funding
methods in question 1? 3. How does an organization choose between the various funding methods? 4. What is the difference between direct and indirect costs? 5. What is the difference between fixed costs and variable costs? 6. What are soft costs? 7. How are costs identified or allocated when using the total cost of owner-
ship approach? 8. Why might it be difficult to come up with total cost of ownership
estimates? 9. How are costs identified or allocated when using the activity-based
costing approach? 10. What is an example of an overhead cost that would be considered when
using the activity-based costing approach?
Reflection Questions
1. What is the most important thing you learned in this appendix? Why is it important?
2. What topics are unclear? What about them is unclear? 3. What relationships do you see between what you learned in this appendix
and what you learned in other parts of the textbook? 4. Identify a scenario where you think the allocation method might be the
best funding method to use in an organization. 5. Identify a scenario where you think the chargeback method might be the
best funding method to use in an organization. 6. Identify a scenario where you think the overhead method might be the
best funding method to use in an organization.
FundingInformationTechnology A131
7. Research the use of the chargeback method on the Web, and from the articles you find, explain why it is not as widely used as one would expect given its advantages.
8. For the following costs, identify whether they are direct (fixed or variable) or indirect. If they could be either, indicate when they would go into each category.a. Project staffb. Cell phone charges of the project staffc. Consultants for the projectd. Project suppliese. Audit and legal feesf. Training on a new systemg. Miscellaneous office suppliesh. Electricity used for the building housing the teami. Security
9. Using the Web, find an example of an organization that uses the total cost of ownership approach. Try to find out the characteristics of this organi-zation (industry, size, types of products, etc.) and the reasons it is using TCO.
10. Using the Web, find an example of an organization that uses the activity- based costing approach. Try to find out the characteristics of this organi-zation (industry, size, types of products, etc.) and the reasons it is using ABC.
Glossary
Activity (in activity-based costing): A task, function, or process needed for the organiza-tion to develop or produce its products or services.
Activity-based costing (ABC): A cost allocation approach that uses the concept of ac-tivities (tasks, functions, or processes) to allocate overhead costs of information systems to each activity needed for the organization to develop or produce its products or services. The ABC approach requires these overhead costs to be as-signed to the products or services that are produced.
Allocation funding method: A funding method where organizations charge back expens-es to the functional departments for information systems resources and services based on a fixed metric or ratio as opposed to the actual direct expenses related to the resources the departments have used.
Chargeback funding method: A funding method where organizations charge back to the functional departments their expenses for information systems resources and services they use.
Cost center: An information systems organization in which information system costs are allocated as an overall expense.
Direct costs: Costs directly related to the production of a product or service.

A132 AppendixJ
Fixed costs: Direct costs that are directly related to a product or service but that are not dependent on the level of production of that product or service.
Indirect costs: Costs not directly related to a product or service but rather to the over-all functioning of the organization.
Overhead funding method: A funding method where organizations treat all informa-tion systems expenses as an overall cost for the organization.
Total cost of ownership (TCO): A cost allocation approach that takes into consideration costs beyond acquisition of software, hardware, or any components of an informa-tion system.
Variable costs: Direct costs that are related to the volume produced of a product or service.
Appendix K
Managing IS Projects
Learning Objectives
By reading and completing the activities in this appendix, you will be able to:
• Discuss the role of projects in information systems• Contrast projects, programs, and portfolios• Explain project management and portfolio management• Explain the trade-offs that exist in project management• Discuss the IS project management life cycle
Appendix Outline
IntroductionProjects, Programs, and Portfolios
Learning Activity K.1: What Is a Project?Project Management
Learning Activity K.2: Project ManagementLearning Activity K.3: Scope StatementLearning Activity K.4: Planning a ProjectLearning Activity K.5: Microsoft Project
Introduction
This textbook discusses the implementation of many information systems tools, whether software, hardware, processes, or, more often than not, a combination of hardware, software, and processes. Whether it is implementing a single database, implementing an enterprise resource planning system, or even simply updating computer hardware to the most recent wireless devices, all these efforts usually take the form of projects. In this appendix, we discuss what projects are and how project management is performed.
Projects, Programs, and Portfolios
What is a project? A project is a “temporary endeavor undertaken to create a unique product, service, or result” (PMI 2013, 5). Temporary means that every project has a clear beginning and a clear end. Unique means that the product or service is different from others or, in other words, that it can be distinguished from regular, day-to-day
A134 Appendix K
operations or other projects. Day-to-day operations are activities organizations need to perform on a continuing basis, such as sales and marketing, billing customers, hiring employees, delivering products, and so on.
When discussing projects in organizations, you should be aware of the hierarchy of project efforts that can exist, which involve projects, programs, and portfolios. We have already defined what a project is. The others are defined as follows:
• A program involves several projects closely related and designed to accomplish a common goal but performed as individual projects. When the projects are all completed, the program is completed. For example, you could consider each class you take as a project that is part of your program of study.
• A portfolio is a large number of projects or programs that an organization is concurrently performing or considering. The programs or projects are not necessarily related, but they are managed with the knowledge of all projects in a way that can effectively help the organization achieve its strategic business objectives. For example, the organization may select projects to achieve a balance of risks and costs across projects.
Project Management
Project management is the process of managing projects with the goal of complet-ing them successfully, which can mean on time, on budget, with the proper level of quality, or meeting other metrics that the organization has for a successful project. Project management involves using a variety of skills, tools, and techniques to plan for and manage all the activities needed to complete the project. Project manage-ment in itself is a complete course of study. In fact, several certifications can be obtained for project management. One of the most recognized is the Project Man-agement Institute’s (PMI’s) Project Management Professional certification.
Portfolio ManagementAs discussed before, organizations usually have many different projects to consider and to manage. This is where portfolio management becomes very important. Port-
L E A R N I N G A C T I V I T Y K . 1
WhatIsaProject?Most students have been involved with numerous group projects during the course of their studies. However, besides those assignments that are labeled “group projects,” what other projects are you involved with over the course of a semester? Make a list of everything you did that you consider a project during your last semester of studies. Then get together with some classmates and compare your answers.
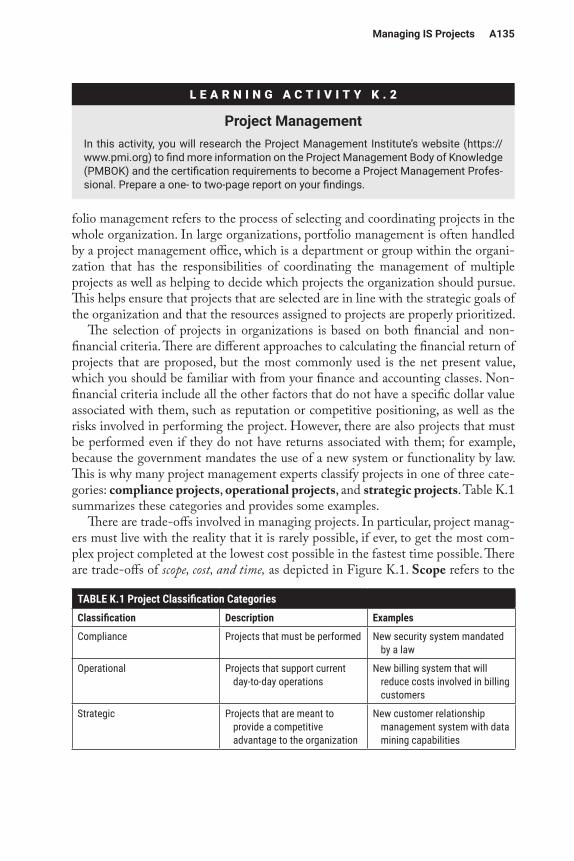
ManagingISProjects A135
folio management refers to the process of selecting and coordinating projects in the whole organization. In large organizations, portfolio management is often handled by a project management office, which is a department or group within the organi-zation that has the responsibilities of coordinating the management of multiple projects as well as helping to decide which projects the organization should pursue. This helps ensure that projects that are selected are in line with the strategic goals of the organization and that the resources assigned to projects are properly prioritized.
The selection of projects in organizations is based on both financial and non-financial criteria. There are different approaches to calculating the financial return of projects that are proposed, but the most commonly used is the net present value, which you should be familiar with from your finance and accounting classes. Non-financial criteria include all the other factors that do not have a specific dollar value associated with them, such as reputation or competitive positioning, as well as the risks involved in performing the project. However, there are also projects that must be performed even if they do not have returns associated with them; for example, because the government mandates the use of a new system or functionality by law. This is why many project management experts classify projects in one of three cate-gories: compliance projects, operational projects, and strategic projects. Table K.1 summarizes these categories and provides some examples.
There are trade-offs involved in managing projects. In particular, project manag-ers must live with the reality that it is rarely possible, if ever, to get the most com-plex project completed at the lowest cost possible in the fastest time possible. There are trade-offs of scope, cost, and time, as depicted in Figure K.1. Scope refers to the
L E A R N I N G A C T I V I T Y K . 2
ProjectManagementIn this activity, you will research the Project Management Institute’s website (https://www.pmi.org) to find more information on the Project Management Body of Knowledge (PMBOK) and the certification requirements to become a Project Management Profes-sional. Prepare a one- to two-page report on your findings.
TABLE K.1 Project Classification CategoriesClassification Description Examples
Compliance Projects that must be performed New security system mandated by a law
Operational Projects that support current day-to-day operations
New billing system that will reduce costs involved in billing customers
Strategic Projects that are meant to provide a competitive advantage to the organization
New customer relationship management system with data mining capabilities
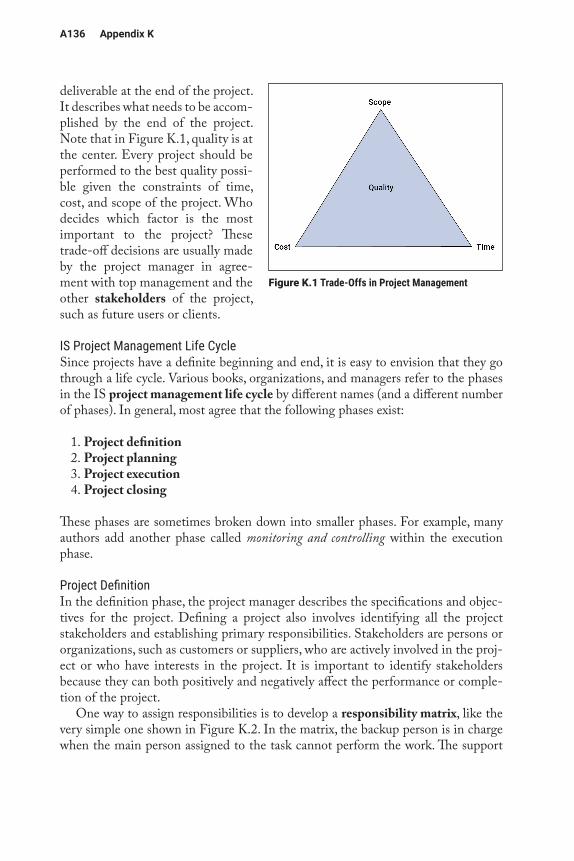
A136 Appendix K
deliverable at the end of the project. It describes what needs to be accom-plished by the end of the project. Note that in Figure K.1, quality is at the center. Every project should be performed to the best quality possi-ble given the constraints of time, cost, and scope of the project. Who decides which factor is the most important to the project? These trade-off decisions are usually made by the project manager in agree-ment with top management and the other stakeholders of the project, such as future users or clients.
IS Project Management Life CycleSince projects have a definite beginning and end, it is easy to envision that they go through a life cycle. Various books, organizations, and managers refer to the phases in the IS project management life cycle by different names (and a different number of phases). In general, most agree that the following phases exist:
1. Project definition 2. Project planning 3. Project execution 4. Project closing
These phases are sometimes broken down into smaller phases. For example, many authors add another phase called monitoring and controlling within the execution phase.
Project DefinitionIn the definition phase, the project manager describes the specifications and objec-tives for the project. Defining a project also involves identifying all the project stakeholders and establishing primary responsibilities. Stakeholders are persons or organizations, such as customers or suppliers, who are actively involved in the proj-ect or who have interests in the project. It is important to identify stakeholders because they can both positively and negatively affect the performance or comple-tion of the project.
One way to assign responsibilities is to develop a responsibility matrix, like the very simple one shown in Figure K.2. In the matrix, the backup person is in charge when the main person assigned to the task cannot perform the work. The support
Figure K.1 Trade-Offs in Project Management
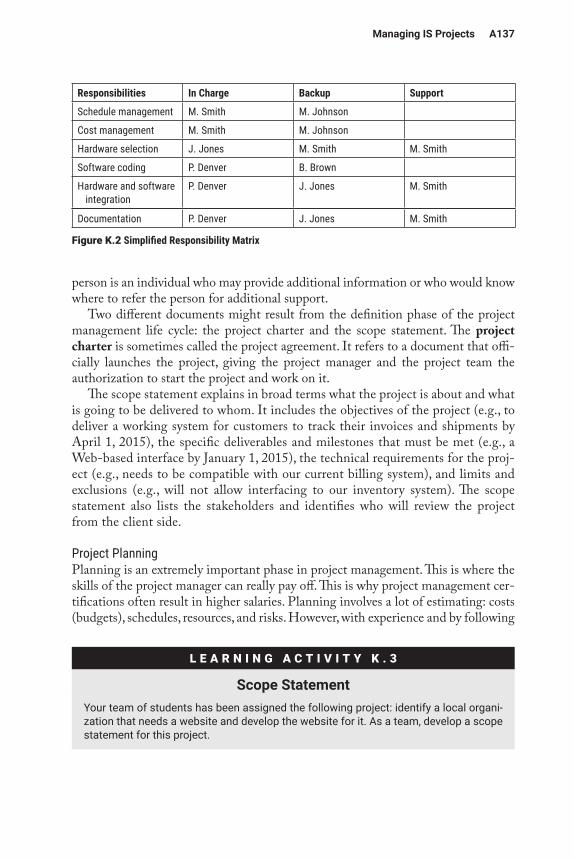
ManagingISProjects A137
person is an individual who may provide additional information or who would know where to refer the person for additional support.
Two different documents might result from the definition phase of the project management life cycle: the project charter and the scope statement. The project charter is sometimes called the project agreement. It refers to a document that offi-cially launches the project, giving the project manager and the project team the authorization to start the project and work on it.
The scope statement explains in broad terms what the project is about and what is going to be delivered to whom. It includes the objectives of the project (e.g., to deliver a working system for customers to track their invoices and shipments by April 1, 2015), the specific deliverables and milestones that must be met (e.g., a Web-based interface by January 1, 2015), the technical requirements for the proj-ect (e.g., needs to be compatible with our current billing system), and limits and exclusions (e.g., will not allow interfacing to our inventory system). The scope statement also lists the stakeholders and identifies who will review the project from the client side.
Project PlanningPlanning is an extremely important phase in project management. This is where the skills of the project manager can really pay off. This is why project management cer-tifications often result in higher salaries. Planning involves a lot of estimating: costs (budgets), schedules, resources, and risks. However, with experience and by following
Responsibilities In Charge Backup Support
Schedule management M. Smith M. Johnson
Cost management M. Smith M. Johnson
Hardware selection J. Jones M. Smith M. Smith
Software coding P. Denver B. Brown
Hardware and software integration
P. Denver J. Jones M. Smith
Documentation P. Denver J. Jones M. Smith
Figure K.2 Simplified Responsibility Matrix
L E A R N I N G A C T I V I T Y K . 3
ScopeStatementYour team of students has been assigned the following project: identify a local organi-zation that needs a website and develop the website for it. As a team, develop a scope statement for this project.
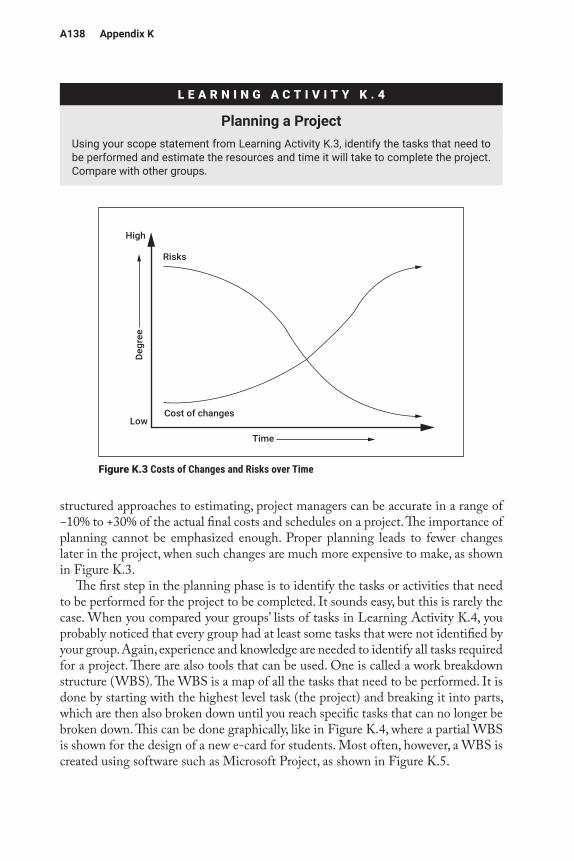
A138 Appendix K
structured approaches to estimating, project managers can be accurate in a range of −10% to +30% of the actual final costs and schedules on a project. The importance of planning cannot be emphasized enough. Proper planning leads to fewer changes later in the project, when such changes are much more expensive to make, as shown in Figure K.3.
The first step in the planning phase is to identify the tasks or activities that need to be performed for the project to be completed. It sounds easy, but this is rarely the case. When you compared your groups’ lists of tasks in Learning Activity K.4, you probably noticed that every group had at least some tasks that were not identified by your group. Again, experience and knowledge are needed to identify all tasks required for a project. There are also tools that can be used. One is called a work breakdown structure (WBS). The WBS is a map of all the tasks that need to be performed. It is done by starting with the highest level task (the project) and breaking it into parts, which are then also broken down until you reach specific tasks that can no longer be broken down. This can be done graphically, like in Figure K.4, where a partial WBS is shown for the design of a new e-card for students. Most often, however, a WBS is created using software such as Microsoft Project, as shown in Figure K.5.
L E A R N I N G A C T I V I T Y K . 4
PlanningaProjectUsing your scope statement from Learning Activity K.3, identify the tasks that need to be performed and estimate the resources and time it will take to complete the project. Compare with other groups.
Figure K.3 Costs of Changes and Risks over Time
High
Low
Deg
ree
Cost of changes
Time
Risks
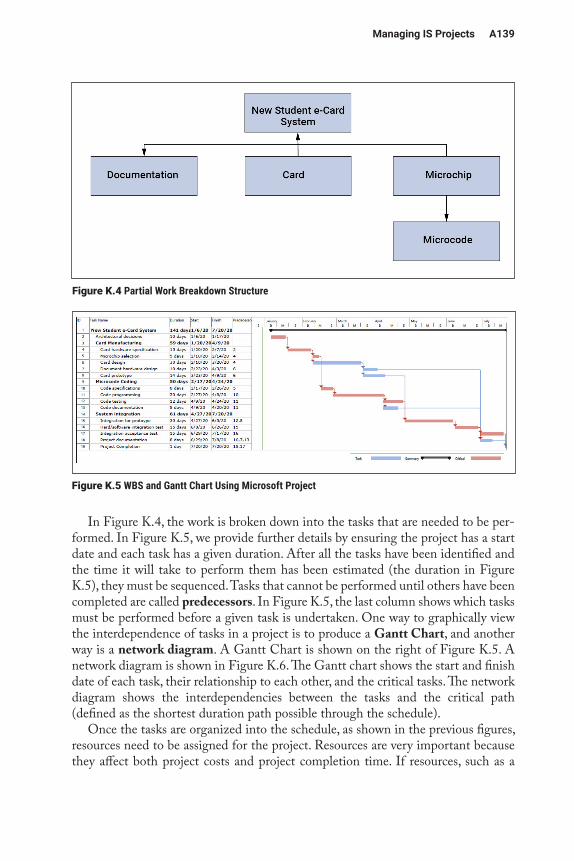
ManagingISProjects A139
In Figure K.4, the work is broken down into the tasks that are needed to be per-formed. In Figure K.5, we provide further details by ensuring the project has a start date and each task has a given duration. After all the tasks have been identified and the time it will take to perform them has been estimated (the duration in Figure K.5), they must be sequenced. Tasks that cannot be performed until others have been completed are called predecessors. In Figure K.5, the last column shows which tasks must be performed before a given task is undertaken. One way to graphically view the interdependence of tasks in a project is to produce a Gantt Chart, and another way is a network diagram. A Gantt Chart is shown on the right of Figure K.5. A network diagram is shown in Figure K.6. The Gantt chart shows the start and finish date of each task, their relationship to each other, and the critical tasks. The network diagram shows the interdependencies between the tasks and the critical path (defined as the shortest duration path possible through the schedule).
Once the tasks are organized into the schedule, as shown in the previous figures, resources need to be assigned for the project. Resources are very important because they affect both project costs and project completion time. If resources, such as a
Figure K.4 Partial Work Breakdown Structure
Figure K.5 WBS and Gantt Chart Using Microsoft Project
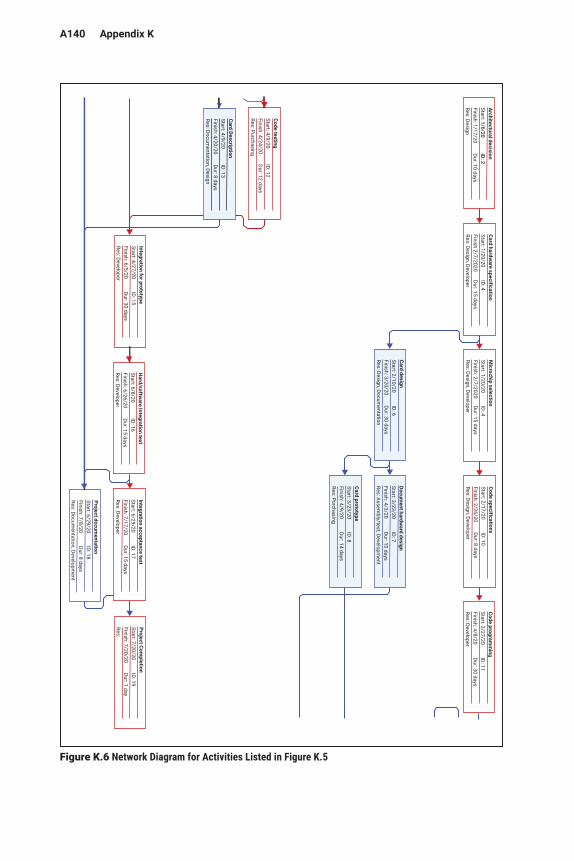
A140 Appendix K
Architectural decision
Start: 1/6/20 ID: 2
Finish: 1/17/20 Dur: 10 days
Res: Design
Card hardware specification
Start: 1/20/20 ID: 4
Finish 2/7/2020 Dur: 15 days
Res: Design, Developer
Microchip selection
Start: 1/20/20 ID: 4
Finish: 2/7/2020 Dur: 15 days
Res: Design, Developer
Code specificationsStart: 2/17/20
ID: 10Finish: 2/26/20
Dur: 8 daysRes: Design, Developer
Code programm
ingStart: 2/27/20
ID: 11Finish: 4/8/20
Dur: 30 daysRes: Developer
Card designStart: 2/10/20
ID: 6Finish: 3/20/20
Dur: 30 daysRes: Design, Docum
entation
Document hardw
ard designStart: 3/23/20
ID: 7Finish: 4/3/20
Dur: 10 daysRes: Assem
bly/test, Development
Card prototypeStart: 3/23/20
ID: 8Finish: 4/9/20
Dur: 14 daysRes: Purchasing
Code testingStart: 4/9/20
ID: 12Finish: 4/24/20
Dur: 12 daysRes: Purchasing
Card DescriptionStart: 4/9/20
ID: 13Finish: 4/20/20
Dur: 8 daysRes: Docum
entation, Design
Integration for prototypeStart: 4/27/20
ID: 15Finish: 6/5/20
Dur: 30 daysRes: Developer
Hard/softw
are Integration textStart: 6/8/20
ID: 16Finish: 6/26/20
Dur: 15 daysRes: Developer
Integration acceptance testStart: 6/29/20
ID: 17Finish: 7/17/20
Dur: 15 daysRes: Developer
Project Completion
Start: 7/20/20 ID: 19
Finish: 7/20/20 Dur: 1 day
Res:
Project documentation
Start: 6/29/20 ID: 18
Finish: 7/8/20 Dur: 8 days
Res: Documentation, Developm
ent
Figure K.6 Network Diagram for Activities Listed in Figure K.5
ManagingISProjects A141
programmer, are available and a project manager decides to utilize more of them, then it is possible that the completion time will be reduced for those tasks. However, more resources also means spending more, which affects the project budget. Remem-ber that project managers must balance the scope of the project with the time and cost trade-offs.
There are two other important activities within the planning phase: developing a communication plan and preparing a risk management plan. The communication plan identifies all the stakeholders in the project and provides a plan for what infor-mation each stakeholder needs to receive as the project progresses, where this infor-mation comes from, how it is going to be disseminated, and who is responsible for sending the information. The risk management plan provides a list of potential risks that could occur. Examples of risks include an unforeseen change in raw material prices, a lead programmer leaving the company, or even hardware failure. Taking into consideration the likelihood that the risk would occur and the impact this would have on the project, the project manager must plan for how to respond to each risk. Responses to risk include mitigation, avoidance, transference, or acceptance. Mit-igation involves reducing the risk by taking action, such as having a backup pro-grammer. Avoidance involves changing the project plan to reduce the chance the risk will occur, such as using already tested hardware instead of new hardware. Transfer-ence means passing the risk to another party, such as outsourcing part of a project. Acceptance means that the project manager decides to continue the project as is, recognizing that the risk may occur.
Project ExecutionIn the execution phase of the project management life cycle, work is actually being done on the project. This is when project teams are assigned to the work and start performing the tasks on the schedule. During project execution, the project manager spends considerable time managing the team members, tracking the project progres-sion, performing quality control, and communicating with the stakeholders.
L E A R N I N G A C T I V I T Y K . 5
MicrosoftProjectIn this activity, watch a video showing how Microsoft Project can be used for project management. You can search for a tutorial online or use one of the following:
• https://www.youtube.com/watch?v=sSS1tu1yQ-Q• https://www.tutorialspoint.com/ms_project/
Be prepared to discuss the following questions:
1. What are the advantages of using software for project management?2. What are the disadvantages of using software for project management?3. What types of projects would software like Microsoft Project be useful for?
A142 Appendix K
Project ClosingIn the closing phase, the project deliverables are given to the customer. It is import-ant to realize that giving the project outcome, such as a new information system, to the customer involves a lot more than transferring software; documentation must be prepared and users must be trained on the new system. Finally, resources used on the project need to be released to work on other projects. At the end, it is also important for organizations to perform an evaluation of the project to identify the main suc-cesses and failures and develop a list of lessons learned that can be useful for future projects.
Summary
In this appendix, we explored information systems project management concepts. We started by discussing what projects are and compared them to programs and portfolios. We discussed project selection and explained the trade-offs among cost, time, and scope that project managers face. We ended the chapter with an overview of the various phases in the project management life cycle.
Here are the main points discussed in this appendix:
• Projects are used constantly in organizations—for example, to imple-ment a single database, to implement an enterprise resource planning system, or even simply to update computer hardware to the most recent wireless devices.
• Projects are temporary endeavors undertaken to create a unique product, service, or result. Programs are a collection of closely related projects designed to accomplish a common goal but performed as individual projects. A portfolio is large number of projects or programs that an organization is concurrently performing or considering.
• Project management is the process of managing projects with the goal of completing them successfully. Portfolio management is the process of selecting and coordinating projects in the whole organization.
• Scope, cost, and time are the trade-offs involved in managing projects. It is typically not possible to maximize all of them. Scope describes what needs to be accomplished by the end of the project.
• The project management life cycle indicates the phases that projects go through from their beginning to their end. The most common phases include project definition, project planning, project execution, and proj-ect closing.
Review Questions
1. What is a project? What are the characteristics of a project? 2. What is a program? A portfolio?
ManagingISProjects A143
3. Explain project management and portfolio management. 4. What are some examples of project selection criteria? 5. Give examples of compliance projects, operational projects, and strategic
projects. 6. What are the trade-offs in project management? Why do they exist? 7. What are the phases in the project management life cycle? 8. What is a responsibility matrix? What is it used for? 9. Explain the purpose of a project charter and a scope statement. 10. What is a Gantt chart?
Reflection Questions
1. What is the most important thing you learned in this appendix? Why is it important?
2. What topics are unclear? What about them is unclear? 3. What relationships do you see between what you learned in this appendix
and what you learned in Chapter 10 on developing information systems? 4. Compare and contrast the project management life cycle with the systems
development life cycle (SDLC) covered in Chapter 10. 5. In Chapter 11, we discussed first-, second-, and third-order change.
Explain how each of these levels of change might impact project manage-ment.
6. “Small organizations do not need project management, and even less portfolio management.” Do you agree with this statement? Explain why or why not.
7. Provide detailed examples of when the implementation of an enterprise resource planning (ERP) system can be considered a compliance project, when it can be considered an operational project, and when it can be considered a strategic project.
8. Looking at Figure K.3, explain why the risks are greater at the beginning of a project but lower over time and comparatively why costs of change are lower early in a project and higher later on. Use specific examples in your explanations.
9. Discuss what might happen in an organization when the closing phase of the project management life cycle is not properly completed.
10. For the scenario given in Learning Activities K.3 and K.4, prepare a risk management plan, identifying the major risks involved, the likelihood they will occur, their potential impact, and your proposed response.
Reference
Project Management Institute (PMI). 2013. Project Management Body of Knowledge (PMBOK Guide), 5th ed. Newtown Square, PA: Project Management Institute.
A144 Appendix K
Glossary
Acceptance: A risk-response approach that means continuing with the project as is, recognizing that the risk may occur.
Avoidance: A risk-response approach that involves changing the project plan to re-duce the chance the risk will occur.
Communication plan: A document that identifies all the stakeholders on the project and provides a plan for what information they will receive, how and when they will receive it, and who will send it.
Compliance projects: A project classification category indicating projects that must be performed.
Gantt chart: A type of network diagram.Mitigation: A risk-response approach that involves reducing the risk by taking some
actions.Network diagram: A graphical representation of tasks and their interdependence.Operational project: A project classification category indicating projects that support
current day-to-day operations.Portfolio: A large number of projects or programs that an organization is concurrent-
ly performing or considering.Portfolio management: The process of selecting and coordinating projects in the whole
organization.Predecessor: A task that must be completed before another task can be started.Program: A collection of closely related projects designed to accomplish a common
goal but performed as individual projects.Project: A temporary endeavor undertaken to create a unique product, service, or
result.Project charter: A document that officially launches the project, giving the project
manager and the project team the authorization to start the project and work on it.Project closing: A project management life cycle phase where the project deliverables
are given to the customer.Project definition: A project management life cycle phase where the project manager
describes the specifications and objectives for the project, identifies the project stakeholders, and establishes primary responsibilities.
Project execution: A project management life cycle phase where the work is actually being done on the project.
Project management: The process of managing projects with the goal of completing them successfully.
Project management life cycle: The phases that projects go through from their begin-ning to their end.
Project Management Professional©: A certification offered by the Project Management Institute.
Project planning: A project management life cycle phase where tasks are identified, schedules and costs are estimated, resources are assigned, and a communication plan and a risk management plan are developed.
ManagingISProjects A145
Responsibility matrix: An approach to assigning responsibilities on the project.Risk management plan: A document that provides a list of potential risks, their likeli-
hood, their potential impact, and the planned responses to those risks.Scope: What needs to be accomplished by the end of the project.Scope statement: A document that explains in broad terms what the project is about
and what is going to be delivered to whom.Stakeholders: Persons or organizations, such as customers or suppliers, who are ac-
tively involved in the project or who have interests in the project.Strategic projects: A project classification category indicating projects that are meant
to provide a competitive advantage to the organization.Transference: A risk-response approach that means passing the risk to another party,
such as outsourcing part of a project.Work breakdown schedule (WBS): A map of all the tasks that need to be performed on
a project.