Embed Size (px)
Citation preview

International Journal of Education and Information
Technology
Vol. 1, No. 1, 2015, pp. 1-10
http://www.publicscienceframework.org/journal/ijeit
* Corresponding author
E-mail address: [email protected] (V. Shevchenko), [email protected] (K. Meteshkin), [email protected] (O. Morozova),
[email protected] (O. Sokolov), [email protected] (A. Mreła)
Information Systems in Management of the Student Self-Education Process
Viktoriia Shevchenko1, Kostiantyn Meteshkin2, Olga Morozova3, Oleksandr Sokolov4, Aleksandra Mreła5, *
1Department of Informatics, Kharkov National Automobile and Highway University, Kharkiv, Ukraine
2Department of Geoinformation System, Lend and Property Evaluation, Kharkіv National University of Municipal Economy, Kharkiv, Ukraine
3Department of Theoretical Mechanics, Mechanical Engineering and Robotic Systems, National Aerospace University, Kharkiv, Ukraine
4Faculty of Physics, Astronomy and Informatics Nicolaus Copernicus University, Torun, Poland
5Faculty of Technology, Kujawy and Pomorze University in Bydgoszcz, Bydgoszcz, Poland
Abstract
The paper presents the model of the information system designed to organize and manage the student self-education process.
There is shown that with the current methods of teaching in universities the principle of individualization of teaching can be
implemented only during individual student’s work. The method of individual plans forming and the method of redistribution
according to typological groups are proposed. The first method is based on the choice of individual methods according to
different levels of complexity for individual student’s work. The second one is carried out according to the modified method of
k-means of McKean. Individual methods are adjusted to distribute a student of a typological group on the basis of incorrect
answers to questions given by the time of module control and student’s choice of the set of competences which the students
want to acquire during their studies. Proposed methods of information technology can help solve problems the
individualization of the education at higher educational institutions and therefore improve students’ performance.
Keywords
Information System, Independent Work of Students, Behaviour of Students, Individual Plans, Typological Groups,
Product Model, Frame Model, Semantic Network
Received: February 27, 2015 / Accepted: March 20, 2015 / Published online: March 26, 2015
@ 2015 The Authors. Published by American Institute of Science. This Open Access article is under the CC BY-NC license.
http://creativecommons.org/licenses/by-nc/4.0/
1. Introduction
In modern society, education has become one of the most
extensive human activities. Education, especially higher
education, is seen as a major leading factor for the social and
economic progress. At the present stage of development of
education, special attention is paid to the creation of a single
information and the design of a information system for
management of education. This article deals with new
possibilities of modern information system according to the
management of teaching process on the basis of decision-
making theory, heuristic methods of knowledge
representation, artificial intelligence theory, fuzzy set theory
and others. During the research of higher education, for
example the course called “Computer Science”, it has been
revealed that students enroll in college having different levels
of training [1].
Taking into account the personal characteristics of each
student, in particular the student’s ability to learn, it has been
concluded that for successful training of a group of students
there’s a necessity to introduce a personalized technology
into the teaching process [2].
2 Viktoriia Shevchenko et al.: Information Systems in Management of the Student Self-Education Process
Since the principle of individualization requires transforming
a lot of data, an information system is needed to organize the
whole process of learning, which is, according to
Encyclopedia Britannica, is “an integrated set of components
for collecting, storing, and processing data and for delivering
information, knowledge, and digital products”1
. Leonard
Jessup and Joseph Valacich stated that “computer-based
information systems are complementary networks of
hardware/software that people and organizations use to
collect, filter, process, create, & distribute data (computing)”
[3].
There are different kinds of information systems, for instance:
expert systems, decision support systems, transaction
processing systems, office system, knowledge management
systems and so on.
The paper presents the example of knowledge management
systems which, according to Irma Beccera-Fernandez and
Rajiv Sabherwal, are “applications resulting from such
synergy between the latest technologies and social/structural
mechanisms”[4]. The education needs more and more
information systems to organize process of teaching and
verifying students’ achievements but if the university
authorities decide to individualize this process, the
information system is essential to organize this process in
order to help each student learn and develop their skills
according to an individual plan and program. Currently,
however, for the task of individualization of teaching there is
no clear evidence-based guidance.
University professors often work with a large group of
students, so that the teacher is not physically in a position to
make up an individual work plan for each student.
Consequently, for implementation of the principle of
individualization of the teaching process, the teacher needs a
tool to create individual education plans for students. On the
other hand, when methods of teaching a group are considered,
each student is not able to work at the same pace, so they
need individual plans. In the paper there is shown that with
the current methods of teaching in universities the principle
of individualization of teaching can be implemented only
during individual student’s work (ISW).
Recently, the technology of modular training has become
popular in the practice of higher education. As part of the
credit-module concept, a half of hours assumed for studying
different courses is allocated for ISW. In this case, teachers
have no tools to organize and direct the work of students after
teaching hours. The usage of information system in the
educational process allows teachers to organize effective
training for each student and promote pedagogical work on a
1 http://www.britannica.com/EBchecked/topic/287895/information-system,
[01.02.2015].
higher quality level corresponding to the present level of
development of science and technology.
For ISW organization, that is for individual plans formation,
the following assumptions for the system have been made:
1. Individual plans are formed on the basis of individual
methods, which are recommended to students for
independent work and depend on their level of competence
during the course.
2. The level of student’s competencies on the taught subject
is measured by means of the test in Moodle environment
according to a 100-point scale.
3. Individual techniques are developed by teachers who teach
a particular course and constitute a bank of individual
practices.
4. Selection of individual techniques is carried out in
accordance with the distribution of students into typological
groups in pursuance of the predicted performance.
5. Prediction of student’s performance is held at the
beginning of each course, the study of which is based on
cluster analysis. Having regard to this, the modification of
the k-means method of McKean was proposed [5].
6. According to the results of performance prediction, the
students are divided into typological groups and after that
they are offered techniques for self-preparation appropriate to
their individual typological groups.
7. After the control of each module there is performed a
redistribution of students into typological groups by means of
cluster analysis application.
8. Individual methods are adjusted to distribute a student of a
typological group on the basis of incorrect answers to
questions given by the at the time of module control and
student’s choice of the set of competences which the students
want to acquire during their studies.
The functional diagram of the information technology for
ISW plan’s formation is shown in Fig. 1.
2. Description of the Information System of ISW
Plan’s Formation
2.1. Testing in the Moodle System
It is used to assess the level of student’s competences before
the beginning of the course. There can be used a set of tests
for assessing the level of knowledge, skills and abilities of
students of the course before the beginning of studying in the
Moodle or any other test system [6, 7].

International Journal of Education and Information Technology Vol. 1, No. 1, 2015, pp. 1-10 3
2.2. Method of Predicting Performance
It is necessary for initial pre-assessment of students’
readiness and abilities. It was developed on the basis of
clustering procedure and is proposed in [5].
Initial data for prediction consists of: the initial level of
knowledge of the discipline (measured at the first lesson in
the testing environment, Moodle), the level of student’s
competence formed on the first topic of a given discipline,
absenteeism of classroom at the time of the forecast.
2.3. The Method of Typological Groups’
Distribution
After the predicting procedure, each student is allocated to
one of four typological groups. If a student is expected to
score less than 60 points, he/she is distributed to the class of
"Poor", when the score from 60 to 74 points is projected –
the student is allocated to the class of "satisfactory", if 75 to
89 points – to the class of "Good", and 90 to 100 points – to
the class of "Excellent". The distribution of students into
typological groups is not definitive, because during the
semester, students have the opportunity to change their
grades and be redistributed to another typological group.
Fig. 1. Block diagram of the information system designed for formation of individual students’ work plans
2.4. Method of Individual Plans Forming
It is based on the choice of individual methods according to
different levels of complexity for ISW. The complexity level
of the selected tasks depends on a student’s membership in a
certain typological group. The effectiveness of the given
method is verified by methods of nonparametric statistics
which were proved during experiments conducted at
KhNAHU2
in years 2010-2011. The experiments were
carried out on the sample of the course” Informatics”. In the
2 KhNAHU – Kharkov National Automobile and Highway University
4 Viktoriia Shevchenko et al.: Information Systems in Management of the Student Self-Education Process
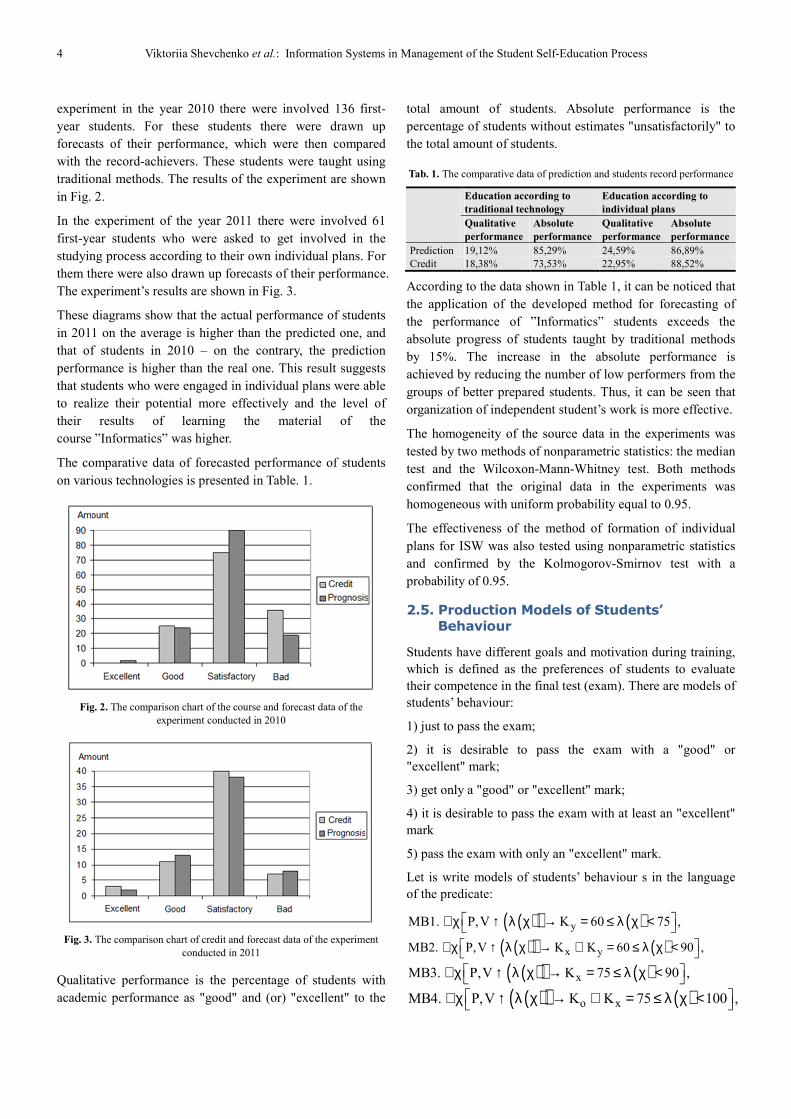
experiment in the year 2010 there were involved 136 first-
year students. For these students there were drawn up
forecasts of their performance, which were then compared
with the record-achievers. These students were taught using
traditional methods. The results of the experiment are shown
in Fig. 2.
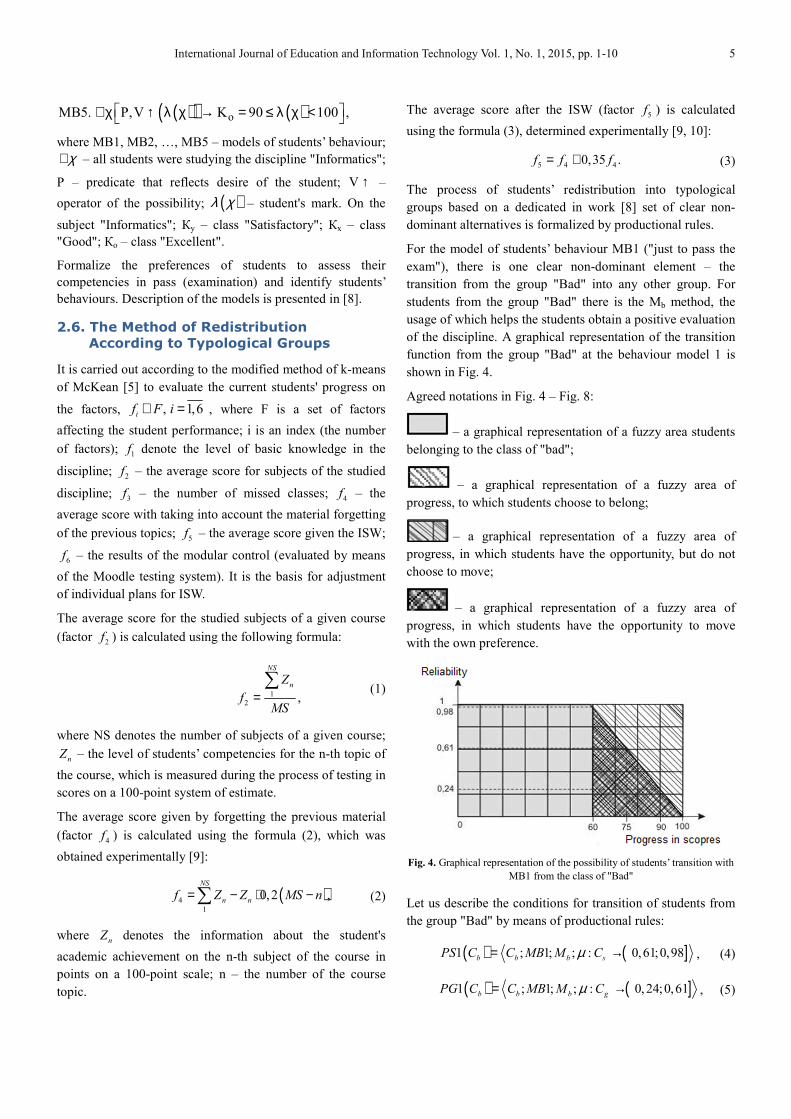
In the experiment of the year 2011 there were involved 61
first-year students who were asked to get involved in the
studying process according to their own individual plans. For
them there were also drawn up forecasts of their performance.
The experiment’s results are shown in Fig. 3.
These diagrams show that the actual performance of students
in 2011 on the average is higher than the predicted one, and
that of students in 2010 – on the contrary, the prediction
performance is higher than the real one. This result suggests
that students who were engaged in individual plans were able
to realize their potential more effectively and the level of
their results of learning the material of the
course ”Informatics” was higher.
The comparative data of forecasted performance of students
on various technologies is presented in Table. 1.
Fig. 2. The comparison chart of the course and forecast data of the
experiment conducted in 2010
Fig. 3. The comparison chart of credit and forecast data of the experiment
conducted in 2011
Qualitative performance is the percentage of students with
academic performance as "good" and (or) "excellent" to the
total amount of students. Absolute performance is the
percentage of students without estimates "unsatisfactorily" to
the total amount of students.
Tab. 1. The comparative data of prediction and students record performance
Education according to
traditional technology
Education according to
individual plans
Qualitative
performance
Absolute
performance
Qualitative
performance
Absolute
performance
Prediction 19,12% 85,29% 24,59% 86,89%
Credit 18,38% 73,53% 22,95% 88,52%
According to the data shown in Table 1, it can be noticed that
the application of the developed method for forecasting of
the performance of ”Informatics” students exceeds the
absolute progress of students taught by traditional methods
by 15%. The increase in the absolute performance is
achieved by reducing the number of low performers from the
groups of better prepared students. Thus, it can be seen that
organization of independent student’s work is more effective.
The homogeneity of the source data in the experiments was
tested by two methods of nonparametric statistics: the median
test and the Wilcoxon-Mann-Whitney test. Both methods
confirmed that the original data in the experiments was
homogeneous with uniform probability equal to 0.95.
The effectiveness of the method of formation of individual
plans for ISW was also tested using nonparametric statistics
and confirmed by the Kolmogorov-Smirnov test with a
probability of 0.95.
2.5. Production Models of Students’
Behaviour
Students have different goals and motivation during training,
which is defined as the preferences of students to evaluate
their competence in the final test (exam). There are models of
students’ behaviour:
1) just to pass the exam;
2) it is desirable to pass the exam with a "good" or
"excellent" mark;
3) get only a "good" or "excellent" mark;
4) it is desirable to pass the exam with at least an "excellent"
mark
5) pass the exam with only an "excellent" mark.
Let is write models of students’ behaviour s in the language
of the predicate:
( )( ) ( )уМB1. P,V K 60 75 , ∀χ ↑ λ χ → = ≤ λ χ <
( )( ) ( )х уМB2. P,V K K 60 90 , ∀χ ↑ λ χ → ⊆ = ≤ λ χ <
( )( ) ( )хМB3. P,V K 75 90 , ∀χ ↑ λ χ → = ≤ λ χ <
( )( ) ( )о хМB4. P,V K K 75 100 , ∀χ ↑ λ χ → ⊆ = ≤ λ χ <
International Journal of Education and Information Technology Vol. 1, No. 1, 2015, pp. 1-10 5
( )( ) ( )оМB5. P,V K 90 100 , ∀χ ↑ λ χ → = ≤ λ χ <
where МB1, МB2, …, МB5 – models of students’ behaviour;
χ∀ – all students were studying the discipline "Informatics";
Р – predicate that reflects desire of the student; V ↑ –
operator of the possibility; ( )λ χ – student's mark. On the
subject "Informatics"; Ку – class "Satisfactory"; Кх – class
"Good"; Ко – class "Excellent".
Formalize the preferences of students to assess their
competencies in pass (examination) and identify students’
behaviours. Description of the models is presented in [8].
2.6. The Method of Redistribution
According to Typological Groups
It is carried out according to the modified method of k-means
of McKean [5] to evaluate the current students' progress on
the factors, , 1,6if F i∈ = , where F is a set of factors
affecting the student performance; i is an index (the number
of factors); 1
f denote the level of basic knowledge in the
discipline; 2
f – the average score for subjects of the studied
discipline; 3
f – the number of missed classes; 4
f – the
average score with taking into account the material forgetting
of the previous topics; 5
f – the average score given the ISW;
6f – the results of the modular control (evaluated by means
of the Moodle testing system). It is the basis for adjustment
of individual plans for ISW.
The average score for the studied subjects of a given course
(factor 2
f ) is calculated using the following formula:
1
2,
NS
nZ
fMS
=∑
(1)
where NS denotes the number of subjects of a given course;
nZ – the level of students’ competencies for the n-th topic of
the course, which is measured during the process of testing in
scores on a 100-point system of estimate.
The average score given by forgetting the previous material
(factor 4
f ) is calculated using the formula (2), which was
obtained experimentally [9]:
( )4
1
0,2 ,NS
n nf Z Z MS n= − ⋅ −∑ (2)
where nZ denotes the information about the student's
academic achievement on the n-th subject of the course in
points on a 100-point scale; n – the number of the course
topic.
The average score after the ISW (factor 5f ) is calculated
using the formula (3), determined experimentally [9, 10]:
5 4 40,35 .f f f= + (3)
The process of students’ redistribution into typological
groups based on a dedicated in work [8] set of clear non-
dominant alternatives is formalized by productional rules.
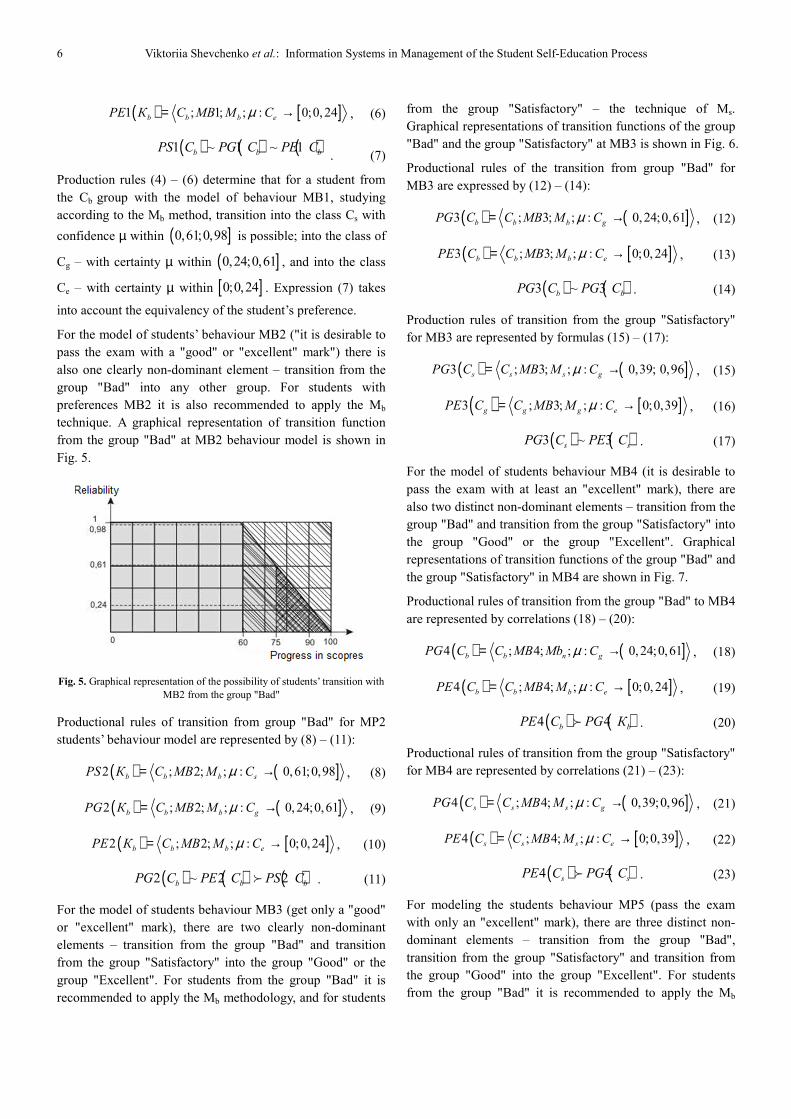
For the model of students’ behaviour MB1 ("just to pass the
exam"), there is one clear non-dominant element – the
transition from the group "Bad" into any other group. For
students from the group "Bad" there is the Mb method, the
usage of which helps the students obtain a positive evaluation
of the discipline. A graphical representation of the transition
function from the group "Bad" at the behaviour model 1 is
shown in Fig. 4.
Agreed notations in Fig. 4 – Fig. 8:
– a graphical representation of a fuzzy area students
belonging to the class of "bad";
– a graphical representation of a fuzzy area of
progress, to which students choose to belong;
– a graphical representation of a fuzzy area of
progress, in which students have the opportunity, but do not
choose to move;
– a graphical representation of a fuzzy area of
progress, in which students have the opportunity to move
with the own preference.
Fig. 4. Graphical representation of the possibility of students’ transition with
MB1 from the class of "Bad"
Let us describe the conditions for transition of students from
the group "Bad" by means of productional rules:
( ) ( ]1 ; 1; ; : 0,61;0,98b b b sPS C C МB M Cµ= → , (4)
( ) ( ]1 ; 1; ; : 0,24;0,61b b b gPG C C МB M Cµ= → , (5)
6 Viktoriia Shevchenko et al.: Information Systems in Management of the Student Self-Education Process
( ) [ ]1 ; 1; ; : 0;0,24b b b ePE К C МB M Cµ= → , (6)
( ) ( ) ( )1 ~ 1 ~ 1b b bPS C PG C PE C. (7)
Production rules (4) – (6) determine that for a student from
the Cb group with the model of behaviour MB1, studying
according to the Mb method, transition into the class Cs with
confidence µ within ( ]0,61;0,98 is possible; into the class of
Cg – with certainty µ within ( ]0,24;0,61 , and into the class
Ce – with certainty µ within [ ]0;0,24 . Expression (7) takes
into account the equivalency of the student’s preference.
For the model of students’ behaviour MB2 ("it is desirable to
pass the exam with a "good" or "excellent" mark") there is
also one clearly non-dominant element – transition from the
group "Bad" into any other group. For students with
preferences MB2 it is also recommended to apply the Mb
technique. A graphical representation of transition function
from the group "Bad" at MB2 behaviour model is shown in
Fig. 5.
Fig. 5. Graphical representation of the possibility of students’ transition with
MB2 from the group "Bad"
Productional rules of transition from group "Bad" for MP2
students’ behaviour model are represented by (8) – (11):
( ) ( ]2 ; 2; ; : 0,61;0,98b b b sPS К C МB M Cµ= → , (8)
( ) ( ]2 ; 2; ; : 0,24;0,61b b b gPG К C МB M Cµ= → , (9)
( ) [ ]2 ; 2; ; : 0;0,24b b b ePE К C МB M Cµ= → , (10)
( ) ( ) ( )2 ~ 2 2b b bPG C PE C PS C≻ . (11)
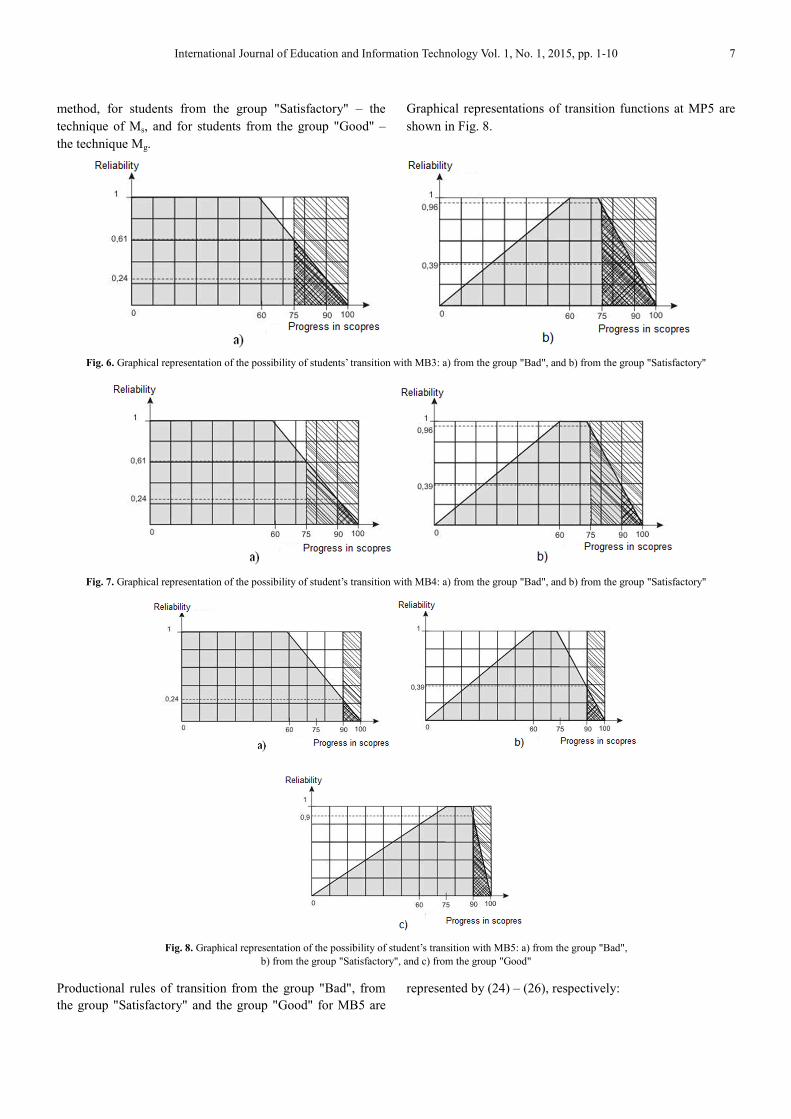
For the model of students behaviour MB3 (get only a "good"
or "excellent" mark), there are two clearly non-dominant
elements – transition from the group "Bad" and transition
from the group "Satisfactory" into the group "Good" or the
group "Excellent". For students from the group "Bad" it is
recommended to apply the Mb methodology, and for students
from the group "Satisfactory" – the technique of Ms.
Graphical representations of transition functions of the group
"Bad" and the group "Satisfactory" at MB3 is shown in Fig. 6.
Productional rules of the transition from group "Bad" for
MB3 are expressed by (12) – (14):
( ) ( ]3 ; 3; ; : 0,24;0,61b b b gPG C C МB M Cµ= → , (12)
( ) [ ]3 ; 3; ; : 0;0, 24b b b ePE C C МB M Cµ= → , (13)
( ) ( )3 ~ 3b bPG C PG C . (14)
Production rules of transition from the group "Satisfactory"
for MB3 are represented by formulas (15) – (17):
( ) ( ]3 ; 3; ; : 0,39; 0,96s s s gPG C C МB M Cµ= → , (15)
( ) [ ]3 ; 3; ; : 0;0,39g g g ePE C C МB M Cµ= → , (16)
( ) ( )3 ~ 3s sPG C PE C . (17)
For the model of students behaviour MB4 (it is desirable to
pass the exam with at least an "excellent" mark), there are
also two distinct non-dominant elements – transition from the
group "Bad" and transition from the group "Satisfactory" into
the group "Good" or the group "Excellent". Graphical
representations of transition functions of the group "Bad" and
the group "Satisfactory" in MB4 are shown in Fig. 7.
Productional rules of transition from the group "Bad" to MB4
are represented by correlations (18) – (20):
( ) ( ]4 ; 4; ; : 0,24;0,61b b п gPG C C МB Mb Cµ= → , (18)
( ) [ ]4 ; 4; ; : 0;0, 24b b b ePE C C МB M Cµ= → , (19)
( ) ( )4 4b bPE C PG К≻ . (20)
Productional rules of transition from the group "Satisfactory"
for MB4 are represented by correlations (21) – (23):
( ) ( ]4 ; 4; ; : 0,39;0,96s s s gPG C C МB M Cµ= → , (21)
( ) [ ]4 ; 4; ; : 0;0,39s s s ePE C C МB M Cµ= → , (22)
( ) ( )4 4s sPE C PG C≻ . (23)
For modeling the students behaviour MP5 (pass the exam
with only an "excellent" mark), there are three distinct non-
dominant elements – transition from the group "Bad",
transition from the group "Satisfactory" and transition from
the group "Good" into the group "Excellent". For students
from the group "Bad" it is recommended to apply the Mb
International Journal of Education and Information Technology Vol. 1, No. 1, 2015, pp. 1-10 7
method, for students from the group "Satisfactory" – the
technique of Ms, and for students from the group "Good" –
the technique Mg.
Graphical representations of transition functions at MP5 are
shown in Fig. 8.
Fig. 6. Graphical representation of the possibility of students’ transition with MB3: a) from the group "Bad", and b) from the group "Satisfactory"
Fig. 7. Graphical representation of the possibility of student’s transition with MB4: a) from the group "Bad", and b) from the group "Satisfactory"
Fig. 8. Graphical representation of the possibility of student’s transition with MB5: a) from the group "Bad",
b) from the group "Satisfactory", and c) from the group "Good"
Productional rules of transition from the group "Bad", from
the group "Satisfactory" and the group "Good" for MB5 are
represented by (24) – (26), respectively:
8 Viktoriia Shevchenko et al.: Information Systems in Management of the Student Self-Education Process
( ) [ ]5 ; 5; ; : 0;0,24b b b ePE C C МB M Cµ= → , (24)
( ) [ ]5 ; 5; ; : 0;0,39s s s ePE C C МB M Cµ= → , (25)
( ) [ ]5 ; 5; ; : 0;0,9g d g ePE C C МB M Cµ= → . (26)
2.7. Productional-Frame Model of the
Course
Productional-frame model of the course has been designed to
formalize the structure of the course. It allows to select the
necessary material for the ISW depending on the questions
that were answered wrongly during the test.
The formalization of the discipline structure will be
considered on example of the course "Informatics". Let us
represent the course "Informatics" in the form of a semantic
network [11, 12]. According to the curriculum, the course
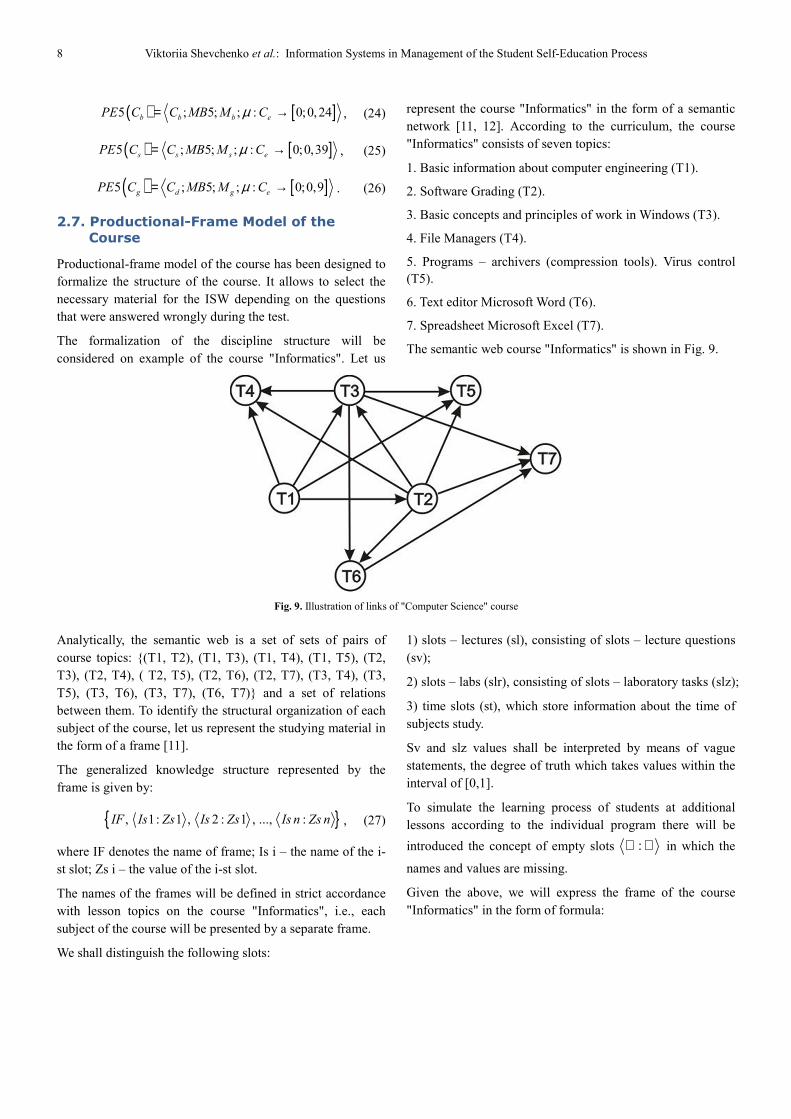
"Informatics" consists of seven topics:
1. Basic information about computer engineering (T1).
2. Software Grading (T2).
3. Basic concepts and principles of work in Windows (T3).
4. File Managers (T4).
5. Programs – archivers (compression tools). Virus control
(T5).
6. Text editor Microsoft Word (T6).
7. Spreadsheet Microsoft Excel (T7).
The semantic web course "Informatics" is shown in Fig. 9.
Fig. 9. Illustration of links of "Computer Science" course
Analytically, the semantic web is a set of sets of pairs of
course topics: {(T1, T2), (T1, T3), (T1, T4), (T1, T5), (T2,
T3), (T2, T4), ( T2, T5), (T2, T6), (T2, T7), (T3, T4), (T3,
T5), (T3, T6), (T3, T7), (T6, T7)} and a set of relations
between them. To identify the structural organization of each
subject of the course, let us represent the studying material in
the form of a frame [11].
The generalized knowledge structure represented by the
frame is given by:
{ }, 1: 1 , 2 : 1 , ..., :IF Is Zs Is Zs Is n Zs n , (27)
where IF denotes the name of frame; Is i – the name of the i-
st slot; Zs i – the value of the i-st slot.
The names of the frames will be defined in strict accordance
with lesson topics on the course "Informatics", i.e., each
subject of the course will be presented by a separate frame.
We shall distinguish the following slots:
1) slots – lectures (sl), consisting of slots – lecture questions
(sv);
2) slots – labs (slr), consisting of slots – laboratory tasks (slz);
3) time slots (st), which store information about the time of
subjects study.
Sv and slz values shall be interpreted by means of vague
statements, the degree of truth which takes values within the
interval of [0,1].
To simulate the learning process of students at additional
lessons according to the individual program there will be
introduced the concept of empty slots :∅ ∅ in which the
names and values are missing.
Given the above, we will express the frame of the course
"Informatics" in the form of formula:
International Journal of Education and Information Technology Vol. 1, No. 1, 2015, pp. 1-10 9
[ ]( ) [ ]( ) [ ]
[ ]( ) [ ]( ) [ ]
[ ]( )
1 1
1 1 1
1
1 1
1, 1, ,
, 1, ,
1, 1,
: : : 0,1 , ..., : : 0,1 0,1 , ...,
..., : : : 0,1 , ..., : : 0,1 0,1
: : : 0,1 , ...,
q
i
m
i m m m
i
svsv
i T L q L
sl
m T L q L
slz
T LR k
F T L V D V D
L V D V D
LR Z D Z
µ µ
µ µ
µ
= → → →
→ → → ×
× →
��������� ���������ɶ
�������������������������
���������
[ ]( ) [ ]
[ ]( ) [ ]( ) [ ]
[ ]
1
1
1 1 9 9 1 1 9 9
,
, 1, ,
: : 0,1 0,1 , ...,
..., : : : 0,1 , ..., : : 0,1 0,1
0,1 : : , ..., : : , ..., :
, .
k
j
i j j j
slz
LR
slr
j T LR k LR
st
t
r r r r lr lr lr lr
D
LR Z D Z D
T t zt t zt t zt t zt
µ
µ µ
→ →
→ → → →
→ ×
× ∅ ∅
�����������
���������������������������
���������������������
.., ,
∅ ∅
�������
(28)
where Fɶ denotes the frame of the discipline; i
T – the name
of the i-st subject of the course, 1,7i = ; 1, ,,i iT m TL L – the first
and last name of the i-st lecture topic of the course, m – the
number of lectures in the i-st topic; 1 1 11, ,,L q LV V – the name of
the first and last issue of the first lecture, 1
q – the number of
questions in the first lecture; 1, ,,m m mL q LV V – the name of the
first and last question of the last lecture, m
q – the number of
questions in the last lecture; 1, ,,i iT j TLR LR – the first and last
name of the laboratory work on the i-st subject; j – the
number of laboratory works on the i-st topic; 1 1 11, ,,LR k LRZ Z –
the name of the first and last assignment in the first
laboratory work, 1
k – the number of assignments in the first
lab; 1, ,,j j jLR k LRZ Z – the first and last name of the assignment
in the last lab, jk – the number of assignments in the last lab;
µ – the membership function; D – the study materials of the
appropriate slot; tT – the amount of time allocated for the
study of the lectures of the study material according to the
timetable; lr
t – time intervals allocated for the study material
according to the schedule of lectures; lr
t – time intervals
allocated to carry out laboratory work according to the
schedule of classes.
2.8. Method of Individual Plans Adjustment
Method of individual plans adjustment consists in forming
the set of theoretical knowledge and practical tasks directed
to achieve the desired estimate by a student on the basis of a
more detailed study of specific topics of a given course,
which causing difficulties to the student [13, 14]. It is
formalized by productional rules of individual plans
adjustment:
; ; ; , 1,7;
; ; ; , 1,7;
; ; ; , 1,7,
b i b i
s i b i
g i g i
PB C Т MBS M М i
PS C Т MBS M М i
PG C Т MBS M М i
= → =
= → =
= → =
(29)
where PB, PS, PG denote production rules of individual
plans adjustment for students’ self-study of the typological
group "Bad", "Satisfactory" and "Good" respectively; Cb, Cs,
Cg – conditions of a student membership to the appropriate
class; Ti – subject of the course in which the student has a
failing grade; MBS – model of students behaviour to achieve
the desired evaluation of their competence at the final test
(examination) Mb, Ms, Mg – individual methods for students
self-study of the appropriate class, Mi – adjusted
methodology with in-depth training on the i-st subject of the
course.
3. Conclusions
Development of information systems will automate the
process of individual plans formation for self-study and take
into account motivations and personal abilities of students,
which is especially important when education takes place in
10 Viktoriia Shevchenko et al.: Information Systems in Management of the Student Self-Education Process
large groups.
Application of the information system for forming of
individual plans of ISW releases teachers from the laborious
process of each student's progress’s analysis. Moreover the
system can make recommendations, so it can improve the
academic achievement of each student.
Introduction of the information system of individual plans
formation of the independent self-study work of students into
the teaching process allows organizing, controlling and
managing of the ISW, which leads to increased efficiency of
the ISW and has a positive effect on students performance.
References
[1] Shevchenko V., 2009, Analysis of comprehension of the discipline “Informatics” by the first year student, Automobile Transport: collection of scientific works. – Kharkiv, KhNAHU, Issue. 24. – p. 116 – 119. (in Russian)
[2] Shevchenko V., 2011, Individualization of teaching the discipline “Informatics”, Vestnik KhNAHU: collection of scientific works. – Kharkiv, KhNAHU, Issue. 53. – p. 10 – 12. (in Russian)
[3] Jessup L., Valacich J. S., 2003, Information Systems Today, Pearson Publishing, p.416.
[4] Beccera-Fernandez I., Sabherwal R., 2010, Knowledge management systems and processes, M.E. Sharpe, p. 8.
[5] Shevchenko V., 2012, Distribution of students into typological groups by means of cluster analysis, depending on the factors influencing the students progress, Collection of scientific works of the international scientific and methodological conference “The problems of Integration of National Higher Educational Institutions into the European Educational Medium“. V.2 “Modern Approaches Concerning Higher Education Quality Provision”. – Kharkiv, KhNAHU, p. 120 – 123. (in Russian)
[6] Morozova O., Molchanova O., Sokolov O., Ivanov S., 2012, Fuzzy expert system in personal self-improvement environment and some current problems in modern testing systems, XIX Zittau East-West Fuzzy Colloquium: Conference Proceedings, 5 – 7 September 2012. – Zittau, – p. 162 – 169.
[7] Sokolov O., Molchanova O., Urbaniak W., 2011, Methods of refining assessment of test-takers based on item response theory model, Task Quarterly. – Vol. 15, № 2. – p. 191 – 202.
[8] Meteshkin K., Shevchenko V., 2012, Vague understanding of students clusterization results, Public information and computer integrated technologies: collection of scientific works. – Kharkiv, KhAI. – 2012. – Issue. 56. – p. 201 – 208. (in Russian)
[9] Shevchenko V., 2012, The concept of creating the model of knowledge acquisition on the discipline “Informatics”, Vestnik KhNAHU: collection of scientific works. – Kharkiv, KhNAHU. – 2012. – Issue.56. – p. 26 – 29. (in Russian)
[10] Meteshkin A., Shevchenko V., Sharyhin M., 2010, Approbation of the formula for calculation of the time of the forgotten by the students studying material, Collection of scientific works. – Kharkiv, KhNAHU. – 2010. – Issue. 26. – p. 126 – 128. (in Russian)
[11] Belova L., Meteshkin K., Uvarov O., 2001, Logical and mathematical fundamentals of teaching process management at higher educational institutions: monograph. – Kharkiv, Eastern – regional center of humanitarian and educational initiatives. – 2001. – 272 p. (in Russian)
[12] Meteshkin A., Sokolov O., Morozova O., et al., 2014, Cybernetic Pedagogy: IT-technologies in education and training in higher educational institutions. Theory and Practice: monograph. – Kharkov, Kharkiv National University of Municipal Economy named after A.N. Beketov. – 2014. – 243 p. (in Russian)
[13] Sokolov O., Morozova O., 2013, Fuzzy ontological knowledge representation for the training of medical terminology, Journal Of Health Sciences (J Of H Ss). – 2013. – 3 (4). – p. 30 – 39.
[14] Morozova O., 2013, Information technology of organization the learning process based on the identification of individual parameters, Collection of scientific works of Kharkiv University of Air Forces. – 2013. – Vol. 3 (36). – p. 265 – 268. (in Russian)