Embed Size (px)
Citation preview
INFORMATION TECHNOLOGY AND COMPETITIVE ADVANTAGE IN
INTERNET SERVICE PROVIDERS IN KENYA
SAMUEL SHAKE RIGHA
A RESEARCH PROJECT SUBMITTED IN PARTIAL FULFILLMENT OF THE
REQUIREMENTS FOR THE AWARD OF MASTER OF BUSINESS
ADMINISTRATION, SCHOOL OF BUSINESS, UNIVERSITY OF NAIROBI
OCTOBER 2014

ii
DECLARATION
This Research Project is my original work and not been presented for an ward in any other
University.
Signature: ................................................. Date: .................................................
SAMUEL SHAKE RIGHA
D61/75509/2012
This Research Project has been submitted for examination with my approval as the University
Supervisor.
Signature:.................................................. Date: .................................................
Joel K. Lelei
Lecturer, Department of Management Science,
School of Business, University of Nairobi

iii
ACKNOWLEDGEMENT
The successful completion of this research project would not have been possible without the
support of different individuals. I wish to express my deep and sincere gratitude to my supervisor
Mr. Joek K Lelei, Department of Management Science, School of Business University of
Nairobi, for his invaluable support, supervision and encouragement through this research work.
His continuous guidance and encouragement has enabled me to be able to complete my work
successfully.
I also wish to express my sincere thanks and gratitude to my family for their support throughout
the entire course period. I also wish to express my profound gratitude to my colleagues whose
constructive criticism helped me do better.
Above all I thank God for helping me undertake this course and complete it with this project.
iv
ABSTRACT
The world has been experiencing an increase in the use of information technology. Information
technology has brought about new avenues for business as well as provided different ways in
which businesses can benefit. The market has also become competitive and the different firms
have had to come up with different strategies to be able to make profits. These firms have also
realised how important Information technology is and how it can be put to use in the firm to be
able to gain some form of advantage over competitors. Thus Information technology is now used
to provide competitive advantage for the different firms. The objective of this study was to
establish drivers for adoption of Information technology for competitive advantage by Internet
service providers, to establish the impact of IT adoption on competitive advantage of Internet
service providers in Kenya and to establish the challenges faced by Internet Service Providers in
their use of Information Technology for their competitive advantages in Kenya. The study used
census research design. The target population was obtained from TESPOK (Telecommunications
Service Providers of Kenya) and totalled 22.The research instrument used was questionnaire
which was administered using “drop and pick later” method and via email. The respondents were
chief operational officers and chief technical officers from each of the firms. Data was analysed
using percentages, frequencies, mean scores and standard deviation. The presentation of the
quantitative data was through the use of tables. The findings were that the key impact for the use
of information technology was to improve decision making by the Internet Service providers, the
key challenge was the use of the correct Information technology Platform and the need to
improve on the speed of operations as the key driver for the use of Information technology by the
firms.

v
CONTENTS
DECLARATION ........................................................................................................................... ii
ACKNOWLEDGEMENT ........................................................................................................... iii
ABSTRACT .................................................................................................................................. iv
CONTENTS................................................................................................................................... v
LIST OF ABBREVIATIONS ..................................................................................................... vii
LIST OF TABLES ...................................................................................................................... viii
LIST OF FIGURES ..................................................................................................................... ix
CHAPTER ONE: INTRODUCTION ........................................................................................ 1
1.1 Background ........................................................................................................................... 1
1.1.1 Information Technology for Competitive Advantage ..................................................... 2
1.1.2 Internet Service Providers in Kenya ............................................................................... 3
1.2 Problem Statement ................................................................................................................ 7
1.3 Value of the Study ................................................................................................................. 9
CHAPTER TWO: LITERATURE REVIEW .......................................................................... 10
2.1 Introduction ......................................................................................................................... 10
2.2 Theoretical Framework ........................................................................................................11
2.2.1 Porter 5 Forces Model .................................................................................................. 12
2.2.2 Porter Generic Strategies Model ................................................................................... 13
2.2.3 Resourced Based View of Competitive Advantage ...................................................... 13
2.2.4 Knowledge Based View (KBV).................................................................................... 14
2.2.5 Dynamic Capabilities View (DCV) .............................................................................. 14
2.2.6 Technology Acceptance Model (TAM) ........................................................................ 15
2.3 Drivers for the Use of IT for Competitive Advantage ........................................................ 15
2.4 Challenges in the use of ICT for Competitive Advantage .................................................. 16
2.5 Impact on the use of ICT for Competitive Advantage ........................................................ 17
CHAPTER THREE: RESEARCH METHODOLOGY ......................................................... 18
3.1 Introduction ......................................................................................................................... 18
3.2 Research Design .................................................................................................................. 18
3.3 Population............................................................................................................................ 18
3.4 Data Collection .................................................................................................................... 18
3.5 Data Analysis....................................................................................................................... 19
vi
CHAPTER FOUR: DATA ANALYSIS, FINDINGS AND DISCUSSION ............................. 20
4.1 Introduction ......................................................................................................................... 20
4.2 Demographic Information ................................................................................................... 20
4.2.1 Gender .......................................................................................................................... 20
4.2.2 Age of respondents ....................................................................................................... 21
4.2.3 Years Worked For the Firm ........................................................................................... 21
4.2.4 Education Level ............................................................................................................ 22
4.2.5 Years the Firm has been in Existence ........................................................................... 23
4.2.6 Number of Employees in the Firm ............................................................................... 23
4.2.7 Number of Branches ..................................................................................................... 24
4.3 Extent of Information Technology Use by Functional Area ............................................... 25
4.4 Drivers for use of Information Technology for Competitive Advantage ............................ 27
4.5 Challenges in Use of Information Technology for Competitive Advantage ....................... 28
4.6 Impact of adoption of Information Technology on the firms Competitive ......................... 30
4.6.1 Means and Standard Deviation ..................................................................................... 30
4.6.2 Regression Analysis ...................................................................................................... 31
CHAPTER FIVE: SUMMARY OF FINDINGS, CONCLUSION AND
RECOMMENDATIONS ............................................................................................................ 33
5.1 Introduction ......................................................................................................................... 33
5.2 Summary of Findings .......................................................................................................... 33
5.2.1 Demographic Information ............................................................................................ 33
5.2.2 Extent of Technology use in Different Functional Area ............................................... 33
5.2.3 Drivers for the use of Information technology For Competitive Advantage ................ 34
5.5 Limitations of the Study ...................................................................................................... 35
5.6 Suggestions for Future Research ......................................................................................... 36
REFERENCES ............................................................................................................................ 37
APPENDIXES ............................................................................................................................. 42
APPENDIX I: INTERNET SERVICE PROVIDER POPULATION ....................................... 42
APPENDIX II: QUESTIONAIRE ............................................................................................ 43

vii
LIST OF ABBREVIATIONS
CA – Competitive Advantage
CCK – Communications Commission of Kenya
DCV -Dynamic Capabilities View
EASSY – East African Sub-marine Cable System
GDP – Gross Domestic Product
ICT – Information Communications Technology
IS – Information Systems
ISP – Internet Services Provider
IT – Information Technology
KBV - Knowledge Based View
KPLC – Kenya Power and Lightning Company
SCA - Sustainable competitive advantage
SEACOM – Sea Submarine Communications
SME – Small and Medium Enterprise
TAM - Technology Acceptance Model
TEAMS – The East African Marine System
ULF – Unified Licensing Framework
VoIP – Voice Over Internet Protocol
VSAT – Very Small Aperture Terminals

viii
LIST OF TABLES
Table 1: Internet Subscriptions and Estimated Internet .................................................................. 5
Table 2: Under Sea Available Capacities ........................................................................................ 6
Table 3: Gender of Respondents ................................................................................................... 20
Table 4: Age of Respondents ....................................................................................................... 21
Table 5: Years Worked in Firm ..................................................................................................... 22
Table 6: Education Level .............................................................................................................. 22
Table 7: Years the Firm has been in Existence .............................................................................. 23
Table 8: Number of Employees in the Firm .................................................................................. 24
Table 9: Number of Branches ....................................................................................................... 24
Table 10: Extent of IT Use in Functional Areas........................................................................... 26
Table 11: Drivers for Use of IT for Competitive Advantage ........................................................ 27
Table 12: Challenges in Use of IT for Competitive Advantage .................................................... 29
Table 13: Impacts of use of IT for Competitive Advantage .......................................................... 30
ix
LIST OF FIGURES
Figure 1: Conceptual Model ..........................................................................................................11
Figure 2: Theoretical framework, Source Researcher .................................................................. 12
Figure 3: Porter 5 Forces Model ................................................................................................... 13
Figure 4: Regressed Competitive Advantage ................................................................................ 32

1
CHAPTER ONE: INTRODUCTION
1.1 Background
Utilization of Information Technology in business activities plays a key role in the success of
organizations. However, in order to achieve this success through information technologies, they
have to be in line and matched with business strategies of the firm (Galliers, 1993).Thus
businesses have realized the significance of information technologies utilization in their business
strategy toolset (Wong, Ngan, Chan, Felix, T.S, & Alain, 2012). Information Technology (IT) has
become intertwined with business in an inextricable manner and when it is used in organizations
intensively can result in long-term competitive advantages (Jorfi, Nor, & Najjar, 2011).
Competitive advantage is defined as an organizational capability to perform in one or many ways
that competitors find difficult to imitate now and in the future (Kotler, 2000). Porter (1985)
defines competitive strategy as the search for a favourable competitive position in an industry,
with an aim to establish a profitable and sustainable position against the forces that determine
industry competition.
According to Porter (1985) to have a competitive advantage a firm must create superior value for
buyers by devising a competitive strategy that is able to establish a profitable and sustainable
position relative to competitors. According to Dehning and Stratopoulos (2003) Information
technology has the capability of creating competitive advantage. Information Technology (IT) is
more than just computers and must be conceived broadly to encompass the information that
business create and use as well a wide spectrum of increasingly convergent and linked
technologies that process the information (Porter & Millar, 1985).
A study by Daneshvar and Ramesh (2010) concluded that a firm adopting Information
Technology (IT) enjoys innovation, growth, cost reduction, alliance, and differentiation
advantages generated by the IT. On the other hand, Information Technology (IT) enhances
information processing, communication and alliance patterns. These characteristics could
improve Small and Medium Enterprises (SME) competitiveness in international markets as well
as facilitate relationships with other firms within the same value chain.
2
A study by Bilgihan (2011) concluded that Information Technology (IT) investments help
companies develop Information Technology (IT) capabilities and Information Technology (IT)
competencies that lead to achieving low cost, added value, speed, agility, and customer service.
Bilgihan further conclude that it is not the Information Technology (IT) applications that offer
the competitive advantage but rather how Information Technology (IT) applications are
developed, implemented, integrated with other areas and systems help hotel companies to
develop dynamic capabilities to achieve competitive advantage.
1.1.1 Information Technology for Competitive Advantage
The motivation by firms to use Information technology as a means of gaining competitive
advantage is driven by their need to achieve low cost delivery of products and services, deliver
differentiated products and services, be able to focus on a specific market segment and also
improve on the innovative practices of the organisation.
Low cost delivery of product and services refers to the delivery of a quality product or service at
a low cost and that the product or service is attractive to the market and yield a return on
investment. Deliver differentiated products and services refer to the addition of unique features
to the products and services that are attractive to the market and hence enable for the increase in
customer base. Focusing on a specific market segment refers to firms identifying specific market
segments and then moving to satisfy the needs of these segments. Information Technology (IT) is
then used to provide the necessary capabilities required to fill the needs of that segment.
Innovation is whereby the firm comes with new ways of doing things as well as new products
and services. Information Technology (IT) is then used by the firm to aid in the development of
new products and services as well as improves on existing ones.
According to Vu (2013) Information Communication Technology (ICT) enhances firms
efficiency and competitiveness by promoting better communications and interaction with
customers, enabling for cost saving and enhances growth and performance.
According to Feen and Willcocks (1998) for a firm to achieve a sustainable competitive
advantage it must overcome several challenges. It must focus its IS efforts to support business
strategies and use Information Technology (IT) innovations to develop new, superior strategies,
3
It must devise and effectively manage strategies for delivery of low cost, high quality IS services
and It must choose the correct technical platform on to mount its IS services. Gantz and Gens
(2004) further add to these challenges by stating that the most important challenge faced is on
how to use technology optimally and efficiently in businesses.
A study done by Consoli (2012) says that investment into the use of Information Communication
Technology (ICT) by most firms is inhibited by high finacial costs of investments, absence of the
required infrastructure for the ICT to ride on, lack of skilled staff and the evolution of technology
without users having adequate training.
According to Diebold (1986) Information Technology (IT) has changed the competitive
environment in six basic ways: Information Technology (IT) enhances Products and services,
Information Technology (IT) enables for Cost displacement, Information Technology (IT)
enables for Enhanced decision support, Information Technology (IT) results in the Revision of
the mission or objectives of the firm, Business interrelationships and also enabled for the
Creation of new products and services.
A study done by Consoli (2012 ) found that the benefits of Information Communication
Technology (ICT) occur only after a period of adoption and depend on the type of business,
internal changes and suppliers-customers interaction. He further moves to classify the benefits
into performance, growth, expansion and new products. He further adds that in order to gain best
performances it’s important to align Information Communication Technology (ICT) with
organisational capabilities and processes.
1.1.2 Internet Service Providers in Kenya
The Communications Commission of Kenya (CCK) financial report for the year 2012-2013 says
that the postal and telecommunications sub-sectors contributed 2.1% to Gross Domestic Product
(GDP), which was down from 2.2% in the previous period (CCK, 2014).Another report by
McKinsey (2013) says that the internet sector contributed 2.9% of Kenya’s Gross Domestic
Product (GDP) in 2012. This contribution to Gross Domestic Product (GDP) shows just how
important Internet sector is important to the Kenyan economy it’s because of this contribution
that the Kenya ICT board is focused on implementing a long-term national vision, facilitating
investment, and encouraging innovation in both the private and public sectors. .

4
The main business by ISPs is to provide access to internet based products and services. They
usually buy internet capacity as bulk and the sell it into smaller chunks to end users. The delivery
of these services is usually through Information Technology (IT) Infrastructure either owned by
the company or leased from other firms. They also provide services such as domain hosting
services, email services, web-hosting services, collocation services and VOIP. Others provide
Internet Protocol transit services where they also serve as resellers of internet capacity to other
ISPs.
The Communications Commission of Kenya (CCK) is the regulatory authority for the
communications sector in Kenya. Established in 1999 by the Kenya Communications Act
(KCA) No. 2 of 1998, CCK’s initial mandate was regulation of the telecommunications and
postal/courier sub-sectors, and the management of the country’s radiofrequency spectrum. In
recognition of the rapid changes and developments in technology which have blurred the
traditional distinctions between telecommunications, Information Technology (IT) and
broadcasting, the Government in January 2009 enacted the Kenya Communications Amendment
Act 2009.
The Communications Commission of Kenya (CCK) report for the financial year 2012-2013
(CCK, 2014) says that the Internet sub-segment in Kenya grew with 12.43 million internet
subscriptions and 19.65 million internet users. This represented an internet penetration of 48.3
per cent compared with 35.5 per cent the previous year. The increase was driven by the growth in
mobile/internet subscriptions that have dominated the internet sub-sector. It further says that
affordable devices such as smart phones and social networking applications have become
increasingly popular especially among urban youth. The report further states that the number of
Internet users increased by 40.1 per cent, to stand at 19,654,925 in the Financial Year 2012/13.
The growth was attributed to the increased usage of the internet for basic services such as
banking, healthcare and education, availability of a wide array of affordable internet access
devices such as smart phones and tablets, as well as the innovative promotions and special offers
and affordable bundled internet services provided by operators.

5
Table 1: Internet Subscriptions and Estimated Internet
SUBSCRIPTIONS/USERS 2008/09 2009/10 2010/11 2011/12 2012/13
Terrestrial mobile data/internet
subscriptions
1,562,065 3,059,906 4,189,720 7,655,576 12,340,005
Terrestial wireless data/internet
subscriptions
8,602 22,134 29,979 21,709 21,282
Satellite data/internet subscriptions 26 953 960 519 1,278
Fixed digital subscriber line (DSL)
data/internet subscriptions
7,822 9,631 15,168 11,682 11,512
Fixed fiber optic data/internet
subscriptions
851 4,303 22,460 49,371 58,197
Fixed cable modem (dial up)
data/internet subscriptions
21 25 - 25 25
Total internet subscriptions 1,824,203 3,096,952 4,258,287 7,738,882 12,432,308
Estimated internet users 3,648,406 7,832,252 12,538,030 14,032,366 19,654,925
Source: CCK Report 2012-2013
The Kenya Communications Commission of Kenya in 2008 brought about one of the key
changes by changing the licensing framework from the technology oriented framework to the
unified licensing framework. According to (Ogongo, 2013) the impact of ULF has been
Increased demand for licenses, Ease of acquisition of licenses, Increased scope of licenses with
limited restrictions , on possible innovative services, Increased interest and participation of
young , technology savvy population the drivers of mobile applications in Kenya and Increased
innovative services/application . The Communications Commission of Kenya (CCK) report for
the year 2012/2013 (CCK, 2014) says that the total number of licensees under the Unified
Licensing Framework (ULF) increased from 1,311 to 1,558 in the Financial Year 2012/13 and
this represented a 18.8 per cent growth compared to the previous year’s 55.3 per cent. The effect
of this change in licensing was a reduction on the barriers to entry for firms into the market
place. Infrastructure firms benefited as they were now capable of providing internet capacity via
their Infrastructure as opposed to being limited to the provision of infrastructure access.
The ISP industry has also been hit by economic challenges and the entry of new entrants into the
market. Most ISPs have seen their profits dip owing to entry of new entrants into the market and
6
existence of alternative products and services. These alternative products and services have been
mostly through the mobile phone companies who offer 3G and 4G internet access. These
companies have eaten into the market share of ISP thus resulting in a reduction in profit. The
continued revenue growth inertia in the voice market has seen operators shift to other markets in
the ICT industry such as the data market. Mobile operators continue to aggressively engage in
the data market and have deployed wireless broadband mobile networks that have speeds of up
to 21 Mbps (CCK, 2014).
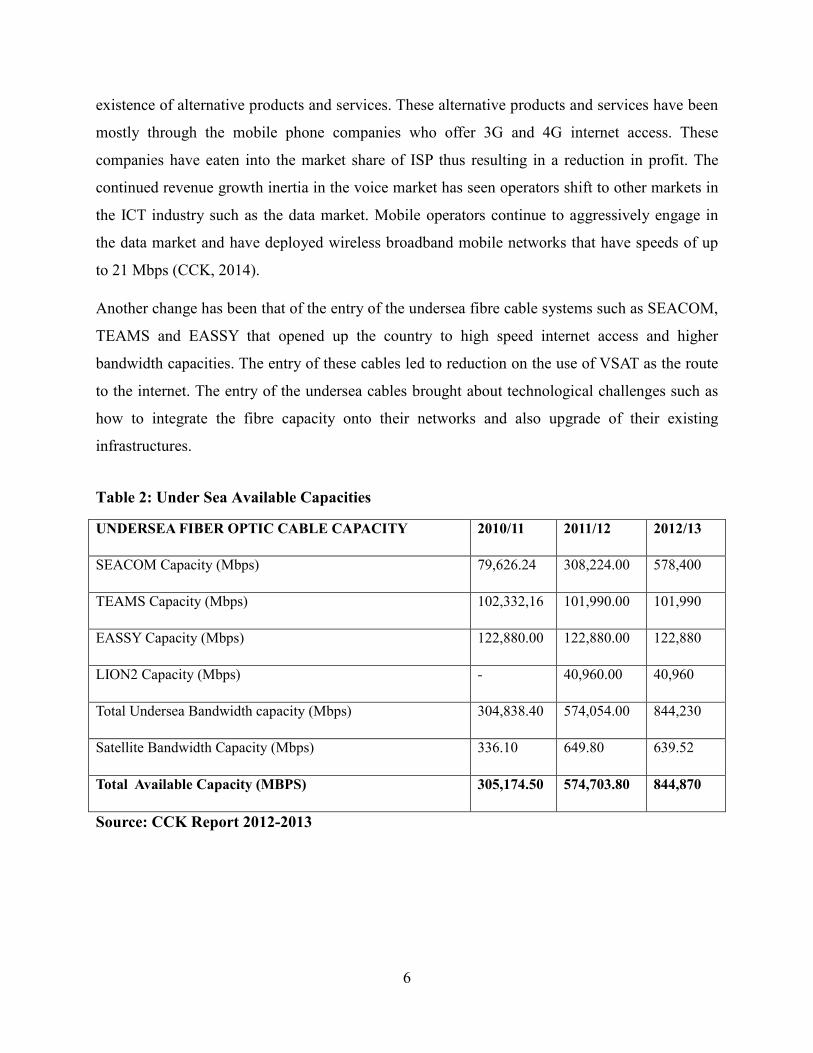
Another change has been that of the entry of the undersea fibre cable systems such as SEACOM,
TEAMS and EASSY that opened up the country to high speed internet access and higher
bandwidth capacities. The entry of these cables led to reduction on the use of VSAT as the route
to the internet. The entry of the undersea cables brought about technological challenges such as
how to integrate the fibre capacity onto their networks and also upgrade of their existing
infrastructures.
Table 2: Under Sea Available Capacities
UNDERSEA FIBER OPTIC CABLE CAPACITY 2010/11 2011/12 2012/13
SEACOM Capacity (Mbps) 79,626.24 308,224.00 578,400
TEAMS Capacity (Mbps) 102,332,16 101,990.00 101,990
EASSY Capacity (Mbps) 122,880.00 122,880.00 122,880
LION2 Capacity (Mbps) - 40,960.00 40,960
Total Undersea Bandwidth capacity (Mbps) 304,838.40 574,054.00 844,230
Satellite Bandwidth Capacity (Mbps) 336.10 649.80 639.52
Total Available Capacity (MBPS) 305,174.50 574,703.80 844,870
Source: CCK Report 2012-2013

7
A study by Omae,Ndungu and Kibet (2013) found that the top competitive challenges in the
telecommunication industry was intensive rivalry with other competitors, existence of cheaper
products, high bargaining power of customers and poor quality service.
1.2 Problem Statement
A study by Breznik (2012 ) found that the possibility that Information Technology (IT) can
contribute to a firm performance and help gain competitive advantage has received a great deal
of attention in recent years. Some scholars have claimed that Information Technology (IT) does
provide competitive advantage and its impact can either be direct or indirect while others have
suggested that Information Technology (IT) cannot be a source of competitive advantage as it
doesn’t meet the requirements of the competitive advantage concept. Further to this others
argued that Information Technology (IT) has a negative impact on the performance of a firm and
hence on competitive advantage.
The age old way of thinking was that Information Technology (IT) cannot change the way a
company does business but it merely provides a tool for the implementation of the business
strategy. Hence it does not define or shape the strategy (Ferguson & Glover, 1996). According to
Ross, Beath, and Goodhue (1996) Information Technology (IT) becomes a tool for competitive
advantage when it is both strategically valuable and difficult for competitors to imitate. Advances
in information provision have led organizations to attempt and develop IS strategies which
interrelate with their business strategies and which together support corporate missions
(Christine and Rogerson, 1994).
The Internet Services Provider market in Kenya has seen changes occur in its environment. The
technological, Economic and legal changes have pushed providers towards a new way of
thinking where IT is used to provide competitive advantage. The ISPs in Kenya are seeing
different forces that put the different firms at the risk of closing shop and have responded with
different strategies. As indicated in CCK financial report for the year 2012-2013 the increase in
number of issued licences means that there are more players in the market. The entry of the voice
players into the data market has reduced the market share of the internet service provider firms as
evidenced by the CCK financial report for the year 2012-2013.This entry has also offered
8
consumers different alternative means of internet access. Even though this entry might sound to
be gloomy the number of internet service subscriptions continue to grow meaning there is still a
considerable number of the population requiring the services. This has meant that the ISP
industry players have had to change tact and come up with new strategies for survival, expansion
and capture of further market share. While this is so knowledge on the use of Information
technology for competitive advantage is still inadequate. Some of the studies done by on
Information technology and competitive advantage include An Analysis of Information and
Communication Technology on Service Innovation and Competitive advantage: A case of
Commercial Banks in Kenya by Humphrey Muriuki,Oddillia Nabwire Okoth, Makau Wa Mutua
and Christine W. Mwangómbe, The Adoption of Information and Communication Technology
by Small Enterprises in Thika Municipality by Samuel Obino Mokaya, Competitive Advantages
and Strategic Information Systems by Mahmood Hemmatfar and Mahdi Salehi to name but a
few. These researches conclude that the application, benefits and impacts are different for each
industry and each organisation owing to the uniqueness of the application of IT. This research
will look at internet services provision firms in Kenya.
This research aims to address the following questions: what are the drivers for the adoption of IT
for strategic advantage, what are the impacts of Information technology adoption on competitive
advantage by internet service providers’ and what are the challenges being faced by ISPs in
Kenya by their use of Information technology for competitive advantage.
1.3 Objectives of the Study
The main objective of the study is to establish the status of IT usage by internet service providers
in Kenya to boost their competitiveness. In more specific terms the study seeks to:
1.) To establish drivers for adoption of IT for competitive advantage by ISPs
2.) To establish the impact of IT adoption on competitive advantage of ISP’s in Kenya
3.) To establish the challenges faced by Internet Service Providers in their use of Information
Technology for their competitive advantages in Kenya
9
1.3 Value of the Study
This study will add to the body of knowledge on the usage of information technology for
competitive advantage. This will be useful to scholars, teachers and researchers in this study
area. This study will add more towards the debate that It truly can be used for Competitive
advantage.
The findings of this study will be of importance to ISPs, Government, Policy Makers, Investors,
researchers, IT consultants, academicians, scholars as well as teachers. This is because this
research will give an insight into the uses, challenges and impact on the use of information
technology for competitive advantage.
Governments will gain from this research by understanding some of the challenges faced by ISPs
and help to set regulatory/policy framework with regards to enabling IT use for competitive
advantage in the ISP industry. Policy makers will also benefits as they will be able to come up
with favourable policies that will promote the use of IT for Competitive advantage. Potential new
entrants and investors into the ISP market will also benefit from this research as they will gain
knowledge on how they can use IT to implement the strategies they have set while entering the
market, thus enabling them survive the competitive market. IT consultants will also benefit from
this study as they will after reading this research findings be able to advise their clients
appropriately further enabling from the successful implantation of any projects they may be
handling.
10
CHAPTER TWO: LITERATURE REVIEW
2.1 Introduction
There are several purposes for which IT can be used: amongst others, for value creation, problem
solving (Melville, Gurbaxani, & Kraeme, 2006), as well as for the purposes of communicating
(Ryssel & Ritter, 2004). IT usage enables efficiency and considering that IS must be able to
generate returns on investment, the usage of IT can also be seen as strategic and an important
competitive advantage enabler (Valacich & Schneider, 2010).
According to Strebinger and Traiblmaier (2006) IT has changed the structures and organizational
processes. Technology has caused organizations to become small, decreased the number of staffs
and organizational level, extended inside and outside organizational communication and also
decreased communication costs. According to Tabb (2006) In order to create sustainable
competitive advantage using information technology, we must first understand the influence of
technology on organizational activities and processes and know how to create value using it.
Porter and Millar (1985) highlighted three ways in which IT can impact competition among
business organizations, IT adoption establishes new businesses, develops competitive advantage
and also changes the industry structure. By adopting an appropriate technology, a business
organization can reach greater heights of competency, see improvements in its performance and
ensure that its competitive advantage is retained. Furthermore, in order to prevail against rivals in
today’s business environment, having precise information is crucial, which can only be attained
by having an appropriate IT infrastructure.
The Internet service providers look to gain competitive advantage by using Information
technology. They are motivated by different drivers towards the adoption of IT for Competitive
advantage and in the process face different challenges. After overcoming the challenges the ISPs
then see the impacts of their investment on IT through different dimensions.
11
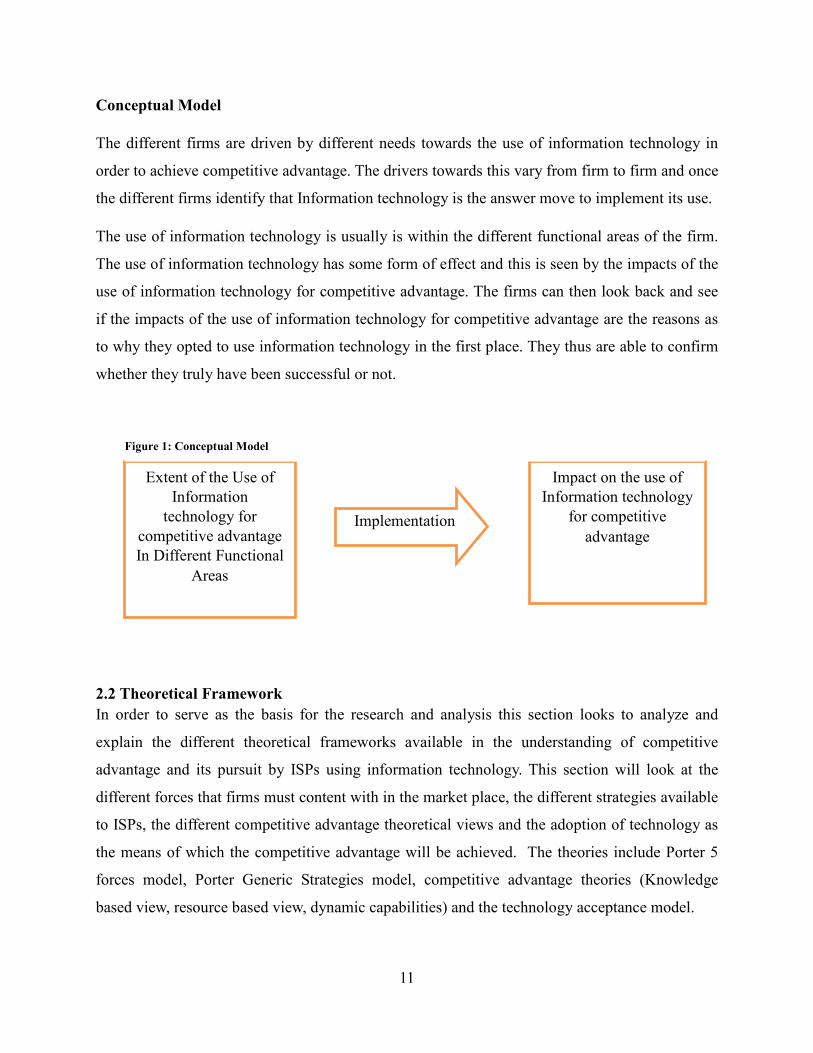
Conceptual Model
The different firms are driven by different needs towards the use of information technology in
order to achieve competitive advantage. The drivers towards this vary from firm to firm and once
the different firms identify that Information technology is the answer move to implement its use.
The use of information technology is usually is within the different functional areas of the firm.
The use of information technology has some form of effect and this is seen by the impacts of the
use of information technology for competitive advantage. The firms can then look back and see
if the impacts of the use of information technology for competitive advantage are the reasons as
to why they opted to use information technology in the first place. They thus are able to confirm
whether they truly have been successful or not.
2.2 Theoretical Framework
In order to serve as the basis for the research and analysis this section looks to analyze and
explain the different theoretical frameworks available in the understanding of competitive
advantage and its pursuit by ISPs using information technology. This section will look at the
different forces that firms must content with in the market place, the different strategies available
to ISPs, the different competitive advantage theoretical views and the adoption of technology as
the means of which the competitive advantage will be achieved. The theories include Porter 5
forces model, Porter Generic Strategies model, competitive advantage theories (Knowledge
based view, resource based view, dynamic capabilities) and the technology acceptance model.
Extent of the Use of
Information
technology for
competitive advantage
In Different Functional
Areas
Impact on the use of
Information technology
for competitive
advantage Implementation
(use of
Figure 1: Conceptual Model

12
Figure 2: Theoretical framework, Source Researcher
Source, Researcher 2014
2.2.1 Porter 5 Forces Model
According to Porter and Millar (1985) a firm develops its business strategies in order to obtain
competitive advantage over its rivals. This is done by responding to five primary forces: the
threat of new entrants, rivalry among existing firms within an industry, the threat of substitute
products or services, the bargaining power of suppliers, and the bargaining power of buyers .
The internet service provision industry in Kenya is besieged by these forces. There are New
entrants into the market place. Some of these entrants include Virtual ISPS (Piggy Back on Other
providers) as well as the undersea cable firms. Another firm that recently joined the
infrastructure market was the KPLC which offers overhead fibre network over long distances.
Supplier bargaining power has also being seen with those having a huge IP transit customer base
and infrastructure offering different levels of service. New substitutes services are being offered
as ways to access the internet using alternative means. This has been driven by the mobile phone
companies offering 3G and 4G services.

13
Figure 3: Porter 5 Forces Model
Source: Harvard Business Review, 2008
2.2.2 Porter Generic Strategies Model
Porter (1985) considered that in the long-term the extent to which a firm is able to create a
defensible position in an industry is a major determinant of the success with which it will out-
perform its competitors. He proposed generic strategies by which a firm can develop a
competitive advantage and create a defensible position. These include overall cost leadership,
differentiation and focus.
Porter (1980) argued that implementing them successfully requires different resources and skills,
organizational arrangements, control procedures and incentive systems. The generic strategies
may also require different styles of leadership and can translate into very different corporate
cultures and atmosphere.
2.2.3 Resourced Based View of Competitive Advantage
The Resource Based View (RBV) says that the way in which resources are applied within a firm
can create a competitive advantage (Wernerfert, 1984). It says that an organization’s human
capital management practices can contribute significantly to sustaining competitive advantage by
creating specific knowledge, skills and culture within the firm that are difficult to imitate (Mata,
Fuerst, & Barney, 1995).
14
This view is based on two main assumptions, resource diversity and resource immobility (Mata
et al, 1995). According to Mata et al. (1995) Resource diversity pertains to whether a firm owns a
resource or capability that is also owned by numerous other competing firms, then that resource
cannot provide a competitive advantage and Resource immobility refers to a resource that is
difficult to obtain by competitors because the cost of developing, acquiring or using that resource
is too high. In order to create human capital resource diversity and immobility, an organization
must have adequate human capital management practices, organizational processes, knowledge
management practices and systems, educational opportunity and social interaction practices in
place (Barney, 1991) .
2.2.4 Knowledge Based View (KBV)
This view sees knowledge as the most important strategic resource and is concerned about how
knowledge affects strategic management, the coordination within the firm and the organizational
structure (Grant, 1996). Alchian and Demsetz (1972) observed that efficient production with
heterogeneous resources is a result not of having better resources but in knowing more accurately
the relative productive performances of those resources. This approach considers firms as bodies
that generate, integrate and distribute knowledge (Narasimha, 2000). The ability to create value
is not based as much upon physical or financial resources as on a set of intangible knowledge
based capabilities. According to the KBV competitive success is governed by the capability of
organisations to develop new knowledge-based assets that create core competencies (Pemberton
& Stonehouse, 2000). KBV makes the assumption that the critical input in production and
primary source of value is knowledge (Grant, 1996).
According to Raft and Lord (2002) Firms that possess stocks of organizational knowledge
associated with value that could be described as uncommon or idiosyncratic, stand a good chance
of generating sustaining high returns.
2.2.5 Dynamic Capabilities View (DCV)
This view focuses on determining the capabilities of firms that can become a source of
competitive advantage and how resources can be developed, deployed and protected by the firm
in order to make this advantage sustainable (Teece, Shuen, & Pisano, 1997). Amit and
15
Schoemaker (1993) define capabilities are the capacity a firm has to deploy resources.
Knowledge is a resource and a process, and transferring information within the firm by feedback
can be a strategic resource that helps evaluate the current allocation or deployment of resources
and compare it to the expectations or goals that the firm had as objective (Earley et al 1990).
2.2.6 Technology Acceptance Model (TAM)
The Technology Acceptance Model (TAM), is used to explain user acceptance of technology, has
been extensively researched since first introduced by Fred D. Davis in 1989. TAM suggests that
usefulness and ease of use are beliefs about a certain technology that have influence over an
individual’s attitude toward actual use of that technology (Porter & Donthu,2006).
2.3 Drivers for the Use of IT for Competitive Advantage
Turban et al (2006) introduces factors that push firms towards use of It for Competitive
advantage owing to role played by IT in Strategic Management. Turban cites innovation and
competitive intelligence as some of the reasons for using IT for strategic advantage.
IT helps create innovative applications that provide direct strategic advantage to organizations. A
study by Talebnejad (2008) concluded that organisations use information technology as a tool to
gain competitive advantage. The competitive advantage gained enables the organisation to be
able to, codify, execute and control strategies related to organisational levels and business
operations to achieve approval of stakeholders through innovation.
Competitive intelligence is aided by IT when IT is used collecting and analysing information
about products, markets, competitors, and environmental changes (Guimaraes & Armstrong,
1997). Prescott and Gibbons (1996) define competitive intelligence as a formalised continuous
evolving process by which a management team access evolution of its industry, capabilities and
behaviour of its current competitors to assist in maintaining or developing competitive
advantage. A study by Prescott & Bhardwaj (1995) shows that Competitive intelligence
programs provide benefits such as Influencing actions of decision-makers, Improving early
warning signals, Identifying new opportunities, Exploiting competitor vulnerabilities, Sharing of
ideas and Better serving the company’s customers.
16
A study by Wang (2008) found that ICT offered several advantages to hotels of all sizes. The
advantages included increased effectiveness due to cost decrease and revenue expansion and
quality customer relationships due to personal contact services and dialogue with customers.
2.4 Challenges in the use of ICT for Competitive Advantage
According to Piccoli and Ives (2005) the challenges/barriers that erode competitive advantage
can be grouped into the following IT-resources barrier, complementary-resources barrier, IT-
project barrier, and pre-emption barrier.
IT Project Barrier indicates that Since IT-dependent strategic initiatives rely on an essential
enabling IT core, they cannot be implemented until the necessary technology has been
successfully introduced. IT Resources and Capabilities Barrier indicates that IT-dependent
strategic initiatives rely on IT to support a complex network of activities. These initiatives are
dependent on access to the resources and capabilities necessary to produce and utilize the
technology. As the strategy becomes more reliant on pre-existing IT resources sources or
repositories) and capabilities, it becomes increasingly difficult to copy. Complementary
Resources Barrier indicates that in order to implement an IT-dependent strategic initiative, the
firm must develop or acquire the necessary complementary resources for IT. Pre-emption Barrier
indicates that IT-dependent strategic initiative pioneered by the first mover creates preferential
relationships with customers or other members of the value system and thereby introduces
substantial switching costs (Piccoli & Ives, 2005).
A study by Arvidsson, Holmström and Lyytinen (2014) Suggested three key challenges to the
successful implementation of an IS strategy. These challenges include achieving alignment
between business strategy and IS system capabilities, implementing the system in the
organisation and shaping the use of the system and related practices to achieve alignment with
strategy. Merali, Papadopoulos and Nadkarni (2012) further suggests that the major challenge is
dealing with the complexity of how the different challenges will play out in a dynamic, network,
political and economic environment.

17
2.5 Impact on the use of ICT for Competitive Advantage
Teece, Shuen and Pisano (1997) found that IT investments can lead to developing IT capabilities
and dynamic IT competencies which lead to low cost, value added, speed, agility, innovation,
and customer service.
Porter and Millar (1996) noted that IT affects competition in three fundamental ways. These
include IT changes industry structure thus altering the rules of competition, creates competitive
advantage by giving companies new way to outperform their rivals and brings about new
businesses from existing operations.
A study by Issa-Salwe, Ahmed, Aloufi, and Kabir (2010) found that most of the effect of the
implementation of IS for strategic advantage assists companies achieving their business goals.
Such companies improve on their competence and efficiency and that some of the benefits are
not so beneficial. They also found that a new system is more than just hardware and software that
it’s also the people and organisation. They further found that the use of information systems
requires cultural change with resistance being overcome by effective communications and
training.
A study by Fadum (2013) found that development of Information communications technology
promotes good governance; facilitate timely information processing and distribution, and
impacts positively on the organizations performance. He further found that there was a positive
relationship between ICT adoption and profitability.
18
CHAPTER THREE: RESEARCH METHODOLOGY
3.1 Introduction
This chapter provides an overview of the strategy that was used to conduct the research. This
chapter contains the research design, study population, sampling techniques, data collection
methods and methods of data analysis.
3.2 Research Design
This used descriptive survey design/methodology. Descriptive survey research is designed to
provide a picture of how the situation is in its natural setup/environment. Its can further be
defined as a scientific method that involves the observation and description of the behaviour of a
subject/situation without influencing the subject/situation in anyway.
3.3 Population
The target population was the Internet Service Providers in Kenya. The population size was 44
and was obtained from TESPOK on 15th September 2014. The list is shown in Appendix 1. A
census of the ISPs in Kenya was conducted to obtain the data. Census method was used in
carrying out of this research. This method was chosen as it provides a true measure of the
population and will aid in providing benchmark data that can be used for future studies.
3.4 Data Collection
Primary data was collected through the use of a questionnaire. The Questionnaire had four
sections. Section A captured demographic information. Section B captured the drivers for the use
of Information technology for Competitive advantage. Section C captured the challenges faced in
the use of IT for competitive advantage. Section D captured the impact on the use of IT for
strategic advantage.
The questionnaire that was used for this research is provided on Appendix II. The questionnaires
were delivered to respondents using the “drop and pick later method” and also through the use of
email. The respondents who received the questionnaire through email were required to do either
of the following print out the questionnaire and fill it before waiting for the researcher to pick it
up, some were to fill online then convert the questionnaire before returning it back and some
19
printed the questionnaire filled it before scanning it and emailing it to the researcher. The target
respondents were Chief Operation Officers and Chief Technology Officers in the different
organisations.
3.5 Data Analysis
According to Bryman and Bell (2003) data analysis refers to a technique used to make inferences
from data collected by means of a systematic and objective identification of specific
characteristics. Once data was collected from the population it was audited to verify
completeness and then coded.
The questionnaire section A, B, C, D and E was analyzed using descriptive statistics. Section E
was also analyzed using Regression analysis.
20
CHAPTER FOUR: DATA ANALYSIS, FINDINGS AND DISCUSSION
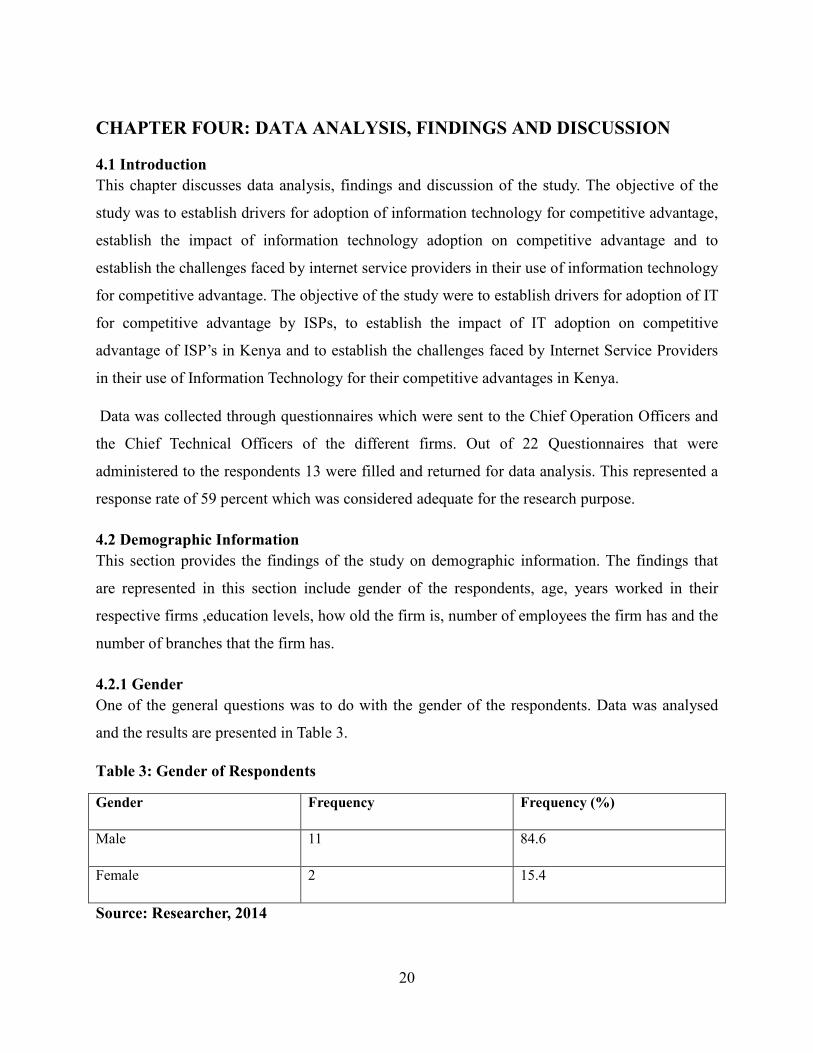
4.1 Introduction
This chapter discusses data analysis, findings and discussion of the study. The objective of the
study was to establish drivers for adoption of information technology for competitive advantage,
establish the impact of information technology adoption on competitive advantage and to
establish the challenges faced by internet service providers in their use of information technology
for competitive advantage. The objective of the study were to establish drivers for adoption of IT
for competitive advantage by ISPs, to establish the impact of IT adoption on competitive
advantage of ISP’s in Kenya and to establish the challenges faced by Internet Service Providers
in their use of Information Technology for their competitive advantages in Kenya.
Data was collected through questionnaires which were sent to the Chief Operation Officers and
the Chief Technical Officers of the different firms. Out of 22 Questionnaires that were
administered to the respondents 13 were filled and returned for data analysis. This represented a
response rate of 59 percent which was considered adequate for the research purpose.
4.2 Demographic Information
This section provides the findings of the study on demographic information. The findings that
are represented in this section include gender of the respondents, age, years worked in their
respective firms ,education levels, how old the firm is, number of employees the firm has and the
number of branches that the firm has.
4.2.1 Gender
One of the general questions was to do with the gender of the respondents. Data was analysed
and the results are presented in Table 3.
Table 3: Gender of Respondents
Gender Frequency Frequency (%)
Male 11 84.6
Female 2 15.4
Source: Researcher, 2014

21
From Table 3, 11 of the respondents were male with 2 being female. The conclusion from this
data is that the persons who hold the post of either Chief Operational Officer or Chief technical
officers are male.
4.2.2 Age of respondents
The study sought to find the age of the respondents. Data collected was analysed and is presented
in Table 4.
Table 4: Age of Respondents
Age Bracket (Yrs) Frequency Frequency (%)
18-25 0 0
26-30 4 30.77
31-35 4 30.77
36-40 2 15.39
41-45 2 15.39
46-50 1 7.69
Above 50 0 0
Source: Researcher, 2014
From the Table 4, the ages of between 26 to 30 and 31 to 35 is where majority of the respondents
lay. Each of these age brackets had 4 respondents falling in their respective categories. The
conclusion obtained from this data is that most of those in these positions are young individuals
4.2.3 Years Worked For the Firm
The years that the respondent had worked in the firm was also investigated. Data was collected
and analysed and the results are presented in Table 5.
22
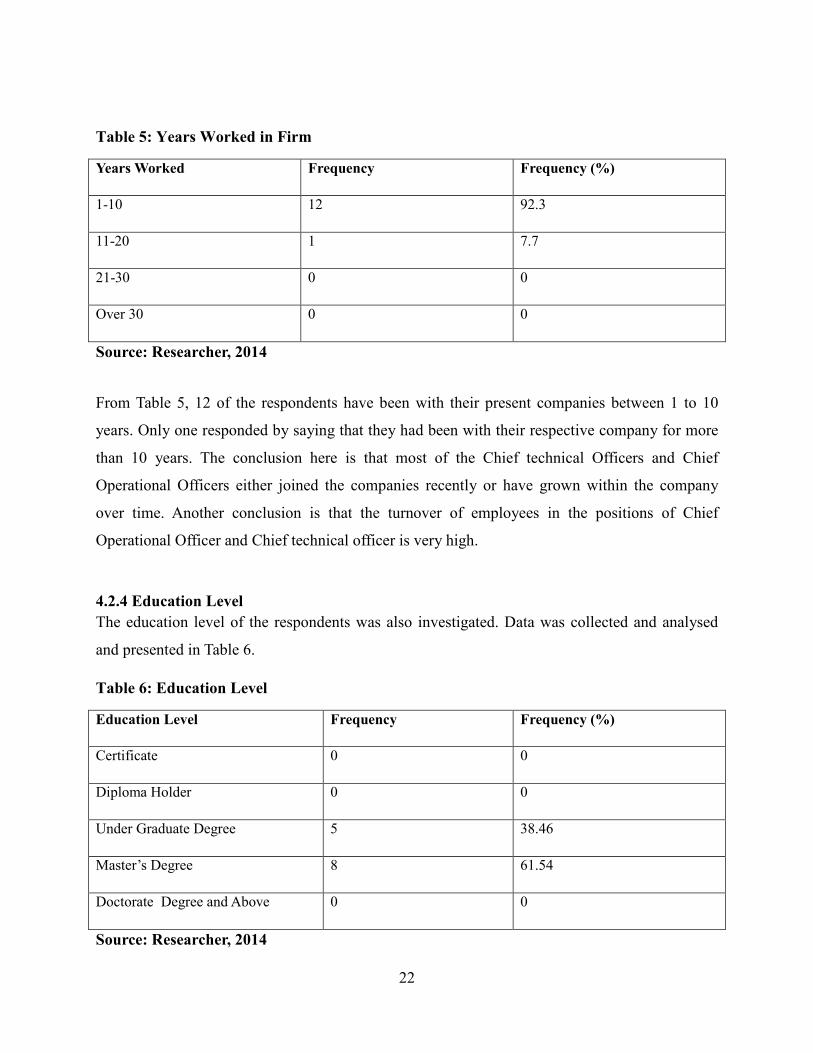
Table 5: Years Worked in Firm
Years Worked Frequency Frequency (%)
1-10 12 92.3
11-20 1 7.7
21-30 0 0
Over 30 0 0
Source: Researcher, 2014
From Table 5, 12 of the respondents have been with their present companies between 1 to 10
years. Only one responded by saying that they had been with their respective company for more
than 10 years. The conclusion here is that most of the Chief technical Officers and Chief
Operational Officers either joined the companies recently or have grown within the company
over time. Another conclusion is that the turnover of employees in the positions of Chief
Operational Officer and Chief technical officer is very high.
4.2.4 Education Level
The education level of the respondents was also investigated. Data was collected and analysed
and presented in Table 6.
Table 6: Education Level
Education Level Frequency Frequency (%)
Certificate 0 0
Diploma Holder 0 0
Under Graduate Degree 5 38.46
Master’s Degree 8 61.54
Doctorate Degree and Above 0 0
Source: Researcher, 2014

23
From Table 6, we see that majority of the respondents and Master’s Degree with 8 out of the 13
holding this level of Education. The conclusion from this is that the posts of the Chief
Operational Officers and Chief Technical Officers is one that requires a high level of education
with a Master’s Degree being key to qualification for these posts.
4.2.5 Years the Firm has been in Existence
The number of years that the firm has been in existence was also investigated. Data collected
was analysed and presented in Table 7.
Table 7: Years the Firm has been in Existence
Years Firm Has been in Existence Frequency Frequency (%)
1-10 9 69.23
11-20 3 23.08
21-30 0 0
Over 30 1 7.69
Source: Researcher, 2014
From Table 7 we see that majority of the firms are not more than 10 years old. From Table 7 we
see that 9 out of the 13 respondents had been with their respective companies for between 1 to 10
years. Only one of the respondents had been with the firm for over 30 years.This particular
company was internationally based with branches all over Africa and the world. Thus we can
conclude that most of the Internet Service providers in Kenya began shop not more than 10 years
ago.
4.2.6 Number of Employees in the Firm
The number of employees that the firm has was also investigated. Data collected was analysed
and presented in Table 8.
24
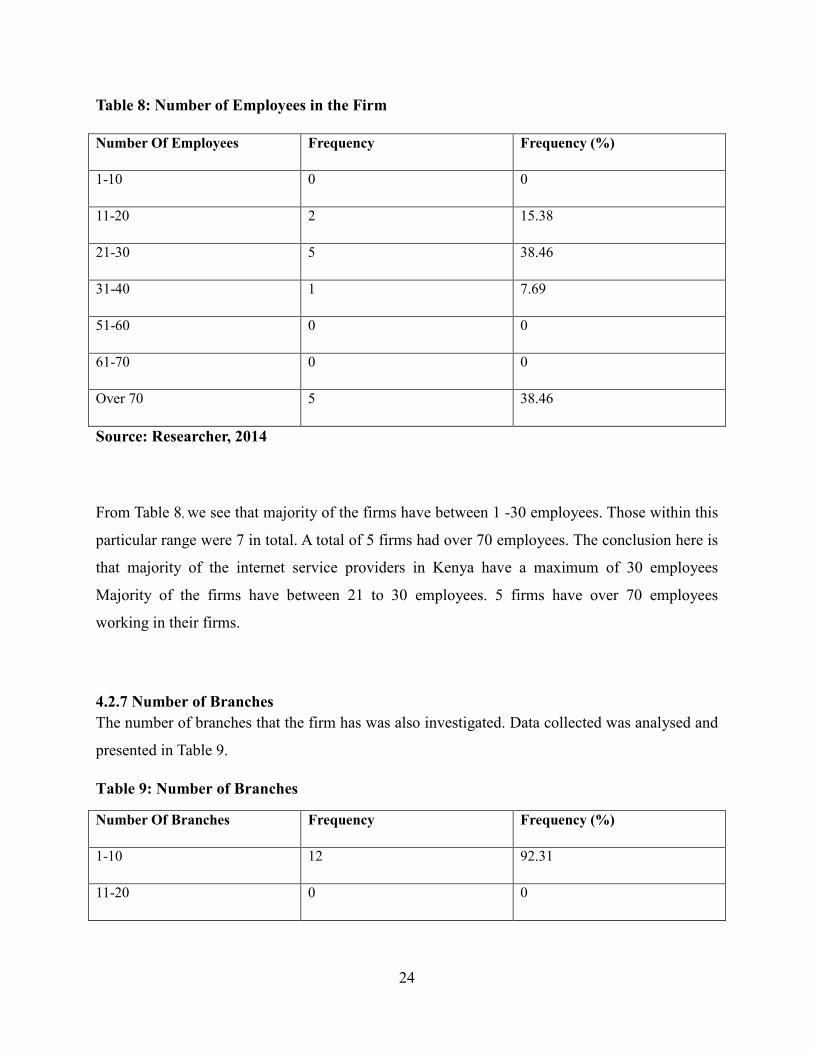
Table 8: Number of Employees in the Firm
Number Of Employees Frequency Frequency (%)
1-10 0 0
11-20 2 15.38
21-30 5 38.46
31-40 1 7.69
51-60 0 0
61-70 0 0
Over 70 5 38.46
Source: Researcher, 2014
From Table 8, we see that majority of the firms have between 1 -30 employees. Those within this
particular range were 7 in total. A total of 5 firms had over 70 employees. The conclusion here is
that majority of the internet service providers in Kenya have a maximum of 30 employees
Majority of the firms have between 21 to 30 employees. 5 firms have over 70 employees
working in their firms.
4.2.7 Number of Branches
The number of branches that the firm has was also investigated. Data collected was analysed and
presented in Table 9.
Table 9: Number of Branches
Number Of Branches Frequency Frequency (%)
1-10 12 92.31
11-20 0 0

25
21-30 0 0
31-40 1 7.69
51-60 0 0
61-70 0 0
Over 70 0 0
Source: Researcher, 2014
From the data, majority of the firms had between 1 to 10 branches. Only one had more than 10
braches. The conclusion from this is that majority of the firms don’t have not more than 10
branches and that the possibility that these majority of these branches might be at similar
locations exists.
4.3 Extent of Information Technology Use by Functional Area
The research investigated the extent that Information technology has been used in the different
functional areas within the firm. The data collected was mapped on a 5 point Likert Scale with:
1-Strongly Disagree, 2-Disagree, 3-Neutral, 4-Agree, 5-Strongly Agree. The means and
standard deviation for this data were computed and tabulated. The mean indicates the average
response on a particular functional area. The Standard deviation indicates variation from the
average response. A high standard deviation indicates a high variation from the average response
whereas a small standard deviation indicates a small variation. The means where interpreted
according to Likert Scale where for example a mean of 4.12 is reduced and rounded to 4.0 before
being mapped to the Likert Scale to indicate that there was agreement. Results of the analysis
are presented in Table 10.

26
Table 10: Extent of IT Use in Functional Areas
FUNCTIONAL AREA 1 2 3 4 5 MEAN SD
Finance 1 1 5 6 0 2.8 2.7
Technical Operations 0 0 3 6 4 3.5 2.61
Human Resources 4 1 3 4 1 2.4 1.52
Sales 2 3 5 2 1 2.4 1.52
Marketing 1 4 3 4 1 2.6 1.52
Research and Development 3 5 2 3 0 2.07 1.82
Customer Relations 0 2 1 5 5 3.47 2.30
Office Administration 2 3 4 3 1 2.47 1.14
Source: Researcher, 2014
Data in Table 10 shows that the respondents agreed on the use of Information technology for
competitive advantage in finance had a mean of 2.8 and a standard deviation of 2.7. From them
mean we can conclude that the respondents disagreed that information technology is not used for
competitive advantage in finance function of the firms.
Data in table 10 shows that in the technical function of the firms use of information technology
for competitive advantage the mean was 3.5 and the standard deviation was 2.6. From the mean
we can conclude that the respondents were neutral on the use of information technology for
competitive advantage in the technical function of the firm.
In the human resources function we have a mean of 2.4 and the standard deviation as 1.52. From
the mean this showed that the respondents disagreed with the use of Information technology for
strategic advantage in the human resource function of the organisation.
In the sales function we have a mean of 2.4 and standard deviation of 1.52.From the mean this
showed that the respondents disagreed that there was usage that information technology was
used for competitive advantage in the sales function.
In the marketing function of the firm we have a mean of 2.6 and standard deviation of 1.52.
27
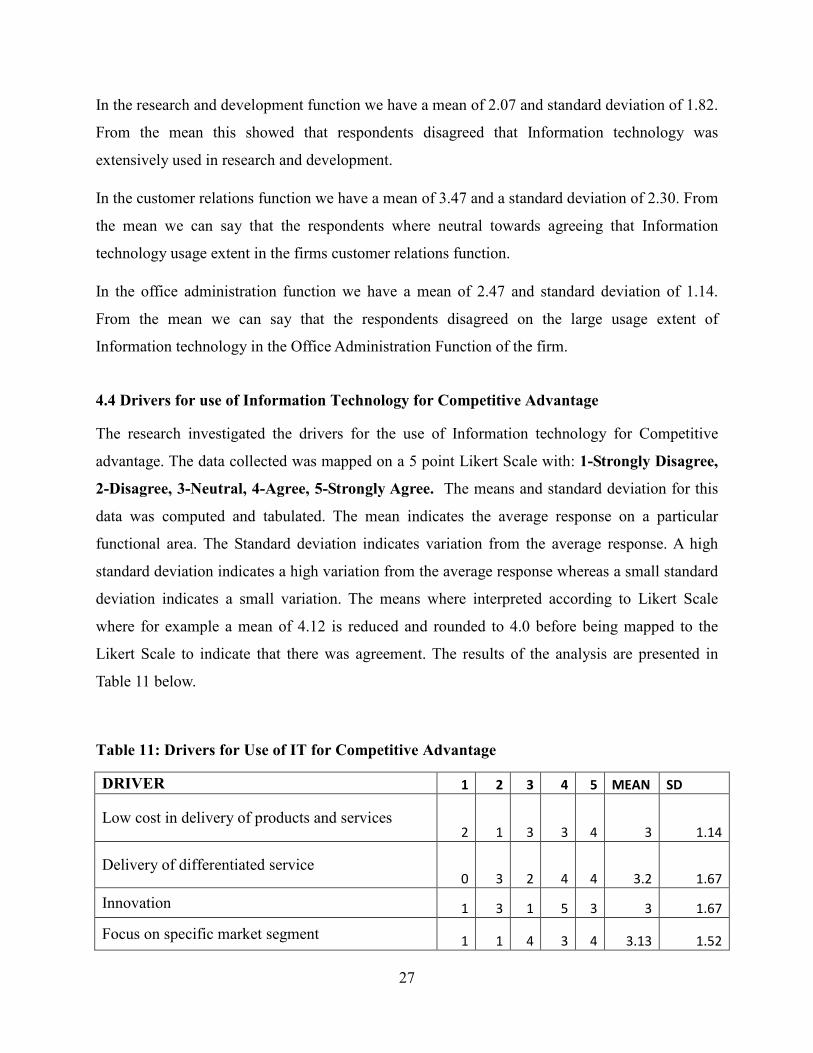
In the research and development function we have a mean of 2.07 and standard deviation of 1.82.
From the mean this showed that respondents disagreed that Information technology was
extensively used in research and development.
In the customer relations function we have a mean of 3.47 and a standard deviation of 2.30. From
the mean we can say that the respondents where neutral towards agreeing that Information
technology usage extent in the firms customer relations function.
In the office administration function we have a mean of 2.47 and standard deviation of 1.14.
From the mean we can say that the respondents disagreed on the large usage extent of
Information technology in the Office Administration Function of the firm.
4.4 Drivers for use of Information Technology for Competitive Advantage
The research investigated the drivers for the use of Information technology for Competitive
advantage. The data collected was mapped on a 5 point Likert Scale with: 1-Strongly Disagree,
2-Disagree, 3-Neutral, 4-Agree, 5-Strongly Agree. The means and standard deviation for this
data was computed and tabulated. The mean indicates the average response on a particular
functional area. The Standard deviation indicates variation from the average response. A high
standard deviation indicates a high variation from the average response whereas a small standard
deviation indicates a small variation. The means where interpreted according to Likert Scale
where for example a mean of 4.12 is reduced and rounded to 4.0 before being mapped to the
Likert Scale to indicate that there was agreement. The results of the analysis are presented in
Table 11 below.
Table 11: Drivers for Use of IT for Competitive Advantage
DRIVER 1 2 3 4 5 MEAN SD
Low cost in delivery of products and services 2 1 3 3 4 3 1.14
Delivery of differentiated service 0 3 2 4 4 3.2 1.67
Innovation 1 3 1 5 3 3 1.67
Focus on specific market segment 1 1 4 3 4 3.13 1.52

28
Reduced competitive disadvantage 1 2 2 6 1 2.67 2.07
Increase in productivity 1 1 1 6 4 3.33 2.30
Increased speed of operations 0 1 0 4 8 3.87 3.44
Improved quality of products and services 0 2 3 4 4 3.27 1.67
Competitive Intelligence 1 3 4 3 2 2.73 1.14
Improvement on the relationship with Customers
and Suppliers 0 2 1 5 5 3.47 2.30
Lock-in of Customers and Suppliers 1 4 2 3 3 2.8 1.14
Generation of Databases to improve on Marketing 1 4 2 4 2 2.73 1.34
Creation of Barriers for Competitor entry 2 2 5 2 2 2.6 1.34
Establishment of High Switching costs 1 4 3 1 3 2.47 1.34
Source: Researcher, 2014
From the data the highest mean was 3.87 which represented the use of information technology to
increase the speed of operations. The lowest was 2.47 and this represented the use of information
technology to provide high switching costs for customers. The highest deviation was The
standard deviation for this was 3.435113. The mean of 3.87 indicates that most of the
respondents were neutral on the use
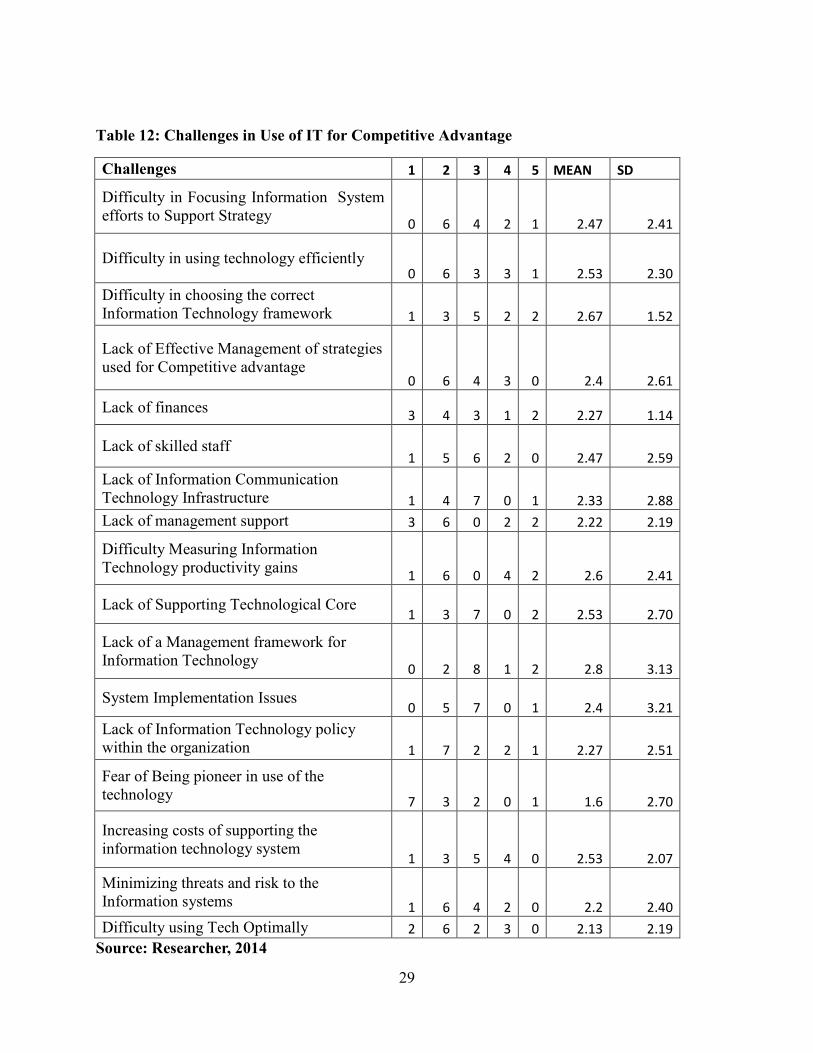
4.5 Challenges in Use of Information Technology for Competitive Advantage
The research investigated the challenges in the use of information technology for competitive
advantage. The data collected was mapped on a 5 point Likert Scale with: 1-Strongly Disagree,
2-Disagree, 3-Neutral, 4-Agree, 5-Strongly Agree. The means and standard deviation for this
data was computed and tabulated. The mean indicates the average response on a particular
functional area. The Standard deviation indicates variation from the average response. A high
standard deviation indicates a high variation from the average response whereas a small standard
deviation indicates a small variation. The means where interpreted according to Likert Scale
where for example a mean of 4.12 is reduced and rounded to 4.0 before being mapped to the
Likert Scale to indicate that there was agreement. The results of the analysis are presented in
Table 12.
29
Table 12: Challenges in Use of IT for Competitive Advantage
Challenges 1 2 3 4 5 MEAN SD
Difficulty in Focusing Information System
efforts to Support Strategy 0 6 4 2 1 2.47 2.41
Difficulty in using technology efficiently 0 6 3 3 1 2.53 2.30
Difficulty in choosing the correct
Information Technology framework 1 3 5 2 2 2.67 1.52
Lack of Effective Management of strategies
used for Competitive advantage 0 6 4 3 0 2.4 2.61
Lack of finances 3 4 3 1 2 2.27 1.14
Lack of skilled staff 1 5 6 2 0 2.47 2.59
Lack of Information Communication
Technology Infrastructure 1 4 7 0 1 2.33 2.88
Lack of management support 3 6 0 2 2 2.22 2.19
Difficulty Measuring Information
Technology productivity gains 1 6 0 4 2 2.6 2.41
Lack of Supporting Technological Core 1 3 7 0 2 2.53 2.70
Lack of a Management framework for
Information Technology 0 2 8 1 2 2.8 3.13
System Implementation Issues 0 5 7 0 1 2.4 3.21
Lack of Information Technology policy
within the organization 1 7 2 2 1 2.27 2.51
Fear of Being pioneer in use of the
technology 7 3 2 0 1 1.6 2.70
Increasing costs of supporting the
information technology system 1 3 5 4 0 2.53 2.07
Minimizing threats and risk to the
Information systems 1 6 4 2 0 2.2 2.40
Difficulty using Tech Optimally 2 6 2 3 0 2.13 2.19
Source: Researcher, 2014

30
The data in Table shows the highest mean as being 2.8 and the lowest being 1.6. The mean of 2.8
was captured on the lack of a management framework for information technology challenge.
This challenge had a standard deviation of 3.13. The lowest mean was on the challenge of being
fearful of being a pioneer in the use of the technology.
4.6 Impact of adoption of Information Technology on the firms Competitive
The research investigated the impact of the adoption of information technology for competitive
advantage. The data collected was mapped on a 5 point Likert Scale with: 1-Strongly Disagree,
2-Disagree, 3-Neutral, 4-Agree, 5-Strongly Agree. The data was analysed using mean,
standard deviation and regression analysis.
4.6.1 Means and Standard Deviation
The means and standard deviation for this data was computed and tabulated. The mean indicates
the average response on a particular functional area. The Standard deviation indicates variation
from the average response. A high standard deviation indicates a high variation from the average
response whereas a small standard deviation indicates a small variation. The results of the
analysis are presented in Table 11.
Table 13: Impacts of use of IT for Competitive Advantage
Impacts of Use of Information Technology for
Competitive Advantage 1 2 3 4 5 MEAN SD
Low cost delivery of products and services 0 1 3 7 2 3.27 2.70
Differentiated Services and products 0 2 4 4 3 3.13 1.67
Improvement on Innovation 0 3 4 3 3 3 1.52
Focus on specific market segment 0 2 1 8 2 3.27 3.13
Reduced competitive disadvantage 0 3 2 6 2 3.06 2.19
31
Increase in productivity 0 2 2 5 4 3.33 1.95
Increased switching costs for customers 0 5 3 5 0 2.6 2.51
Lowered supplier power 2 2 3 5 1 2.67 1.52
Lowered buyer power 2 3 4 4 0 2.4 1.67
Increased costs of entry to its industry by competitors 1 4 6 1 1 2.4 2.30
Improved Communication and information flow 0 3 0 4 6 3.47 2.61
Improved Decision Making 0 1 0 6 6 3.73 3.13
Company growth 0 1 1 6 5 3.6 2.70
Company expansion 0 1 2 6 4 3.47 2.41
Source: Researcher, 2014
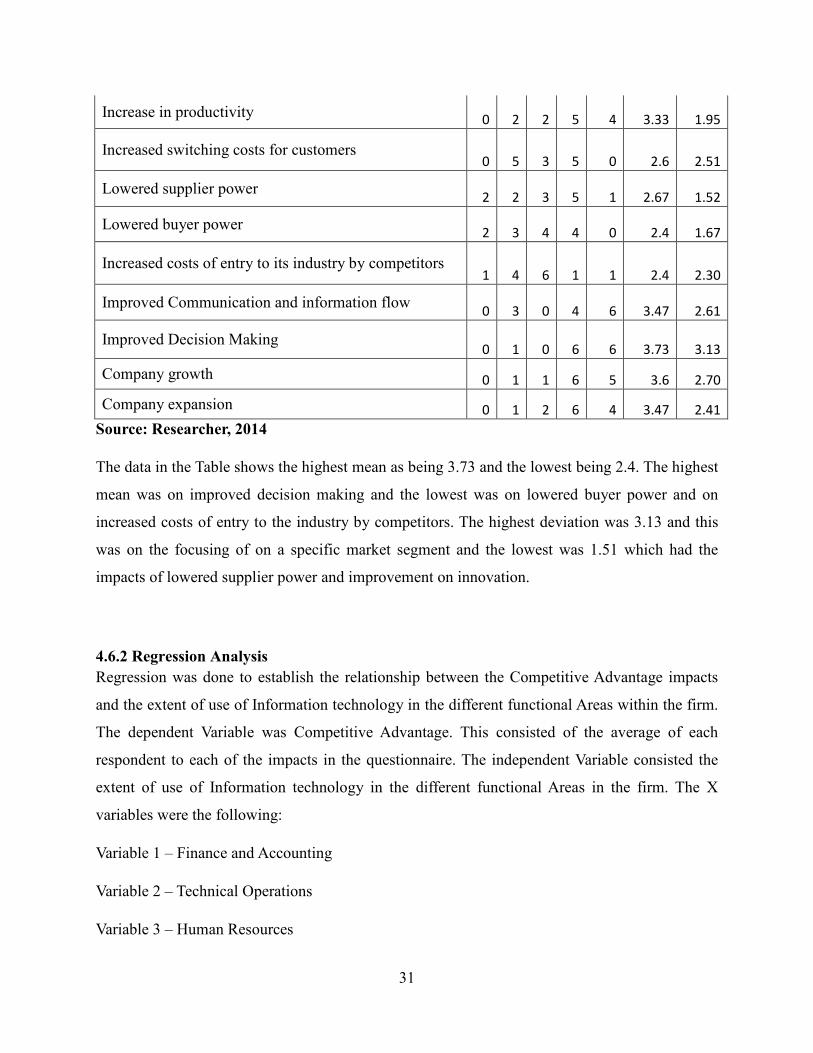
The data in the Table shows the highest mean as being 3.73 and the lowest being 2.4. The highest
mean was on improved decision making and the lowest was on lowered buyer power and on
increased costs of entry to the industry by competitors. The highest deviation was 3.13 and this
was on the focusing of on a specific market segment and the lowest was 1.51 which had the
impacts of lowered supplier power and improvement on innovation.
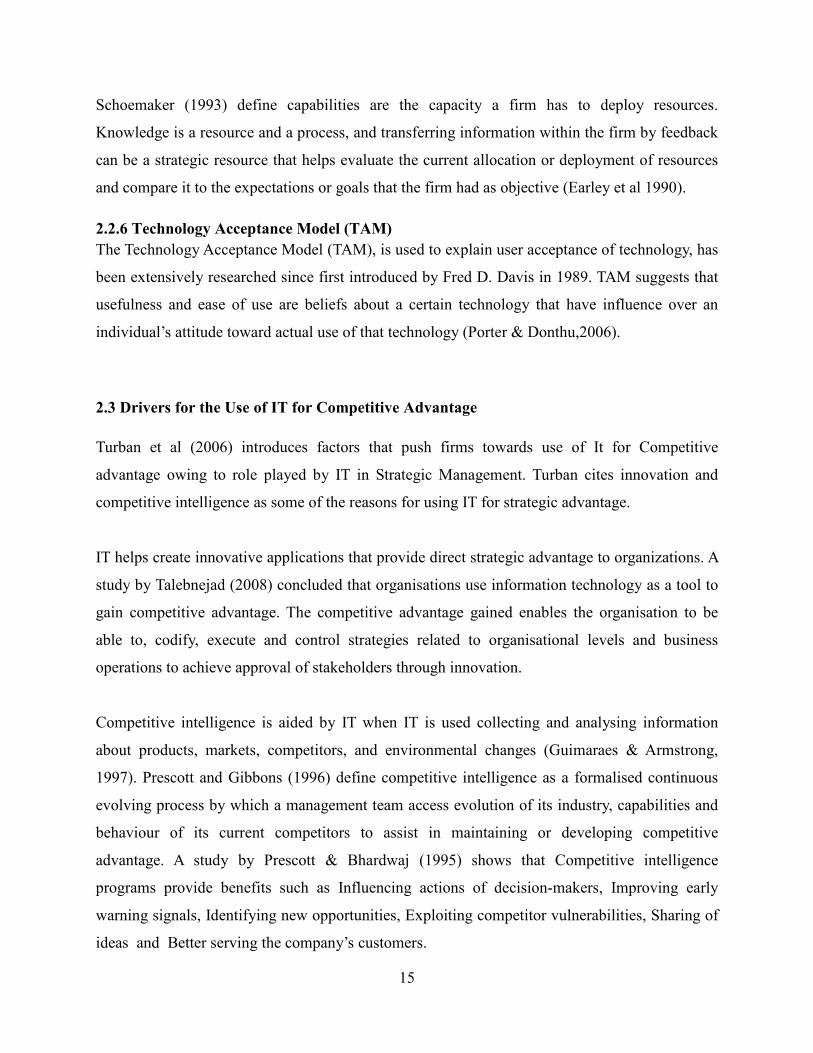
4.6.2 Regression Analysis
Regression was done to establish the relationship between the Competitive Advantage impacts
and the extent of use of Information technology in the different functional Areas within the firm.
The dependent Variable was Competitive Advantage. This consisted of the average of each
respondent to each of the impacts in the questionnaire. The independent Variable consisted the
extent of use of Information technology in the different functional Areas in the firm. The X
variables were the following:
Variable 1 – Finance and Accounting
Variable 2 – Technical Operations
Variable 3 – Human Resources

32
Variable 4 – Sales
Variable 5 – Marketing
Variable 6 – Research and development
Variable 7 – Customer Relationship Management
Variable 8 – Office Administration
Figure 4: Regressed Competitive Advantage
Regression Statistics
Multiple R 0.89839901
R Square 0.80712077
Adjusted R Square 0.42136232
Standard Error 0.58371052
Observations 13
ANOVA
df SS MS F Significance F
Regression 8 5.703062161 0.712883 2.092296 0.2482051
Residual 4 1.362871905 0.340718
Total 12 7.065934066
Coefficients Standard Error t Stat P-value Lower 95% Upper 95% Lower 95.0% Upper 95.0%
Intercept 4.27060648 1.949379107 2.190752 0.093613 -1.1417376 9.6829506 -1.1417376 9.68295056
X Variable 1 0.24399691 0.276247892 0.883253 0.426989 -0.5229902 1.010984 -0.5229902 1.01098402
X Variable 2 -0.64882452 0.73760393 -0.879638 0.428728 -2.6967413 1.3990923 -2.69674134 1.3990923
X Variable 3 0.59579529 0.281558392 2.116063 0.101792 -0.1859361 1.3775267 -0.18593613 1.37752671
X Variable 4 -1.74164301 0.583552002 -2.984555 0.040556 -3.3618431 -0.1214429 -3.36184311 -0.12144291
X Variable 5 1.29273454 0.57705595 2.240224 0.0886 -0.3094296 2.8948987 -0.30942963 2.8948987
X Variable 6 0.35643128 0.483916831 0.736555 0.502257 -0.9871372 1.6999998 -0.98713724 1.69999979
X Variable 7 -0.00837907 0.269587443 -0.031081 0.976694 -0.7568738 0.7401157 -0.75687381 0.74011567
X Variable 8 -0.12588763 0.220331032 -0.571357 0.598329 -0.7376246 0.4858494 -0.73762464 0.48584939
Source: Researcher, 2014
From the regression we find that R Square was 0.8071 which is slightly higher than 0.80
meaning that there is a good fit for the data.
33
CHAPTER FIVE: SUMMARY OF FINDINGS, CONCLUSION AND
RECOMMENDATIONS
5.1 Introduction
This section provides the summary of findings, conclusions and recommendations that are made
from the study after considering the study’s findings. The objective of the study were to establish
drivers for adoption of IT for competitive advantage by ISPs, to establish the impact of IT
adoption on competitive advantage of ISP’s in Kenya and to establish the challenges faced by
Internet Service Providers in their use of Information Technology for their competitive
advantages in Kenya.
5.2 Summary of Findings
5.2.1 Demographic Information
This section provides a summary of the findings from the study with regards to demographics.
The study found that males form a large percentage of the Chief Operational officer and Chief
Technical Officer Positions in most Internet service provider firms. The ages of those in these
positions lay primarily between 26 to 35 years of age. Most of the firms seem to have been
formed within a 10 year period. This 10 year period seemed to have been a boom period in the
Internet services provider sector thus the high number of firms falling within this age bracket.
Education is a key factor and majority of respondents had master’s degree level as the highest
level of education attained. The different firms had different number of employees with majority
of the firms having not more than 30 employees. The different firm’s seemed to have the same
number of branches with majority of the firms having branches of between 1 and 10.
5.2.2 Extent of Technology use in Different Functional Area
The use of information technology for competitive advantage was seen to be highest in technical
operations. From this we can conclude that ISPs in Kenya value their technical operations and
hence have seen the importance of using Information technology in this area. Internet Service
providers offer technology oriented products and service and hence this could be one of the
reasons why they see the application of information technology to technical operations as key to
achieving competitive advantage.

34
5.2.3 Drivers for the use of Information technology For Competitive Advantage
Increased speed of operations had the highest mean. From this we can conclude that ISPs in
Kenya see the speed of operations as critical to their competitiveness and have hence applied
Information technology to boost their competitiveness. The internet service provider market is
service based and hence could explain why the speed of operations is viewed as being key.
The driver with the lowest mean was creation of barriers for competitor entry. We can thus
conclude that most of the firms were not concerned about using information technology as a
mean of blocking future new entrants from the market. They were more concerned with
increasing their speed of operations.
5.2.4 Challenges in Use of Information Technology for Competitive Advantage
The difficulty in choosing the correct Information technology framework had the highest mean.
From this we can conclude that the correct choice of technology framework is critical towards
the use of information technology for competitive advantage by internet service providers in
Kenya. We can thus conclude that the wrong choice of Information Technology framework could
lead to the firm not enjoying competitive advantage through the use of Information Technology.
The fear of being the pioneer in the use of technology was had the least mean. From this we can
conclude that the firms would like to be pioneers in use of technology as technology would mark
them out from competitors and give them the competitive edge that they seek.
5.2.5 Impact of the Adoption of Information Technology for Competitive Advantage
The greatest impact on the use of information technology for competitive advantage was the
improvement on decision making within the organization. Every decision made by the firm is
critical to its survival and its competitiveness. Thus through the use of Information technology
decision making has been improved thus we can say that with improved decision making
competitive advantage is also gained.
Lowered buyer power and increased costs of entry to market had the least mean. From this we
can conclude that buyers/consumers of services offered by Internet Service Providers have a
greater amount of choice on whether to use the services offered by a particular firm or not.
Information technology did not seem to have an impact of reducing the number of entrants to

35
market as this also had a low mean. From this we can conclude that Information technology
serves as a catalyst for the entry of new players into the market place.
5.3 Conclusions
From the study we can conclude that most of the not all ISPs are using Information technology
for competitive advantage but information technology is primarily impact of Information
technology use is improved decision making. The key challenge that different Internet Service
Providers will need to address would be the identification and use of the correct Information
technology Platform for the firm. The key reason that many of the firms are using information
technology is to improve on the speed of their operations.
5.4 Recommendations of the Study
The recommendation form the study is that Internet service providers use information technology
for competitive advantage. The use of Information technology for competitive advantage must be
seen as critical towards firms being able to compete effectively in the market place. Internet
Service Providers need to be wary of the key challenge of identifying the correct technology
Platform if they are to benefit from the use of Information technology for competitive advantage.
5.5 Limitations of the Study
The study faced several challenges when being conducted. The key challenge was that most of
the respondents required a lot of reminding from the researcher for them to be able to respond to
the questionnaire sent to them. There were cases where some of the respondents misplaced the
questionnaires forcing replacement copies to be sent out to them. This limitation was however
overcome by proper communication and constant reminder that the questionnaire needed filling.
Those who misplaced the questionnaire had others sent out to them to enable them be able to
participate in the study.
The study also could have effaced the possibility of bias from respondents who wanted their
firms to look good. The researcher emphasized the importance of providing honest answers as
36
the data collected would be critical to their respective firms by improving on their knowledge on
Information technology for competitive advantage.
5.6 Suggestions for Future Research
This study established the drivers for the adoption of Information technology for competitive
advantage by Internet Service Providers in Kenya, the impacts of information technology
adoption on competitive advantage of Internet service providers in Kenya and the challenges
faced by internet service providers in their use of information technology to gain competitive
advantage.
The drivers that drove internet service providers to use Information technology of competitive
advantage could be an area for future research. Answering the question what pushes the Internet
service providers to view information technology as the answer towards gaining a competitive
advantage would form a research question for any future research.
How the different internet service providers put to use information technology to gain
competitive advantage would also form an area for further research. Information technology is
applied differently by different firms and how it’s applied by the different firms would form a
good area to conduct research on.
Any future research can also move to apply the use of interview technique as a further method to
gather/collect data in addition to the use of questionnaire method.
37
REFERENCES
Alchian, & Demsetz. (1972). Production, information costs and economic organization.
American Economic Review 62 (5), 777-795.
Amit, & Schoemaker. (1993). Strategic assets and organizational rent. Strategic Management
Journal 14 (1), 33-46.
Anil, B., Fevzi, O., “Khal”, N. K., Kwun, & Joon-Wuk, D. (2011). Journal of Hospitality and
Tourism Technology Vol. 2 No. 2, 139-154.
Arvidsson, Holmström, & Lyytinen. (2014). Information systems use as strategy practice.
Journal of Strategic Information Systems,23, 45-51.
Barney. (1991). Firm resources and sustained competitive advantage. Journal of Management 17
(1), 99-120.
Breznik, L. (2012). Can technology be a source of competitive adavantage? Economic and
Business Review Vol. 14 No. 3, 251–269.
Bryman, & Bell. (2003). Is The Resource-based ‘view’ a useful perspective for strategic
management research. The Academy of Management Review, 26(1), 22-40.
CCK. (2014). Annual Report for the Finacial Year 2012-2013. Nairobi: CCK.
Christine, S. R. (1994). Strategic Information Systems Planning: Its Adoption and Use.
Information Management & Computer Security journal, Vol. 12, 12-17.
Consoli, D. (2012 ). Literature analysis on determinant factors and the impact of ICT in SMEs.
Procedia - Social and Behavioral Sciences 62 , 93 – 97.
Cooper, & Schindler, D. (2006). Business Research Methods. 9th Edition. New Delhi: McGraw-
Hill.
Daneshvar, P., & Ramesh. (2010). Review of Information Technology Effect on Competitive
Advantage- Strategic Perspective. International Journal of Engineering Science and
Technology Vol. 2(11),, 6248-6256.
38
Dehning, & Stratopoulos. (2003). Determinants of a Sustainable Competitive Advantage due to
an IT-Enable Strategy. Journal of Strategic Information Systems,Vol. 12, No. 1, 7-28.
Diebold, J. (1986). Information Technology as a Competitive Weapon . International Journal of
Technology Management Vol. 1 no. 1, 85-100.
Earley, Northcraft, Lee, & Lituchy. (1990). Impact on Process and Outcome Feedback on the
Relation of Goal Setting to Task Performance. Academy of Management Journal, 33, 87-
105.
Fadun, O. S. (2013). Information and Communication Technology (ICT) and Insurance
Companies Profitability in Nigeria. Journal of Accounting – Business & Management
vol. 20 no. 2, 1-13.
Feen, David, Willcocks, & P, L. (1998). Core IS capabilities for exploiting information
technology. Sloan Management Review, Cambridge Vol. 39 no. 3, 9-21.
Ferguson, & Glover. (1996). Strategy in the digital age. The Journal of Business Strategy
Vol.17,no. 6, 28-31.
Galliers, R. (1993). IT strategies: beyond competitive advantage. Journal of Strategic
Information Systems, 2(4), 283-291.
Gantz, & Gens. (2004). Dynamic IT. Network World, Vol. 4, 21.
Grant, R. M. (1996). Toward a Knowledge-Based Theory of the Firm. Strategic Management
Journal, 17, 109-122.
Guimaraes, & Armstrong. (1997). Exploring the Relationships Between Competitive
Intelligence, IS Support, and Business Change. Competitive Intelligence Review, Vol. 9,
No. 3, 50-78.
Hemmatfar, M., & Salehi, M. (2010). Competitive Advantages and Strategic Information
Systems. International Journal of Business and Management, 158-169.
Issa-Salwe, Ahmed, Aloufi, & Kabir. (2010). Strategic Information Systems
Alignment:Alignment of IS/IT with Business Strategy. Journal of Information Processing
Systems, Vol.6, No.1, 121-128.
39
Jorfi, S., Nor, K. M., & Najjar, L. (2011). Assessing the Impact of IT Connectivity and IT
Capability on IT-Business Strategic Alignment: An Empirical Study. Computer
Information Science, 4(3).
Kotler, P. (2000). Marketing Management (10th Edition). New York: Prentice Hall.
Mata, F. J., Fuerst, W. L., & Barney, J. B. (1995). Information technology and sustained
competitive advantage: A resource-based analysis. MIS Quarterly, Minneapolis, Vol.19,
no. 4, 487.
McKinsey. (2013). Lions go digital: The Internet’s transformative potential in Africa. McKinsey
Global Institute.
Melville, Gurbaxani, & Kraeme. (2006). The Productivity impact of information technology
across competitive regimes:The role of industry concentration and dynamism. Decision
Support Systems.43, 229-242.
Merali, Papadopoulos, & Nadkarni. (2012). Information systems strategy:Past,present,future.
Strategic Information Systems 21(2), 125.
Mokaya, S. O. (2012). The Adoption of Information and Communication Technology by Small
Enterprises in Thika Municipality, Kenya. International Journal of Business and Social
Science, 172-177.
Narasimha. (2000). Organizational Knowledge, Human Resource Management and Sustained
Competitive Advantage: Toward a Framework. Toward a Framework Competitiveness
Review, 10 (1), 123-135.
Njuki, H. M., Okoth, O. N., Mutua, M. W., & Mwangómbe, C. W. (2013). Analysis of
Information and Communication Technology on Service Innovation and Competitive
Advantage: A case of Commercial Banks in Kenya. European Journal of Business and
Management, 1-8.
Ogongo. (2013). Building Mobile Communication Societies in Kenya. Athens.
40
Omae, Ndungu, & Kibet. (2013). A Survey of Internal and External Challenges Experienced by
Kenya’s Telecommunication Industry. International Journal of Scientific & Engineering
Research, Volume 4, Issue 6, 1732-1741.
Pemberton, & Stonehouse. (2000). The Theory of the Growth of the Firm. Oxford: Oxford
University Press.
Piccoli, & Ives. (2005). IT-dependent strategic initiatives and sustained competitive advantage: A
review and synthesis of the literature. MIS Quarterly 29 (5), 747-766.
Porter. (1980). Competitive Strategy: Techniques for Analyzing Industries and Competitors. New
York: Free press.
Porter, & Donthu. (2006). Using the technology acceptance model to explain how attitudes
determine Internet usage: The role of perceived access barriers and demographics.
Journal of Business Research, 59, 999-1007.
Porter, & Millar. (1985). How Information Gives You Competitive Advantage. Harvard Business
Review, 63(4), 149-160.
Porter, & Millar. (1996). How information gives you competitive advantage. In Managing
Information for the Competitive Edge. New York: Neal-Schuman Publishers Inc.
Porter, M. (1985). Competitive Advantage Creating and Sustaining Superior Performance. New
York: Free Press.
Prescott, & Bhardwaj. (1995). Competitive intelligence practices, a survey. Competitive
Intelligence Review,Vol. 6 No. 2, 4-14.
Prescott, & Gibbons. (1996). The seven seas of global Competitive intelligence. Competitive
Intelligence Review, Vol. 7 No. 1, 41-48.
Raft, & Lord. (2002). Acquiring new technologies and capabilities: a grounded model of
acquisition implementation. Organization Science, 13 (4), 420-441.
Ross, J. W., Beath, C. M., & Goodhue, D. L. (1996). Develop long-term competitiveness through
IT assets. Sloan Management Review, Cambridge, Vol.38, no.1, 31.

41
Ryssel, R., & Ritter, T. (2004). The impact of information technology deployment on trust,
commitment and value creation in business relationships. Journal of Business &
Industrial Marketing 193, 197-207.
Strebinger, & Traiblmaier. (2006). The Impact of Business to Consumer ECommerce on
Organizational Structure, Brand Architecture, IT Structure and their Interrelation.
Schmalenbach Business Review, Vol. 58, No. 1, 81-113.
Tabb. (2006). Who Said Technology is not Important? Wall Street and Technology, Vol. 24, No.
10, 54.
Talebnejad, A. (2008). The Role and Effect of Information Technology In Creation and
Maintainance Of Sustainable Competitive Advantage. International Journal of
Information Science & Technology, Volume 6, Number 1, 60-72.
Teece, Shuen, & Pisano. (1997). Dynamic capabilities and strategic management. Strategic
Management Journal, Vol. 18 No. 7, 509-533.
Valacich, J., & Schneider, C. (2010). Enhancing the motivational affordance of information
systems: The effects of Real-Time performance feedback and goal setting in group
collaboration environments. Journal of Management science 56:4.
Vu, K. M. (2013). Information and Communication Technology (ICT) and Singapore’s economic
growth. Information Economics and Policy 25 , 284–300.
Wang, Y. (2008). Examining the level of sophistication and success of destination marketing
systems: impacts of organizational factors. Journal of Travel and Tourism Marketing, Vol.
24 No. 1, 81-98.
Wernerfert. (1984). A resource based view of the firm. Strategic Management Journal, 5, 171-
180.
Wong, S.-C., Ngan, Chan, Felix, T.S, Y.-L., & Alain, C. (2012). Decision Support Systems. A
two-stage analysis of the influences of employee alignment on effecting business-IT
alignment. Decision Support Systems, 53, 490-498.
42
APPENDIXES
APPENDIX I: INTERNET SERVICE PROVIDER POPULATION
List of internet service providers in Kenya obtained from TESPOK
1. Access Kenya Group Ltd.
2. Angani Ltd
3. Bandwidth and cloud services limited
4. Embarq limited
5. Frontier optical networks limited
6. Gateway Telecommunications (Kenya) Limited
7. Gelati limited
8. Iwayafrica Kenya limited
9. Jamii telecommunications limited
10. Kenyaweb.Com Ltd.
11. Liquid Telecoms
12. MTN Business Kenya Ltd
13. MyIsp
14. Nairobinet (k) limited
15. Orange Telkom
16. Safaricom limited
17. Seacom Kenya
18. SimbaNET
19. Sovaya communications limited
20. Tangerine Ltd
21. Wananchi group Kenya limited
22. Xtranet communications limited

43
APPENDIX II: QUESTIONAIRE
SECTION A: GENERAL INFORMATION
Please complete this section by ticking the applicable box and filling in answers where
appropriate
RESPONDENT
1. What is your Gender?
Male ……….. [ ]
Female …….. [ ]
2. What is your age bracket in years?
18-25 ………… [ ]
26-30 ………… [ ]
31-35 ………… [ ]
36-40 ………… [ ]
41-45 ………… [ ]
46-50 ………… [ ]
Above 50 ….… [ ]
3. How many years have you worked for the firm?
1 – 10 …………… [ ]
11-20 ……………. [ ]
21-30 ……………. [ ]
Over 30 ….....…… [ ]
4. What is your level of Education?
Certificate ………………………..… [ ]
Diploma Holder………….……….… [ ]
Under Graduate Degree ……….… [ ]

44
Master’s Degree ……………….… [ ]
Doctorate Degree and Above ….... [ ]
ORGANISATION
1. For how long has the organization been in existence ……. Years.
1 – 10 …………… [ ]
11-20 ……………. [ ]
21-30 ……………. [ ]
Over 30 …….…… [ ]
2. How many employees does the organization have?
1 - 10 ………………… [ ]
11-20 ……………..…. [ ]
21-30 …………………. [ ]
31-40 …………………. [ ]
51-60 …………………. [ ]
61-70 ……………….…. [ ]
Over 70 …………..…… [ ]
3. How many branches does the organization have?
1 – 10 …… [ ]
11-20 ……. [ ]
21-30 ……. [ ]
31 -40 ……. [ ]
51 -60 ……. [ ]
61 70 ……. [ ]
Over 70 ….. [ ]

45
SECTION B: EXTENT OF INFORMATION TECHNOLOGY USE
Indicate the extent to which Information Technology has been applied to each of the following
areas in the firm.
Indicate Using the following scale and Tick Appropriately.
1 – No extent 2 – Small extent 3 – Moderate Extent
4 – Great extent 5 – Very Great extent
FUNCTIONAL AREA OF OPERATION 1 2 3 4 5
1 Finance and Accounting
2 Technical Operations
3 Human Resources
4 Sales
5 Marketing
6 Research and Development
7 Customer Relationship Management
8 Office Administration
Others
Specify
SECTION C: Drivers for use of Information Technology for Competitive Advantage
Indicate the extent to which each of the following drivers was a factor in the company’s decision
to use Information Technology for Competitive advantage.
Indicate Using the following scale and Tick Appropriately.
1 – No extent 2 – Small extent 3 – Moderate Extent
4 – Great extent 5 – Very Great extent
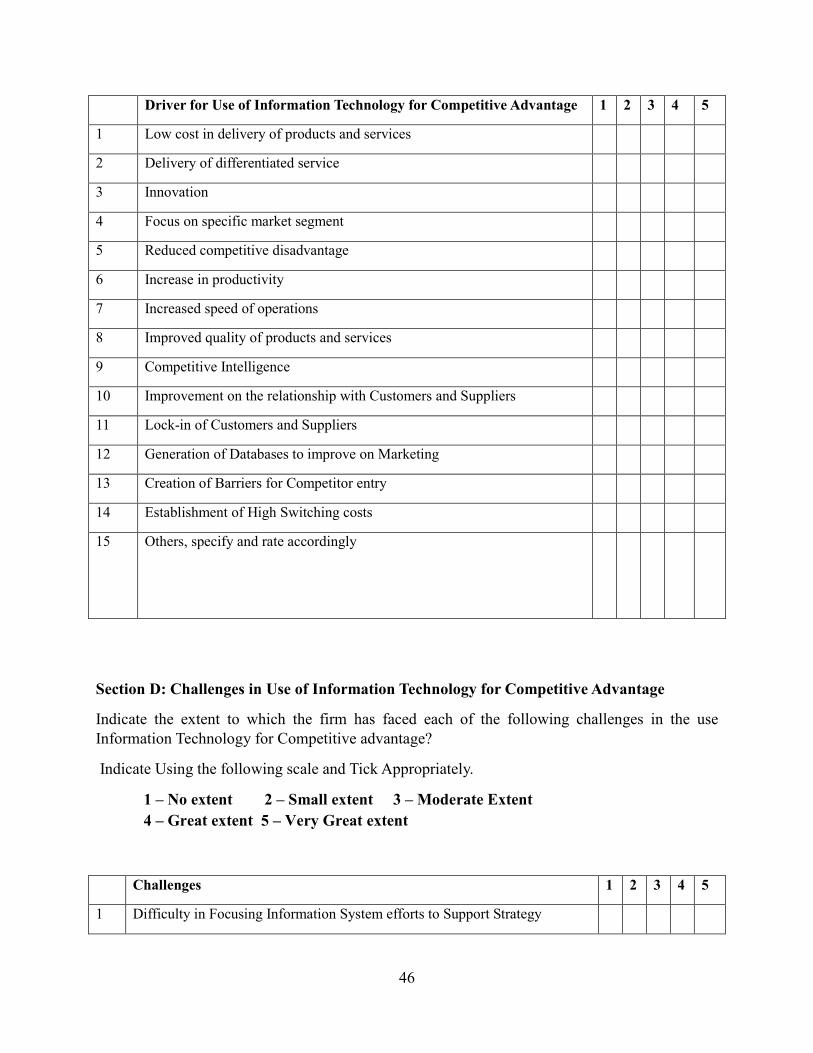
46
Driver for Use of Information Technology for Competitive Advantage 1 2 3 4 5
1 Low cost in delivery of products and services
2 Delivery of differentiated service
3 Innovation
4 Focus on specific market segment
5 Reduced competitive disadvantage
6 Increase in productivity
7 Increased speed of operations
8 Improved quality of products and services
9 Competitive Intelligence
10 Improvement on the relationship with Customers and Suppliers
11 Lock-in of Customers and Suppliers
12 Generation of Databases to improve on Marketing
13 Creation of Barriers for Competitor entry
14 Establishment of High Switching costs
15 Others, specify and rate accordingly
Section D: Challenges in Use of Information Technology for Competitive Advantage
Indicate the extent to which the firm has faced each of the following challenges in the use
Information Technology for Competitive advantage?
Indicate Using the following scale and Tick Appropriately.
1 – No extent 2 – Small extent 3 – Moderate Extent
4 – Great extent 5 – Very Great extent
Challenges 1 2 3 4 5
1 Difficulty in Focusing Information System efforts to Support Strategy
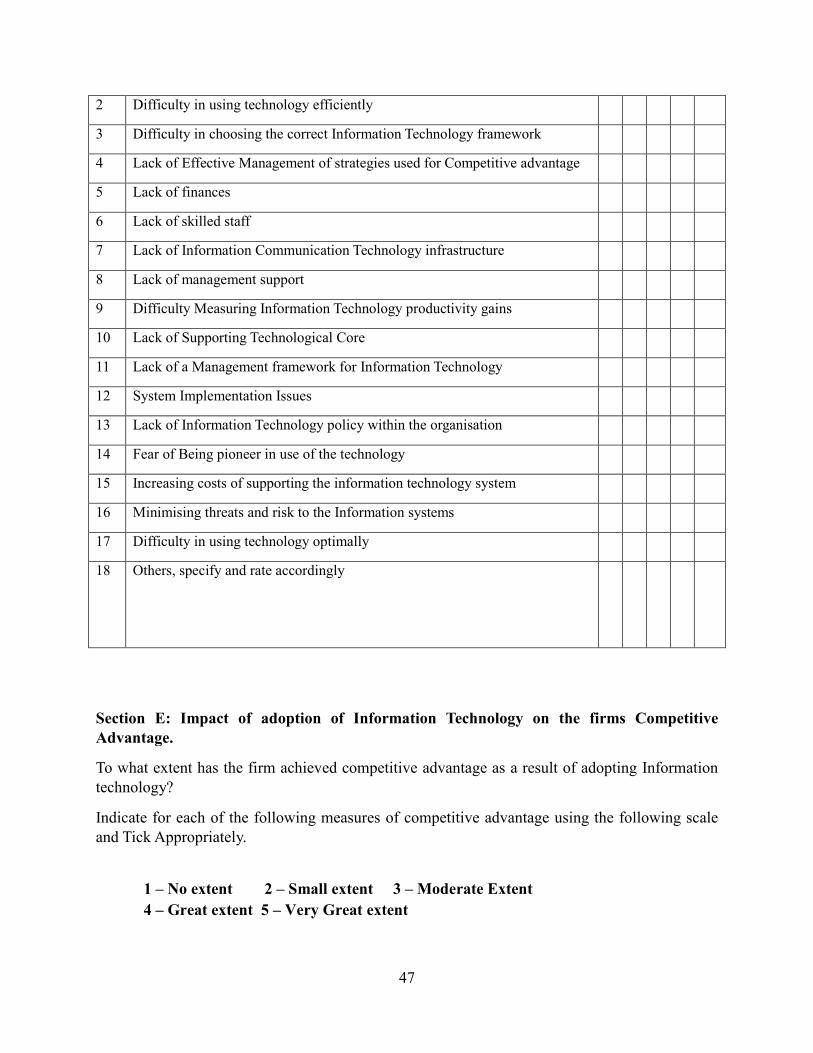
47
2 Difficulty in using technology efficiently
3 Difficulty in choosing the correct Information Technology framework
4 Lack of Effective Management of strategies used for Competitive advantage
5 Lack of finances
6 Lack of skilled staff
7 Lack of Information Communication Technology infrastructure
8 Lack of management support
9 Difficulty Measuring Information Technology productivity gains
10 Lack of Supporting Technological Core
11 Lack of a Management framework for Information Technology
12 System Implementation Issues
13 Lack of Information Technology policy within the organisation
14 Fear of Being pioneer in use of the technology
15 Increasing costs of supporting the information technology system
16 Minimising threats and risk to the Information systems
17 Difficulty in using technology optimally
18 Others, specify and rate accordingly
Section E: Impact of adoption of Information Technology on the firms Competitive
Advantage.
To what extent has the firm achieved competitive advantage as a result of adopting Information
technology?
Indicate for each of the following measures of competitive advantage using the following scale
and Tick Appropriately.
1 – No extent 2 – Small extent 3 – Moderate Extent
4 – Great extent 5 – Very Great extent
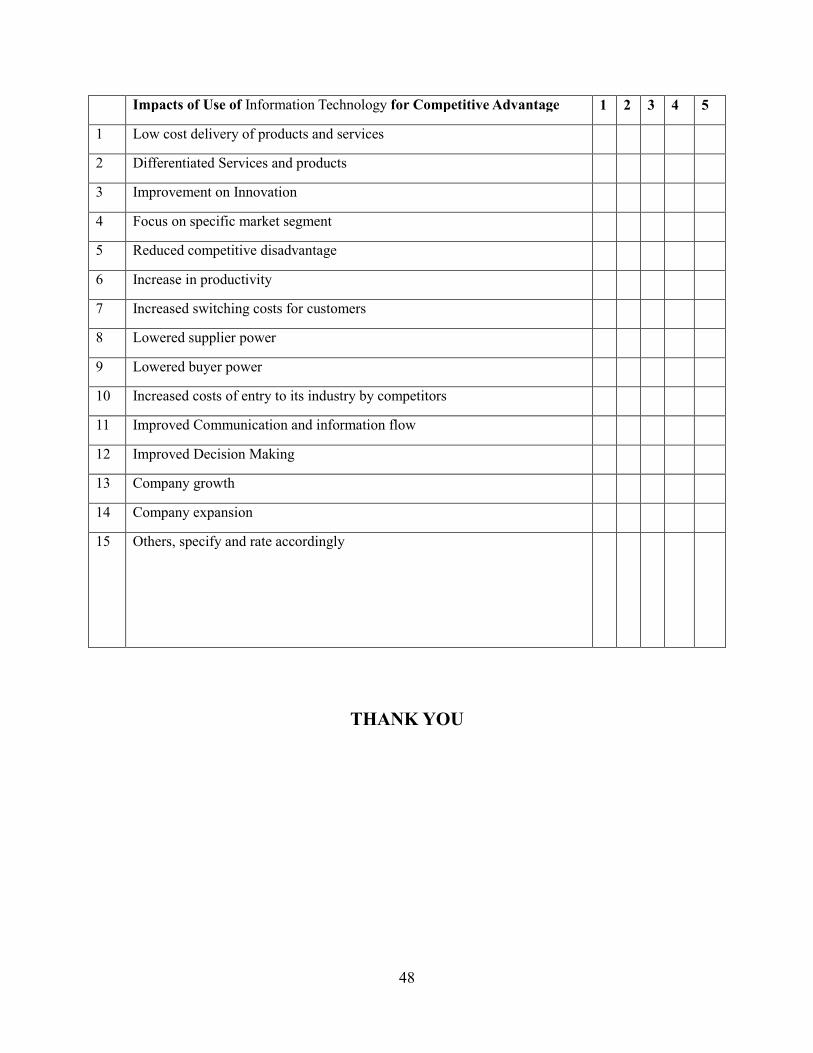
48
Impacts of Use of Information Technology for Competitive Advantage 1 2 3 4 5
1 Low cost delivery of products and services
2 Differentiated Services and products
3 Improvement on Innovation
4 Focus on specific market segment
5 Reduced competitive disadvantage
6 Increase in productivity
7 Increased switching costs for customers
8 Lowered supplier power
9 Lowered buyer power
10 Increased costs of entry to its industry by competitors
11 Improved Communication and information flow
12 Improved Decision Making
13 Company growth
14 Company expansion
15 Others, specify and rate accordingly
THANK YOU


![How Information Gives You Competitive Advantage - … · How Information Gives You Competitive Advantage 28/11/2016 11:34:33] TECHNOLOGY](https://img.pdfslide.net/doc/110x75/5b0476bd7f8b9a8c688db4a5/how-information-gives-you-competitive-advantage-information-gives-you-competitive.jpg)