Embed Size (px)
Citation preview
Mitigation of sewer crown corrosionvia competitive inhibition of thiobacilli
Item Type text; Thesis-Reproduction (electronic)
Authors Padival, Navnit Ajit, 1966-
Publisher The University of Arizona.
Rights Copyright © is held by the author. Digital access to this materialis made possible by the University Libraries, University of Arizona.Further transmission, reproduction or presentation (such aspublic display or performance) of protected items is prohibitedexcept with permission of the author.
Download date 25/05/2018 10:34:09
Link to Item http://hdl.handle.net/10150/278007

INFORMATION TO USERS
This manuscript has been reproduced from the microfilm master. UMI films the text directly from the original or copy submitted. Thus, some
thesis and dissertation copies are in typewriter face, while others may
be from any type of computer printer.
The quality of this reproduction is dependent upon the quality of the copy submitted. Broken or indistinct print, colored or poor quality illustrations and photographs, print bleedthrough, substandard margins, and improper alignment can adversely affect reproduction.
In the unlikely event that the author did not send UMI a complete manuscript and there are missing pages, these will be noted. Also, if unauthorized copyright material had to be removed, a note will indicate the deletion.
Oversize materials (e.g., maps, drawings, charts) are reproduced by sectioning the original, beginning at the upper left-hand corner and
continuing from left to right in equal sections with small overlaps. Each
original is also photographed in one exposure and is included in reduced form at the back of the book.
Photographs included in the original manuscript have been reproduced xerographically in this copy. Higher quality 6" x 9" black and white photographic prints are available for any photographs or illustrations appearing in this copy for an additional charge. Contact UMI directly to order.
University Microfilms International A Bell & Howell Information Company
300 North Zeeb Road. Ann Arbor. Ml 48106-1346 USA 313/761-4700 800/521-0600


Order Number 1346425
Mitigation of sewer crown corrosion via competitive inhibition of thiobacilli
Padival, Navnit Ajit, M.S.
The University of Arizona, 1991
U M I 300 N. Zeeb Rd. Ann Arbor, MI 48106


MITIGATION OF SEWER CROWN CORROSION
VIA COMPETITIVE INHIBITION OF THIOBACILLI
by
Navnit Ajit Padival
A Thesis Submitted to the Faculty of the
DEPARTMENT OF CIVIL ENGINEERING AND ENGINEERING MECHANICS
In Partial Fulfillment of the Requirements For the Degree of
MASTER OF SCIENCE WITH A MAJOR IN CIVIL ENGINEERING
In the Graduated College
THE UNIVERSITY OF ARIZONA
1 9 9 1

2
STATEMENT BY AUTHOR
This thesis has been submitted in partial fulfillment of requirements for an advanced degree at The University of Arizona and is deposited in the University Library to be made available to borrowers under rules of the Library.
Brief quotations from this thesis are allowable without special permission, provided that accurate acknowledgement of source is made. Requests for permission of extended quotation from or reproduction of this manuscript in whole or in part may be granted by the head of the major department or the Dean of the Graduate College when in his or her judgement the proposed use of the material is in the interests of scholarship. In all other instances, however, permission must be obtained from the author.
SIGNED:
APPROVAL BY THESIS DIRECTOR
This thesis has been approved on the date shown below:
f O 1 4 4 1
Dr. Robert G. Arnold Assistant Professor of Civil Engineering
and Engineering Mechanics
Date

ACKNOWLEDGEMENTS
I would like to thank the University of Arizona, especially the Civil Engineering
Department for their financial assistance during this project. Also, special thanks to the
Los Angeles County Sanitation Districts for their partial funding of the research.
I am indebted to my advisor Bob Arnold. He is an excellent person, friend, and
mentor.
Finally, I would like to thank my committee members Dr. Sierka and Bruce
Logan for their input.

Dedicated
to my
Parents
Rajni and Ajit

5
TABLE OF CONTENTS
Page
LIST OF FIGURES 10
LIST OF TABLES 19
ABSTRACT 20
CHAPTER
1. INTRODUCTION 21
1.1 Sewer Crown Corrosion 21
1.1.1 General 21 1.1.2 Sulfide Corrosion: The Problem 21
1.2 Sulfate Reduction and Cycle in Waste Collection System 24
1.3 The Los Angles County Case Study 32
1.3.1 Intensification of Corrosion Problem 32 1.3.2 Treatment Efforts at LACSD to
Reduce Corrosion 34 1.3.3 EPA Recommended Treatment 35 1.3.4 Investigation at Academic Institutions 35 1.3.5 Other Related Research 37
1.4 Thiobacilli: Sulfur-Oxidizing Bacteria 39
1.4.1 General 39 1.4.2 Environment and Habitat 40 1.4.3 Principles of Respiration and Phosphorylation 41 1.4.4 Oxidation of Sulfur Compounds in Chemolithotrophs .. 42 1.4.5 Practical Applications of Thiobacilli 42

6
TABLE OF CONTENTS (continued)
CHAPTER Page
1.5 Competition in Microbial Ecosystems 46
1.5.1 General 46 1.5.2 Competition: Survival of the Fittest 46 1.5.3 Basic Theoiy of Continuous Cultures 47 1.5.4 Competition and Selection in a Chemostat 47 1.5.5 Competition Related Research 50
1.6 Objectives 57
1.6.1 General 57 1.6.2 Isolation Experiments 58 1.6.3 Stoichiometric Experiments 58 1.6.4 Two-Organism Competition Experiments 58 1.6.5 Effect of pH on Competition Experiments 59 1.6.6 Effect of Different Heterotrophs in
Competition Experiments 59
2. MATERIALS AND METHODS 61
2.1 Microorganisms 61
2.2 General Description of Media Composition 61
2.3 Isolation of Yeast from the Sewer Crown 62
2.3.1 General 62 2.3.2 Sampling Techniques 62 2.3.3 Enrichment Steps 68 2.3.4 Serial Dilutions 68
2.4 Stoichiometric Experiments 70
2.4.1 General 70 2.4.2 Determination of "Critical " N/C or N/S Ratio 70
2.5 Experimental Procedures 72
2.5.1 The General Procedure 72

7
TABLE OF CONTENTS (continued)
CHAPTER Page
2.5.2 Variations in the General Procedure 73
2.5.2.1 Variations in Influent Ammonia-Glucose Ratio 73
2.5.2.2 Variation in pH 74 2.5.2.3 Variations in Competitor Identity 74
2.6 Analytical and Chemical Techniques 76
2.6.1 Microbial Growth Measurements 76 2.6.2 pH Measurement 77 2.6.3 Total Sulfate Measurements 78 2.6.4 Ammonium Ion Measurements 78 2.6.5 Dissolved Organic Carbon Analyses 79
2.7 Immunofluorescence: Fluorochrome Antibody Conjugates 80
2.7.1 General 80 2.7.2 Fluorescent Antibody Procedure 80
3. RESULTS 82
3.1 Isolation of Heterotrophic Competitor 82
3.1.1 Field Observations: Crown pH and Corrosion 82 3.1.2 Growth of Crown Samples in the Laboratory 82
3.2 Critical N/C and N/S Ratios for Nutrient Utilization in Batch Cultures 84
3.2.1 General 84 3.2.2 Ammonia and Glucose Utilization Rates 84 3.2.3 Ammonia and Thiosulfate Utilization Rates 85 3.2.4 Effect of Initial pH on Growth of Yeast 91
3.3 Titration Curves 93
I?

8
TABLE OF CONTENTS (continued)
CHAPTER Page
3.4 Competition Studies 94
3.4.1 General 94 3.4.2 Low-pH Competition Experiments 94
3.4.2.1 Variations in Influent Ammonia/Glucose 94 3.4.2.2 Variations in Culture pH 107 3.4.2.3 Variations in Competitor Identity 113
3.4.3 Mid-pH Competition Experiments 119
3.4.3.1 Variations in Influent Ammonia/Glucose Feed Ratios 119
3.4.3.2 Variations in Competitor Identity 136
4. DISCUSSIONS 143
4.1 Sample Collection and Cultivation 143
4.1.1 Crown Conditions 143 4.1.2 Enrichment and Isolation from Crown Samples 144
4.2 Stoichiometric Studies 146
4.2.1 Ammonia-to-Glucose Utilization Studies 146 4.2.2 Ammonia-to-Thiosulfate Utilization Rates 147
4.3 Two-Organism Competition Studies 147
4.3.1 Low-pH Competition Experiments 147 4.3.2 Mid-pH Competition Experiments 151
5. CONCLUSIONS 153
5.1
5.2
Isolation of Sewer Crown Samples 153
Stoichiometiy of Ammonia-to-Glucose Utilization Rates 152
9
TABLE OF CONTENTS (continued)
CHAPTER Page
5.3 Stoichiometry of Sulfur Oxidation 154
5.4 Competitive Inhibitory Control of Thiobacilli 155
REFERENCES CITED 157

LIST OF FIGURES
10
Figure Page
Figure 1-1. The physiological basis of hydrogen sulfide corrosion in concrete sewers 23
Figure 1-2. Steps in the assimilatory reduction of sulfate to hydrogen sulfide for use in bio-synthetic reactions 26
Figure 1-3. Pathway of dissimilatory sulfate reduction in Desulfovibrio species and "hydrogen cycling" hypothesis. 1, lactate dehydrogenase, membrane-bound, H-acceptor not known; 2, pyruvate ferredoxin oxidoreductase; 3, phosphotransacetylase; 4, acetate kinase; 5, ATP sulfurylase; 6, pyro-phosphatase; 7, APS reductase; 8, sulfite reductase; 9, cytoplasmic hydrogenase; 10, periplasmic hydrogenase 27
Figure 1-4. Recycling pathway of the dissimilatory reduction of sulfite to sulfide in an anaerobic environment 28
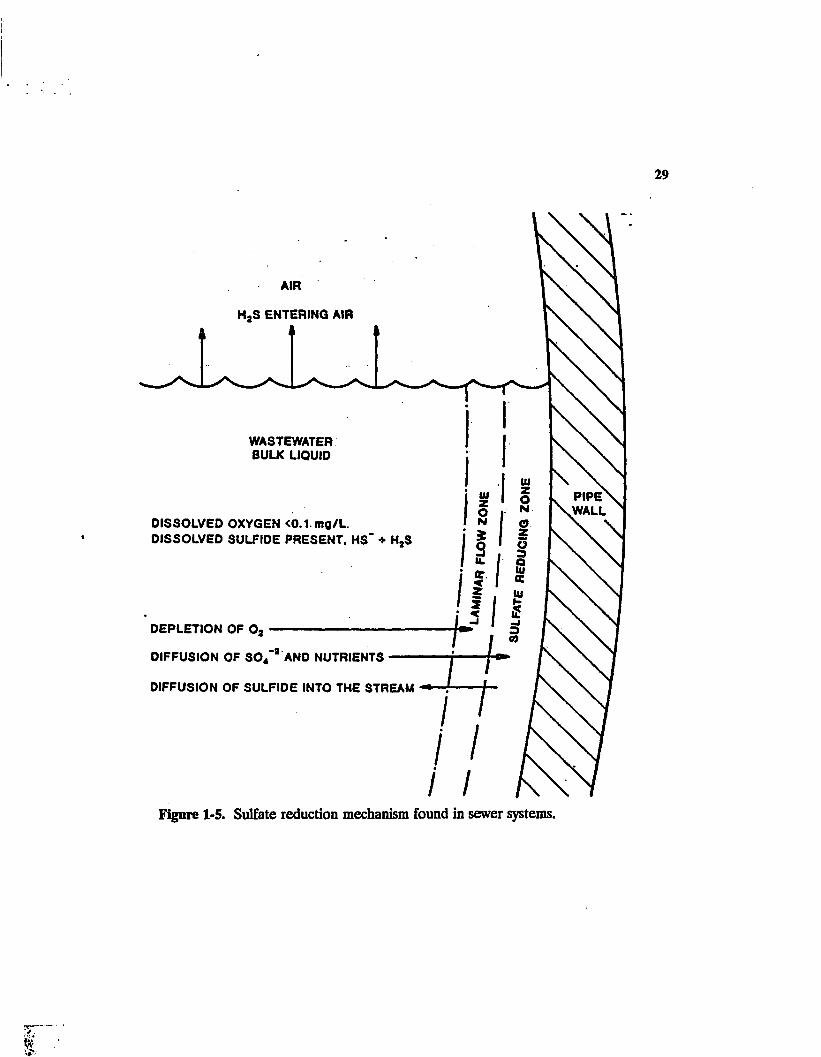
Figure 1-5. Sulfate reduction mechanism found in sewer systems 29
Figure 1-6. Effects of liquid-phase pH on the relative concentrations of sulfide species, E^S and HS" 31
Figure 1-7. Actual and predicted depth of corrosion of a 12-foot diameter reinforced concrete sewer pipe. Pipe measured section was a section of joint outfall "B" of the LACSD collection system 33
Figure 1-8. Principles of electron transport and phosphoiylation in thiobacilli 43
Figure 1-9. The reductive pentose phosphate or Calvin cycle for the conversion of C02 into glucose. For each turn of the cycle, one mole of hexose is synthesized from 6 COz at the expense of 18 ATP and 12 NADH, this energy being derived from the oxidation of inorganic substrate in chemolithoautotrophs 44

11
LIST OF FIGURES (continued)
Figure Page
Figure 1-10. Routes of the oxidation of sulfur compounds in chemolithoautotrophs. 1, oxidation of sulfide to polysulfide sulfur [S];, 2, conversion of elemental sulfur to polysulfide sulfur; 3, thiosulfate-oxidizing multi-enzyme complex; 4, sulfur oxidase; 5, sulfite oxidase; 6, APS reductase; 7, ADP-sulfurylase 8, electrons are transferred to oxygen via components of the respiratory chain 45
Figure 1-11. Hypothetical specific growth rates of organism 1 and 2. The text explains why organism 1 will wash out of the continuous culture .. 49
Figure 2-1. Steps used for the isolation and identification of sewer crown samples 69
Figure 3-1. Growth of E. coli on glucose in pure, batch cultures. Cell densities at stationary phase was a function of the initial nitrogen concentration when total ammonia added was < 2.0 x 10'3 M. At higher nitrogen concentrations, growth proved to be glucose-limited 86
Figure 3-2. Relationship between culture optical density at stationary phase and initial nitrogen concentrations in pure, batch culture of E. coli 87
Figure 3-3. Growth of acidophilic yeast on glucose in pure, batch cultures. Cell density at stationary phase was a function of the initial nitrogen concentration when total ammonia added was < 5.0 x 10"* M. At higher nitrogen concentrations, growth proved to be glucose-limited 88
Figure 3-4. Relationship between culture optical density at stationary phase and initial nitrogen concentrations in pure, batch culture of acidophilic yeast 89
Figure 3-5. Growth of T. neapolitamis on thiosulfate in pure, batch cultures. Cell number at stationary phase was a function of the initial nitrogen concentration when total ammonia added was < 3.0 x 10"* M. At higher nitrogen concentrations, growth proved to be thiosulfate-limited 90

12
Figure
Figure 3-6.
Figure 3-7.
Figure 3-8.
Figure 3-9.
Figure 3-10.
Figure 3-11.
Figure 3-12.
LIST OF FIGURES (continued)
Page
Relationship between culture cell density at stationary phase and initial nitrogen concentrations in pure, batch cultures of T. neapoliianus 92
Acid production as measured by pH decrease in medium containing pure cultures of T. neapoliianus using thiosulfate as substrate 93
Titration curve used for the periodic base addition for the maintenance of pH at 2.50 or 3.25 in continuous-flow cultures of T. thiooxidans and yeast 95
Titration curve used for the periodic base addition for the maintenance of pH at 6.80 in continuous-flow culture of T. neapoliianus, yeast, and E. coli 96
Cell number versus time. Numbers of yeast and T. thiooxidans in continuous-flow reactors during competition experiments. The addition of yeast and glucose lowered the steady concentrations of T. thiooxidans. When growth was nitrogen-limited, effect on the population of T. thiooxidans were much more pronounced 98
EfQuent sulfate concentration as a function of time and cultures conditions in continuous-Qow cultures of T. thiooxidans and yeast plus T. thiooxidans. Notice that the addition of yeast and glucose greatly diminished the production of sulfate and presumably the activity of T. thiooxidans 99
EfQuent ammonia concentration as a function of time and culture conditions in continuous-Qow cultures of T. thiooxidans and yeast plus T. thiooxidans. Results confirm that low N/C feed conditions did result in nitrogen limitation following the addition of yeast and high N/C feed conditions did not 100

13
LIST OF FIGURES (continued)
Figure Page
Figure 3-13. Periodic base addition for the maintenance of pH at 3.25 in continuous-flow cultures of T. thioaxidans and yeast Notice that the rate of acid production was adversely affected by the addition of glucose and yeast at about 250 hours. In the low N/C culture (low-nitrogen feed or culture that was expected to be nitrogen-limited), acid production was almost completely interrupted by the shift in feed conditions .... 101
Figure 3-14. Cell number versus time. Numbers of yeast and T. thioaxidans in continuous-flow reactors during competition experiments. The addition of yeast and glucose lowered the steady concentrations of T. thioaxidans. When growth was nitrogen-limited, effect on the population of T. thioaxidans were much more pronounced 102
Figure 3-15. Effluent sulfate concentration as a function of time and cultures conditions in continuous-flow cultures of T. thioaxidans and yeast plus T. thioaxidans. Notice that the addition of yeast and glucose greatly diminished the production of sulfate and presumably the activity of T. thioaxidans 103
Figure 3-16. Effluent ammonia concentration as a function of time and culture conditions in continuous-flow cultures of T. thioaxidans and yeast plus T. thioaxidans. Results confirm that low N/C feed conditions did result in nitrogen limitation following the addition of yeast and high N/C feed conditions did not 104
Figure 3-17. Effluent glucose concentration versus time and culture conditions in continuous-flow competition experiments involving yeast and T. thioaxidans. Results confirm that growth was glucose-limited in the high-N/C, but not the low-N/C experiments 105
Figure 3-18. Periodic base addition for the maintenance of pH at 3.25 in continuous-flow cultures of T. thioaxidans and yeast. Notice that the rate of acid production was adversely affected by the addition of glucose and yeast at about 250 hours. In the low N/C culture (low-nitrogen feed or culture that was expected to be nitrogen-limited), acid production was almost completely interrupted by the shift in feed conditions 106

14
LIST OF FIGURES (continued)
Figure Page
Figure 3-19. Cell number versus time. Numbers of yeast and T. thiooxidans in continuous-flow reactors during competition experiments. The addition of yeast and glucose lowered the steady concentrations of T. thiooxidans. When growth was nitrogen-limited, effect on the population of T. thiooxidans were much more pronounced 108
Figure 3-20. Effluent sulfate concentration as a function of time and cultures conditions in continuous-flow cultures of T. thiooxidans and yeast plus T. thiooxidans. Notice that the addition of yeast and glucose greatly diminished the production of sulfate and presumably the activity of T. thiooxidans 109
Figure 3-21. Effluent ammonia concentration as a function of time and culture conditions in continuous-flow cultures of T. thiooxidans and yeast plus T. thiooxidans. Results confirm that low N/C feed conditions did result in nitrogen limitation following the addition of yeast and high N/C feed conditions did not 110
Figure 3-22. Effluent glucose concentration versus time and culture conditions in continuous-flow competition experiments involving yeast and T. thiooxidans. Results confirm that growth was glucose-limited in the high-N/C, but not the low-N/C experiments Ill
Figure 3-23. Periodic base addition for the maintenance of pH at 2.50 in continuous-flow cultures of T. thiooxidans and yeast. Notice that the rate of acid production was adversely affected by the addition of glucose and yeast at about 275 hours. In the low N/C culture (low-nitrogen feed or culture that was expected to be nitrogen-limited), acid production was almost completely interrupted by the shift in feed conditions 112
Figure 3-24. Cell number versus time. Numbers of yeast and T. thiooxidans in continuous-flow reactors during competition experiments. The addition of yeast and glucose lowered the concentrations of yeast. Notice the temporary effect on the population of T. thiooxidans. Increase in thiobacilli cell densities was seen after about 80 hours following the cross inoculation of yeast 114

15
LIST OF FIGURES (continued)
Figure Page
Figure 3-25. EfQuent sulfate concentration as a function of time and cultures conditions in continuous-flow cultures of T. thioaxidans and yeast plus T. thioaxidans. Notice that the addition of yeast and glucose temporarily reduced the production of sulfate and presumably the activity of T. thioaxidans 115
Figure 3-26. Effluent ammonia concentration as a function of time and culture conditions in continuous-flow cultures of T. thioaxidans and yeast plus T. thioaxidans. Results confirm that low N/C feed conditions did result in nitrogen limitation following the addition of yeast and high N/C feed conditions did not 116
Figure 3-27. Effluent glucose concentration versus time and culture conditions in continuous-flow competition experiments involving yeast and T. thioaxidans. Results confirm that growth at high-N/C and low-N/C was nitrogen-limited, not glucose-limited 117
Figure 3-28. Periodic base addition for the maintenance of pH at 2.00 in continuous-flow cultures of T. thioaxidans and yeast. Notice that the rate of acid production rate in both low N/C and high N/C cultures were temporarily affected by the addition of glucose and yeast at about 300 hours 118
Figure 3-29. Cell number versus time. Number of T. thioaxidans in continuous-flow reactors during competition experiments. Addition of mixed seed lowered the steady concentration of T. thioaxidans at pH = 3.25, but did not at pH = 2.00 120
Figure 3-30. Effluent sulfate concentration as a function of time and cultures conditions in continuous-flow cultures of T. thioaxidans and a mixed-seed plus T. thioaxidans. Notice that the addition of the contaminant and glucose temporarily reduced the production of sulfate and presumably the activity of T. thioaxidans at pH = 2.00 121

16
LIST OF FIGURES (continued)
Figure Page
Figure 3-31. Effluent ammonia concentration as a function of time and culture conditions in continuous-flow cultures of T. thiooxidans and yeast plus T. thiooxidans at pH 2.00 and 3.25. Results confirm that cultures were nitrogen-limited 122
Figure 3-32. Effluent glucose concentration versus time and culture conditions in continuous-flow competition experiments involving the mixed-seed and T. thiooxidans. Results confirm that growth at pH 2.00 and 3.25 was nitrogen-limited, not glucose-limited 123
Figure 3-33. Periodic base addition for the maintenance of pH at 2.00 and 3.25 in continuous-flow cultures of T. thiooxidans and a mixed-seed from the sewer. At pH = 3.25 rate of acid production was adversely affected by the cross inoculation of mixed-seed, but not at pH = 2.00 124
Figure 3-34. Cell number versus time. Numbers of yeast and T. neapolitamis in continuous-flow reactors during competition experiments. The addition of yeast and glucose lowered the steady concentrations of T. neapolitanus. When growth was nitrogen-limited, effect on the population of T. neapolitanus were much more pronounced 126
Figure 3-35. Effluent sulfate concentration as a function of time and cultures conditions in continuous-flow cultures of T. neapolitanus and yeast plus T. neapolitanus. Notice that the addition of yeast and glucose greatly diminished the production of sulfate and presumably the activity of T. neapolitanus 127
Figure 3-36. Effluent ammonia concentration as a function of time and culture conditions in continuous-flow cultures of T. neapolitanus and yeast plus T. neapolitanus. Results confirm that low N/C feed conditions did result in nitrogen limitation following the addition of yeast and high N/C feed conditions did not 128
HTv
17
LIST OF FIGURES (continued)
Figure Page
Figure 3-37. Effluent glucose concentration versus time and culture conditions in continuous-flow competition experiments involving yeast and T. neapolitanus. Results confirm that growth was glucose-limited in the high-N/C, but not the low-N/C experiments 129
Figure 3-38. Periodic base addition for the maintenance of pH at 6.80 in continuous-flow cultures of T. neapolitanus and yeast Notice that the rate of acid production was adversely affected by the addition of glucose and yeast at about 325 hours. In the low N/C culture (low-nitrogen feed or culture that was expected to be nitrogen-limited), acid production was almost completely interrupted by the shift in feed conditions 130
Figure 3-39. Cell number versus time. Numbers of yeast and T. neapolitanus in continuous-flow reactors during competition experiments. The addition of yeast and glucose lowered the steady concentrations of T. neapolitanus. When growth was nitrogen-limited, efFect on the population of T. neapolitanus were much more pronounced 131
Figure 3-40. Effluent sulfate concentration as a function of time and cultures conditions in continuous-flow cultures of T. neapolitanus and yeast plus T. neapolitanus. Notice that the addition of yeast and glucose greatly diminished the production of sulfate and presumably the activity of T. neapolitanus 132
Figure 3-41. Effluent ammonia concentration as a function of time and culture conditions in continuous-flow cultures of T. neapolitanus and yeast plus T. neapolitanus 133
Figure 3-42. Effluent glucose concentration versus time and culture conditions in continuous-flow competition experiments involving yeast and T. neapolitanus. Results confirm that growth was glucose-limited in the high N/C, but not the low N/C experiments 134

LIST OF FIGURES (continued) 18
Figure
Figure 3-43.
Figure 3-44.
Figure 3-45.
Figure 3-46.
Figure 3-47.
Figure 3-48.
Page
Periodic base addition for the maintenance of pH at 6.80 in continuous-flow cultures of T. neapolitanus and yeast Notice that the rate of acid production was adversely affected by the addition of glucose and yeast at about 325 hours. In the low N/C culture (low-nitrogen feed or culture that was expected to be nitrogen-limited), acid production was almost completely interrupted by the shift in feed conditions
Cell number versus time. Numbers of E. coli and T. neapolitanus in continuous-flow reactors during competition experiments. The addition of E. coli and glucose lowered the steady concentrations of T. neapolitanus. When growth was nitrogen-limited, effect on the population of T. neapolitanus were much more pronounced
135
137
Effluent sulfate concentration as a function of time and cultures conditions in continuous-flow cultures of T. neapolitanus and E. coli plus T. neapolitanus. Notice that the addition of E. coli and glucose greatly diminished the production of sulfate and presumably the activity of T. neapolitanus 138
Effluent ammonia concentration as a function of time and culture conditions in continuous-flow cultures of T. neapolitanus and E. coli plus T. neapolitanus. Results confirm that low N/C feed conditions did result in nitrogen limitation following the addition of E. coli and high N/C feed conditions did not 139
Effluent glucose concentration versus time and culture conditions in continuous-flow competition experiments involving E. coli and T. neapolitanus. Results confirm that growth was glucose-limited in the high-N/C, but not the low-N/C experiments 140
Periodic base addition for the maintenance of pH at 6.80 in continuous-flow cultures of T. neapolitanus and E. coli. Notice that the rate of acid production was adversely affected by the addition of glucose and E. coli at about 350 hours 141

19
LIST OF TABLES
TABLE Page
Table 1-1. Thiobacilli species identification 40
Table 2-1. General composition of defined chemical medium used for the growth of T. thiooxidans 63
Table 2-2. General composition of defined chemical medium used for the growth of T. neapolitanus 63
Table 2-3. Composition of defined chemical medium used for the isolation of low- and mid-pH organisms from the sewer crown samples 64
Table 2-4. Composition of defined chemical media used in stoichiometric experiments involving E. coli growing in the mid-pH range 64
Table 2-5. Composition of defined chemical media used in stoichiometric experiments involving yeast growing in the low and mid-pH range 65
Table 2-6. Composition of defined chemical media used in stoichiometric experiments involving T. neapolitanus 65
Table 2-7. Composition of defined chemical media used in T. thiooxidans and yeast competition experiments 66
Table 2-8. Composition of defined chemical media used in T. neapolitanus and yeast competition experiments 66
Table 2-9. Reactor details and design criteria for low-and mid-pH experiments 67
Table 2-10. A summary of experiment run, parameters measured, and independent variables used in low-and mid-pH competition experiments 75
Table 3-1. Comparison of measured parametric levels and percentage difference in CSTR competition experiments before and after glucose/competitor addition 142

20
ABSTRACT
Inhibition of biogenic acid production by thiobacilli was investigated by
encouraging the growth of potential competitors. Two-organism competition experiments
(Thiobacillus sp. vs. heterotrophic competitor) were conducted in a bench-scale,
continuous-flow reactor. Results were sensitive to the influent ammonia/glucose ratio.
Under nitrogen-limiting conditions, the cell concentration of T. thiooxidans or T.
neapolitanus and acid production rates were reduced by about two orders of magnitude.
Under carbon-limiting conditions, only modest reductions in the thiobacilli cell density
and effluent sulfate were observed. In general, encouragement of microbial competition
can interrupt acid production by thiobacilli and may inhibit crown corrosion in concrete
sewers.

21
CHAPTER 1
INTRODUCTION
1.1 Sewer Crown Corrosion.
1.1.1 General. Thiobacillus-induced corrosion of concrete sewer pipe, sewage
collection systems, and treatment plants has caused concern among agencies in the
United States, Germany, Japan, the USSR, and many other places in the world. Within
the Los Angeles County Sanitation Districts (LACSD) sewer system alone, unanticipated
repair and replacement activities attributable to crown corrosion will cost almost 200
million dollars prior to the turn of the century (Morton, 1989; Sponsellar, 1988).
1.1.2 Sulfide Corrosion: The Problem. In all corroded sections of the LACSD
collection system, the pH of the concrete surface is exceptionally low (pH < 4.0). In
general, the surface pH is lowest at the sewer crown and gradually increases with
distance from the crown apex (Milner, 1989). The regions of the pipe that are
periodically washed with bulk sewage during high flow exhibit the highest pH,
approaching neutral values (Milner, 1989; Price, 1989). The greatest degree of
degradation is generally observed at the crest of the sewer, where the pH is often less
than 4.0.

22
Corrosion of concrete pipe is linked to naturally occurring events involving the
transformation of inorganic sulfur. This four-step transformation mechanism is illustrated
in Figure 1-1: (i) Sulfide [S(-II)] is generated in an anaerobic slime layer by sulfur-
reducing bacteria (SRB), and (ii) S(-II) diffuses into the sewage. Among the reduced
sulfur species is hydrogen sulfide gas (HjS), which eventually volatilizes and is
transported to the sewer crown, (iii) At the crown, HjS is bacterially oxidized to sulfuric
acid (H2SO4) by the sulfur-oxidizing bacteria, and (iv) the acid chemically attacks the
concrete of the sewer pipe. This can lead to excessive corrosion, sewer deterioration,
and eventual sewer collapse (Holder et al., 1983; EPA, 1974; Parker, 1951).
The obligately aerobic, chemolithoautotrophic acidophile ThiobacUlus thioaxidans
is thought to be primarily responsible for the sulfide oxidation/acid production which
leads to rapid corrosion of concrete sewers. These bacteria assimilate carbon dioxide
(COj) for biosynthesis, and oxidize inorganic, sulfur-containing compounds (such as HjS)
for cellular energy generation.
T. thioaxidans are present in large numbers in the LACSD sewage collection
system (Price, 1989). Similar findings in the sewer systems of the Hamburg Municipal
Drainage Department have been reported (Milde et al., 1983). They noted that new
sewers coated with epoxy resin were corroding at alarming rates (3/4 inch/year). Large
numbers of T. thioaxidans were present at highly corroded sites. T. thioaxidans greatly
out-numbered the other thiobacilli in these highly corroded sections of the Hamburg
collection systems (Sand and Bock, 1984).

23
CONCRETE PIPE
HaS—»2H • SO,
OXIC SEWER ATMOSPHERE
BULK UQUlO
H,S (o)
HS' AND H,S HS AND HjS
SO*"* AND ORGANIC CARBON NUTRIENTS
SUME (ANOXIC ZONE)
Figure 1-1. The physiological basis of hydrogen sulfide corrosion in concrete sewers.
24
In order to establish environmental conditions favorable to the acidophilic
thiobacilli, the pH of the sewer pipe walls is gradually neutralized by the mid-pH species
of thiobacilli, such as T. neapolitanus. The mid-pH thiobacilli can decrease the concrete
pH from a value of 11 to 5.5 or so, upon which the acidophilic species can become
established and lower the crown pH further. However, it is believed that drop in pH
from 11 to neutral values is a non-biological process (weathering).
1.2 Sulfate Reduction and Cycle in Waste Collection System.
Sulfate (SO/2) is present in all natural waters, ranging from small concentrations
of 1.6 mg/L in groundwater found near Oakland, California, to 200 mg/L found in the
Colorado River waters near Lees Ferry, Arizona (Snoeyink and Jenkins, 1980). In
wastewaters, these concentrations increase by an average of 100 mg/L (Neal, 1964).
Consequently, wastewater SO/2 levels seldom limit HjS production by sulfate-reducing
bacteria or, ultimately, the activity of thiobacilli.
Under anaerobic conditions, such as those which prevail in slime layers beneath
the stagnant or slow-moving sewage, sulfate [S(VI)] is dissimilatively reduced by the
sulfate-reducing bacteria. During this dissimilative process, [S(VI)] serves as the terminal
electron acceptor for electrons derived from the oxidation of organic matter. This is a
distinct process from assimilative S(VI) reduction, which is necessary for the synthesis of
the amino acids cysteine and methionine. Dissimilative reduction is an energy-generating
process carried out exclusively by SRBs. All organisms are capable of assimilative sulfate
reduction (EPA, 1974).

25
The pathway for assimilative reduction of sulfate to hydrogen sulfide for use of
biosynthetic reactions is shown in Figure 1-2. A total of eight electrons are transferred
as S(VI) is reduced to S(-II). S(VI) is converted initially to adenylsulfate, and the
process is completed via the catalytic reduction of sulfite (SO, 2) to S(-II). The S(VI)-to-
S(IV) reaction utilizes energy stored in phosphate bonds, reductant, and catalysis from
three specific enzymes. The steps from S(IV) to S(-II), a six electron transfer, are
catalyzed by a complex flavometallo-protein, sulfite reductase (Stanier, 1976).
Dissimilative reduction is accomplished via successive transfer of four pairs of
electrons from organic substrate to SO/2. The oxidation of lactate to acetate coupled
with S(VI) reduction to S(-II) is schematically shown in Figure 1-3. Four enzymes are
required for this reduction, (i) ATP sulfurylase, (ii) pyrophosphorylase, (iii) APS
reductase, and (iv) sulfite reductase (Gottschalk, 1986). The last three electron-pairs are
transferred via sulfite reductase in a three-step recycling process as shown in Figure 1-4
(Stanier, 1976).
In the sewer environment, two genera (seven are recognized) of sulfate-reducing
bacteria, Desulfotomaculum and Desulfovibrio, are primarily responsible for S(-II)
production via dissimilative SO;2 reduction (Posgate, 1959; Pfennig, 1971; Stanier, 1976;
Sand, 1987). They are strict anaerobes and are unique due to their massive S(-II)
producing ability. Many other species can reduce partially oxidized sulfur intermediates,
but their importance to S(-II) production in sewers is considered to be relatively minor.
The mechanism by which hydrogen sulfide (HjS) is generated in sewers is depicted in
Figure 1-5 and by the simplified reactions (EPA 1974) that follow:

26 so4
2-
sulfate adenylyitransferase
•ATP r'
,S»©-® adenylyi sulphate
•ATP
adenylylsulfate kinase r-
S*-ADP
3'-phosphoadenylvl sulphate
NADPH phosphoadenylyl-sulfate reductase
NADP
so,2-
suiphite reductase
3'-phosphoAMP
3NADPH
3NADP*
Figure 1-2. Steps in the assimilatoiy reduction of sulfate to hydrogen sulfide for use in bio-synthetic reactions.

mttabraar 27
2CHS—CHOH-COOH
2CHj—CO-COOH
bydrotenur 2CHj—CO—CoA
r*-:coA
2CH,—COO©
I 2CHj—COOH 3H,0-
ATT biltnct
2 Ucute
soj-
T" ZATP
_L
• 2 urate • 2CO}
dmuosnotie mcduntsn t t
3ATP
Figure 1-3. Pathway of dissimilatory sulfate reduction in Desulfovibrio species and "hydrogen cycling" hypothesis. 1, lactate dehydrogenase, membrane-bound, H-acceptor not known; 2, pyruvate ferredoxin oxidoreductase; 3, phosphotransacetylase; 4, acetate kinase; 5, ATP sulfurylase; 6, pyro-phosphatase; 7, APS reductase; 8, sulfite reductase; 9, cytoplasmic hydrogenase; 10, periplasmic hydrogenase.

28
3 SO," *2e . S,0l-+2' ~s,or-+2e' v \ sol" so r
1 )
»-s 2-
Figure 1-4. Recycling pathway of the dissimilatory reduction of sulfite to sulfide in an anaerobic environment.
29
AIR
H,S ENTERING AIR
WASTEWATER BULK LIQUID
DISSOLVED OXYGEN <0.1 mg/L. DISSOLVED SULFIDE PRESENT. HS" • HaS
or.
DEPLETION OF 0;
DIFFUSION OF S04"* AND NUTRIENTS
DIFFUSION OF SULFIDE INTO THE STREAM
Figure 1-5. Sulfate reduction mechanism found in sewer systems.
I

SO;2 + 2C + 2HzO <
30
> 2HCO," + HjS
HjS is relatively a weak acid. It can dissociate to form HS" and S"2 as shown by
the following reactions. Thus, the speciation of inorganic sulfide present in the waste
stream depends primarily on the pH of the bulk sewage. The pK,'s for the
deprotonation of HjS in
HjS <=========> H+ + HS* pK,, = 7.0
HS" <=========> H+ + S-2 pK^ = 13.9
t
water are 7.0 and 13.9, respectively (Stumm, 1981). The pH range of most wastewaters
is between 5.4 and 8.4 (Snoeyink, 1980). Therefore, S*2 comprises a negligible percentage
of the total inorganic sulfide present in typical wastewaters. Figure 1-6 illustrates the
distribution of inorganic sulfide between H2S and HS" for pH values between 5.0 and 9.0.
Clearly the dominant form of total inorganic sulfide is HjS at pH values below 7.0.
H2S is the only volatile form of inorganic sulfide and can escape from the liquid
waste stream and enter the head space above the wastewater. HjS (g) diffuses into
biofilms coating sewer walls where it is oxidized to sulfuric acid (H2SO4) by the thiobacilli.
This H2SO4 is neutralized by calcium carbonate in the sewer concrete as shown by the
following reaction (Sand, 1987):
HjSO, + CaCOj > CaSO< + HzO + C02

31
pH If pK « 7.0
' s
' • T
\ s
s V \ \ \ \
k-
\ i *
\ *
\ \
1 ^ \
1 -2JO -U) -j$ -.4 -Z 0 +2 t.4 +*
p H - p K *S *10 *ZJ0
Figure 1-6. Effects of liquid-phase pH on the relative concentrations of sulfide species, HjS and HS".

32
The CaSO< produced combines with H20 to form gypsum. The result is a loss
of concrete integrity. Initially, as the biofilm grows, the crown pH will remain fairly
stable (around pH 7.0), but as concrete alkalinity is titrated and the rate of bacterially
mediated biogenic acid generation increases, the crown pH decreases (around pH 4.0).
As a consequence, the observed rate of crown corrosion increases dramatically (around
pH 2.0). Eventually corrosion penetrates to reinforcing steel, undermining the stuctural
integrity of the pipe. Crown pH can drop as low as 1.0.
13 The Los Angeles County Case Study.
1.3.1 Intensification of Corrosion Problem. LACSD has observed an
acceleration of sewer crown corrosion rates in a significant proportion of its collection
system, over the past 10 to IS years. Subsequently, they also noticed that the sulfide
concentration in the sewage had increased more than twice from the late 1970s to early
1980s. The increase in conosion rate coincided with an increase in sulfide concentration,
as measured at the Joint Water Pollution Control Plant (JWPCP). Inspections indicated
that approximately 40 miles of large-diameter sewers were severely corroded and required
repair or replacement. The corrosion rate measured exceeded values, predicted by an
empirical model developed by EPA (1974), by a factor of 3 to 4 (Figure 1-7; EPA, 1974).
Recent reductions in metals concentrations might have permitted enhanced
growth and activity among sulfate-reducing bacteria within the County (Sponseller, 1988).
In other words, implementation of the categorical industrial waste pretreatment standards
have increased the rate of sulfate reduction, with subsequent implications for acid

Corrosion Comparison 144" Unit 1A
33
S 3.0-o c
z 2 2.0-<o o cc cc O
£ 1.0-o MEASURED
PREDICTED X H CL ili o
30 40 10 YEARS OF SERVICE
Figure 1-7. Actual and predicted depth of corrosion of a 12-foot diameter reinforced concrete sewer pipe. Pipe measured section was a section of joint out fall "B" of the LACSD collection system.

34
generation and corrosion rates within the collection systems. Removal of metals might
have also limited the formation of metal-sulfide precipitates, thus increasing both the
driving force for the evolution of HjS into the headspace, and the headspace
concentration expected at vapor-liquid equilibrium. Both these factors may have lead to
increased rates of bacterially-catalyzed crown acidification and corrosion.
Additionally, high metals concentration may have inhibited acid production by the
sulfur-oxidizing thiobacilli in the sewer crown, diminishing their ability to oxidize HjS to
HjSO^. Therefore, decreased metals concentration in the sewer waste stream may have
aggravated the problem of acid production within the sewer environment in several ways.
Other explanations for the increased crown corrosion rates are possible.
1.3.2 Treatment Efforts at LACSD to Reduce Corrosion. Attempts to impede
crown corrosion have included: (i) inhibition of sulfur-reducing bacteria, (ii) oxidation of
aqueous S(-IE) prior to its transport to the sewer head space, and (iii) mechanical
removal of acid-producing bacteria from the sewer crown surface. In-house research by
LACSD includes the use of a sulfide chamber to empirically determine rates of concrete
corrosion as a function of factors such as pH, HzS concentration, bacterial numbers, and
pipe material. They also have operated pilot-scale anaerobic digestors to anticipate the
possible effects of various corrosion-inhibiting additives on the downstream treatment
processes.
LACSD attempted to mitigate the problem specifically by four methods: (i) slug
dosing with sodium hydroxide (NaOH) to raise crown pH above 13, (ii) adding hydrogen
peroxide (H202) to the bulk liquid-phase; peroxide served both as a bactericide for

35
sulfate-reducers and a strong oxidant for liquid-phase sulfides, (iii) aerating sewage to
suppress growth of sulfate-reducers and chemically oxidize S(-II), and (iv) adding ferrous
chloride (FeClj) to the bulk-liquid. FeG2 promotes the formation of insoluble iron-
sulfide complexes. Results suggest that addition of FeCl2 provides an effective, though
expensive means for controlling the flux of HiS to the sewer crown (Redner, 1988; Jin,
1987). Other methods have' proven to be expensive and only marginally successful.
1.3.3 EPA Recommended Treatment. USEPA's recommended treatments for
controlling sulfide generation and liquid-phase S(-II) concentrations consists of air/oxygen
injection and chemical addition to wastewater, including the addition of an alternative
electron acceptor (to SO/2) for bacterial respiration. Air/02 increases the bulk liquid-
phase dissolved oxygen concentration above 1.0 mg/L and rapidly oxidizes S(-II) to
thiosulfate (EPA, 1985). Effective chemical additives include chlorine, hydrogen
peroxide, nitrate, and metal salts. Chlorine and hydrogen peroxide oxidize S(-II) and
prevent the release of HzS into the sewer headspace. Metal salts form insoluble metal-
sulfide complexes. Sulfate reduction is generally absent under denitrifying (bacterially
catalyzed N03' reduction) conditions.
13.4 Investigations at Academic Institutions. LACSD has funded several
academic institutions to investigate solutions to the problem. The California Institute of
Technology is looking at oxidation of S(-II) with cobalt tetrasulfophthalocyanine
(CoTSP). This compound in small amounts can catalyze the oxidation of large amounts
of sulfide. The kinetics of the reaction are important due to the volatility of HjS. If
CoTSP can catalytically oxidize S(-H) prior to its volatilization, the gaseous HjS

36
concentration in the sewer atmosphere could be held below the level required for cell
metabolism of the sulfur-oxidizing bacteria. Caltech has also plans for investigating the
catalytic S(-II) destruction with ultrasound (Hoffmann, 1989).
The University of California-Los Angeles is investigating the inhibition of sulfate-
reducing bacteria without affecting the downstream wastewater treatment processes.
Inhibitors such as oxyanions, arquad compounds, and formaldehyde have been tested.
UCLA conducted some SRB enumerations, compared lactate to propionate using SRBs,
and have identified Desulfobulbus propionicus in the system (Redner, 1988).
The University of Southern California is developing a corrosion-monitoring device
that will enable the employees at LACSD to quantitatively measure corrosion rates. The
research team at USC is also developing a mechanical system for periodically flushing the
crown in order to disrupt corrosion.
At the University of Arizona, researchers are concentrating on the ecology and
biochemistry of the acid-producing, sulfur-oxidizing bacteria. Inhibition of crown
corrosion using transition metals, weak organic acids, and strong oxidants was studied by
Milner, Sima, and Burris, respectively (1989; 1990; 1991). Results have proven
promising. Milner (1989) investigated the chemical inhibition of acid production by
acidophilic thiobacilli using a variety of metals and chelators (alone and in combination).
Hg(II) and Ag(I) showed toxic effects at concentrations of 10"5 M and below; Cd(II) and
Zn(II) and NTA were non-inhibitory at mM concentrations. Combination experiments
showed both synergistic and antagonistic effects in experiments involving Mo(VI); Cu(II);

37
Co(II); Zn(I3), and Cu(II)-EDTA; Cu(II)-Fe(III); Cu(II)-Co(II). Many of these
inhibitors either completely blocked or delayed the onset of acid production.
Burns (unpublished, 1990) investigated the chemical inhibition of acid production
by acidophilic thiobacilli using a variety of strong oxidants and organics (alone and in
combination). KMn04, and peroxymonosulfate showed inhibitory effects at
concentrations of 10'5 M and above. These oxidants delayed the onset of acid
production.
Sima (1990) investigated the inhibition of T. thiooxidans by externally provided
weak organic acids. The mechanism of toxicity was pursued using a battery of tests such
as measurement of intracellular ATP, 02 utilization rate, COz uptake, and growth rate.
Acetate, formate, pyruvate, succinate, oxaloacetate, malate, and citrate showed inhibitory
effects at concentrations of 10"3 M. The suspected mechanism of weak-acid inhibition
involves either lowering the cytoplasmic pH or interfering with the maintenance of a
transmembrane protonmotive force. A portion of the work conducted at U of A
laboratories is the subject of this report. Our primary objective was the elimination of
the thiobacilli via competition experiments. Details are provided in the chapters to
come.
13.5 Other Related Research. The first Thiobacillus-induced corrosion,
identification of acid-producing bacteria, and hypothesis of a corrosion mechanism were
attributed to Parker (1945, 1951). Parker studied the presence of S(-II) in sewage,
transport of HjS across the liquid-gas interface, acid production at the sewer crown, and
the chemistry of corrosion. Kempner (1966) studied acid production by Thiobacillus
38
thioaxidans in liquid-phase with elemental sulfur (S°) as the electron acceptor. He found
that they could lower the pH to 0.52.
Research conducted in the United States, Germany, Japan, and the USSR, was
motivated by the extent of crown corrosion reported in the sewer collection systems of
those countries. Milde (1983) isolated and enumerated thiobacilli from the crown and
bulk liquid phase from sewers. It was determined that T. thioaxidans was primarily
responsible for acid production and concrete. Milde also discovered that aeration of the
bulk liquid reduced the activity of thiobacilli and mitigated low-pH conditions in the
crown. Accumulation of S° at the crowns led to the conclusion that elemental sulfur was
the energy source for the thiobacilli as opposed to HjS, S203'2 or organic polysulfides.
It was suggested that the oxidation of HjS to S° was an abiotic process.
In 1984, Pohl studied the degradation of methionine (a sulfur-containing amino
acid) and volatile organic polysulfides such as methyl and ethyl mercaptan, etc. Previous
work done by Sivela (1975) had shown that thiobacilli (unidentified species) could grow
on such compounds. Pohl (1984) found that relatively high concentrations of protein in
sewage increased the availability of organic sulfides to the thiobacilli.
The results of Sand (1987) partially contradicted those by Pohl (1984). HjS was
considered the primary source of electrons for acidophilic thiobacilli in the Hamburg
sewer environment, and thiosulfate (S2Oj*) was the primary substrate for non-acidophilic
thiobacilli. Mercaptans and organic sulfides did not support the growth of thiobacilli
tested. Sand's experiments were conducted in a controlled breeding chamber into which
the substrate was added. Corrosion of concrete pipe core samples in the chambers could
39
be accelerated eight-fold over corrosion rates observed in the sewer (Sand, 1984 and
1987). The presence of S° on core samples placed in the breeding chamber was also
observed.
1.4 Thiobacilli: Sulfur-Oxidizing Bacteria.
1.4.1. General. Thiobacilli are rod-shaped, gram-negative cells that, with few
exceptions, utilize a single polar flagellum for motility. They are 1-2 uM in length (Sima,
1989). Fourteen species were identified in the Bergev's Manual of Determinative
Bacteriology (Vishniac, 1974 and Kelly 1981; 1982).
The genus Thiobacillus includes strict autotrophs, facultative autotrophs, and a
single heterotrophic species. The obligately aerobic, chemolithoautotrophic thiobacilli
obtain their energy by oxidizing reduced forms of inorganic sulfur. These include sulfide
IS(-H)], elemental sulfur (S°), thiosulfate (S2O32), polythionates, and sulfite (SO/2)
(Vishniac, 1974). This is accompanied by acid generation.
Experiments conducted and reported in this work involved two species of sulfur-
oxidizing bacteria. These are an acidophilic, autotrophic thiobacilli, Thiobacillus
thiooxidans and a mid-pH range species Thiobacillus neapolitanus. Because the mid-pH
thiobacilli are thought to be responsible for establishing environmental conditions for the
acidophiles, we decided to conduct experiments involving both the low and mid-pH
thiobacilli. If acid production by the non-acidophilic thiobacilli can be mitigated, the low-
pH communities will find it difficult to establish themselves. Tests involving these two

40
species simulated heavily corroded and lightly or non-corroded sewer conditions. Shown
below are growth conditions for the two species:
1.4.2 Environment and Habitat. Thiobacilli can generally be isolated from any
aerobic environment in which contains reduced inorganic compounds of sulfur and iron.
These organisms have been found in rivers, canals, estuaries, acid sulfate soils, hot acid
springs, sewer collection systems, mine drainage, etc. (The Prokarvotes. 1977).
Table 1-1. Thiobacilli species identification.
Species
Identification
pH Range
for
Growth
Carbon and
Energy Source
Generation time
at 25°C (Hrs.)
T. thioaxidans 0.5-5.5 Obligate autotroph
lithotroph (S°)
12-15
T. neapolitanus 4.5-8.5 Obligate autolithotroph
lithotroph (S203'2)
14-16
They flourish under a wide range of pH conditions. In most acidic environments
with low-metals concentrations, T. thioaxidans predominates. A notable exception is
acid-mine drainage, where T. ferroaxidans is the predominant species. Viable cultures
have been recovered from environments of pH < 2.0 (Price, 1989; Espejo and Romero,
1987; Espejo et al., 1988; Kempner, 1966). On the other hand, T. neapolitanus inhabits

41
environments in the pH range of 4.5 to 8.5 (Bergev's Manual of Determinative
Microbiology: Vishniac, 1974 and Kelly 1981; 1982).
1.4.3 Principles of Respiration and Phosphorylation. During the oxidation of
inorganic sulfur compounds, released electrons enter a system of membrane-bound
proteins, collectively called the electron transport chain (ETC). These proteins are
located in the cytoplasmic membrane of the organism. Energy liberated during electron
transport is converted into adenosine-5'-triphosphate (ATP) by oxidative
phosphorylation. The mechanism by which electron transport is coupled to oxidative
phosphorylation (chemosmotic hypothesis) was Erst proposed by Mitchell (1961). Energy
derived from the passage of electrons along the transport chain is thought to drive the
translocation of protons from the cell's cytoplasm to the periplasmic space or cell
surroundings. The process establishes an electrochemical protonmotive force which is
comprised of two components, (i) a gradient in proton concentration and (ii) a difference
in electrical potential, or charge gradient across the cytoplasmic membrane. The
protonmotive force drives hydrogen ions back to the cytoplasm via a protein complex
known as ATPase (F, F„ ATPase). Retranslocated protons drive membrane-associated
functions, including phosphorylation of adenosine-5'-diphosphate (ADP) to produce ATP
(Hinkle, 1978). The exact mechanism of the phosphorylation is not known. ATP is
useful form of stored energy for many endergonic biochemical functions (Gottschalk,
1986); reducing power (as well as ATP) is required for the assimilation of C02 by
autotrophic bacteria.

42
Figure 1-8 illustrates the mechanisms, principles, and importance of electron
transport in thiobacilli (Kelly, 1982). The reactions are summarized in Figure 1-9. The
products of these reactions are substrates for additional biosynthetic reactions. The
synthesis of one molecule of glucose from C02 involves the hydrolysis of 18 molecules
of ATP. Reducing power for this biosynthesis is provided in the form of NADH.
1.4.4 Oxidation of Sulfur Compounds in Chemolithotrophs. The biochemistry
of dissimilative sulfur oxidation is not entirely established A recently proposed pathway
of sulfide [S(-n)], elemental sulfur (S°), and thiosulfate (S2Of) oxidation is illustrated in
Figure 1-10 (Stanier, 1976). S(-II) is oxidized to polysulfide in a reaction that requires
glutathione (see step 1 in Figure 1-10). S° is also oxidized in this manner. All electrons
released from the oxidation are transferred to Oz via the proteins of the electron
transport chain, as described above. The system for thiosulfate oxidation yields an end
product of two sulfate molecules formed for every thiosulfate molecule oxidized
(Gottschalk, 1986). Figure 1-8 illustrates the mechanism of electron transport from
reduced sulfur compounds in thiobacilli (Kelly, 1982). ATP is generated from the
transfer of electrons and resulting proton motive force. Reducing power as NADH or
NADPH is produced by reversing the direction of electron transport, an ATP-dependent
process. Reductant is required by the Calvin cycle to reduce COz for cellular
biosynthesis.
1.4.5 Practical Applications of Thiobacilli. Jack et al. (1979) reported that oil
recovery from the Athabasca Oil Sands in Alberta, Canada resulted in the production of
coke rich in trace metals. This coke was found to be amenable to the recovery of

43
NAD *.02 OR NOj, NO J, N»0, NO
Thiobaciltus denitrificans
Thiobaciltus novetlus, Thiobaciltus Aj. T. neapolitanus, T. ferrooxidans
Figure 1-8. Principles of electron transport and phosphorylation in thiobacilli.

6ADP (6ATP)^_V6
6-Ribulose. SP
4 Xylulose SP
2 Ribose SP 2 Xylulose SP
[2 Glyctraldetiyde 3P*| 2 Sedonepiulose 7Pj"*
wA 2 Sedoheplulose 1,7I\
^S^f20HAPl-4-1.2E4P J
0
I e CO, I i—_-J ^—• 12 Glycerate 3P -
RuOPCase ^^•WADP
13 Glycerol* t, 3f^
[2 Xylulose SP 1 •|_2 Erythrose 4Pj
12 NADH+ I2H* 12N?
12 Glycerolde'hyde 3P (G3P)
•3 Glyceroldehyde 3P •3 OihydroKyocelone 3P
Fructose 1.0P.
3 Fructose 6P
I 1 Glucose 6P
Figure 1-9. The reductive pentose phosphate or Calvin cycle for the conversion of COz into glucose. For each turn of the cycle, one mole of hexose is synthesized from 6 C02 at the expense of 18 ATP and 12 NADH, this energy being derived from the oxidation of inorganic substrate in chemolithoautotrophs.

45
Figure 1-10. Routes of the oxidation of sulfur compounds in chemolithoautotrophs. 1, oxidation of sulfide to polysulfide sulfur [S];, 2, conversion of elemental sulfur to polysulfide sulfur; 3, thiosulfate-oxidizing multi-enzyme complex; 4, sulfur oxidase; 5, sulfite oxidase; 6, APS reductase; 7, ADP-sulfurylase 8, electrons are transferred to oxygen via components of the respiratory chain.

46
vanadium by a simple leaching technique that involved the growth of T. thioaxidans on
elemental sulfur and subsequent addition of microorganisms to the coke (Zajic et al.,
1978). T. thioaxidans detoxified and maintained vanadium in solution by the reduction
of vanadium from vanadium (V) to vanadyl ion, vanadium (IV).
In mining applications, ThiobacUlus ferroaxidans has been widely used to leach
metals such as copper, zinc, and uranium from ores (Smirnov, 1963; Postgate, 1982).
1.5 Competition in Microbial Ecosystems.
1.5.1 General. In nature, a multiplicity of different organisms are involved in
cycling the various elements. In order to come to some understanding of their place and
function, it has become an established practice to isolate microorganisms in pure cultures
and to study their properties under well-defined conditions in the laboratory. In these
studies, the application of continuous culture techniques has received considerable
attention since the approach allows the study of microbial growth under conditions
similar in almost all respects to those found in nature.
1.5.2 Competition: Survival of the Fittest Darwin's work on natural selection
emphasized the importance of competition between different species. Competition
results from dependence of two and/or more species on a common factor such as food,
light, space, or some other limiting resource. Consumption of this common factor by
each species limits its availability to the other, so that the growth rates of both the
organisms are affected negatively.

47
In a competitive situation, we are interested in investigating whether either
species enjoys a natural advantage. A little reflection suggests that the species with the
fastest growth rate should do better, since it will be able to utilize more of the limiting
factor than the slower-growing organism by virtue of its rapid growth. This faster-
growing organism will exhaust such a limiting factor and may, over a sufficient period of
time, eliminate the slower-growing organism.
1.5.3 Basic Theory of Continuous Cultures. A continuous culture system
consists of a culture vessel, the contents of which are well mixed, to which fresh medium
is added at a constant feed rate while the working volume is kept constant via continuous
removal of effluent at the same rate. The system is thus open. All the components
required for growth are present in excess accept for one: the growth-limiting substrate.
Ideally, this cultivation system allows continuous, exponential growth (though sub-
optimal) of microorganisms under constant environmental conditions, i.e., in a steady-
state, with no fluctuations in either the substrate concentration or the microbial
population (Monod, 1950; Novick and SzUard, 1950).
1.5.4 Competition and Selection in a Chemostat A chemostat is a reactor for
the cultivation of microorganisms in which steady-state conditions can be established. In
a chemostat, it is generally assumed (Monod, 1950; Herbert, Elsworth & Telling, 1956;
Powell, 1965) that, the relationship between the growth rate of organisms and the
concentration of growth-limiting nutrient can be represented adequately by a Michaelis-
Menten type of equation:
[D] = u = * [S/(K,+S)J

48
where, u is the specific growth rate; u,, is the maximum rate of growth of the organisms
in the growth medium; S is the extracellular concentration of growth-limiting substrate
in the culture and K, is a half-saturation constant (numerically equal to the extracellular
concentration of growth-limiting nutrient at u = 0.5 u ). Under steady-state conditions
in a chemostat, u is equal to the dilution rate (D). Dilution rate characterizes the
holding time or processing rate in a chemostat.
The following comments pertain to a two-organism competitive situation
established in a chemostat with dilution rate D under limiting-substrate concentration.
We shall assume that specific growth rates for organism 1 and 2 are u, and Uj,
respectively. As indicated in Figure 1-11, the concentrations of the growth-limiting-
substrate within the vessel will be Sv Now, if organism 2 is introduced into the
chemostat, it will grow initially at the rate u2. Since u2 > D, the population of species
2 will increase with time, causing the substrate concentration to fall. With S < S„ the
specific growth rate of species 1 is smaller than D, so that organism 1 will begin to
washout. This trend will continue until the substrate concentration reaches Sj, at which
point species 2 attains steady-state while species 1 continues to washout. Therefore, the
washout rate of the slower-growing organism is function of the dilution rate. In reality,
the situation is more complex since a population attached to a surface can survive in a
chemostat even when D exceeds its specific growth rate. Similarly, a slower-growing
organism, if present in an ecologically advantageous niche such as a biofilm, has been
observed to persist in competition with fast-growing species.

*2
Growth-limiting substrate conc., s
Figure 1-11. Hypothetical specific growth rates of organism 1 and 2. The text explains why organism 1 will wash out of the continuous culture.

50
1.5.5 Competition Related Research. Nathanson (1902) first isolated organisms
capable of autotrophic growth using reduced sulfur compounds as an energy source.
Since then, several different types of these organisms have been isolated. Starkey (1935)
showed that one group of these organisms, the genus Thiobacillus, includes not only the
obligately chemolithotrophic(auto)trophic organisms, but also facultative
chemolitho(auto)trophs, which possess the potential for heterotrophic growth in the
absence of an inorganic sulfur-containing substrate. The fact that (Starkey, 1935; Taylor
et al., 1971; Swaby and Vitolius, 1968) obligately chemolithotrophic thiobacilli are able
to maintain themselves in close proximity to almost any microbial cell in the natural
environment is remarkable. One of the characteristic properties of the thiobacilli is their
low maximum specific growth rate as compared to specialized heterotrophs. As growth
rate must be one of the decisive selective properties for competing species, the survival
of the thiobacilli would seem difficult to explain. However, it has been well established
that the outcome of competition under substrate-limiting conditions cannot always be
predicted on the basis of maximum specific growth rates but also depends on many other
parameters such as the actual specific growth rate (u), the substrate half-saturation
concentration (K,) (Veldkamp and Jannasch 1972; Harder and Veldkamp, 1971; Meers,
1971), the presence of predators (Jost et al., 1973), the availability of other limiting
substrates (Meers and Tempest, 1968; Megee et al., 1972), and probably a whole set of
still unrecognized parameters. In considering the potential of a facultatively
chemolithotrophic Thiobacillus to survive in competition with specialized heterotroph it
seems likely that metabolic versatility allows such organisms to survive in nature.

51
Rittenburg (1972) suggested that these chemolithotrophic thiobacQli-type organims
should be able to compete successfully with a "specialist" Thiobacillus under mixed
substrate conditions.
Gottschal (1981) found that when a chemostatic culture of Thiobacillus A2 was
grown under alternate limitation of acetate and thiosulfate (4h acetate/4h thiosulfate or
8h acetate/16h thiosulfate) at a dilution rate of 0.05 h'1, uninterrupted growth of the
culture was obtained. However, with 16h acetate/8h thiosulfate, Thiobacillus A2 required
several hours before it attained autotrophic growth at a rate of 0.05 h'1 following the
transition from acetate to thiosulfate supply. In a two-species, continuous flow, mixed
culture with the heterotrophic spirillum G7, Thiobacillus A2 outcompeted the
heterotroph when grown under alternating limitation of acetate (4h) and thiosulfate.
Under the same growth conditions, Thiobacillus A2 co-existed in approximately equal
numbers with T. neapolitanus, from which it was concluded that Thiobacillus A2 grew
only heterotrophically on acetate in this case. Analogous competition experiments with
three-species cultures grown under the same conditions, resulted in complete elimination
of Thiobacillus A2 and co-existence of T. neapolitanus and Spirillum G7 in almost equal
numbers. In an enrichment culture, again grown under the same regime, a facultatively
chemolithotrophic Spirillum-shaped Thiobacillus became dominant
Gottschal (1979), also investigated competition in a chemostat between the
versatile Thiobacillus A2 and the specialized 71 neapolitanus using thiosulfate as the sole
growth-limiting substrate. The specialized organism dominated at dilution rates > 0.025
h'1. Higher concentrations of acetate or glycollate in the thiosulfate medium caused

52
increased relative numbers of Thiobacillus A2 at steady-state(s) at dilution rates equal
to 0.07 h'1. Eventually, with 10-12 mM organic substrate per liter, complete dominance
of Thiobacillus A2 over T. neapolitanus occurred. In the same subset of work, mixed
cultures of Thiobacillus A2 and a specialized spirillum-shaped heterotroph competed for
acetate as sole growth-limiting substrate. The heterotroph dominated completely at
dilution rates of 0.07 and 0.15 h"1. In this case, increasing concentrations of thiosulfate
in the acetate medium, up to lOmM. eventually led to the elimination of the heterotroph.
These results were interpreted as evidence that Thiobacillus A2 was growing
mixotrophically. As the concentration of the second substrate was raised, the number
or ThiobacillusA2 cells increased, and as a result Thiobacillus A2 consumed an increasing
portion of the common substrate.
In mixed chemostat cultures containing all three organisms, Thiobacillus A2 was
maintained at all tested ratios of acetate and thiosulfate in the influent medium. The
heterotroph was excluded from the culture below a relatively low acetate-to-thiosulfate
ratio, whilst T. neapolitanus was completely eliminated at very high acetate/thiosulfate
values.
Smith et al. (1979), investigated the competition between T. neapolitanus and
Thiobacillus A2 in thiosulfate-limited chemostat cultures as a function of pH. He found
that, in pure cultures, pH <, 7.6, T. neapolitanus grew faster than Thiobacillus A2, but
in competition Thiobacillus A2 dominated at pH 7.35 and 7.6. At pH 7.1, T. neapolitanus
dominated, although a significant steady-state population of Thiobacillus A2 persisted
that apparently grew on organic nutrients excreted by T. neapolitanus. Co-existence of

53
both organisms occurred under all chemolithotrophic growth conditions tested with the
dominant organism comprising of 85 to 99% of the population, indicating that
competition was not the sole interaction between the species. However, at pH 7.1, the
inclusion of glucose in thiosulfate medium resulted in the rapid domination of the culture
by Thiobacillus A2, with the virtual elimination of T. neapolitanus. This study suggested
that the capacity for mixotrophy is a selective advantage to a facultative Thiobacillus in
competition with an obligately chemolithotrophic species.
Thingstad and Gottschal (1982) developed a mathematical model based on
Monod-type growth kinetics that described the growth of two bacterial species in mixed
chemostat cultures under dual-substrate limitation. In their experiments, competition
between a facultatively chemolithotrophic Thiobacillus and either a heterotroph or an
obligately chemolithotrophic Thiobacillus served as a model system. Furthermore, the
introduction of Monod-type growth kinetics in the model slowed an assessment of the
relative importance of the growth parameters for the outcome of the competition. In
addition, they showed how a mathematical description of the two-membered mixed
cultures can be used to predict the outcome of competition experiments among three
species competing for acetate and thiosulfate. In contrast to the experimental data,
Gottschal (1979) predicted that either two of the three species or the mixotroph alone
would survive in the culture. Within the framework of the model, he suggested two
possible explanations for the experimentally observed co-existence of three species: either
the veiy slow dynamics of the system did not allow the attainment of a true steady-state
within the time scale of the experiments or some parameters describing the mixed culture

54
were extremely sensitive to minor fluctuations in dilution rate. The results of this model
support the view that facultatively chemolithotrophic bacteria are able to survive under
appropriate mixed-substrate conditions in the presence of more "specialized" heterotrophs
and obligate chemolithotrophs, despite their relatively low specific growth rates.
Pol and Kuenen (1981), showed that during autotrophic growth, Thiobacillus A2
cells retained a considerable capacity to oxidize various organic sources.
Heterotrophically grown cultures, on the other hand, were completely devoid of the
capacity to fix C02 via the Calvin cycle and to generate energy from thiosulfate. During
transitions from organic media to inorganic thiosulfate-containing media in the
chemostat, a long lag-phase was observed before energy generation (thiosulfate
oxidation), C02 fixation and, consequently, measurable growth occurred. This lag-phase
was practically abolished if organic substrates were present at very low concentrations in
the thiosulfate mineral medium which could be used as an energy source. The same
result was obtained when the cells contained reserve material at the moment of the
transition. During transition from thiosulfate-limited growth to starvation, the Q02-max-
thiosulfate and the capacity to fix COz decreased very slowly, after an initial short (+4h)
increase in both enzyme systems. In contrast, these two metabolic functions were
inactivated relatively rapidly in the presence of an oxidizable organic carbon and energy
source. This process of inactivation was instantaneously stopped and reversed into rapid
enzyme synthesis upon replacement of the organic substrate by thiosulfate.
Goldberg et al. (1976) and Switzer (1977) showed that competition in microbial
cells is not only due to physiological flexibility and/or enzyme reactivity but also be

55
subject to selective inactivation under conditions in which the presence of the enzyme
is of no use or even particularly harmful. Hie authors studied both appearance and
disappearance of some enzyme activities during substrate transitions in a chemostat.
Attention was mainly focused on the enzyme system responsible for the oxidation of
thiosulfate and on the key enzyme of the autotrophic C02-fixation pathway in
ThiobacillusA2 (ribulose-1,5-bisphosphate carboxylase). They concluded that the ability
of a species to survive under various conditions may be related to its ability to conserve
energy by shutting down the biosynthesis of proteins that are not needed.
Jost et al. (1973) studied competition between Escherichia coli and Azotobacter
vinelandii for glucose (sole carbon source) by adding a suspension of E. coli to a steady-
state chemostat culture of A vinelandii. The time of addition was defined as the "zero
hour". The level of glucose at steady-state was about 0.005 mg/ml, the steady
concentration for the Azotobacter culture. In about 2 days, Azotobacter numbers were
reduced to less than 10% of their initial density, and the glucose level dropped to a point
where it was no longer measurable. Plate counts showed that there were about 10s
Azotobacter per ml. Similar data were obtained at other holding times ranging from 5.6
to 23 hours. In all cases E. coli displaced A vinelandii', this was true even when the E.
coli cells were cross-inoculated from stationary-phase batch cultures.
Meers and Tempest (1968) investigated several different magnesium-limited
mixed cultures, each containing two microbial species. Competition experiments were
initiated by exchanging small numbers of organisms between (previously) pure,
magnesium-limited chemostat cultures of Aerobacteraerogenes, Pseudomonasfluorescens,

56
Bacillus subtilis, Bacillus megaterium, Staphylococcus epidermis, and Torula utilis. The
fate of each species in these mixed cultures was determined following cross-inoculation.
Gram-negative organisms invariably outgrew the Gram-positive ones. The ability of B.
subtilis and B. megaterium to outgrow each other, or to outgrow the yeast (Torula utilis),
depended on the inoculum size. This dependence resulted from the presence of specific
extracellular products in the Bacillus cultures which stimulated their growth and uptake
of magnesium. The concentration of these extracellular growth-promoting substance(s)
in magnesium-limited cultures of B. subtilis varied with population density. Thus, when
the magnesium concentration in the influent medium was decreased from 0.9 to 0.15
ug/ml (thereby causing the steady-state population to be decreased to one-eightieth of
the initial value), B. subtilis could no longer maintain itself against proportionally lower
concentrations of T. utilis. But addition of extracellular fluids from dense magnesium-
limited B. subtilis cultures to magnesium-limited T. utilis cultures enabled small numbers
of the Bacillus to outgrow the yeast. From these two observations it was concluded that
magnesium assimilation by B. subtilis is more dependent on extracellular substance(s)
than is magnesium assimilation by either T. utilis or the Gram-negative organisms.
In another study, Meers (1970) investigated the influence of magnesium-limitation
on growth of Gram-positive organism-Bacillus subtilis-and the data compared with those
obtained with Aerobacter aerogenes grown under similar conditions. The magnesium
contents of both organisms varied with growth rate but were very similar at
corresponding growth rates. With magnesium-limited chemostat cultures of each
organism, uptake of magnesium was almost complete at specific growth rates less than

57
0.7max. Cellular magnesium was tightly bound, none being removed by res us pension of
the organisms at 20°C in 0.85% (W/V) NaCl. When magnesium-limited organisms were
suspended in environments containing excess magnesium, this ion was rapidly adsorbed;
the amount adsorbed varied with both the initial extracellular magnesium concentration
and the composition of the diluent. B. subtilis had a greater capacity for magnesium
adsorption than A. aerogenes but its affinity for this ion was less. The latter difference
correlated with the ability of A. aerogenes to rapidly outgrow B. subtilis in magnesium-
limited chemostat cultures containing both organisms.
1.6 Objectives.
1.6.1 General. This investigation was undertaken to determine if a steady-state
culture of Thiobacillus could be displaced by heterotrophic organisms and to define the
conditions under which such displacement occurred. A long range goal of this research
would be to determine if competitive displacement could be effected in corroding sewers.
In some respects Thiobacillus thiooxidans has a tenuous metabolism. The ATP output
from oxidizing sulfur compounds is low. The organism is also disadvantaged by having
to spend enormous amounts of energy to build all its cellular ATP by reducing C02. The
growth rates for thiobacilli are generally slow (12-16 hours), compared to other
organisms. However, T. thiooxidans is able to survive at very low pH and needs no
external source of organic carbon. Once established, it can drive out competitors by
acidifying the environment to a degree that is intolerable to most other species. Sewers
are carbon-rich environments. However, heterotrophic organisms residing on the crown,

58
may conceivably experience carbon limitation. That is, the availability of carbon to many
areas of the crown may be limited to volatile compounds that are not necessarily good
substrates (easily assimilated) for heterotrophic growth. Thus, if good growth substrates
were supplied, growth of heterotrophs would be encouraged. Under those circumstances,
heterotrophs might compete favorably with the thiobacilli for other limiting nutrients.
Such competitive relationships are the subject of this research.
1.6.2 Isolation Experiments. Sample collection and isolation of low-pH and mid-
pH heterotrophs capable of growth in a defined medium from a local sewer preceded all
other laboratory work. Sewer crown samples from the Roger Road Treatment Plant
collection system were subjected to growth and biochemical tests that led to the isolation
of the organisms. Isolation procedures generally followed those in common use.
1.63 Stoichiometric Experiments. Bench-scale, batch-culture experiments were
conducted to determine the stoichiometric relationships between nitrogen (ammonia) and
carbon (glucose) utilization by potential heterotrophic competitors. Nitrogen (ammonia)
to thiosulfate utilization ratios were also established for T. neapolitanus were tested.
Determination of specific growth rates and nutrient utilization rates for the sewer isolates
at various initial pHs was determined. This led to the determination of critical N/C ratio
defined as the nitrogen-to-glucose ratio at which transition from nitrogen-limitation to
glucose-limitation occurs. The critical N/C ratio is also the ratio of nitrogen assimilation
to carbon utilization during balanced growth of the subject heterotrophic competitors.
1.6.4 Two-Organism Competition Experiments. The acidophilic thiobacilli are
highly suited to occupy a rather constrained ecological niche that is characterized by low-

59
pH and low-organic conditions. Once established, they modify their environment to the
exclusion of less acid-tolerant organisms by dramatically lowering the ambient pH. On
the other hand, the thiobacilli are slow-growers and may not be at their best in organic-
rich environments.
To test this hypothesis, competition experiments involving thiobacilli and
heterotrophs were conducted under NH4+-limiting and carbon-limiting conditions. The
ammonia-to-glucose ratio in the feed-stream was varied in continuous-flow experiments
so as to bracket the critical N/C ratio for the growth of the heterotrophic competitors.
It was speculated that an adequate supply of carbon would enable the heterotrophic
organisms to out compete the thiobacilli for a limiting supply of nitrogen. Tests were
conducted at both low and mid-pH levels using T. thioaxidans and T. neapolitanus,
respectively, in order to simulate heavily corroded and lightly corroded or non-corroded
sewer conditions.
1.6.5 Effect of pH on Competition Experiments. The objective of this portion
of the work was to monitor the effect of bulk, liquid-phase pH on potential microbial
competitors that can interrupt acid production by thiobacilli. Experiments were
conducted at steady pH values of 2.00, 2.50, and 3.25, at influent feed N/C ratios above
and below the critical N/C ratio.
1.6.6 Effect of Different Heterotrophs in Competition Experiments. The object
of this work was to screen different heterotrophs that might be encountered in the actual
sewer environment as inhibitors of growth and acid production by the thiobacilli Tests
were conducted both under low and mid-pH conditions using sewer isolates including a

60
mixed seed the sewer and E. coli. Low-pH experiments were conducted at ZOO, 2.50,
and 3.25.

61
CHAPTER 2
MATERIALS AND METHODS
2.1 Microorganisms.
Two strains of thiobacilli were examined in terms of their ability to produce acid
in the presence of a heterotrophic competitor. Including the heterotrophic competitors,
the four species investigated were Thiobacillus thiooxidans, Thiobacillus neapolitanus,
Escherichia coli, and an unidentified strain of yeast.
Axenic cultures of thiobacilli and E. coli were obtained from the American Type
Culture Collection (ATCC, 1984). ATCC strain numbers 8085 (T. thiooxidans), 23638
(T. neapolitanus), and 15597 (E. coli) were purchased during the early phase of the
research. A species of yeast was isolated from the crown of an exceptionally corroded
local (Tucson) sewer.
2.2 General Description of Media Composition.
Four mineral salts media were used to grow the thiobacilli, E. coli, and the yeast.
The media used in all the experiments represent modifications of a Thiobacillus medium
described in the ATCC media handbook (medium #125; ATCC, 1984). Tables 2-1
through 2-8 list the chemical constituents and their concentrations in the low-pH and

62
mid-pH media. The basal salts media used in competition experiments were sulfate-free.
Sulfate was excluded to permit accurate measurements of sulfate ion as an indication of
the acid generation rate by the thiobacilli.
Media were autoclaved prior to bacterial inoculation for 15-20 minutes at 121°C.
Elemental sulfur (sublimed powder; EM Industries, Inc.) was sterilized via tyndallization
and added in excess (approximately 10 g/L) to the low-pH media as an energy source.
Iron and glucose were added from filter-sterilized stock solutions after heat-sterilization
of other ingredients was completed.
23 Isolation of Yeast from the Sewer Crown.
2.3.1 General. Crown samples at the Roger Road Treatment Plant in Tucson,
Arizona were collected in March, 1989. Within the premises of the plant area two
manholes were selected, one by the golf course and the other at the syphon outfall.
Samples withdrawn from the sewer crowns were inoculated into test tubes containing
growth media as in Table 2-3. pH was measured on the crowns as an indication of sewer
condition. Isolation of the bacterial strain (heterotrophs) from physical samples involved
liquid-culture enrichment followed by colony development on complex and defined solid
media.
23.2 Sampling Techniques. Safety procedures for collection of samples were
those followed by sewer-maintenance personnel. Sewer headspace was vented with fresh
air prior to entrance. Crown samples were taken using a pair of acid-resistant rubber
gloves. Samples were obtained by scraping material from the crown. Reasonable efforts

63
Table 2-1. General composition of defined chemical medium used for the growth of T. thiooxidans.
Grams per liter of distilled H20:
pH adjusted to 3.75
Table 2-2. General composition of defined chemical medium used for the growth of T. neapolitanus.
Gram per liter of distilled H20:
pH adjusted to 6.8
Notes for all media preparations:
(i) FeCl3. 6H20 was prepared at lOQx the final concentration and filter-sterilized prior to addition to previously cooled, autoclaved medium;
(ii) Desired initial pH was achieved by adding concentrated HQ.
Elemental sulfur KH2PO„ MgClj. 6H20 CaCl2
FeCl3. 6H20 NH<C1
10.0 3.0 0.5 0.25 0.01 0.5
Na^Oj. 5H20 Na2HPO< KHjP04
MgQj. 6H20 CaQ2
FeQ,. 6H20 NH4Q
10.0 1.2 1.8 0.1 0.03 0.01 0.5

64
Table 2-3. Composition of defined chemical medium used for the isolation of low and mid-pH organisms from sewer-crown samples.
Grams per liter of distilled H20:
KC1 0.05 KH2P04 0.1 MgSO< 0.5 (NH,)jS04 0.2 FeClj. 6H20 0.01 Glucose 5.0
pH adjusted to 3.75 and 6.8
Table 2-4. Composition of defined chemical media used in stoichiometric experiments involving E. coli growing in the mid-pH range.
Grams per liter of distilled H2Or
KC1 0.05 KH2PO, 0.1 MgSO< 0.5 (NH^O, (Various) 0.660 (5.0 x 10"3 M)
0.297 (2.25 x 10"3 M) 0.132 (1.0 x 10 ̂M) 0.101 (7.5 x Iff4 M) 0.067 (5.0 x lCT'M)
or 0.002 (1.0 x Iff5 M)
Glucose 0.405 (2.25 x 10"3 M)
pH adjusted to 6.80

65
Table 2-5. Composition of defined chemical media used in stoichiometric experiments involving yeast growing in the low and mid-pH range.
Grams per liter of distilled H20:
KC1 0.05 KH2PO4 0.1 MgSO, 0.5 (NH4)2SO, (Various) 0.925 (7.0 x 10"3 M)
0.463 (3.5 x 10⁻³ M) 0.106 (8.0 x 10"* M) 0.041 (3.0 x 10^ M) 0.007 (5.0 x 10 s M)
or 0.000 (control)
Glucose 0.405 (2.25xlO"3M)
pH adjusted to 3.25 and 6.8
Table 2-6. Composition of defined chemical media used in stoichiometric experiments involving T. neapolitanus growing in the mid-pH range.
Grams per liter of distilled H20:
Na2HPO< 1.2 KH2P04 1.8 MgCl2.6H20 0.1 CaCl2 0.03 FeClj. 6H20 0.01 Na^A. 5H20 1.24 (5.0 x 10"3 M) NH4C1 (Various) 0.187 (3.5 x 10"3 M)
0.043 (8.0 x 10"4 M) 0.016 (3.0 x 10"4 M) 0.003 (5.0 x 10⁻⁵ M) 0.0005 (1.0 x 10"5 M)
or 0.000 (control)
pH adjusted to 6.8

66
Table 2-7. Composition of deflned chemical media used in T. thiooxidans and yeast competition experiments.
Grams per liter of distilled H20:
Elemental sulfur 10.0 KH2PO< 3.0 MgCk 6H20 0.5 CaCl2 0.25 FeClj. 6H20 0.01 NH4C1 (Various) 0.535 (1.0 x 10² M)
0.187 (3.5 x 10⁻³ M) 0.028 (5.0 x 10^ M)
or 0.005 (1.0 x 10"4 M)
Glucose 0.405 (2.25 x 10³ M)
pH adjusted to 2.0, 2.5, and 3.25 (experiment dependent)
Table 2-8. Composition of deflned chemical media used in T. neapolitanus and yeast competition experiments.
Grams per liter of distilled HzO:
NaH2P04 1.2 KH2PO4 1.8 MgCl2. 6H20 0.1 CaCl2 0.03 FeCl3. 6H20 0.01 Na&Oj. 5H20 1.24 (5.0 x ia3 M) NH4CI 0.535 (1.0xl02M)
0.187 (3.5 x 10* M) 0.028 (5.0 x ia4 M) 0.005 (i.o x ia< M)
Glucose 0.405 (2.25 x ia3 M)
pH adjusted to 6.80

67
Table 2-9. Reactor Details and Design Criteria for low and mid-pH experiments:
Detention time = 25 hours (approximately twice the doubling time of the slower-growing organism). Working liquid volume = 1000 ml Nutrient feed stream flow rate = 0.667 ml/min

68
to collect samples with sterile cotton swabs proved futile due to lack of surface moisture
at the sewer crown. Scraped samples were transferred into 20 ml test tubes containing
sterile media described in Table 2-3 and transported to the University of Arizona
laboratories. Crown samples were placed in an insulated container packed with ice
during transportation. Samples were processed within three hours of collection.
The crown surface pH was measured using pH paper indicator sticks (American
Scientific Products Inc.,). Due to the inadequacy of surface moisture on the crown
concrete, a small volume of distilled water was sprayed onto the crown surface prior to
the pH check. Samples from the tubes were transferred into 500 ml erlenmeyer flasks
containing media (200 ml volume) described in Table 2-3. Flasks were placed on a
shaker table and incubated at room temperature (23°C to 25°C).
2.3.3 Enrichment Steps. Inoculated media were incubated at room temperatures
for several days. Subsequently, samples were withdrawn aseptically and transferred from
each culture to fresh, identical media to eliminate growth that was driven by constituents
present in the original samples. These "first-transfer" enrichments were cultivated in the
same manner as the original cultures. Steps utilized for the isolation are summarized in
Figure 2-1.
2.3.4 Serial Dilutions. First-transfer cultures that indicated growth were used
to obtain pure strains of yeast via spread-plate technique. Dilution media were identical
to the original growth media (Table 2-3). When serial dilution immediately preceded
spread-plating, glucose was omitted. Serial dilution tubes were placed on a tube rotator
and/or shaker tables at room temperature (23°C to 25°C) for incubation and inspected

Collect sample for growth in initial selective
medium as in Table 2-3.
Transfer to fresh medium (first-transfer) for
additional enrichment.
Serial dilute and spread on plates with Bacto-agar and
medium. Monitor growth and monoclonal colonies.
Transfer from agar-plate to original medium and grow
axenic culture.
Restreak and grow bacteria on original medium and
cultivate isolates.
Figure 2-1. Steps used for the isolation and identification of sewer crown samples.

70
for growth. Monoclonal cultures of yeast were obtained via standard spread-plate
techniques from the highest dilution tube which showed growth.
Solid media were generally prepared by supplementing appropriate defined media
with 1.5% (WAO aSar P"or to sterilization. For low-pH media, pH was adjusted
approximately to 3.75 after sterilization at a temperature that was slightly higher than the
agar solidification point and before solidification. The process was structured in this
manner to avoid acid-catalyzed hydrolysis of agar at high temperatures (above 53°C).
Solidification was accomplished using Noble agar (DIFCO). When growth on solid
media was too dense, representative "colonies" were re-streaked onto fresh plates of
identical media in a manner designed to permit development of monoclonal colonies.
2.4 Stoichiometric Experiments.
2.4.1 General. Stoichiometric relationships among growth, nitrogen-to-glucose,
and nitrogen-to-thiosulfate utilization ratios were developed using two kinds of batch-
culture experiments. In the first, the ratio of nitrogen-to-carbon usage for the yeast
isolate and E. coli were determined. In the second, the nitrogen-to-thiosulfate usage ratio
for T. neapolitanus was determined. A N/S usage ratio for T. thioaxidans could not be
determined inasmuch as the acidophilic thiobacilli obtain carbon for growth by
assimilating carbon dioxide (obligate autotroph).
2.4.2 Determination of "Critical" N/C or N/S ratio. "Critical" nitrogen-to-
carbon ratios for growth of E. coli and yeast and a nitrogen-to-thiosulfate ratio for T.
neapolitanus were established in batch-culture experiments containing media described

71
in Table 2-4, 2-5 or 2-6. Following sterilization, 50-ml of media were dispensed into a
series of 125-ml erlenmeyer flasks containing ammonia-nitrogen at concentrations
provided in Table 2-4 and 2-5 or 2-6. The original nitrogen concentration was varied
over several orders of magnitude in the presence of a fixed concentration of glucose or
thiosulfate (experiment dependent). Flasks were inoculated with yeast, E. coli or T.
tieapolitanus from a dense overnight, 2.5% v/v, and shaken at room temperature (23°C
to 25°C) during the course of the experiment Growth was monitored into stationary
phase. Cell density was measured spectrophotometrically (culture absorbance at 600nM)
and directly using a PetrofF-Hauser counting chamber as described subsequently. Direct
counts were necessary when experiments involving thiobacilli formed suspensions of
secondary sulfide/sulfite/sulfate compounds within the medium.
In theory, the terminal optical density or cell number at which stationary-phase
growth was achieved, should be a function of the initial ammonia concentration until
sufficient ammonia is added to permit the culture to exhaust its glucose or thiosulfate
supply (nitrogen-limitation). At higher nitrogen concentrations, growth limits should not
depend on the initial nitrogen concentration. The nitrogen-to-glucose ratio at which
transition occurs from nitrogen-limited to glucose-limited would be the critical N/C ratio.
Similarly, the point at which nitrogen-limitation yields to thiosulfate-limited growth occurs
is the critical N/S ratio.

72
2.5 Experimental Procedures.
2.5.1 The General Procedure. The actual competition experiments were
conducted in 2-liter fermentors (Virtis, 1-liter working volume) operated in a continuous-
flow mode (CSTR). The theoretical detention times for these experiments were
established at 25 hours, or about twice the generation time for thiobacilli (slower-growing
species). The reactor design and operational details are summarized in Table 2-9.
Oxygen was supplied continuously as filter-sterilized compressed air at 1.5 ml/min, and
the reactor contents were continuously agitated at approximately 200 rpm. Temperature
was maintained at 23°C-25°C, and culture pH was held constant via the periodic additions
of 2.0 M or 3.0 M NaOH (experiment dependent). The selection of pH was dependent
on the experiment and designed to permit growth of both the Thiobacillus species and
E. coli or yeast at rates that were determined via feed rates of ammonia and glucose or
thiosulfate.
The conduct of competition experiments was as follows. T. thioaxidans or T.
neapolitanus was grown in a sulfate-free medium described in Table 2-7 or 2-8
respectively, under continuous-flow conditions until steady-state conditions were
achieved. Steady-state was indicated by stabilization of cell numbers/ml, effluent sulfate
concentration, rate of base addition for the maintenance of pH (experiment dependent),
and effluent ammonia concentration. When steady-state conditions were established,
heterotrophic competitors (E. coli or yeast; experiment dependent) were spiked into the
reactor. The cell concentration of the competitor after the spike was approximately an
order of magnitude lower than the steady-state concentration of thiobacilli. Glucose

73
addition to the reactor was initiated at that time. In separate experiments, the influent
ratio of glucose to ammonia nitrogen was an independent variable. Ratios were selected
both above and below the critical ratio determined in batch cultures (Section 2.4.2).
Following the shift in the feed-stream concentration of glucose and the
inoculation of the reactor with heterotrophs, the post-glucose-addition reactor
performance was monitored via the semi-continuous measurement of cell numbers/ml
(both heterotrophs and thiobacilli) and the concentrations of sulfate; ammonia; and
glucose (dissolved organic carbon) in the reactor effluent. Throughout the experiment
(before and after inoculation with the heterotrophs), a running account of the base (2.0
M or 3.0 M NaOH) added to maintain a constant culture pH was monitored. NaOH
added for the maintenance of pH was assumed to be a measure of biogenic acid
production and consequently, Thiobacillus activity. Because a sulfate-free medium was
fed to the reactors, effluent sulfate was also a measure of Thiobacillus activity. It proved
easy to differentiate between yeast and the prokaryotic populations.
Immunofluorescence techniques facilitated the differentiation between E. coli and T.
neapolitanus. The analytical procedures employed during the competition experiments
are described subsequently.
2.5.2 Variations in the General Procedures.
2.5.2.1 Variations in influent ammonia-glucose ratio. A variation in the
general experimental procedure was required to evaluate the effects of various nitrogen-
to-glucose ratios on the activity, populations, and acid production by thiobacilli and the
performance of competitors. Experiments were performed at both low and mid-pH.

74
Hie ammonia-to-glucose ratio was varied in each of the experimental runs
involving both low and mid-pH thiobacilli. The feed-stream N/C molar ratio was varied
from 0.0445 to 4.445 (NH/-N/glucose-C). This range bracketed the critical N/C ratio.
When nitrogen was provided above the critical N/C ratio, carbon-limited growth was
anticipated and effects on Thiobacillus activity and growth should have been minimal.
Below the critical N/C ratio, nitrogen was to be growth-limiting. A detailed summary of
growth media and N/C feed ratio is provided in Tables 2-7 and 2-8. A summary of
experiment run, parameters measured, and independent variables is illustrated in Table
2-10.
2.5.2.2 Variation in pH. These experiments were designed to explore the
effects of pH on the performance of microbial competitors. The ability of the acidophilic
thiobacilli to tolerate extremely low-pH conditions (>. 0.5 pH units) is well known. In
these experiments, the influent pH was adjusted to 2.00, 2.50 or 3.25 per Table 2-7.
Culture pH was maintained at the influent level via the periodic addition of 3.0 M
NaOH. Influent nutrient concentrations (glucose and ammonia) were manipulated above
and below the critical N/C ratio at pH 2.00 and 2.50.
2.5.2.3 Variations in Competitor Identity. Experiments were designed
to explore the performance of different microbial pairs (Thiobacillus/heteTotioph) in
competition experiments. Several heterotrophs were used in both the low (T.
thiooxidans) and mid-pH (71 neapolitanus) experiments. A summary of species pairs
investigated at various pHs and N/C ratios is presented in Table 2-10.

TABLE 2-101 A Summaty at Experiment Run, Fatameten Meatuted, end Independent Variables med to Low end Mld-pH OompetiUoo Experiments.
J Experiment
"
Species Fair
Growth Medium
Culture pH
Feed Stream
N/C Ratio
0.045 0.223 1556 4.445
Parameters Measured
Cell Counting
Technique
Independent Variable
Total | No. of 1
Experiments (
'
T. thioaddans vs.
Yeast
Tabfci-7 345
Feed Stream
N/C Ratio
0.045 0.223 1556 4.445
NH/ Carbon (DOC)
SO,1
Rate or 3.0M NaOH Added Cell Numbers/tal
(T. thioaddans and Yeast)
Direct Count
(PetrofT-Hauser
Counting Chamber)
N/C Ratio Four |
2. T. thioaddans vs.
Yeast
Table 2-7 ZOO 1556 4.445
NH/ • Carboa (DOC)
Rate of 3.0KJ NaOH Added Cell Numbers/tail
(T. thioaddans and Yeast)
Direct Count
(Petroff-Hauser
Counting Chamber)
Culture PH and
N/C Ratio
Six | 2. T. thioaddans vs.
Yeast
Table 2-7
250 1556 4.445 -
NH/ • Carboa (DOC)
Rate of 3.0KJ NaOH Added Cell Numbers/tail
(T. thioaddans and Yeast)
Direct Count
(Petroff-Hauser
Counting Chamber)
Culture PH and
N/C Ratio
2. T. thioaddans vs.
Yeast
Table 2-7
325 1556 4.445
NH/ • Carboa (DOC)
Rate of 3.0KJ NaOH Added Cell Numbers/tail
(T. thioaddans and Yeast)
Direct Count
(Petroff-Hauser
Counting Chamber)
Culture PH and
N/C Ratio
3. T. thioaddans vs.
Mixed Seed
Tbble 2-7 2.00 1556 NH/ Carbon (DOC)
SO Rate of 3.0H NaOH Added
Cell Numbers/ml (T. thioaddans Only)
Immunofluorescence
Culture PH
TSro 3. T. thioaddans vs.
Mixed Seed
Tbble 2-7
325 1556
NH/ Carbon (DOC)
SO Rate of 3.0H NaOH Added
Cell Numbers/ml (T. thioaddans Only)
Immunofluorescence
Culture PH
TSro
4. T. neapolitamts vs. "
Yeast
TbNe 2-8 &80 0.045 0.223 1556 4.445
NH,* Carbon (DOC)
SO/1
Rate of 20M NaOH Added Cell Numbers/ml
(T. neapoEtams and Yeast)
Direct Count
(Petroff-Hauser
Counting Chamber)
N/C Ratio Four
5. Tjieapolitamis vs.
£ coti
Table 2-8 6.80 1556 4.445
NH/ Carbon (DOC)
SO/* Rate of 2.0M NaOH Added
CeQ Numbers/ml (T. neapolitamts and E eoff)
Spread Plating
N/C Ratio Two

76
2.6 Analytical and Chemical Techniques.
2.6.1 Microbial Growth Measurements. Growth of bacterial cultures was
measured via four different methods throughout this research. In the first method,
absorbance of culture density in the ultra-violet (UV) light range was measured at a
wavelength of 600nm. Absorbance was measured using a Shimadzu UV-160A Visible
Recording Spectrophotometer. This analyzer was micro-computer controlled and utilizes
a double-beam photometer. A reduced volume quartz cuvette with a one-cm path length
was used for all absorbance measurements. The instrument was corrected for the
solution baseline absorbance.
The second method employed a Petroff-Hauser Direct Counting Chamber (light
microscopy) to determine cell densities. This counting chamber is a framed microscope
slide divided into three areas; the middle section is etched with a grid pattern surrounded
by raised ledges. The outer sections act as recess channels for draining excess liquid.
The etched grid section consists of squares of that are 0.05 mm in dimensions. A cover
slip placed on two raised ledges of the slide provides a uniform space, 0.02 mm thick,
between the top of the chamber glass to the cover slip. A drop of sample was placed on
the slide and cover slip set on the raised ledges. Excess liquid was displaced from the
grid section of the slide to recessed-channels adjacent to the divided grid. The number
of cells per square was determined by averaging cell counts from five or more squares.
This quantity was multiplied by 2 x 10⁷ square volumes/ml to determine the number of
cells per ml.

The third method consisted of an eight-tube serial dilution and spread-plating
technique. This facilitated the determination of T. neapolitanus and E. coli cell numbers
in competition experiments that involved these organisms. One-ml samples of the
original mixed culture were transferred to the first tube and decimally diluted to
extinction. 100 ul samples from tubes corresponding to the 10"1 through 10"® dilutions
were spread-plated on nutrient agar (Difco) and thiosulfate solid media plates. The
nutrient agar and thiosulfate plates supported only the growth of E. coli and T.
neapolitanus, respectively. The difference in total cell counts obtained from the direct
counts and spread-plating was quantitatively equivalent to the cell numbers of E. coli or
T. neapolitanus. The fourth counting technique is described in section 2.7.
2.6.2 pH Measurement. Two methods of measurement were used throughout
this research: pH indicator strips (American Scientific Products Inc.) or a pH
meter/probe (Orion Research Model 811 millivolt/pH microprocessor or Beckman
Instruments Model-32 equipped with a Fisher Scientific pencil-thin Ag/AgCl electrode).
The pH sticks were used to measure culture pH when concern of contamination and/or
lack of liquid volume precluded other methods (e.g. crown pH during isolation).
Otherwise, the probe was used exclusively. The pH strips were considered accurate
within +0.2 pH units. Accuracy of the pH meter and probe were within +0.01 pH units.
Calibration of the meter/probe was accomplished with 4.00 and 7.00 pH buffers
(American Scientific Products Inc.).
Strong base (3.0 M NaOH) was added periodically for the maintenance of culture
pH in competition experiments. Titration curves were prepared to facilitate accurate
78
addition and accounting of base requirements. Such curves were constructed by plotting
the amount of base added to media versus the relative change in pH. The amount of
base necessary to return to the culture pH to target level was then determined from
titration curves adjusting for relative culture volume.
2.63 Total Sulfate Measurements. Sulfate ion was measured as a surrogate
parameter for the determination of acid/sulfate generation rate and metabolic activity of
thiobacilli. In this protocol, 3-ml samples were centrifuged (Eppendorf Centrifuge-5415
at 12000 rpm or 11750 RCF: reciprocal centrifugal force) for 10 minutes to remove
suspended elemental sulfur. To the centrate, 1-ml of conditioning reagent (consisting
of 50 ml glycerol; 30 ml HC1; 300 ml distilled water; 100 ml 95% ethyl or isopropyl
alcohol; and 75 g NaCl) was added and mixed in a stirring apparatus ^Standard Methods
for the Examination of Water and Wastewater. 1976). Following this, excess barium
chloride (BaCl2 crystals) was added and stirred for 60 seconds at constant speed.
Turbidity of the resulting barium sulfate (BaSO<) crystal suspension was measured at
420nm. Absorbance measurements were performed on a scanning Shimadzu 160A
UV/VIS spectrophotometer using a reduced volume one- centimeter pathlength quartz
cuvette. The sulfate ion concentration was determined by comparison of the reading
with a standard curve.
2.6.4 Ammonium Ion Measurements. In all of the experiments conducted,
ammonia measurements were carried out as an indication of steady-state conditions and
nitrogen-limitation. Samples were acidified and frozen until analyzed. Ammonium ion

79
measurements were performed using ammonium-gas/ion-specific probe (Fisher Scientific
Inc.) and an Orion Research Model 811 millivoIt/pH microprocessor.
The sample pH was increased to >. 11.0 by diluting with ionic strength adjuster
(ISA, Orion Research Products Inc.) to convert all ammonium ions to dissolved NH3.
The ionic strength adjuster was added until the sample remained blue in color
(colorimetric indication of required pH) and the measurement was completed. The
ammonium ion concentration was determined by conversion of the millivolt potential
reading with a standard curve.
2.6.5 Dissolved Organic Carbon Analyses. Total dissolved organic carbon was
considered a surrogate parameter for glucose concentration. Samples were periodically
removed and frozen until analyzed. DOC was measured using a Dohrmann carbon
analyzer, Model DC-80. This system measures the C02 produced via the UV-catalyzed
(chemical) mineralization of organic carbon. Samples were filtered through a 0.22 um
polycarbonate membrane filter (Poretics Corporation) and diluted to lower DOC
concentration into the most sensitive range of the analyzer. The samples were acidified
to pH 2.5 or below by adding 3 drops of concentrated phosphoric acid (American
Scientific Products Inc.,). COj was then stripped from solution using a stream of
nitrogen gas. The organic carbon present in the sample was oxidized to C02 and sparged
to a non-dispersive infrared detector. Calibration was accomplished using an
acidified/sparged potassium phthalate solution (Fisher Scientific Inc.,) preparation of
known concentration.

80
2.7 Immunofluorescence: Fluorochrome Antibody Conjugates.
2.7.1 General. This technique enables the determination of cell densities of a
specific organism present in a mixed culture. The antibody procedure was employed to
determine the populations of T. thioaxidans when a mixed seed from the sewer
environment was used to provide heterotrophic competitors.
Fluorochrome-antibody conjugates are prepared using affinity-isolated antibodies
or IgG fractions of antisera from human or animal immunoglobulins and are specific to
the organism against which they are prepared. Antibodies are conjugated to fluorescein
isothiocynate (FITC) and are tested for reactivity and performance by single radial
immunodiffusion (Becker, 1969), Immunoelectrophoresis, and immunofluorescent assays.
2.7.2 Fluorescent Antibody Procedure. Bacterial samples tested via the
fluorescent antibody procedure (FA) were vigorously shaken to dislodge T. thioaxidans
that colonized the sulfur particles. After sulfur was allowed to settle, floating particles
of sulfur were carefully removed with a pasteur pipet The remaining liquid was removed
without disturbing the sulfur at the bottom and centrifuged (Eppendorf centrifuge 5415)
at 12000 rpm or 11750 RCF for 10 minutes. The supernatant was discarded and the
pellet resuspended in phosphate buffered saline solution. Washing and centrifugation
were repeated at least two times. The composition of the phosphate buffered saline
(PBS) was, in grams per liter: NaCl, 8.0; KC1, 0.2; Na2HPO«, 1.15; KH2PO<, 0.2.
20-ul of the washed sample was heat fixed on a multi-well slide, and 20-ul of
antibody #1 (Sigma Chemical Company) was spotted on the slide containing the sample,
humidified (to prevent drying), and incubated for 20 minutes. Following gentle washing

81
with PBS and air drying, 20 ul of antibody #2 (Sigma Chemical Company) was applied
and incubated in the dark for 20 minutes. Finally, the slide was washed again with a
stream of PBS and air dried.
The cover slip was mounted with the FA mounting fluid (Olympus Inc.) by
applying a small amount (10 ul). Fluorescence microscopy was conducted using an
Olympus BH-2 microscope equipped with an oil immersion objective giving a
magnification of lOOOx. Thiobacillus thiooxidans will fluoresce green following antibody
attachment. Enumeration was done by counting the number of bright green bacteria in
at least 35 fields. The total number of cells per milliliter of sample was calculated by
multiplying the mean number of cells per field by 8.5 x 10\

82
CHAPTER 3
RESULTS
3.1 Isolation of Heterotrophic Competitors.
3.1.1 Field Observations: Crown pH and Corrosion. Crown pH and the degree
of corrosion were noted in sewers at the Roger Road Treatment Plant premises during
the March 1990 sampling trip. The crown surfaces with lower pH exhibited a much
greater degree of concrete degradation. The crown of the manhole at the syphon outfall
was highly corroded; pH was 0.8 to 1.0. Large concrete aggregate and reinforcing steel
of the RCP were visible. On the other hand, the manhole south of the golf course was
moderately corroded, pH was 4.8 to 5.0, and adjacent pipe sections were lightly
deteriorated. Interestingly, the cast iron cover of the syphon outfall manhole was
completely corroded to about 1/10 th of its original thickness due to the corrosive action
of sulfuric acid.
3.1.2 Growth of Sewer Crown Samples in the Laboratory. Growth of
heterotrophic organisms (sewer crown samples from the Roger Road Treatment Plant)
in the initial enrichment media (Table 2-3) and the first-transfer media (Table 2-3) was
observed in the first few days following inoculation. The pH of enrichment media was
stable, suggesting that thiobacilli were not active in those cultures.

83
Samples from the first-transfer cultures were diluted and cultivated on solid media
(solidified with 1.5% Bacto agar). Both the low- and mid-pH first-transfer plates
supported growth of a variety of organisms. Colonies were visually analyzed, noting
color, and extent of growth of over time. When faster-growing bacterial colonies were
transferred from plates back to the original liquid (selective) media, growth of
heterotrophs increased reasonably. The colonies selected for such transfers appeared to
be axenic. Transfer steps used for isolation of original samples were duplicated (Figure
2-1).
Colony size, direct visual appearance, and morphology of cells led to the
preliminaiy classification of the isolate (competitor) as yeast. Colonies that showed
identical characteristics believed to be yeast, were selected for subsequent isolation and
experimentation. Light microscopy, colony size, color, appearance, and morphology of
pure cultures that grew at both low and mid-pH were found to be identical in all
respects. The isolated organism was capable of balanced growth at reasonable rates (1
to 2 hours) in defined media between the pH range of 3 to 8 units (Figure 3-5).
Semitransparent, pale yellow colonies were observed on solid media within about 12
hours after inoculation and turned orange-pink after about 3 to 5 days. The orange-pink
pigment appeard in liquid media after the same period of time.
Originally, I was looking for an acidophilic and mid-pH heterotroph that could
grow in a defined media. However, isolation experiments yielded a heterotrophic yeast
capable of growing at both low- and mid-pH ranges in a defined meidia. Because
84
prototrophs could not be isolated from the crown environment, yeast was the only
heterotrophic competitor compatible in my experiments.
3.2 Critical N/C and N/S Ratios for Nutrient Utilization in Batch Cultures.
3.2.1 General. Three organisms were utilized in batch stoichiometric studies-the
yeast isolate collected from the sewer crown, E. coli (ATCC #15597), and T.
neapolitanus (ATCC #23638). Comparitive rates of utilization were established for (i)
ammonia and glucose (yeast or E. coli) and (ii) ammonia and thiosulfate (T.
neapolitanus). This kind of study could not be performed on T. thiooxidans since the
disappearance of elemental sulfur, supplied in excess in all cases, could not be quantified,
and carbon was assimilated as C02 in an open system.
The objective of these experiments was to establish generation times for
exponential growth and critical ammonia-glucose or ammonia-thiosulfate concentration
ratios. This led to the selection of hydraulic detention time for the continuous-flow
reactors and relative (critical) influent nutrient concentrations for the competition
experiments. During the determination of these critical ratios, the batch cultures were
inoculated with microorganisms in a log-phase state of growth.
3.2.2 Ammonia and Glucose Utilization Rates. Batch growth of the yeast isolate
and E. coli was measured spectrophotometrically into stationaiy-phase. Figures 3-1 and
3-3 represent growth as function of initial nitrogen concentration for E. coli and yeast,
respectively. The stoichiometry of nitrogen-to-glucose utilization was similar for yeast

85
at both low (2 to 4, data not included) and mid-pH (6 to 8, data not included).
Nitrogen/glucose uptake experiments for E. coli were conducted only at mid-pH.
At initial NH3 concentrations below ImM. cell numbers at stationary-phase were
proportional to the amount of nitrogen initially present. A doubling of the initial
nitrogen concentration resulted in a doubling of cell numbers at low concentrations of
ammonia. At higher concentrations, this proportionality detriorated. A five-fold increase
in initial nitrogen from 1 x 10"3 M to 5 x 10'3 M produced only 50% more cells. Below
ImM. cell populations were limited by the available nitrogen. As nitrogen levels were
increased above ImM. some other factor (presumably glucose) limited growth. The
transition point from nitrogen to carbon limitation is not abrupt but appears to occur.
This transition from nitrogen to glucose limitation occurred at about 8.0 x 10"4 M of
nitrogen (ammonia form) for yeast and about 2 x 10"3 M for E. coli.
The nitrogen-to-glucose ratio at which transition occurred, is the "critical" N/C
ratio (moles N/moles C). As illustrated in Figure 3-2 and 3-4, the critical N/C ratio for
both E.coli and yeast was at about 1:2 (moles N/moles C). Modest growth was seen in
the control (no nitrogen). This may be attributable to the presence of background
nitrogen in the inoculum and/or chemical impurities in the media constituents. Modest
growth in controls support the fact that cells store some extra nitrogen (ammonia) in
excess of their metabolic needs.
3.23 Ammonia and Thiosulfate Utilization Rates. Growth of T. neapolitanus
as a function of initial ammonia concentrations is summarized in Figure 3-5. From these
growth curves, the relationship between initial nitrogen concentration and cell numbers

86
1.00
I E S* 0.10
c o o (O •*-> CO <D a c ca n. o (0 A <
i i 10 12
i 14 16
Time (Hrs.)
NH4 = 5.0 E-03 -0- NH4 = 7.5 E-04
—I— NH4 = 2.25 E-03 NH4 = 1.0 E-03 -¥r- NH4 = 5.0 E-04 NH4 = 1.0 E-05
Figure 3-1. Growth of E. coli on glucose in pure, batch cultures. Cell densities at stationary phase was a function of the initial nitrogen concentration when total ammonia added was < 2.0 x 10'3 M. At higher nitrogen concentrations, growth proved to be glucose-limited.

87
0.35
Estimated Point of Nitrogen Limitation = 3.0 E-03M
Initial Glucose Concentration = 1 ?5 E-03M ^ 0.3-
£ O CD a £ a t a e o to " 0.15-n • o e a JO 0.1-
0.05-
Estlmated N/C Critical Ratio for E.coll at pH 6X0 «» 1
1E-03 3E-03 Initial Ammonia Concentration (M)
2E-03 Initial Ammonia Concentration
4E-03 5E-03
Figure 3-2. Relationship between culture optical density at stationary phase and initial nitrogen concentrations in pure, batch culture of E. coli.

88
i— i E o
0.1-
o o CO <
<0 0) o c CO £2 u. 0.01-o (0 A <
0.001 15 20 0 10 25 5
Time after Inoculation (Hrs.)
*- 7.0 E-03 M —I— 3.5 E-03 M —3K— 8.0 E-04 M
a- 3.0 E-04 M -K- 5.0 E-05 M -±- 0 M
Figure 3-3. Growth of acidophilic yeast on glucose in pure, batch cultures. Cell density at stationary phase was a function of the initial nitrogen concentration when total ammonia added was < 5.0 x 10"4 M. At higher nitrogen concentrations, growth proved to be glucose-limited.

0.7
E o ® as m JE a. £« a c 0 1 55 S u a •g 02-o a •D <
0.5-
0.4-
0.3-
0.1
Region of / Nitrogen Limitation/ Region of -——" Nitrogen Limitation/
Glucose UmttgltofP
-P
Initial Glucose Concentration & 2.25 E-03M
11 N/C Critical Ratio for Yeast Isolate = 1:2 (Moles N/Moles C)
1 For Both Low-pH (3.75) and Mld-pH (6.80)
2 3 4 5 Initial Ammonia Concentration (mM)
Figure 3-4. Relationship between culture optical density at stationary phase and initial nitrogen concentrations in pure, batch culture of acidophilic yeast.

90
1E+09q
i tm a 0) m a s. a & CO c 0 1 55 % 1 = ai O
1E+08:
1E+07:
1E+06
Ammonla-to-Thlosulfate Utilization Rates for
T. neapolitanus Stationary Phase of Growth
Log Phase 77/
i, S —I 1
Lag Phase
— —
50 100 150 Time (Hrs.)
200 250 300
NH4 = 0M NH4 = 1E-05M NH4 = 5E-05M
NH4 = 3.0E-04 M -X- NH4 = 8.0E-04 M ~±r NH4 = 3.5E-03M
Figure 3-5. Growth of T. neapolitanus on thiosulfate in pure, batch cultures. Cell number at stationary phase was a function of the initial nitrogen concentration when total ammonia added was < 3.0 x 10"4 M. At higher nitrogen concentrations, growth proved to be thiosulfate-limited.

91
in stationary- phase was determined (Figure 3-6). When initial ammmonia levels were
less than 3 x 10^ M, T. neapolitanus numbers at stationary-phase were directly
proportional to the amount of nitrogen provided. At higher nitrogen concentrations, cell
growth was thiosulfate-limited. At approximately 3 x 10"4 M of ammonia, the cells appear
to be thiosulfate-limited. This point was estimated as the transition from nitrogen to
thiosulfate limitation. The molar ratio of nitrogen-to-thiosulfate at which nitrogen
limitation occurred was about N/S = 1:1.5 (moles N/moles S). Figure 3-6 shows the
approximate transition in nitrogen-limitation to thiosulfate-Iimitation. Time-dependent
pH measurements are also summarized in Figure 3-7. The cultures with highest initial
nitrogen concentrations reached the lowest final pH. Results indicated that the cultures
were not pH-limited during the experiment (Figure 3-7).
3.2.4 Effect of Initial pH on Growth of Yeast Experiments were run that
depicted the growth of the yeast isolate in pure, batch cultures as a function of pH, when
all the nutrients required for bacterial growth were provided in excess (data not
included). In this experiment, the initial pH was varied from 2.00 to 4.25 at intervals of
0.25 pH units. At initial pHs of 2.00 and 2.25, growth was retarded in rate and extent.
In all these cultures, growth was generally apparent after a lag period of 24 hours.
Specific growth rates were essentially the same in cultures grown at initial pHs from 3.00
to 4.25 and reached an absorbance maximum of about 0.200 cm'1. Similar tests were
performed under mid-pH conditions. Specific growth rates were essentially identical
throughout the pH range of 3 to 8 units (data not shown).

92
1E+08-
S 8E+07 Si
CO c 0> E! 6E+07 5 D ol B L e? ca e o S
4E+07-
2E+07-
0E+00
Point of Nitrogen Limitation = 3.0 E-04 M
Initial Thlosulfate Concentration = 5.0E-04 M
Point of Ammonia Limitation
Estlr lated Critical N/S Ratio = 1:1.5
0E+00 1E44 2 E-04 3Ek>4 4E-04 5E-04 6E-04 Initial Ammonia Concentration (M)
7E-04 8 E-04
Figure 3-6. Relationship between culture cell density at stationary phase and initial nitrogen concentrations in pure, batch cultures of T. neapolitanus.

93
6.5-
3 3 u 5.5-
4.5 100 150
Time (Hrs.) 250 300 50 200
-m- NH4
-B- NH4
= 0 —
= 3.0E-04 -5 t— NH4
X- NH4
= 1.0E-05
= 8.0E-04 -»t€- NH4
NH4
= 5.0E-05
= 3.5E-03
Figure 3-7. Acid production as measured by pH decrease in medium containing pure cultures of T. neapolitanus using thiosulfate as substrate.
94
33 Titration Curves.
Figures 3-8 and 3-9 represent the titration of low- and mid-pH medium shown
in Tables 2-7 and 2-8. Titration curves provided an indication of media buffer capacity
over a wide range of pH values. The data were later used to estimate quantities of
biogenic acid produced by the thiobacilli (by back titrating the growth medium to its
original pH).
3.4 Competition Studies.
3.4.1 General. It was hypothesized that acid production by T. thiooxidans and T.
neapolitanus could be mitigated by encouraging conditions favorable to heterotrophic
competitors. Two-organism, continuous-flow experiments were conducted at low- and
mid-pH in sulfate-firee basal salts media. Variations in the general procedure included
alteration of (i) the influent ammonia/glucose ratio to include experiments above and
below the critical N/C ratio as determined above, (ii) the pH balance of the system, and
(iii) the identity of the heterotrophic competitor. A summary of experimental conditions
investigated is provided in Table 2-10. Elemental sulfur and thiosulfate were used as
substrates for T. thiooxidans (low-pH experiments) and T. neapolitanus (mid-pH
experiments), respectively. Yeast and E. coli were grown on glucose. Atmospheric C02
served as a carbon source for thiobacilli.
3.4.2 Low-pII Competition Experiments.
3.4.2.1 Variations in influent ammonia/glucose. The feed concentration
of nitrogen was varied in a series of experiments to study the effect of the N/C ratio on
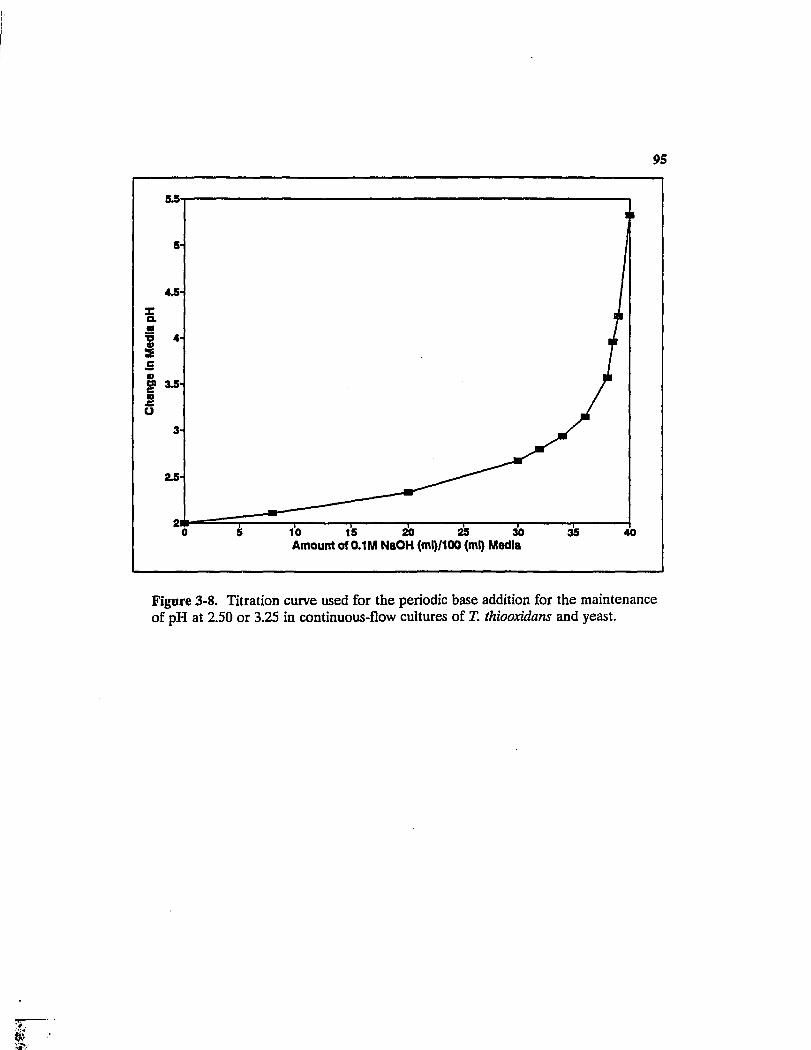
95
Amount of 0.1M NaOH (ml)/100 (ml) Media
Figure 3-8. Titration curve used for the periodic base addition for the maintenance of pH at 2.50 or 3.25 in continuous-flow cultures of T. thiooxidans and yeast.

96
10 Amount of 0.5M NaOH (ml)/100 (ml) Media
Figure 3-9. Titration curve used for the periodic base addition for the maintenance of pH at 6.80 in continuous-flow culture of T. neapolitanus, yeast, and E. coli.

the outcome of the competition between yeast and T. thioaxidans. Results of low-pH
(T. thioaxidans and yeast cells) continuous-flow experiments run at feed concentrations
of ammonia and glucose that were above and below the critical N/C ratio are summarized
in Figures 3-10 through 3-18. Three experiments were run at feed ratios below the
critical N/C ratio, and only one experiment was conducted under what was projected to
be carbon-limited conditions. Experiments were run at feed N/C ratios of 0.045, 0.223,
1.556, and 4.445. All experiments were conducted at pH 3.25.
Results of experiments at (N/C)0 = 0.223 and 1.556 are summarized in Figures
3-10 through 3-13. The experiments conducted at (N/C)0 = 0.045 and 4.445 are
summarized in Figures 3-14 through 3-18. Comparison of the T. thioaxidans growth
curves prior to yeast and glucose addition (Figure 3-10 and 3-14) indicates that, at low
influent nitrogen levels, growth was infact nitrogen-limited. Cell numbers, effluent
sulfate concentrations, effluent ammonia concentrations, and rate of base addition
indicated that cultures of T. thioaxidans reached steady-state after about 240 hours.
Following the addition of yeast and glucose, steady numbers of yeast were a function of
the influent nitrogen concentration. Results are summarized in Table 3.1. It is apparent
that the growth was nitrogen-limited at the low N/C ratios. After this point, numbers of
thiobacilli decreased dramatically, from 2.8 x 10⁷ to 7.21 x 10s, 8.5 x 10⁷ to 4.57 x 10s, and
1.4 x 10⁸ to 8 x 10⁷, respectively, at all the three N/C critical ratios, but remained present
in low numbers.
Yeast and T. thioaxidans coexisted at high numbers at high N/C. At high N/C,
glucose depletion prevented the faster growing yeast from assimilating all the available

98
1E+09q
E
0) Si 1E+08; e 0 1 3 CL O a "3 a = 1E+07; o a a o
1E+06-
fit*
N/C Ratio = 1.556:1 f
/ ""—* fi
y N/C Ratio = 0.223:1 ^ k 11
Yeast Inlectlon at \B£NW- X
I T. thlooxldansvs. veast
pH = 3.25
... . Washout Steady State
50 100 150 200 Time (Hrs.)
250 300
1E+08
E * ai O e o
1E+07 1 a. o a ai O ts a a> >•
350 1E+06
NH4=5.0E-04M (T) -B- NH4=3.5E-03M (T) -Ar NH4=5.0E-04M (Y) NH4=3.5E-03M (Y)
Figure 3-10. Cell number versus time. Numbers of yeast and T. thiooxidans in continuous-flow reactors during competition experiments. The addition of yeast and glucose lowered the steady concentrations of T. thiooxidans. When growth was nitrogen-limited, effect on the population of T. thiooxidans were much more pronounced.

99
700-
600- N/C Ratio = 1.556:1 -I ra E
500-
N/C Ratio = 0223:1 I 400-o e o 0 0) 1
300-
3 to € 200-a> 3
£ 100-
Wash out Yoast Injection at
T. thlooxldano/6. yeast
pH = 3.25 Steady State
100 250 300 50 150 200 350 Time (Hrs.)
-m- NH4=5.0E-04M -S- NH4=3.5E-03M
Figure 3-11. Effluent sulfate concentration as a function of time and cultures conditions in continuous-flow cultures of T. thiooxidans and yeast plus T, thiooxidans. Notice that the addition of yeast and glucose greatly diminished the production of sulfate and presumably the activity of T. thiooxidans.
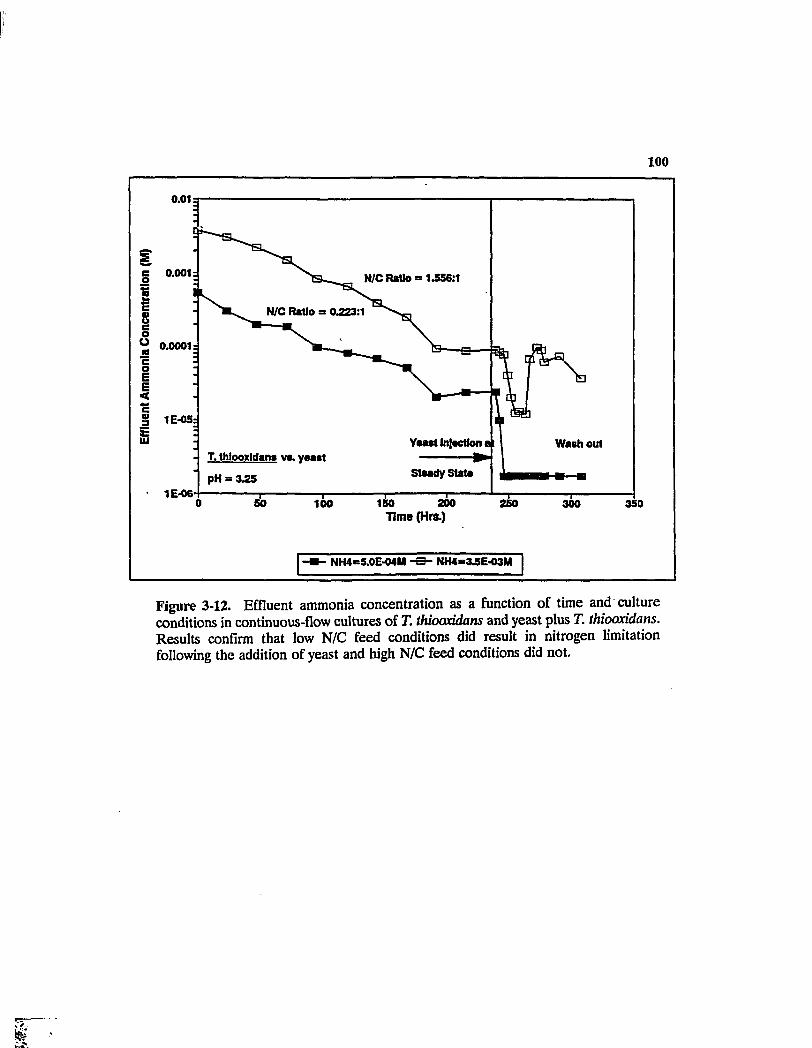
100
0.01 q
0.001: N/C Ratio = 1.556:1
E e> u e o " 0.0001 w
N/C Ratio a 0.223:1
c 0 E E < e 01 3 1E-05:
Ysast Injection a t Washout - T. thlooxldans vs. yeast
pH = 3£5
1E-06 300 50 150 2c
Time (Hrs.) 250 100 350
-m- NH4<=5.0E-04M S- NH4»&5E-03M
Figure 3-12. Effluent ammonia concentration as a function of time and culture conditions in continuous-flow cultures of T. thuxxddans and yeast plus T. thiooocidans. Results confirm that low N/C feed conditions did result in nitrogen limitation following the addition of yeast and high N/C feed conditions did not.

101
TJ at •a •a < X O co Z
co "S S 3 O E <
2.5
2-
1.5-
1-
0.5-
T. lhlooxldans vs. yeast
pH = 3.25
Steady State
N/C Ratio = 1.556:1
Steady State
N/C Ratio = 0.223:1
Yeast Injection at
Steady State
jfll.ii.fl. •illVrl,
Wash out
•, •, M. 1 I I I I • I I T » I J I I » ' I I I I I I I I ' I 0 48 96 144 192 240 246.5 252.5 258.5 267 276.5 291
Time (Hrs.)
I 1 NH4=5.0E-04M Hi NH4=3.5E-03M
Figure 3-13. Periodic base addition for the maintenance of pH at 3.25 in continuous-flow cultures of T. thiooxidans and yeast. Notice that the rate of acid production was adversely affected by the addition of glucose and yeast at about 250 hours. In the low N/C culture (low-nitrogen feed or culture that was expected to be nitrogen-limited), acid production was almost completely interrupted by the shift in feed conditions.
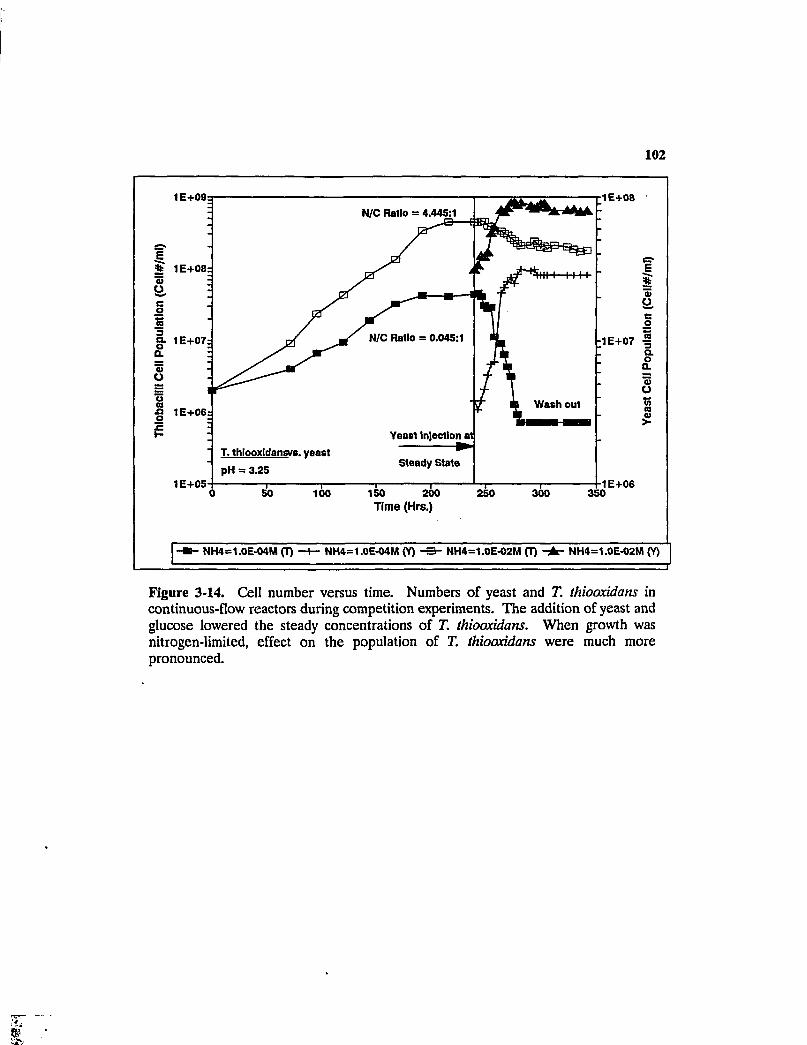
102
1E+08 N/C Ratio = 4.445:1
* 1E+08:
N/C Ratio = 0.045:1 S- 1E+07: -1E+07 •§ I Q.
Wash out •5 1E+06:
Yeast ln]ectlon at
T. thlooxldana/8. yeast
pH = 3.25 Steady State
1E+05 1E+06 50 100 150
Time (Hrs.) 200 250 300 350
-m- NH4=1.0E-04M (T) —4— NH4=1.0E-04M (Y) -B- NH4=1.0E-02M (T) -jk- NH4=1.0E-02M (Y)
Figure 3-14. Cell number versus time. Numbers of yeast and T. thiooxidans in continuous-flow reactors during competition experiments. The addition of yeast and glucose lowered the steady concentrations of T. thiooxidans. When growth was nitrogen-limited, effect on the population of T. thiooxidans were much more pronounced.

103
900-
T. thloo)ddan«V8. yeaat
pH = 3.25 800-
_f N/C Ratio = 4.445:1 ra 700-
2 600-
S 500-
400-
N/C Ratio = 0.045:1
200-
Wash out 100-
Steady State
50 100 150 200 250 300 350 Time (Hra.)
HB- NH4=1.0E-04M -S- NH4=1.0E-02M
Figure 3-15. Effluent sulfate concentration as a function of time and cultures conditions in continuous-flow cultures of T. thiooxidans and yeast plus T. thiooxidans. Notice that the addition of yeast and glucose greatly diminished the production of sulfate and presumably the activity of T. thiooxidans.

104
1E-04I
Yeast Injection a t
T. thiooxidans v«. yeast Steady State
Time (Hrs.)
-rn- NH4=1.0E-04M -e- NH4=1.0E-02M
Figure 3-16. Effluent ammonia concentration as a function of time and culture conditions in continuous-flow cultures of T. thiooxidans and yeast plus T. thiooxidans. Results confirm that low N/C feed conditions did result in nitrogen limitation following the addition of yeast and high N/C feed conditions did not.

105
"S 160- Yeast Injectloi
at Steady C 140-2 14(h State CO
S 120-
N/C Ratio = 4.445:1
Glucose Sufficient
N/C Ratio = 0.045:1 Glucose Deficient Wash o
h- • • • -P a n—a
T. thiooxidans vs. yea6t
°0 20 40 60 80 100 120 Time (Hrs.)
-m- NH4=1.0E-04M -H- NH4=1.0E-02M
Figure 3-17. Effluent glucose concentration versus time and culture conditions in continuous-flow competition experiments involving yeast and T. thiooxidans. Results confirm that growth was glucose-limited in the high-N/C, but not the low-N/C experiments.

106
2.5-
1 21 •D <
1.5-O m 2 S o o o c 1-3 O E <
0.5-
Steady State
N/C Ratio = 4.445:1
Steady State N/C Ratio = 0.045:1
/ Yeast Injection at
Steady State
T. thlooxldans vs. yeast
pH = 3.25
Wash out
• i J J l l l m l . I I I I » I 1 l l l l l l l l l l l I I I I I I I I I I I I t I I
0 168 246 264 279 300 330 Time (Hrs.)
I 1 NH4=1.0E-04 M Hi NH4=1.0E-02 M
Figure 3-18. Periodic base addition for the maintenance of pH at 3.25 in continuous-flow cultures of T. thiooxidans and yeast. Notice that the rate of acid production was adversely affected by the addition of glucose and yeast at about 250 hours. In the low N/C culture (low-nitrogen feed or culture that was expected to be nitrogen-limited), acid production was almost completely interrupted by the shift in feed conditions.

107
nitrogen. Steady-state residual ammonia levels at an influent N/C = 4.445 are 10 to 400
times higher than those of other (low N/C critical ratio) experiments. Nonetheless, yeast
injection produced some degree of competition between yeast and T. thiooxidans.
Ammonia concentrations dropped 87% across the reactor. Thiobacilli grew more slowly,
causing their numbers to decrease 2-fold. This 2x reduction in numbers of T. thiooxidans
suggested that the glucose and/or yeast addition had a modest inhibitory effect on the
thiobacilli. These results were supported by measurements of effluent S04'2
concentration, which dropped almost three-fold in the high N/C feed ratio experiment
and virtually disappeared at all the three low N/C feed concentrations.
It is apparent that in the presence of excess glucose, the faster-growing yeast
outcompeted T. thiooxidans for a growth-limiting supply of ammonia. Nonetheless, the
thiobacilli did not completely wash out of the CSTR. A summary of levels and
percentage decreases in parameters measured before and after the addition of
glucose/competitor is presented in Table 3-1.
3.4.2.2 Variations in Culture pH. Additional competition experiments
involving T. thiooxidans and the yeast isolate were conducted at pH 2.00 and 2.50. Only
two experiments corresponding to different influent ammonium concentrations (above
and below the critical N/C ratio; 1.556 and 4.445) were run at each pH.
Results for these experiments are summarized in Figures 3-19 through 3-23. At
pH 2.50, steady-state was achieved after about 275 hours and the growth of T.
thiooxidans was nitrogen-limited at the low N/C feed ratio. After the addition of yeast
and glucose, yeast grew to moderately high numbers, and T. thiooxidans was again

108
1E+09q
.E j| 1E+08; "5 O e 0 1 §• 1E+07: a « O
o ca J3 o 1E+06:
1E+05
~
N/C Ratio = 4.445:1
/ •
N/C Ratio = 1.556:1
Yeast Injection at
T \
5K Waahout
« 1
" pH = 2.50 Steady State
i i i i i
5K Waahout
« 1 50 100 300 350
1E+08
400 1E+07
Time (Hrs.)
NH4=3JE-03 M(T) NH4=1 E-02 M(T) NH4-=3.5E-03 M(V) NH4=1E-02 M(Y)
Figure 3-19. Cell number versus time. Numbers of yeast and T. thiooxidans in continuous-flow reactors during competition experiments. The addition of yeast and glucose lowered the steady concentrations of T. thiooxidans. When growth was nitrogen-limited, effect on the population of T. thiooxidans were much more pronounced.

109
900'
T. thiooxidans vs. yeast
pH = 2.50 800-
S> 700- N/C Ratio = 4.445:1
2 600-
R 500-
N/C Ratio = 1.556:1 400-
W 300-
200-
Yeast Injection at
100-
Steady State Wash out
50 200 Time (Hrs.)
250 100 150 400 300 350
NH4=3.5E-03 M -B- NH4=1.0E-02 M
Figure 3-20. Effluent sulfate concentration as a function of time and cultures conditions in continuous-flow cultures of T. thiooxidans and yeast plus T. thiooxidans. Notice that the addition of yeast and glucose greatly diminished the production of sulfate and presumably the activity of T. thiooxidans.
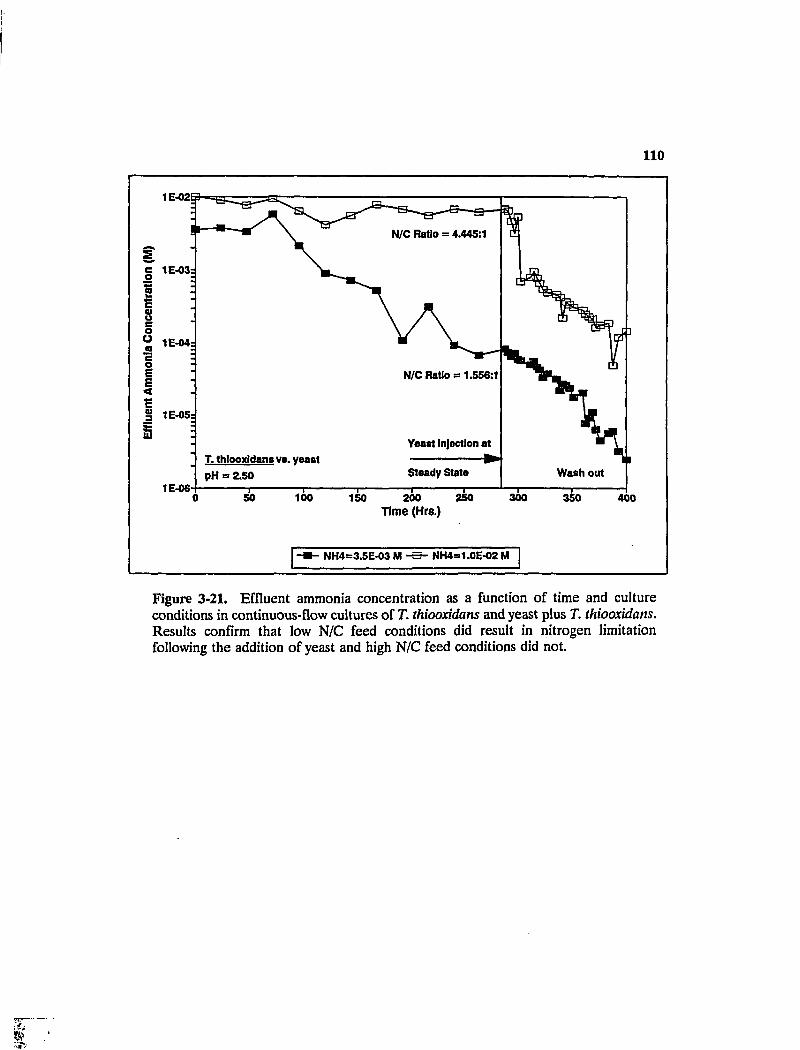
110
1E-02I
N/C Ratio = 4.445:1
c 1E-03:
1E-04:
N/C Ratio = 1.556:1
1E-05:
Yeast Injection at T. thiooxidans v». yeast pH = 2.50 Steady State Wash out
1E-06 100 250 300 150 200
Time (Hrs.) 350 400
NH4=1.0E-02 M NH4=3.5E-03 M
Figure 3-21. Effluent ammonia concentration as a function of time and culture conditions in continuous-flow cultures of T. thiooxidans and yeast plus T. thiooxidans. Results confirm that low N/C feed conditions did result in nitrogen limitation following the addition of yeast and high N/C feed conditions did not.
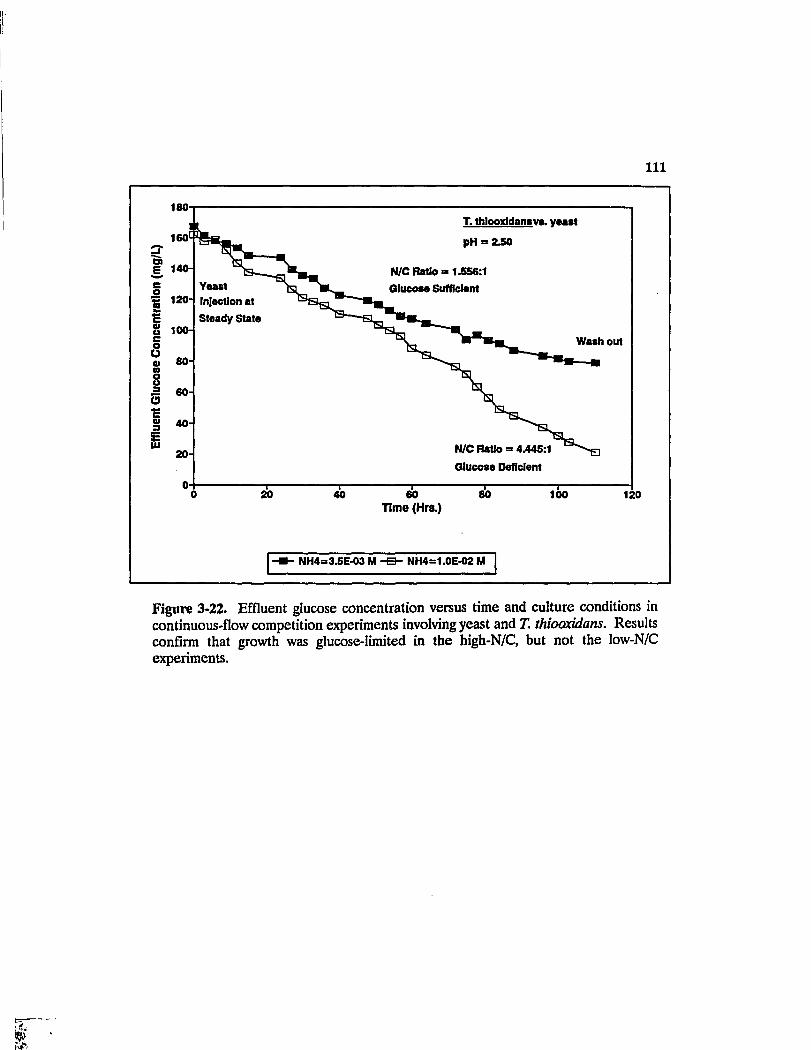
Ill
T. thlooxldnn»v». yeast
pH = 2J50
N/C Ratio = 1.556:1
Glucose Sufficient Yeast Injection at
Steady State
N/C Ratio = 4.445:1
Glucose Deficient
-m- NH4=3.5E-03 M -S- NH4=1.0E-02 M
Figure 3-22. Effluent glucose concentration versus time and culture conditions in continuous-flow competition experiments involving yeast and T. thioaxidans. Results confirm that growth was glucose-limited in the high-N/C, but not the low-N/C experiments.

112
5-i
4.5-
4-
•S 3.5-U •a 1 3h O a Z Z5-2 o ri 2-
•s E 1.5 3 0 1 1
0.5-J
i I I i i I i j I i i I I I I I I V
Steady State T. thlooxldan* vt. yeart
N/C Ratio = 4.445:1 pH = 230
Steady Stale
N/C Ratio = 1356:1
Yoaat Injection at
/ Steady State
a Washout
nl 0 72 144 216 288 297 312 321 336 345 380 369 384 400
Time (Hrs.)
| NH4=3.5E-03 M • NH4=1.0E-02 M
Figure 3-23. Periodic base addition for the maintenance of pH at 2.50 in continuous-flow cultures of T. thiooxidans and yeast. Notice that the rate of acid production was adversely affected by the addition of glucose and yeast at about 275 hours. In the low N/C culture (low-nitrogen feed or culture that was expected to be nitrogen-limited), acid production was almost completely interrupted by the shift in feed conditions.

113
inhibited to some extent. Order-of-magnitude decreases in effluent sulfate concentration
was observed following yeast and/or glucose addition. In general results were about the
same as those obtained in experiments conducted at pH 3.25 at similar N/C influent
concentrations.
The results of the experiments conducted at pH 2.00 are summarized in Figures
3-24 through 3-28. Cell numbers and effluent sulfate concentrations indicate that the
yeast was completely inhibited at pH 2.00. Numbers of T. thiooxidans decreased for a
short period of time, after which cell numbers regained steady-state levels in about 60
hours following the injection of yeast. Growth curves (Figures 3-24) indicate that at low
nitrogen levels, growth was nitrogen-limited; at high nitrogen levels growth of yeast was
glucose-limited and/or failed to grow. These results were complemented by the
reductions in effluent ammonia concentration (Figures 3-26), base addition for the
maintenance of pH (Figures 3-25 and 3-28), and effluent DOC (Figures 3-27). Table 3-1
shows the percentage decrease of parameters measured at steady-state, before, and after
the addition of glucose and yeast.
3.4.2.3 Variations in Competitor Identity. Two sets of experiments were
conducted with a mixed-seed competitor, obtained directly from the sewer crown, at pH
2.00 and 3.25. The nitrogen-to-glucose feed ratio was selected to make the system
glucose sufficient (nitrogen deficient, N/C = 1.556:1) in all experiments. Results (Figures
3-29 through 3-33) are similar to those obtained using the yeast isolate.
At pH = 3.25, the steady numbers of T. thiooxidans prior to the introduction of
glucose were directly related to the influent ammonium concentration, on comparison

114
1E+09q
E 2? "5 2. 1E+08; e 0 1 a a. o a » O = 1E+07; u a xt o
1E+06
- -
T. thlooxidans vs. veast
' pH = 2.oo ra-e-ei
Iff r#*
. N/C Ratio = 4.445:/ /
v/j/ N/C Ratio = 1.556:1
Yeast Injection at -
i r-= • -
Steady State
1 1 1 1 I I 1 SO 100 150 200 250 300 Time (Hrs.)
;1E+08
E jjfc
:1E+07 a! Si c 0 1 3 a o a
1E+06 O
a £
350 400 450 500 1E+05
NH4 = 3.5E-3 M(T) NH4 = 1E-2 M(T) NH4 = 3.5E-3 M(Y) NH4 = 1E-2 M(Y)
Figure 3-24. Cell number versus time. Numbers of yeast and T. thioaxidans in continuous-flow reactors during competition experiments. The addition of yeast and glucose lowered the concentrations of yeast. Notice the temporary effect on the population of T. thioaxidans. Increase in thiobacilli cell densities was seen after about 80 hours following the cross inoculation of yeast.

115
900'
T. thlooxldam va. yeast 800-
pH = 2.00
® 700-N/C Ratio = 4.445:1
600-
€ g 500-c o 0 « 1
400-
W 300-E o> S 200-Ul
N/C Ratio = 1.556:1
Yeast Injection at 100-
Steady State
50 100 150 250 Time (Hrs.)
300 350 400 450 200 500
NH4 = 3.5 E-03 M -B- NH4 = 1.0 E-02 M
Figure 3-25. Effluent sulfate concentration as a function of time and cultures conditions in continuous-flow cultures of T. thiooxidans and yeast plus T. thiooxxdans. Notice that the addition of yeast and glucose temporarily reduced the production of sulfate and presumably the activity of T. thiooxidans.

116
1E-01
N/C Ratio = 4.445:1 1E-02E
c o O m N/C RAtlo = 1.556:1
e i 1E-04: E < E Q) | 1E-05:
Wash out
T. thlooxldans vs. yeast
pH = 2.00 Steady State
1E-06 450 250
Time (Hrs.) 50 100 150 200 300 400 350 500
-m- NH4 = 3.5 E-03 M -B- NH4 = 1.0 E-02 M
Figure 3-26. Effluent ammonia concentration as a function of time and culture conditions in continuous-flow cultures of T. thioaddans and yeast plus T. thiooxidans. Results confirm that low N/C feed conditions did result in nitrogen limitation following the addition of yeast and high N/C feed conditions did not.

117
180-
160-
H/C Ratio = 1.556:1 Yeast Injection
at Steady State
Washout 100-N/C Ratio = 4.445:1
o O at 80-M o u - 60-O E 0) 3 40-
T. thlooxldans vs. yeast
pH = 2.00 20-
60 80 Time (Hrs.)
100 140 160 20 40 120
NH4 = 3.5 E-03 M S- NH4 = 1.0 E-02 M
Figure 3-27. Effluent glucose concentration versus time and culture conditions in continuous-flow competition experiments involving yeast and T. thioaxidans. Results confirm that growth at high-N/C and low-N/C was nitrogen-limited, not glucose-limited.

118
6E+00-
T. thiooxidans vs. yeast Steady State
5E+00-
•a o> S 4E+00-< X o CO Z 3E+00-£ o CO O 2E+00-
3 O B < 1E+00-
pH = 2.00
OE+OO-ji
StMdySUt*
N/C Ratio »1.556:1
N/C Ratio = 4.445:1
0 72 144 216 288 312 336 360 384 408 432 Time (Hrs.)
I 1 NH4 = 3.5 E-03 M B| NH4 = 10 E~°2 M
Figure 3-28. Periodic base addition for the maintenance of pH at 2.00 in continuous-flow cultures of T. thiooxidans and yeast. Notice that the rate of acid production rate in both low N/C and high N/C cultures were temporarily affected by the addition of glucose and yeast at about 300 hours.

119
with previous results (Figures 3-29). According to the effluent ammonia and glucose
data, the cultures grew into nitrogen-limitation at the conclusion of both the experiments
(Figure 3-31). A significant amount of glucose residual remained at all times throughout
the experiment (Figure 3-32). Following the addition of the competitor and glucose,
effluent sulfate and acid generation rate were cut down by about 50% (Figure 3-30 and
3-33). In addition, T. thioaxidans cell density were cut by two orders of magnitude
(Figure 3-29).
At pH = 2.00, temporary reductions in T. thioaxidans cell population and effluent
sulfate concentrations were observed (Figures 3-29 and 3-30). Approximately 50 hours
after the introduction of the mixed culture competitor and glucose these parameters
returned to their pure-culture, steady-state concentrations. The rate of addition of 3.0
M NaOH also increased gradually from 1.5 to 2.5 ml following the increase in T.
thioaxidans cell concentration (Figure 3-33). However, effluent ammonia concentration
showed a decrease, but remained low following the injection of the mixed-seed (Figure
3-31). This suggested that heterotrophic organisms contained in the mixed-seed were
able to establish themselves at some steady, albeit low level. They did not compete
seriously with T. thioaxidans for the limiting nutrient, probably due to extreme pH. From
Figure 3-32, glucose in the effluent remained present throughout the experiment.
Results are summarized in Table 3-1.
3,43 Mid-pH Competition Experiments.
3.4.3.1 Variations in influent ammonia/glucose feed ratio. Thiobacillus
species such as T. neapolitanus, which grow optimally in the neutral pH range, are

120
1E+09q
T. thiooxidans vs. Mixed Seed
pH = 2.001> 3.25
£ 1E+08:
1E+07: N/C Ratio = 1.556:1
Wash out Injection of Mixed Seed
at Steady State
350 400 100 200 250 Time (Hrs.)
300 450 50
HH- pH = 2.00 -e- pH = 3.25
Figure 3-29. Cell number versus time. Number of T. thiooxidans in continuous-flow reactors during competition experiments. Addition of mixed seed lowered the steady concentration of T. thiooxidans at pH = 3.25, but did not at pH = 2.00.

121
600-
T. lhlooxldam vs. Mixed Seed
pH = 2.00 fc 3.25 500-
O)
400-
300- N/C Ratio = 1.556:1
200-
Injectlon of Mixed Wash out
Seed at Steady State
50 100 150 200 Time (Hrs.)
250 300 350 400 450
Figure 3-30. Effluent sulfate concentration as a function of time and cultures conditions in continuous-flow cultures of T. thioaxidans and a mixed seed plus T. thioaxidans. Notice that the addition of the contaminant and glucose temporarily reduced the production of sulfate and presumably the activity of T. thioaxidans at pH = 2.00.

122
c o « w £ 0> o e o O a e o E E < E 0) 3 £
1E-02q
1E-03:
1E-04:
1E-05:
1E-06-
I
N/C Ratio = 1.556:1
T. thiooxldansvs. Mixed Seed Injection of Mixed Seed
" pH = 2.00 & 3.25
1 1
at Steady State
1 1
Ammonia Deficient 1
1 1 50 100 150 200 250
Time (Hrs.) 300 350 400 450
pH = 2.00 -S- pH = 3.25
Figure 3-31. Effluent ammonia concentration as a function of time and culture conditions in continuous-flow cultures of T. thioaxidans and yeast plus T. thiooxidans at pH 2.00 and 3.25. Results confirm that cultures were nitrogen-limited.

123
180-i Injection of Mixed Seed
t Steady State
N/C Ratio = 1.556:1 Wash out
Ammonia Deficient
-a
Ammonia Deficient
20-
T. thiooxidans vs. Mixed Seed
pH = 2.00 & 3.25
—i— 60
—i— 120 20 40 80 100 140
Time (Hrs.)
pH = 2.00 -B- pH = 3.25
Figure 3-32. Effluent glucose concentration versus time and culture conditions in continuous-flow competition experiments involving the mixed seed and T. thiooxidans. Results confirm that growth at pH 2.00 and 3.25 was nitrogen-limited, not glucose-limited.

124
2.5-
T3 0> •o •o < X o a Z
o CO o E 3 O E <
T. thlooxtdanavi. Mixed Seed
pH = 2.00 It 325
N/C Ratio = 1.556:1
2-
1.5-
1-
0.5-
Steady State
n i 1 i ' i i i i 1 i 1 ^ f 1 " i 1 i i 1 i i 1 i 1 i 1 i 0 72 144 216 288 324 348 372 396 435
Time (Hrs.)
I 1 pH = 2.00 BH PH = 3J2S
Figure 3-33. Periodic base addition for the maintenance of pH at 2.00 and 3.25 in continuous-flow cultures of T. thioaxidans and a mixed seed from the sewer. At pH = 3.25 rate of acid production was adversely affected by the cross inoculation of mixed seed, but not at pH = 2.00.
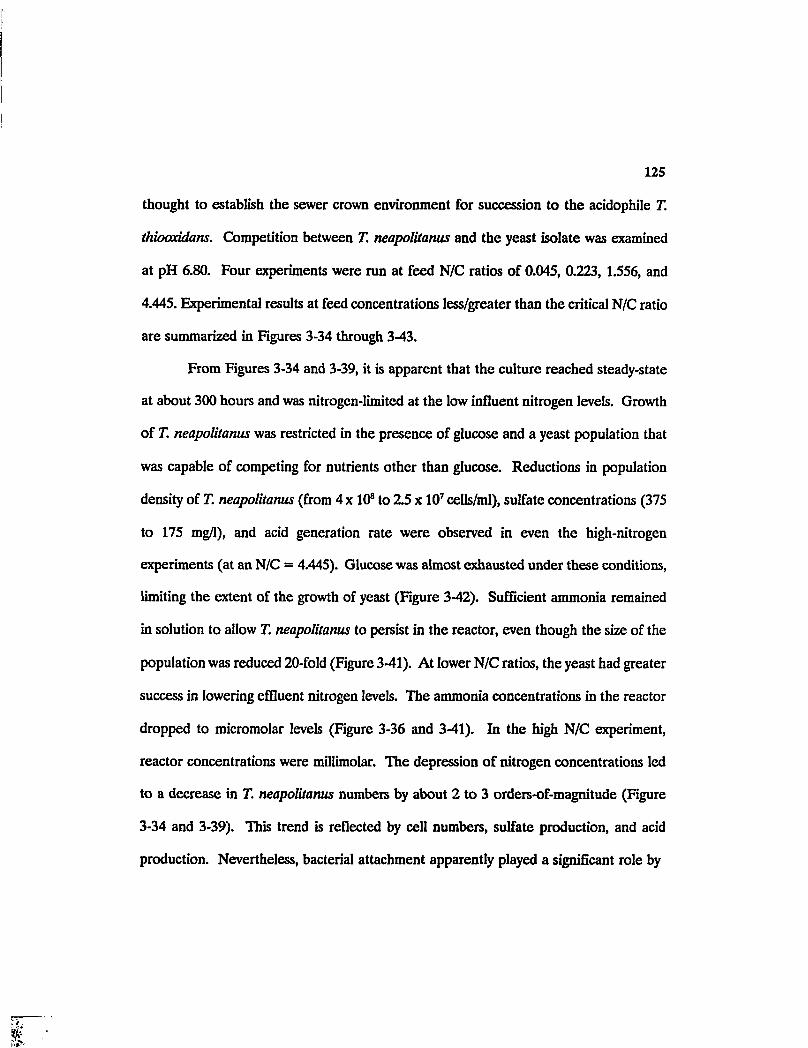
125
thought to establish the sewer crown environment for succession to the acidophile T.
thioaxidans. Competition between T. neapolitanus and the yeast isolate was examined
at pH 6.80. Four experiments were run at feed N/C ratios of 0.045, 0.223, 1.556, and
4.445. Experimental results at feed concentrations less/greater than the critical N/C ratio
are summarized in Figures 3-34 through 3-43.
From Figures 3-34 and 3-39, it is apparent that the culture reached steady-state
at about 300 hours and was nitrogen-limited at the low influent nitrogen levels. Growth
of T. neapolitanus was restricted in the presence of glucose and a yeast population that
was capable of competing for nutrients other than glucose. Reductions in population
density of T. neapolitanus (from 4 x 10⁸ to 2.5 x 10⁷ cells/ml), sulfate concentrations (375
to 175 mg/1), and acid generation rate were observed in even the high-nitrogen
experiments (at an N/C = 4.445). Glucose was almost exhausted under these conditions,
limiting the extent of the growth of yeast (Figure 3-42). Sufficient ammonia remained
in solution to allow T. neapolitanus to persist in the reactor, even though the size of the
population was reduced 20-fold (Figure 3-41). At lower N/C ratios, the yeast had greater
success in lowering effluent nitrogen levels. The ammonia concentrations in the reactor
dropped to micromolar levels (Figure 3-36 and 3-41). In the high N/C experiment,
reactor concentrations were millimolar. The depression of nitrogen concentrations led
to a decrease in T. neapolitanus numbers by about 2 to 3 orders-of-magnitude (Figure
3-34 and 3-39). This trend is reflected by cell numbers, sulfate production, and acid
production. Nevertheless, bacterial attachment apparently played a significant role by

126
1E+09=
N/C Ratio = 1.556:1
1E+08
N/C Ratio = 0.223:1
Q- 1E+07
1E+06 Yeast Injection at
Steady State T. neapolltanusva. yeast
pH = 6.80
cl E+09
E *
1E+08 « O.
a 3 a. o a.
1E+07 o •& C0
Washout
150 200 Time (Hrs.)
250 300 350 400 1E+06
NH4=5 E-04M(T) NH4=5 E-04M(Y) NH4=3.5E-03(T) NH4=3.5E-03(Y)
Figure 3-34. Cell number versus time. Numbers of yeast and T. neapolitanus in continuous-flow reactors during competition experiments. The addition of yeast and glucose lowered the steady concentrations of T. neapolitanus. When growth was nitrogen-limited, effect on the population of T. neapolitanus were much more pronounced.

127
O) & e o « w e V o c o 0
1 3 CO € 0) a
£
250-
200-
50
T. neaDolilanueva. veast
pH = 6.80 ja*0"4
/ N/CRAtlo = 1.556:1
CZi N/C Ratio = 0.223:1
Yeast Injection at
Steady State Wash out
50 100 150 200 Time (Hrs.)
250 300 350 400
NH4=5.0 E-04M NH4=3.5 E-03M
Figure 3-35. Effluent sulfate concentration as a function of time and cultures conditions in continuous-flow cultures of T. neapolitanus and yeast plus T. neapolitanus. Notice that the addition of yeast and glucose greatly diminished the production of sulfate and presumably the activity of T. neapolitanus.

128
1E-02q
N/C Ratio = 1.556:1 e 1E-03:
50 250 100 150 200 Time (Hrs.)
300 350 400
NH4=5.0 E-04M -B- NH4=3.5 E-03M
Figure 3-36. Effluent ammonia concentration as a function of time and culture conditions in continuous-flow cultures of T. neapolitanus and yeast plus T. neapolitanus. Results confirm that low N/C feed conditions did result in nitrogen limitation following the addition of yeast and high N/C feed conditions did not.

129
200
180-
Ol 160-1 ,E e o % E © o c o O 0) CO o o 3
5 E 0) = 40
80-
60-
20-
T. neaoolltanus vs. veast
pH = 6.80
Yeast N/C Ratio = 0223:1
Injection at •
Glucose Sufficient
Steady State a •
Wash out
-S- —Q Glucose Sufficient
-
N/C Artlo = 1.556:1
10 15 20 25 Time (Hrs.)
30 35 40 45
NH4=5 E-04M NH4=3.5 E-03M
Figure 3-37. Effluent glucose concentration versus time and culture conditions in continuous-flow competition experiments involving yeast and T. neapolitanus. Results confirm that growth was glucose-limited in the high-N/C, but not the low-N/C experiments.

130
2.5-1
T. neapolltanusvs. yeast
pH = 6.80
2-
•o a> •a •a < 1* O a Z 5 0 01 1-•s E a o E "* 0.5-I
1 1 1 1 1 1
Steady State
N/C Ratio = 1.556:1
Steady State N/C RAtlo = 0^23:1
Yeast Injection at
Steady State
i i i ri i i i i i i < i "i r liii Wash out
xID l 0 72 120 168 216 264 312 336 342 348 354 364 375
Time (Hrs.)
I 1 NH4=5.0 E-04M HBB NH4=3.5 E-03M
Figure 3-38. Periodic base addition for the maintenance of pH at 6.80 in continuous-flow cultures of T. neapolitanus and yeast. Notice that the rate of acid production was adversely affected by the addition of glucose and yeast at about 325 hours. In the low N/C culture (low-nitrogen feed or culture that was expected to be nitrogen-limited), acid production was almost completely interrupted by the shift in feed conditions.

131
1E+09q
E * 1E+08:
1E+09
T. neapoHtanuo/B. yeast
pH = 6.80
N/C Ratio = 4.445:1 •e—Btw
N/C Ratio = 0.045:1
S- 1E+07 1E+08 •=
•g 1E+06
Yeast Injection
Wash out at Steady State
1E+05 1E+07
Time (Hrs.)
NH4=1.0E-04M (7) -B- NH4=1.0E-02M (T) -Jtt- NH4=1.0E-04M (Y) -A- NH4=1.0E-02M (Y)
Figure 3-39. Cell number versus time. Numbers of yeast and T. neapolitanus in continuous-flow reactors during competition experiments. The addition of yeast and glucose lowered the steady concentrations of T. neapolitanus. When growth was nitrogen-limited, effect on the population of T. neapolitanus were much more pronounced.

132
400-
T. neapolHanuavs. yeast
pH = 6.80 350-
O) E 300-
S 250- N/C Ratio = 4.445:1
200-
Yeast Injection at
Steady State
® 100-
N/C Ratio = 0.045:1 Wash out 50-
250 300 50 150 200 Time (Hrs.)
350 400
NH4=1.0E-04M NH4=1.0E-02M
Figure 3-40. Effluent sulfate concentration as a function of time and cultures conditions in continuous-flow cultures of T. neapolitanus and yeast plus T. neapolitanus. Notice that the addition of yeast and glucose greatly diminished the production of sulfate and presumably the activity of T. neapolitanus.

133
0.13
O) e. e o
0.011
£ 1E-05=
1E-06
N/C Ratio = 4.445:1
0.001:
0.0001 E B
N/c Ratio = 0.045:1
-&B-
T. neapolltanuevB. yeast
pH = 6.80
Yeast ln]ectlon •
at Steady Slate —i— 50
—i— 100
—I— 150 200
Time (Hrs.) 250 300
Wash out
350 400
NH4=1.0E-04M NH4=1.0E-02M
Figure 3-41. Effluent ammonia concentration as a function of time and culture conditions in continuous-flow cultures of T. neapolitanus and yeast plus T. neapolitanus. Results confirm that low N/C feed conditions did result in nitrogen limitation following the addition of yeast and high N/C feed conditions did not.

134
200-
180-
? 160-
N/C Ratio = 0.045:1
Glucose Sufficient Yeast Injection at
Steady State
140-
120-
100-N/C Rtlo = 4.445:1 Glucose Deficient
80-
60-
40- T. naapolltanusvB. yeaet
pH = 6.80 Wash out 20
20 Time (Hrs.)
25 30 35 40
-e- NH4=1.0E-04M -m- NH4=1.0E-02M
Figure 3-42. Effluent glucose concentration versus time and culture conditions in continuous-flow competition experiments involving yeast and T. neapolitanus. Results confirm that growth was glucose-limited in the high-N/C, but not the low-N/C experiments.

135
3.5-
3-e=> E, •g 2.5-•o •D <
T. neaPolHanu»v». yeast
pH = 6.80
O at
2-
i 1.5 oi •s
1-o E <
0.5-
Steady State N/C Ratio = 4.445:1
Steady State
N/C Ratio = 0.045:1
/ Yeast Injection at Steady State
ilnii i ii i ii ii ii i i i i i i i ii i" r i ii i 0 48 96 144 192 240 288 324 339 345 351 360 368
Time (Hrs.)
I 1 NH4=1.0E-04M I— NH4=1.0E-02M
Figure 3-43. Periodic base addition for the maintenance of pH at 6.80 in continuous-flow cultures of T. neapolitanus and yeast. Notice that the rate of acid production was adversely affected by the addition of glucose and yeast at about 325 hours. In the low N/C culture (low-nitrogen feed or culture that was expected to be nitrogen-limited), acid production was almost completely interrupted by the shift in feed conditions.

136
preventing the complete elimination of T. neapoliianus via washout under nitrogen-
limited conditions. Experimental results are summarized in Table 3-1.
3.4.3.2 Variations in Competitor Identity. Experiments involving T.
neapoliianus and E. coli were run at pH 6.80. Only two experiments, corresponding to
different influent ammonium concentrations were run. The N/C feed ratios were
selected above and below the critical N/C ratio for E.coli. Results corresponding to
experiments conducted at 1.556 and 4.445 are summarized in Figures 3-34 through 3-49.
The steady numbers of T. neapoliianus prior to the introduction of glucose and E. coli
were directly related to the influent concentration of ammonia (Figure 3-44). Following
inoculation with E. coli, the high N/C cultures grew into glucose limitation, and low N/C
cultures were nitrogen-limited (Figures 3-46). A. significant glucose residual was
measured at all times at the low ammonium feed rate (Figure 3-48).
As illustrated in Figure 3-44, cell numbers provided direct evidence of the effects
of glucose/E. coli addition. In the high-ammonia-feed-rate experiment, the competition
lowered the numbers of T. neapoliianus by at least an order-of-magnitude. When
nitrogen limitation was established (Figure 3-44), numbers of thiobacilli dropped by more
than three orders-of-magnitude. E. coli grew rapidly by more than two orders-of-
magnitude in each case. Rates of base addition and effluent sulfate concentration are
summarized in Figures 3-49 and 3-45, respectively. In the ammonia-limited culture, rates
of acid generation were almost nil following the establishment of the E. coli population.
Numerical results are again summarized in Table 3-1.

137
1E+09q ; T. neapolHanuBV. E.coll
1E+06
N/C Ratio = 4.445:1
Time (Hre.)
p1E+10
pH = 6.80
o> y. ie+OS 1E+09 a)
N/C Ratio = 1.556:1
1E+08 O = 1E+07
E. coll Inlectlon
>t Steady Stat* •1E+07
NH4 = 3.5E-03 M (T NH4 = 1.0E-02 M (T —NH4 = 3.5E-03 M (E NH4 = 1.0E-02 M (E
Figure 3-44. Cell number versus time. Numbers of E. coli and T. neapolitanus in continuous-flow reactors during competition experiments. The addition oiE. coli and glucose lowered the steady concentrations of T. neapolitanus. When growth was nitrogen-limited, effect on the population of T. neapolitanus were much more pronounced.

138
40fr
350-
ra E, B O 2 250-
0> o e o 0 a» 1 3 w E a> 3 £
300-
200-
150-
100-
50-
T. neanolftanus v». E. coll
pH = 6.80 N/C Ratio = 4.445:1
J* N/C Ratio = 1.556:1
•Jr Ecoll Injection S<C~// •
at Steady State Washout
50 100 150 200 250 300 Time (Hrs.)
350 400 450 500
NH4 = 3.5 E-03 M NH4 = 1.0 E-02 M
Figure 3-45. Effluent sulfate concentration as a function of time and cultures conditions in continuous-flow cultures of T. neapolitanus and E. coli plus T. neapolitanus. Notice that the addition of E. coli and glucose greatly diminished the production of sulfate and presumably the activity of T. neapolitanus.

139
•e—a—• -€Lj
N/C Ratio = 4.445:1
Glucose I Deficient
E. coll Injection at Ammonia Deficient
T. neapolHanueva. E coll
pH = 6.8 Steady State
-m- NH4 = 3.5 E-03 M -B- NH4 = 1.0 E-02 M
Figure 3-46. Effluent ammonia concentration as a function of time and culture conditions in continuous-flow cultures of T. neapolitanus and E. coli plus T. neapolitanus. Results confirm that low N/C feed conditions did result in nitrogen limitation following the addition of E. coli and high N/C feed conditions did not.

140
180-
160 ̂
i
e o S
140-
120-
E. coll
Injection at Steady
State ̂
N/C Ratio = 1.556:1
« 01 o e o A • 00
100-
80-
\ \. QIUCOM Sufficient
\ "" *——m
o 3 O 60- N/C Ratio =» 4.445:1
E 0> 3
§
40-
20-
0-
T. neaDolttanu«v«. E.coll
pH = 6.80
Glucose Deficient
\. Wash out is— a
• i i 0 20 40 60 80 100 120
Time (Hrs.)
NH4 = 3JS E-03 M -EH NH4 = 1.0 E-02 M
Figure 3-47. Effluent glucose concentration versus time and culture conditions in continuous-flow competition experiments involving E. coli and T. neapolitanus. Results confirm that growth was glucose-limited in the high-N/C, but not the low-N/C experiments.

141
3.50-]
3.00-
S 2.50-XI XI <
O 2.00-« z 2 0 1.50-01 •s E 3 O E <
T. naapolltanua v*. E.coll
pH = 6.80
1.00-
0.50-
0.00- i
StMdy State
li Kwty State
weiutio>ijaM
N/C Ratio = 4445:1
Watiiout
i i i i i i i i i i i i i i i i ii II rr i II i i 0 48 96 144 182 240 288 336 386 384 396 414 432 456
Time (Hrs.)
I 1 NH4 ° 3J E-03 M BM NH4 - 1J E-02 M
Figure 3-48. Periodic base addition for the maintenance of pH at 6.80 in continuous-flow cultures of T. neapolitanus and E. coll Notice that the rate of acid production was adversely affected by the addition of glucose and E. coli at about 350 hours. In the low N/C culture (low-nitrogen feed or culture that was expected to be nitrogen-limited), acid production was almost completely interrupted by the shift in feed conditions.
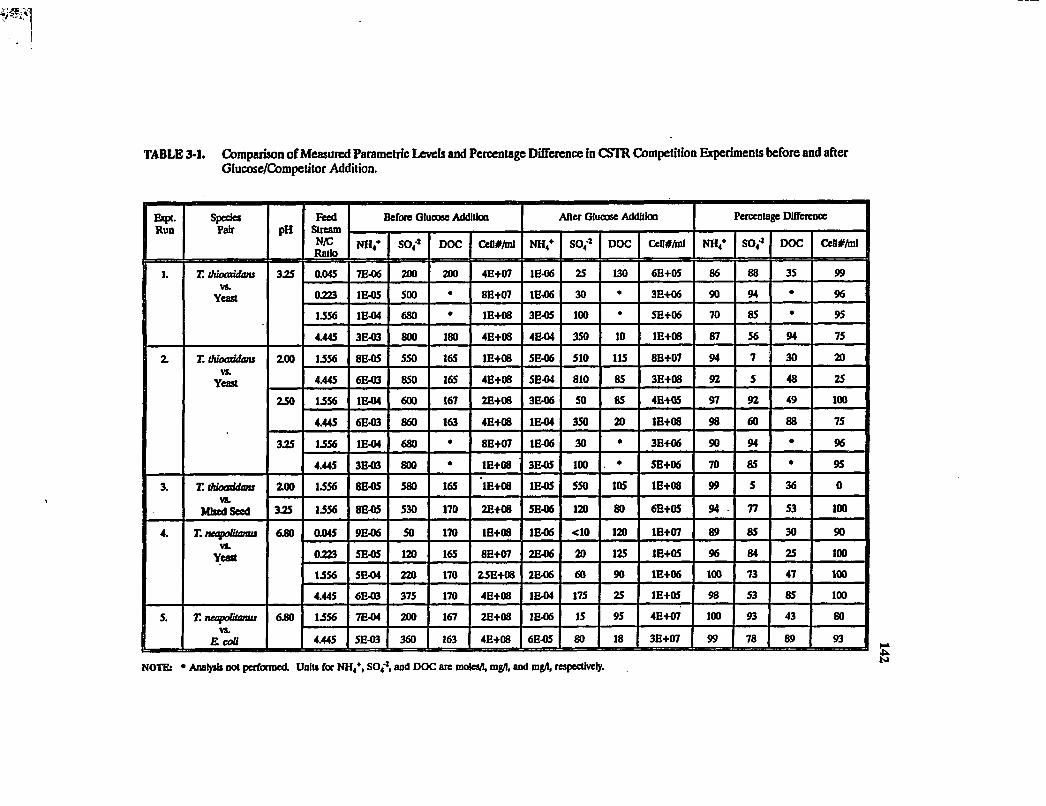
TABLE 3-1. Comparison of Measured Parametric Leveb and Percentage Difference in CSTR Competition Experiments before and after Glucose/Competitor Addition.
Expt. Run
1.
Species Fair PH
Feed Stream N/C Ratio
Before Glucose Addition After Glucose Additkn Percentage Difference Expt. Run
1.
Species Fair PH
Feed Stream N/C Ratio
NH/ so4l DOC Cetl#/ml NH/ SO,"1 DOC CeD#Anl NH/ SO,' DOC Cell#/tal
Expt. Run
1. T. thioeoidans
vs. Yeast
325 0.04S 7E-06 200 200 4E+07 1E-06 25 130 6E+05 86 88 35 99
Expt. Run
1. T. thioeoidans
vs. Yeast
325
0223 1E-Q5 500 • 8E+07 1E«6 30 • 3E+06 90 94 • 96
Expt. Run
1. T. thioeoidans
vs. Yeast
325
1556 1E-04 680 0 1E+08 3E-05 100 0 5E+06 70 85 • 95
Expt. Run
1. T. thioeoidans
vs. Yeast
325
4.445 3E-03 800 180 4E+08 4E-04 350 10 1E+08 87 56 94 75
2. T. thioaddans
vs. Yeast
2.00 1.556 8E-Q5 550 165 1E+08 5E-06 510 115 8B+07 94 7 30 20 2. T. thioaddans
vs. Yeast
2.00
4.445 6E-03 850 165 4E+08 5E-04 810 85 3E+08 92 5 48 25
2. T. thioaddans
vs. Yeast
250 1556 1E-04 600 167 2E+08 3E-06 50 85 4B+05 97 92 49 100
2. T. thioaddans
vs. Yeast
250
4.445 6E-03 860 163 4E+08 1E-04 350 20 1E+08 98 60 88 75
2. T. thioaddans
vs. Yeast
325 1.556 1E-04 680 0 8E+07 1E-06 30 0 3B+06 90 94 • 96
2. T. thioaddans
vs. Yeast
325
4.445 3E-03 800 • 1E+08 3E-05 100 0 5E+06 70 85 • 95
3. 21 thioaddau vs.
Mixed Seed
2.00 1556 8E-05 580 165 1E+08 1E-05 550 105 1E+08 99 5 36 0 3. 21 thioaddau vs.
Mixed Seed 325 1556 8E-05 530 170 2E+08 5E-06 120 80 6E+05 94 77 53 100
4. T. neapoBtaw vs.
Yeast
6JB0 0.045 9E-06 50 170 1E+08 1E-06 <10 120 1B+07 89 85 30 90 4. T. neapoBtaw vs.
Yeast
6JB0
1X223 5E-05 120 165 8E+07 2E-06 20 125 1E+05 96 84 25 100
4. T. neapoBtaw vs.
Yeast
6JB0
1556 5E-04 220 170 25E+08 2E-06 60 90 1E+06 100 73 47 100
4. T. neapoBtaw vs.
Yeast
6JB0
4.445 6E-03 375 170 4E+08 1E-04 175 25 1E+Q5 98 53 85 100
'
T. neapotiltmui vs.
E-coB
6JB0 1556 7E-04 200 167 2E+08 1E-06 15 95 4E+07 100 93 43 80
'
T. neapotiltmui vs.
E-coB
6JB0
4.445 5E-03 360 163 4E+08 6E-05 80 18 3E+07 99 78 89 93
NOTE: • Analysis not performed. Units for NH/, SO/2, and DOC are mo)et/l, mg/1, and mg/U respectively.

143
CHAPTER 4
DISCUSSION
4.1 Sample Collection and Cultivation.
4.1.1 Crown Conditions. The surface pH and extent of corrosion of the sewer
crowns at sample collection locations were inversely related. It is virtually certain that
elevated rates of sulfuric acid consumed the alkalinity at the inner surface of the sewer
pipe. The remaining concrete, with less alkalinity, was consumed at a faster rate in order
to balance the same rate of acid production. This resulted in the conversion of concrete
to gypsum with loss of pipe integrity. Crown pH was lowest near the syphon outfall,
possibly as a result of H2S production in the syphon and/or turbulence at the outfall.
Moderate crown pH for the pipe by the golf course may have been caused by the
periodic submergence and washing of this area by sewage due to diurnal variations of the
sewage flow rate and depth.
The pipe crown was generally dry in the sampling locations. The lack of moisture
and low pH did not appear to mitigate the activity of thiobacilli. Numerous heterotrophs
were also present at the pipe crowns with low pHs, suggesting that they coexist with
thiobacilli in the acidic environments. Heterotrophic enrichments from the pipe crowns
grew well at low pH or mid pH, on solid or in liquid media.

144
The manhole by the syphon outfall showed heavy corrosion, and pH of the crown
was less than 1.0. The concrete securing the steel of the RCP and the manhole lid were
deteriorated, presumably via Thiobacillus-mduced corrosion. The pipelines by the golf
course appeared to be intact although they might have been exposed to HjS for a
considerable amount of time. This manhole (by the golf course) showed very little
corrosion; sewer crown pH was about 5.0. Great differences in corrosion rates might be
attributable to variations in pipe material, sewage age, velocity of flow, and chemical
constituents of the wastewater.
4.1.2 Enrichment and Isolation from Crown Samples. Initial heterotrophic
enrichment media used for the sample isolates produced dense, mixed cultures.
However, the first-transfer enrichments produced considerably fewer mixed growth. That
is, the number of slower-growing heterotrophs decreased. Nevertheless, all of the first-
transfer cultures showed signs of growth. Both bacteria and yeast were evident. Mixed
cultures may have contained both heterotrophs and thiobacilli, but pH stability in both
low (3.75) and mid-pH (6.80) cultures eliminated the possibility of lithotrophic growth.
The growth media was identical to that described in the ATCC Handbook of Bacterial
Medium (1984) for Thiobacillus organoparus, a facultative autotroph and should have
supported heterotrophic growth (Vishniac, 1972) among the facultative thiobacilli initially
present.
Many types of organisms grew on the Bacto-agar used to fortify solid media for
the isolation of heterotrophic organisms. However, successive isolation procedures,
consisiting at each stage of serial dilution, spread-plating, and transfer/growth of cultures
145
in liquid media progressively reduced the number of microbial species that remained.
Both low- and mid-pH plates yielded "monclonal" colonies of yeast identical in
appearance, color, and strain.
Strains of yeast were isolated from both pipe crowns, at points where the pH was
both very low and moderate. There is no reason to suspect that all yeast isoaltes were
identical. The species isolated from the acidified crown was capable of growth at a veiy
wide range of pH values (3 to 8). All strains were identical in appearence under phase-
contrast light microscopy and colony morphologies were indistinguishable on solid media.
This suggested that the strain isolated could function in the low and neutral pH
environment in conjunction with either acidophilic (T. thiooxidans) or mid-pH thiobacilli
(T. neapolitanus).
The yeast isolate from the Roger Road Treatment Plant (on the syphon outfall
side) was capable of growing adequately on glucose as substrate and ammonia as its
nitrogen source in a defined (selective) media. These isolates grew into round, pale
yellow colonies, which turned orange-pink in color with age (5 to 7 days). Their round
shape, growth via budding, and tendency to form clusters of 4 to 8 in liquid, led to the
classification of the sewer crown isolate as yeast This fulfilled an inital objective of the
research; isolation procedures had produced a pure, microbial culture that was capable
of heterotrophic growth under low- and neutral-pH conditions in a defined medium.

146
4.2 Stoichiometric Studies.
4.2.1 Ammonia-to-GIucose Utilization Studies. Yield coefficients, growth rates,
cell consumption, etc., were the same at both, low and mid pHs for yeast. In batch
cultures during balanced growth, the yeast isolate consumed nitrogen and carbon at
approximately a 1:2 ratio (moles N/moles C). The stoichiometry of ammonia and glucose
was estimated from the shapes of the curves in Figure 3-3 and 3-4.
The terminal optical density at stationary-phase growth was a function of initial
nitrogen concentration under ammonia limiting conditions. At low N/C, the dependence
of the optical density at stationary-phase on initial ammonia was stronger than that at
high N/C. A 16-fold increase of ammonia from 50 uM to 800 uM resulted in a 3-fold
increase in cell population. However, the nine-fold increase from 800 uM to 7000 uM
resulted only in a 30% increase in cell density. This suggested that at transition from
nitrogen independence to nitrogen limitation occured between 800 uM to 7000 uM.
Transition from nitrogen to carbon conditions is not sharp. Because, cells may find ways
to use ammonia more efficiently for growth as nitrogen limitation is approached.
Estimated critical N/C ratio for E. coli was about the same as yeast, that is, 1:2 (moles
N/moles C).
If organic carbon is the substrate, about 50% of it is utilized via respiration or
oxidation to C02; this results in enough ATP to convert the rest 50% into biomass
(Gottschal, 1978). For both E. coli and yeast, the N/C critical ratios closely related to
the N/C ratio in dry mass of a cell, adjusted for the percentage of available carbon which
is assimilated into biomass (Stanier, 1976).

147
4.2.2 Ammonia-to-ThiosuIfate Utilization Rates. When T. neapolitanus was
provided with thiosulfate, the stoichiometry of ammonia-to-thiosulfate utilization was
approximately 1:1.5 (moles N/moles S203'2). This was the critical N/S ratio. At this point,
where transition from nitrogen to thiosulfate limitation was encountered, growth rate
decreased abruptly by about 80%. This abrupt decrease suggested that oxidation of some
forms of sulfur continues after thiosulfate is exhausted-presumably oxidation of
metabolic intermediates in the way to sulfate (Kelly, 1982). Further identification of
steps along thiosulfate oxidation pathway and oxidation of intermediates would require
measurement of expected sulfur intermediates and thiosulfate. This oxidation process
is usually brought about by a complex thiosulfate-oxidizing multi-enzyme (Gottschal,
1986). This system of thiosulfate oxidation yields an end product of two sulfate
molecules formed for every thiosulfate molecule oxidized.
43 Two-Organism Competition Studies.
43.1 Low-pH Competition Experiments.
Variation in influent ammonia-to-glucose ratio. Results indicated that
growth and acid production by T. thiooxidans were restricted in the presence of glucose
and a yeast cell population that is capable of competing for limiting nutrients. It is also
evident that both T. thiooxidans and the acidophilic yeast behaved as predicted in the
presence of nitrogen-limiting conditions. That is, in carbon-rich environments, the faster-
growing species (heterotroph or yeast) outcompeted T. thiooxidans for a growth-limiting
substrate, in this case nitrogen. However, ammonia limitation was not entirely

148
responsible for decreases in T. thiooxidans numbers and activity. Reductions in their cell
numbers and activity were also evident in experiments in which the influent glucose
concentration limited yeast growth and excess ammonia was present in the reactor
effluent. From Figure 3-14, following the introduction of yeast and excess glucose (N/C
= 4.445:1), T. thiooxidans cell density reduced from 4 x 10® to 1 x 10⁸ cells/ml and
effluent sulfate concentration dropped from 800 to 300 mg/1 (Figure 3-15). These
reductions occurred despite the persistence of ammonia-nitrogen in the reactor. Because
effluent sulfate decreased by no more (relatively speaking) than the numbers of
thiobacilli, it is evident that the population of T. thiooxidans was metabolically active
(continued to oxidize sulfur) in both the presence and absence of glucose.
The difference in generation rates of yeast (1 to 2 hours) and T. thiooxidans (12-
16 hours) gave yeast a tremendous competitive edge over T. thiooxidans. The advantage
of this edge is most evident in the results of experiments in which nitrogen proved to be
growth-limiting. T. thiooxidans was essentially washed out within 40 hours after the
introduction of the yeast isolate and excess glucose.
There is a physiological basis for difference in generation time of these organisms.
Glucose is energy-rich. Its energy yield has been estimated at 38 ATP/mole of glucose
(Stanier, 1976), and metabolic intermediates of glucose catabolism are backbones for
some amino acids (Kelly, 1982). Glucose can be converted to other sugars. Both these
process facilitate carbon assimilation. T. thiooxidans oxidizes reduced sulfur forms for
energy and must expend a significant fraction of that energy to build all its cellular
components.

149
Under nitrogen-limiting conditions, levels of ammonia and sulfate/acid generation
rates decreased drastically to a point where ammonia and sulfate were no longer
measurable (Figures 3-11; 3-12 and 3-15; 3-16). Under carbon-limiting conditions,
effluent sulfate, and ammonia were reduced by an order-of-magnitude and glucose in the
effluent was virtually nil (Figures 3-15, 3-16, and 3-17). However, ammonia-limitation
was not encountered. Periodic base consumption for the maintenance of the culture pH
at 3.25 complimented these results (Figure 3-18). That is, after the introduction of the
yeast, the amount of base added to neutralize the acid produced decreased by about
90%.
Variations in Culture pH. When experiments were conducted at pH
2.50, yeast experienced a lag period of about 24 hours and then outcompeted T.
thioaxidans for a limiting supply of nitrogen (Figure 3-19). From batch experiments (data
not included), the specific growth rate of yeast at pH 2.50 is considerably lower than at
pH 3.25. A 24 hour lag period was probably experienced due to the low competitive
edge yeast had at pH 2.50 when compared to its balanced growth at pH 3.25.
Consequently, a more gradual decrease in T. thioaxidans activity was observed following
initiation of growth by yeast. The concentrations of ammonia and glucose dropped to
non-measurable levels in nitrogen-limited and carbon-limited cultures, respectively
(Figure 3-21 and 3-22). Three-fold reductions in cell numbers of T. thioaxidans and
effluent sulfate concentration in the high N/C experiment (Figure 3-19 and 3-20) and
virtual disappearance of thiobacilli and sulfate at low N/C feed concentration were
observed (also Figures 3-19 and 3-20).
150
When the same experiment was conducted at pH ZOO, yeast seemed to suffer a
from excessively low pH although they persisted in very low numbers. Appreciable
decreases in T. thioaxidans activity were not observed. Thiobacilli cell numbers and
sulfate production decreased immediately after injection of yeast but regained their
original steady-state concentrations after about 18 hours (Figures 3-24 and 3-25). The
result was unexpected in light of results of enrichment experiments in which acidophilic
yeast were encountered in a sewer crown of pH less than 1.0. However, possible
explanations for both these observations would be — (i) at Iow-pH, yeast goes into
quiescent state, (ii) crown has lots of micro-environments which have pH greater than
what could be measured, and (iii) crown pH is very transient.
Although the results of the experiments are very encouraging from the standpoint
of mitigating crown corrosion, the thiobacilli did not completely wash out qf the CSTR.
T. thioaxidans seem to persist in low numbers (>. 1 x 10s cells/ml) in the nitrogen-limited
experiments. This probably might have been due to their ability to colonize sulfur
particles and/or attach to the reactor walls and mixing apparatus.
Variations in Competitor Identity. At pH 3.25, the mixed-seed
competitors seemed to outcompete within about 3 days after the cross inoculation. This
might have been due ~ (i) to the lower generation times of the various organisms present
in the mixed-seed as compared to the slower-growing T. thioaxidans and/or (ii) the yeast
might have been present in the mixed-seed which dominated the thiobacilli. At pH 2.00,
the potential heterotrophic competitors again seemed to be pH-limited. This might have
been due to the fact that the mixed-seed competitors were obtained from a higher pH

151
micro-environment. The competitors were active for about 50 hours after inoculation,
but numbers/activity of thiobacilli were eventually restored, presumably due to the
advantage enjoyed by T. thioaxidans under exceptionally extreme low-pH conditions.
4.3.2 Mld-pH Competition Experiments.
Variations in influent ammonia feed ratio. From the results, it is evident
that T. neapolitanus activity was mitigated by yeast under nitrogen-limiting conditions.
At high nitrogen concentrations, T. neapolitanus was thiosulfate-limited and the yeast
isolate was glucose-limited. At steady-state T. neapolitanus apparently oxidized all the
S203"2 (influent concentration is 325 mg/L as S) to SO/2 (effluent sulfate concentration
330 mg/1), which resulted in thiosulfate limitation. Following the inoculation of yeast,
moderate reductions in T. neapolitanus cell numbers, effluent sulfate concentration, and
nitrogen concentration were observed in the high ammonia experiments.
Under nitrogen-limiting experiments, yeast addition brought about appreciable
decreases in T. neapolitanus activity (one and two orders-of-magnitude in acid production
and cell density, respectively). Reductions in effluent sulfate and T. neapolitanus cell
numbers were due to the inability to keep up with the rapid growth of yeast. Yeast
assimilated nitrogen faster than T. neapolitanus, which resulted in the decrease of
Thiobacillus numbers and activity. After the introduction of yeast, nitrogen in the
effluent was nil and glucose dropped down by 30%. This indicated that the cultures were
nitrogen deficient and glucose sufficient. Failure to eliminate the slower-growing bacteria
may be again attributable to bacterial attachment and colonization on precipitated sulfur
particles and reactor surfaces.

152
Variations in Competitor Identity. E. coli seemed to outcompete T.
neapolUanus at a faster rate when compared to yeast. This might have been due to the
low generation time of E. coli (20-30 minutes) as opposed to yeast (1-2 hours). Due to
the low doubling time, E. coli rapidly outgrew T. neapolUanus. Reductions in T.
neapolUanus cell numbers and acid productions were almost the same in experiments
involving E. coli and yeast, when conducted at low nitrogen concentrations. However,
E. coli utilized both glucose and nitrogen sooner than the yeast isolate, under similar
experimental conditions. The pH (6.8 units) at which the experiment was conducted may
have favored the heterotroph unduly, inasmuch as crown pHs are frequently lower, even
when conditions are only modestly aggressive.

153
CHAPTER 5
CONCLUSIONS
5.1 Isolation of Sewer Crown Samples.
Sewer crown samples collected from the Roger Treatment Plant {syphon outfall)
were enriched on defined (selective), heterotrophic, low-(3.25), and mid-pH (6.80) media
containing glucose-carbon and ammonia-nitrogen. This glucose-based media supported
growth of original samples collected. The first-transfer cultures also grew in both low-
and mid-pH media. Diversity was significantly lower in the first-transfer cultures than
the original samples. Growth in the original enrichment and first-transfer cultures was
dependent on the nutrients in the designed media.
Heterotrophs grew in the initial enrichment media (Table 2-3) and in the first-
transfer media (also Table 2-3) in about 3 to 5 days. Thiobacilli activity was nonexistent
due to pH stability. Successive serial dilutions, transfers, and spread plating on solid
media yielded a isolate capable of growth in a defined media.
The monoclonal isolates were identified as yeast by phase-contrast light
microscopy, and colony morphology. They were round-shaped, refractile, formed orange-
pink colonies, and formed clusters of 4 to 8. Ouster formation was preceded by budding.
Colonies turned orange-pink after 3-5 days of growth in liquid and on solid media.

154
5.2 Stoichiometiy of Ammonia-to-GIucose Utilization Rates.
The yeast isolates and E. coli demanded about 1:2 molar ratio of nitrogen-to-
glucose, in batch experiments conducted at room temperature (25°C). At the point of
carbon or nitrogen limitation, yeast and E. coli stopped growing. The terminal optical
density at the onset of stationary-phase growth was a function of the initial ammonia
concentrations under ammonia limiting conditions. At the highest nitrogen
concentration, growth was dependent on initial carbon concentration. For both the
organisms, the nitrogen-to-glucose ratio at which transition from nitrogen-limited to
glucose-limited growth occurred was the critical N/C ratio~N/C = 1:2 (moles N/moles
C). The growth and nitrogen-based yield factors (stoichiometrics) for the yeast strains
used in these studies were identical at low- (3.25) and mid-pH (6.80) levels.
The specific growth rate of yeast decreased gradually with the decrease in pH in
the range 2 to 2.75. Growth was pH-limited at <. 2.25 pH units. The most favorable pH
condition for the growth of yeast was between 3.00 and 8.00 pH units. Persistence of
the experimental strain under field conditions (pH < 1.0) cannot be explained on the
basis of these data.
S3 Stoichiometiy of Sulfur Oxidation.
T. neapolitanus consumed 1.5 moles of thiosulfate for every mole of nitrogen
assimilated. The terminal cell numbers at stationary-phase was a function of the initial
nitrogen concentration under ammonia-limiting conditions. When cultures were

155
thiosulfate-limited, all S203'2 was oxidized to SO/2. The gradual decrease in growth at
stationary-phase suggested that the oxidation of sulfur intermediates was possible.
5.4 Competitive Inhibitory Control of Thiobacilli.
From this research, both T. thioaxidans and T. neapolitanus behaved as predicted
in the presence of yeast and nutrient-limiting conditions. That is, the thiobacilli are
probably not at their best in organic-rich environments where a growth-limiting nutrient
such as nitrogen can be identified. Under experimental conditions, acid production by
both T. thiooxidans and T. neapolitanus was substantially curtailed by encouraging
conditions favorable to yeast, the mixed heterotroph seed or E. coli. At least two order-
of-magnitude reductions in thiobacilli cell numbers and effluent sulfate concentrations
were observed under nitrogen-limiting conditions. There is a reason to suspect that
glucose enrichment of competitive populations will limit the activity of thiobacilli in a
sewer environment, even though specific nutrient limitations cannot be identified.
Reductions in these parameters (sulfate concentrations and Thiobacillus cell numbers)
were observed under carbon-limiting conditions, although results were considerably more
modest. The mechanism of this inhibition under glucose limitation remains speculative.
In conclusion, growth and acid production by the chemolithoautotrophic
thiobacilli in liquid media can be substantially mitigated via the encouragement of
microbial competitors, if the collective activities of these competitors result in the
elimination or near elimination of essential nutrients. Such measures could be
implemented in corroding sewers without risk to the general sewage biota or jeopardy

156
to the downstream wastewater treatment operations. This utility of competitive control
of thiobacilli acid production in the sewer crown environment remains to be established.

157
REFERENCES CITED
APHA, AWWA, and APCF (1976). Standard Methods for the Examination of Water and Wastewater. 427c. Sulfate, pp. 493-495.
Arnold, R. A. (1988). Asst. Professor, University of Arizona. Personal Communication.
ATCC (1984). American Type Culture Collection Media Handbook, 1st Edition.
Brock (1974). "Organisms Metabolizing Sulfur and Sulfur Compounds, Genus 2-5." Bergev's Manual of Determinative Bacteriology (8th Edition). Ed. R. E. Buchanan and N. E. Gibbons. The Williams and Wilkins Company, pp. 458-461.
Bailey, J. E. and D. F. Ollis (1986). Biochemical Engineering Fundamentals (2nd ed.,); McGraw-Hill Book Co., New York, pp. 854-902.
Burris, M. J (1990). Unpublished Data. University of Arizona, Civil Engineering.
Cassell A. E., Sulzer, F. T., and Lamb, J. C. HI. (1966). Population Dynamics and Selection in Continuous Mixed Cultures. Journal WPCF.. Vol. 38, pp. 1398-1409.
Chiu, S. Y., L. E. Erickson, L. T. Fan, and I. C. Kao. (1972). Kinetic Model Identification in Mixed Populations Using Continuous Culture Data. Biotech, and Bioeng., Vol. XIV, pp. 207-231.
Collins, Y. E. and G. Stotzky (1989). "Factors Affecting the Toxicity of Heavy Metals to Microbes", in Metal Ions and Bacteria, (eds.) Beveridge, T. J. and R. J. Doyle, John Wiley & Sons, New York, pp. 60-61.
Contois, D. E. (1959). Kinetics of Bacterial Growth: Relationship between Population Density and Specific Growth Rate of Continuous Culture. J. Gen. Microbiol.. Vol. 21, pp. 40-50.
Curds, C. R. (1973). A Theoretical Study of Factors Influencing the Microbial Population Dynamics of the Activated-Sludge Process-I. Water Research. Pergamon Press, Vol. 7, pp. 1269-1284.

158
Curds., C. R., and A. Cockburn (1971). Continuous Monoxenic Culture of Tetrahymma pyriformis. Journ. of Gen. Microbiol.. Vol. 66. pp. 95-108.
Espejo, R. T., and P. Romero (1987). Growth of ThiobacUlus feroaxidans on Elemental Sulfur. Appl. Environ. Microbiol.. Vol. 53, pp. 1907-1912.
Espejo, R. T., B. Escobar, E. Jedlicki, P. Uribe, and R. Badilla-Ohlbaum (1988). Oxidation of Ferrous Iron and Elemental Sulfur by ThiobacUlus feroaxidans. Appl. Environ. Microbiol.. Vol. 54, pp. 1694-1699.
Gibson, T., and Y. Abd-El-Malek (1957). The Development of Bacterial Populations in Milk. Can. Journ. of Microbiol.. Vol. 3, pp. 203-213.
Gottschal, J. C., and Kuenen, G. J. (1980). Selective Enrichment of Facultatively Chemolithotrophic Thiobacilli and Related Organisms in Continuous Culture. FEMS Microbiology Letters 7, pp. 241-247.
Gottschal, J. C., and Kuenen, G. J. (1980). Mixotrophic Growth of ThiobacUlus A2 on Acetate and Thiosulfate as Growth Limiting Substrates in the Chemostat. Arch. Microbiol.. Vol. 120, pp. 33-42.
Gottschal, J. C., Pol, A., and Kuenen, G. J. (1981). Metabolic Flexibility of ThiobacUlus A2 During Substrate Transitions in the Chemostat Arch. Microbiol.. Vol. 129, pp. 23-28.
Gottschal, J. C., Vries de Sacco, and Kuenen, G. J. (1979). Competition Between the Facultatively Chemolithotrophic ThiobacUlus A2, an Obligately Chemolithotrophic ThiobacUlus and a Heterotrophic Spirillum for Inorganic and Organic Substrates. Arch. Microbiol.. Vol. 121, pp. 241-249.
Gottschal, J. C., Nanninga, H. J., and Kuenen, G. J. (1981). Growth of ThiobacUlus A2 under Alternating Growth Conditions in the Chemostat. Journ. of Gen. Microbiol.. Vol. 126, pp. 85-96.
Gottschalk, G. (1986). Bacterial Metabolism (2nd Edition). New York: Springer-Verlag. pp. 293-300.
Herbert, D., Elsworth, R. and Telling, R. C. (1956). The Continuous Culture of Bacteria; A Theoretical and Experimental Study. J. Gen. Microbiol.. Vol. 14, pp. 601-622.
Hijmans, W., H. R. E. Schuit, and F. Klein. (1969). Techniques: An Immunofluorescence Procedure for the Detection of Intracellular Immunoglobulin. Clin. Exp. Immunol.. Vol. 4, pp. 457-472.

159
Holder, G. A., W. Drew, and G. Vaughan (1983). "Studies of Sulphate Removal in a Model Sewer." Tech. Pap. Conv. Aust. Water/Wastewater Assoc.
Jack, T. R., E. A. Sullivan, and J. E. Zajic (1979). Leaching of Vanadium and Other Metals from Athabasca Oil Sands Coke and Coke Ash. Fuel. Vol. 58, pp. 585-588.
Jack, T. R., E. A. Sullivan, and J. E. Zajic (1980). Growth Inhibition of Thiobacittus thioaxidans by Metals and Reductive Detoxification of Vanadium (V)". Eur. J. Appl. Microbiol. Biotechnol.. 9, pp. 21-30.
Jin, C. G. (1987). "Sulfide Control with Sodium Hydroxide in Large Diameter Sewers." LACSD In-house report.
Jost, J. L., J. F. Drake, A. G. Fredrickson, and H. M. Tsuchiya. (1973). Interactions of Tetrahymena pyriformis, Escherichia coli,Azotobactervinelandii, and Glucose in Minimal Medium. Journ. of Bacteriol.. Vol. 113, pp. 834-840.
Kelly, D. P. (1981). "Introduction to the Chemolithotrophic Bacteria" Chapter 79 in: The Prokarvotes. ed. M. P. Starr. Spring-Verlag, pp. 997-1004.
Kelly, D. P. (1982). "Biochemistry of the Chemolithotrophic Oxidation of Inorganic Sulphur." Phil. Trans. R. Soc. Lond.. 298, pp. 499-528.
Kempner, Ellis, S. (1966). "Acid Production by Thiobacittus thioaxidans." Journ. of Bacteriology. 92, pp. 1842-1843.
LACSD (1987). County Sanitation Districts of Los Angeles County. In-house Report.
LACSD (1988). County Sanitation Districts of Los Angeles County. In-house Report.
Meers, J. L. (1971). Short Communications: Effect of Dilution Rate on the Outcome of Chemostat Mixed Culture Experiments. Journ. of Gen. Microbiol.. Vol. 67, pp. 359-361.
Meers, J. L., and D. W. Tempest. (1968). The Influence of Extracellular Products on the Behavior of Mixed Microbial Populations in Magnesium-Limited Chemostat Cultures. J. Gen. Microbiol.. Vol. 52, pp. 309-317.
Megee, R. D., Ill, J. F. Drake, A. G. Fredrickson, and H. M. Tsuchiya (1972). Studies in Intermicrobial Symbiosis. Saccharomyces cerevisiae and Lactobacillus casei. Can. Journ. of Microbiol.. Vol. 18, pp. 1733-1742.

160
Meyer J. S., H. M. Tsuchiya, and A. G. Fredrickson (1975). Dynamics of Mixed Populations Having Complementary Metabolism. Biotech, and Bioeng.. Vol. XVII, pp. 1065-1081.
Milde, K., W. Sand, W. Wolff, and E. Bock (1983). "Thiobacilli of the Corroded Concrete Walls of the Hamburg Sewer System." J. of Gen. Microbiol.. 129, pp. 1327-1333.
Milner, L. (1988). Unpublished Data. University of Arizona, Civil Engineering.
Neal, J. H. (1964) "Advanced Waste Treatment by Distillation." U. S. Public Health Service Report. 999-WP-9.
Oberhofer, T. R., and W. C. Frazier (1960). Competition of Staphylococcus aureus with Other Organisms. Biometrika.
Parker, C. D. (1945). "The Corrosion of Concrete. 1. The Isolation of a Species of Bacterium Associated with the Corrosion of Concrete Exposed to Atmospheres Containing Hydrogen Sulfide. 2. The Function of Thiobacillus concretivorus in the Corrosion of Concrete Exposed to Atmospheres Containing Hydrogen Sulfide." Aust. Jour. Exptl. Biol, and Med. SC.. V23, pp. 81 and 91.
Parker, C. D. (1951). "Mechanics of Corrosion of Concrete Sewers by Hydrogen Sulfide." Sewape and Industrial Wastes. V23, nl2, pp. 1477-1485.
Pfennig, N., F. Widdel, and H. G. Truper (1971). Chapter 74 of The Prokarvotes. ed M. P. Starr. Spring-Verlag.
Pohl, M., E. Bock, M. Rinken, M. Aydin, and W. A. Konig (1984). "Volatile Sulfur Compounds Produced by Methionine Degrading Bacteria and the Relationship top Concrete Corrosion." Z. Naturforsch. 39c, pp. 240-243.
Postgate, J. (1959). "Sulfate Reduction by Bacteria" Ann. Rev. Microbiol.. 13, pp. 505-520.
Postgate, J. R. (1982). Economic Importance of Sulfur Bacteria. Phil. Trans. R. Soc. Lond. Series B, Vol. 298, pp. 583-600.
Rapport, D. J., and Turner, J. E. (1975). Predator-Prey Interactions in Natural Communities. J. theor. Biol.. Vol. 51, pp. 169-180.
Sand, W., E. Bock, and D. C. White (1984). "Role of Sulfur Oxidation Bacteria in the Degradation of Concrete." Corrosion 84: The International Corrosion Forum. New Orleans, LA., Paper No. 96, pp. 1-11.

161
Sand, W., and E. Bock (1984). "Concrete Corrosion in the Hamburg Sewer System." Environmental Technology Letters. 5, pp. 517-528.
Sand, W. (1987). "Importance of Hydrogen Sulfide, Thiosulfate, and Methylmercaptan for Growth of Thiobacilli During Simulation of Concrete Corrosion." Applied Environ. Microbiol.. 53, pp. 1645-1648.
Sand, W., K Bock, and D. C. White (1987). "Biotest System for Rapid Evaluation of Concrete Resistance to Sulfur-Oxidizing Bacteria." Materials Performance, pp. 14-17.
Sima, H (1989). Unpublished Data. University of Arizona, Civil Engineering.
Sivela, S., and V. Sundman (1975). "Demonstration of Thiobacillus-Type Bacteria, which Utilize Methyl Sulfides." Arch. Microbiol.. 103, pp. 303-304.
Smirnov, V. V. (1963). Role of the Microbiological Factors in Increasing the Corrosive Aggressivity of Mine Waters of the Kizel Coal Basin. Mikrobiologiva Vol. 32, pp. 695-699.
Smith, A L., and Kelly, D. P. (1979). Competition between an Obligately and a Facultatively Chemolithotrophic Thiobacillus. Journ. of Gen. Microbiol.. Vol. 115, pp. 377-384.
Snoeyink, V. L., and D. Jenkins (1980). Water Chemistry. New York: John Wiley & Sons.
Sponseller, M. P. (1988). Industrial Pretreatment Backfires in L.A. Pipes. Environ. News Res. No. 10, pp. 14-16.
Stanier, R. Y., E. A. Adelburg, and J. Ingraham (1976). The Microbial World Prentice-Hall, Inc. pp. 190-197 and 707-710.
Stumm, W., and J. J. Morgan (1981). Aquatic Chemistry (2nd Edition). New York: Wiley-Interscience Publication.
Tempest D. W., J. W. Dicks, and J. L. Meers (1967). Magnesium-Limited Growth of Bacillus subtilis, in Pure and Mixed Cultures, in a Chemostat. J. Gen. Microbiol.. Vol. 49, pp. 139-147.
Thingstad, F. T., and Gottschal, J. C. (1982). Mathematical Description of Competition between Two and Three Bacterial Species under Dual Substrate Limitation in the Chemostat: A Comparison with Experimental Data. Biotech, and Bioeng.. Vol. XXIV, pp. 1403-1418.

162
Tsuchiya, H. M., J. F. Drake, J. L. Jost, and A. G. Fredrickson. (1972). Predator-Prey Interactions of Dictyostelium discoideum and Escherichia coli in Continuous Culture. Joun. of Bacteriol.. Vol. 110, pp. 1147-1153.
U. S. Environmental Protection Agency, (1974). Process Design Manual for Sulfide Control in Sanitary Sewerage Systems. EPA 625/1-74/005, Washington, D.C.
U. S. Environmental Protection Agency (1985). Odor and Corrosion Control in Sanitary Sewerage Systems and Treatment Plants. Center for Environmental Research Information, Cincinnati, OH.
Vishniac (1974). "Organisms Metabolizing Sulfur and Sulfur Compounds, Genus 1. Thiobacilhis" Bergev's Manual of Determinative Bacteriology (8th Edition). Ed. R. E. Buchanan and N. E. Gibbons. Baltimore: The Williams and Wilikins Company, pp. 458-461.
Wilkinson T. G., H. H. Topiwala, and G. Hamer (1974). Interactions in a Mixed Population Growing on Methane in Continuous Culture. Biotech, and Bioeng.. Vol. XVI, pp. 41-59.
Wolfgang, B. (1969). Determination of Antisera Titres Using the Single Radial Immunodiffusion Method. Immunochemistrv. Pergamon Press, Vol. 6, pp. 539-546.
Zajic, J. E., E. A. Sullivan, T. R. Jack, and G. Silver (1978). Metals, Microbes, and Bituminous Sands Part n. Alberta Oil Sands Technology and Research Authority, Edmonton, pp. 38-74.