Embed Size (px)
Citation preview
Information transmission between stock and bond markets during the
Eurozone debt crisis: Evidence from industry returns
Nuno Silva*,+
*University of Coimbra, Faculty of Economics +CeBER - Centre for Business and Economics Research
Abstract
I analyze the Granger causality in distribution between sovereign bonds and industry indexes
in the five European countries most affected by the debt crisis: Greece, Ireland, Italy, Portugal, and
Spain. Prior research assessed the impact of the debt crisis on the financial firms, but its effect on
other industries was broadly neglected.
My results reveal that, at the height of the crisis, delayed shocks transmission from the
sovereign bond to the stock market occurred mainly in Greece. At the industry level, there is no
evidence of lagged response of the financial industry to negative sovereign debt shocks, but
sovereign debt leads other industries in, at least, one country. These findings are consistent with the
investor inattention hypothesis, which states that investors tend to specialize in specific markets, due
to their limited availability of time and resources and the cost of information gathering, and
information flows slowly across markets.
Electronic copy available at: https://ssrn.com/abstract=3697288
1. Introduction
The European debt crisis began at the end of 2009 when the new Greek government revised
upwards the budget deficit projection to 12.7% of GDP. This revision led to downgrades of the Greek
sovereign debt by several rating agencies, and to a surge in bond yields that effectively barred Greece
from international credit markets and culminated in a request by Greece of an initial loan of 45 billion
euros from the EU and the IMF.
The Greek debt crisis quickly spread to the rest of the Eurozone, as investors become
increasingly aware of the fragility of other peripheral countries. In 2010 sovereign bond yields rose
sharply in Portugal and Italy, as investors began questioning the sustainability of their public debt,
and in Ireland and Spain who had to rescue several banks that were plagued by a large stock of non-
performing loans, after the world financial crisis.
The European debt crisis left its mark, not only in the sovereign bond market but also in other
asset classes, such as stocks. Several authors studied the impact of this crisis on banking stocks, which
were particularly affected by it, due to their high exposure to the sovereign credit risk. A study group
established by the Committee on the Global Financial System of the Bank for International
Settlements (BIS, 2011) identified four main transmission channels through which sovereign risk can
affect banks:
i) Asset holdings- Banks may suffer losses due to their holdings of sovereign debt;
ii) Collateral/liquidity- Increases in sovereign credit risk reduce the value and/or eligibility of
sovereign bonds as collateral in banks’ funding operations;
iii) Sovereign ratings and banking ratings- Sovereign ratings usually represent a ceiling for
domestic banks’ ratings. Thus, a sovereign downgrade tends to be followed by downgrades in
domestic banks’ ratings;
Electronic copy available at: https://ssrn.com/abstract=3697288

iv) Government guarantees- The deterioration of the sovereign fiscal position leads to a
decrease of both explicit and implicit guarantees on bank funding.
Even though banking was the most severely affected and thoroughly studied sector during
the European debt crisis, its impact was felt across the whole economy. The linkages between other
industries and sovereign bonds are deep and often neglected. First, they are both affected by a
deterioration of investors’ expectations regarding the future growth of the economy. Second, a
higher sovereign yield may lead to contagion in the form of higher financing costs for firms, especially
in highly leveraged industries, such as telecommunications and utilities. Third, an increase in the
perceived likelihood of sovereign default increases the prospects of further fiscal consolidation,
which decreases internal demand and affects, particularly, industries most exposed to the domestic
market. Finally, a deterioration in firms’ business conditions may generate lower profits and
employment, which translates into lower tax revenues, and may compromise the sovereign debt
sustainability.
The main objective of this study is to analyze if information flowed swiftly between the
sovereign bond and eleven industry equity indices, during the height of the sovereign debt crisis
(2010-12), in the five most affected countries (Greece, Ireland, Italy, Portugal, and Spain). To obtain
a clearer picture of the information transmission in these countries during the crisis, I benchmark it
against the two largest Eurozone economies. I also compare the speed of information flow during
the crisis and in the period afterward (2013-19). To achieve this goal, I use the nonparametric test for
Granger causality in distribution proposed by Candelon and Topkavi (2016). This method can test
causality over several quantiles of the distribution and offers a more complete picture of the
information transmission across markets than the traditional Granger causality in mean.
Furthermore, it extends the method proposed by Hong et al. (2009) by allowing the researcher to
test causality in several quantiles simultaneously, effectively making it a causality test in the
Electronic copy available at: https://ssrn.com/abstract=3697288

distribution. My results reveal there is evidence of contagion, in both directions, for several
industries, in the left and right tails of the distribution.
My contribution to the literature is twofold. First, I assess the impact of the sovereign debt
crisis in other industries beyond finance, across different parts of the distributions. Second, I show
that the European debt crisis had a broad impact on several industries and that new information is
not incorporated in the sovereign bond and stock markets at the same time. These results are
consistent with Hong et al. (2007) and Menzly and Ozbas (2010), among others, who report that
industry returns exhibit positive cross-momentum because Information gathering is costly, and
investors tend to specialize in specific sectors. Thus, news flows slowly across industries.
The remainder of this paper is organized as follows. Section 2 presents the main related
literature. Section 3 describes the dataset. Section 4 presents the econometric methodology. Section
5 displays and analyzes my main results. Finally, section 6 presents the concluding remarks.
2. Related literature
This study is related to a vast strand of literature on the cross-asset spillover of shocks, that
experienced rapid growth following the 2008 Global financial crisis and the subsequent European
debt crisis.
The strong linkages between sovereign bonds and banking stocks led several authors to study
the existence of contagion and spillover effects between them. Allegret et al. (2017), using a
multifactor model of equity returns with a sovereign risk premium, conclude that the negative impact
of the European Debt Crisis is confined to European banks. Bhanot et al. (2014) find that an increase
in Greek sovereign bond yields generates negative abnormal returns in financial stocks of Greece,
Portugal Italy, and Spain, and this effect is reinforced when there are negative news announcements
about Greece. Tamakoshi and Hamori (2012) analyze the relation between Greek sovereign bond
Electronic copy available at: https://ssrn.com/abstract=3697288
yields and Southern European banking stock indices and conclude that there is unidirectional
causality-in-mean from banking stocks to Greek sovereign bond yields and bidirectional causality-in-
variance. Using a database of 33 systemically important banking stocks and 36 sovereign bond yields,
Corsi et al. (2018) develop a measure of connectedness between these markets in times of financial
distress. They show that this indicator peaks at the beginning of the European, which implies that the
“flight-to-quality” phenomenon was especially prevalent during this period. The credit default swap
(CDS) spreads is used to test the transmission of shocks between sovereign bonds and banks by Alter
and Beyer (2014), who show that the interconnectedness between banks and sovereign CDS’s
increased from 2010 to 2012, and De Bruyckere et al. (2013) who report evidence of increased
correlation (contagion) between sovereign and bank CDS spreads during the European debt crisis,
especially in the GIIPS countries. Grammatikos and Vermeulen (2012) show that an increase in Greek
CDS spread causes a decrease in both financial and non-financial stock returns, not only in the fragile
Southern European countries but also in the more robust Northern ones. Using a vector
autoregressive model, Coronado et al. (2012) analyze the transmission of shocks between the CDS
and stock markets, in several European countries, between 2007 and 2010. They find that the stock
markets lead CDS markets throughout most of the period considered, but the CDS markets played a
key role in shock transmission at the heyday of the debt crisis. Ballester et al. (2016) assess return
spillovers between bank CDS markets in different countries. After decomposing CDS returns into
systematic and idiosyncratic factors, using principal component analysis, they apply a generalized
VAR model to measure contagion. The authors report that global contagion is always greater than
idiosyncratic contagion, but the role of idiosyncratic risk in information transmission increased during
the European debt crisis.
Another line of research focuses on the international transmission of shocks across several
European countries during the debt crisis. Tola and Walti (2015), using a narrative approach, find
Electronic copy available at: https://ssrn.com/abstract=3697288
evidence of contagion in the European sovereign debt market, and Tamakoshi and Hamori (2011)
show that significant causal relationships between European stock markets disappeared during the
Greek sovereign debt crisis.
The literature on cross-asset interdependence is a rich one and covers a wide range of classes.
Chang and Cheng (2016) study the cross-asset contagion between REIT, stock, money, bond and
currency markets in the US, Norden and Weber (2009) analyze the transmission of shocks in stocks,
CDS spreads and bonds, Beirne and Gieck (2014) focuses on global bond, equity and exchange rate
markets, Longstaff (2010) shows that a subprime asset-backed collateralized debt obligations index
leads stocks, and corporate and treasury bonds by as much as three weeks, and Chulia and Torro
(2008) test the volatility transmission between European stock and bond markets using futures
contracts.
The research on contagion at the industry level is much scarcer. Bekaert et al. (2014) analyze
the information transmission for 415 equity industry portfolios from 55 countries during the global
financial crisis, using a three-factor model. They find that domestic contagion dominates
international contagion, and it is particularly severe in countries that present poor economic
fundamentals. Phylatkis and Xia (2009) also use a factor model to test for contagion across several
country-industry indexes, from U.S., Latin America, Europe, and Asia, between 1990 and 2004. They
conclude that the transmission of information is heterogeneous across industries: some industries
are plagued with contagion, while others seem almost immune to it. Using an asymmetric dynamic
conditional correlation GARCH model, Alexakis and Pappas (2018) test for international contagion at
the sector level in 15 European countries, during the global financial crisis and the European
sovereign debt crisis. They conclude that contagion exists in all the business sectors, and it is
especially prevalent in financials and telecommunications. The information flow between 11 US
industry stock indexes and their corresponding CDS spreads, is studied by Shazad et al. (2017). They
Electronic copy available at: https://ssrn.com/abstract=3697288
report that all the stock market indexes Granger-cause the CDS markets, but there is also some
evidence of bidirectional causality for some industries.
3. Data
The database consists of daily sovereign bond total return and equity indexes, covering the
years 2010 to 2019, for five of the Eurozone countries most affected by the European sovereign debt
crisis- Greece, Ireland, Italy, Portugal, and Spain- and their two largest economies (France and
Germany), which are used as benchmarks. For each country, I extracted, from Datastream, the 10-
year sovereign bond total return index, a broad equity market total return index, and eleven industry
level 1 ICB1 total return equity indexes, namely, Basic Materials (BM), Consumer Discretionary (CD),
Consumer Staples (CS), Energy (En), Financials (Fin), Health Care (HC), Industrials (Ind), Real Estate
(RE), Technology (Tec), Telecommunications (Tel), and Utilities (Ut). Data on the Health Care, Real
Estate, Technology, Telecommunications and Utilities for Ireland, and Health Care for Portugal are
not available over the entire sample period. Thus, I choose to exclude them from this study.
Table 1 presents some descriptive statistics about the continuously compounded bond and
stock indexes returns. During the heyday of the debt crisis (2010-2012), Greek bonds showed the
worst performance with a daily average return of -0.07% and a high standard deviation (2.60%).
French and German bond markets had the highest returns and the lowest risk levels, while the
remaining GIIPS2 countries delivered slightly positive average returns and moderate standard
deviations. The broad stock market indexes exhibited negative returns in all GIIPS countries, except
Ireland, while France and Germany’s ones had positive returns. At the industry level, Finance was the
1 Industry Classification Benchmark 2 Greece, Ireland, Italy, Portugal, and Spain.
Electronic copy available at: https://ssrn.com/abstract=3697288

most affected industry in the peripheral countries, with a negative return and a high standard
deviation, and Basic Materials, Energy and Consumer Staples proved to be more resilient.
During the 2013-2019 period, the sovereign bond markets in the GIIPS countries
outperformed the core Eurozone ones as yields normalized in the former countries. In most stock
markets the average return turned positive except in Greece, whose economy continued to be
penalized by austerity measures aiming to improve debt sustainability. Finance continued to
underperform in the GIIPS countries and didn’t fully recover from the losses suffered during the crisis,
while Consumer Staples and Consumer Discretionary had higher returns than the broad market as
the economies and consumption started growing again after the crisis. The volatilities of returns
decreased in most peripheral countries, except Greece, and became similar to the ones in France and
Germany.
4. Econometric methodology
In order to assess the transmission of shocks between the sovereign bond returns and
industry returns, I use the test of Granger causality in distribution proposed by Candelon and Tokpavi
(2016). This test is a multivariate extension of the Granger causality in risk test developed by Hong et
al. (2009).
This test is based on the concept of value-at-risk (VaR), which is a measure of the maximum
loss at the α%-confidence interval, for an asset or portfolio. Let Xt, Yt represent two time series. Their
VaR at the α%-confidence level is given by
����� < ������|ℱ���� � = � (1)
����� < ������|ℱ���� � = � (2)
, where ��, �� are the true unknown parameters related to the specification of the value-at-risk
models for the variables Xt and Yt, and ℱ���� , ℱ���� are their information sets at time t-1
Electronic copy available at: https://ssrn.com/abstract=3697288

ℱ���� = ���, � ≤ � − 1� (3)
ℱ���� = ���, � ≤ � − 1� (4)
Based on the previous equations, I may define a vector of VaR, at time t, for a set of risk levels
� = ���, … , � !�" , with 0 < α1 < α2 < … αm+1 < 1, such that
��,�� ��, ��� < ⋯ < ��,�� ��, � !�� (5)
Then, I can divide the support of Xt, using indicator variables that identify the events comprised
between two consecutive VaR levels
$�,%� ��� = & 1 () ��,�� ��, �%� ≤ �� < ��,�� ��, �%!��0 +�ℎ-�.(/-
(6)
For s = 1,…,m.
Now, let 0����� be a vector formed by the m indicator variables presented above
0����� = 1$�,�� ���, … , $�, � ���23
(7)
and, similarly for Yt
0����� = 1$�,�� ���, … , $�, � ���23
(8)
Then, Yt does not Granger-cause Xt in distribution if the following hypothesis holds
ℍ�: 670�����|ℱ����&�9 = 6�0�����|ℱ���� � (9)
, that is, the information set related to the variable Yt does not have any predictive power for 0�����
beyond the one contained in the distribution support of Xt.
To develop a testable hypothesis, I need to estimate the VaR for both Xt and Yt, to obtain
empirical counterparts of 0����� and 0�����. There are many approaches to estimate the VaR such
as GARCH models proposed by Engle and Ng (1993), simulation methods, Morgan’s (1996) Risk
Metrics, rolling historical quantiles, and Engle and Manganelli (2004) conditional autoregressive
value-at-risk (CAViaR). I choose the latter method, which estimates the quantiles directly, because it
Electronic copy available at: https://ssrn.com/abstract=3697288

has proven to be robust in the presence of typical features of financial series, such as volatility
clustering and non i.i.d returns. For each series and risk level, the conditional value-at-risk is modeled
using the asymmetric slope specification proposed by Engle and Manganelli (2004)
���%�� = %�� + %�� ����,� + %;� ����! + %<� ����� (10)
���%�� = %�� + %�� ����� + %;� ����! + %<� ����� (11)
, where ����! = max ����, 0�. ����� = −min����, 0�, ����! = max ����, 0�. ����� = −min����, 0�,
and s = 1,…,m indicates the risk level. As in Engle and Manganelli (2004), I estimate the parameters
in equations (10) and (11) by minimizing the regression quantile loss function, and I assess the
quantile adequacy using their dynamic quantile test.
Using the estimated values-at-risk, I compute 0B�� ≡ 0��DE�� , … , E � F and 0B�� ≡0��DE�� , … , E � F, the empirical counterparts of 0����� and 0�����. Then, I obtain the test statistic
proposed in Candelon and Tokpavi (2016) by following the steps below.
1 – Compute the sample cross-correlation matrix between 0B�� and 0B��
ΛBH� ≡⎩⎪⎪⎨⎪⎪⎧M�� N D0B�� − ΠB�FD0B��P� − ΠB�F33
�Q�!P 0 ≤ H ≤ M − 1M�� N D0B�!P� − ΠB�FD0B�� − ΠB�F33
�Q��P 1 − M ≤ H ≤ 0
(12)
, where ΠB� and ΠB� are the sample means of 0B�� and 0B��, respectively.
2- Calculate the corresponding sample cross-correlation matrix
REH� = SDΣE�F��/;ΛBH�SDΣE�F��/; (13)
, where D represents the diagonal form of a matrix, and ΣE� and ΣE� are the sample covariance matrices
of 0B��and 0B��, respectively.
Electronic copy available at: https://ssrn.com/abstract=3697288

3- Compute the quadratic form
VE = N W; X HYZ [EH�3��PQ�
(14)
, where W is a kernel function (Bartlett, Daniel, and Parzen kernels are popular choices), M is a
truncation parameter and [EH� is
[EH� = M\-] 1REH�23 DΓE��� ⊗ ΓE���F\-] 1REH�2 (15)
, where ΓE� and ΓE� are the sample correlation matrices of 0B�� and 0B�� .
4- The test statistic, which is a centered and scaled version of the quadratic form VE, follows a standard
Normal distribution
��→� = VE − a;b3Y�Da;S3Y�F�/; (16)
, where b3Y� and S3Y� are
b3Y� = N1 − H/M�3��PQ� W; X HYZ
(17)
S3Y� = 2 N1 − H/M�1 − H + 1�/M�3��PQ� Wd X HYZ
(18)
In this study, I set M = 5 and use the Bartlett kernel. I test the sensitivity of my results to
changes in the kernel (Daniell and Parzen kernels) and the truncation parameter (M = 10) and
conclude that the results remain broadly unchanged.
Electronic copy available at: https://ssrn.com/abstract=3697288

5. Results
In this section, I report and comment on the results of the Granger causality in distribution
tests. The next to last row of Table 2 shows that the number of significant causality tests in the left
tail of the distributions (5% level), during the crisis period, from the bond to the stock markets, equals
19 out of 78, and there are 21 out of 78 significant tests in the reverse direction. These numbers,
which are higher than what should be expected by mere chance, show that the bond-stock market
integration is less than perfect, and information does not flow swiftly across markets. Greece is the
country that exhibits a higher level of delayed information transmission from the bond to the stock
market. In this country, all industries except Finance and Energy lag the bond market. In contrast, in
France, the stock market leads the bond market in most sectors. Germany, which is considered a safe
haven amongst the European economies, shows the highest level of integration between the
sovereign bond and stock markets. In the remaining countries, there is modest evidence of causality
running mostly from the stock to the bond market. At the industry level, the bond market leads the
Finance industry in no country. The remaining industries lag the bond market in, at least, one country,
the most affected one being Consumer Discretionary (3 countries). This pattern is coherent with the
limited attention hypothesis, which predicts that bond-market shocks are transmitted more rapidly
between markets whose interconnections are obvious but may lag in neglected industries. Several
industries lead the bond markets in more than one country, such as Utilities (3) and Finance, Health
Care, and Real Estate (2). The case of Ireland deserves special attention, as it shows that the shocks
that affected the Finance industry, following the rescue of the Irish banking sector, were not timely
incorporated in sovereign bond prices.
In the period after the crisis (2013-2019), the overall evidence of lagged information
transmission between markets became slightly weaker from the bond to the stock market (14
significant tests, at the 5% level) and slightly stronger in the reverse one (24 significant tests). In
Electronic copy available at: https://ssrn.com/abstract=3697288

Greece, the bond to stock market causality was reversed. Most countries experienced a decrease in
the number of significant tests, except Germany (sizable increase in stock-bond causality) and Italy.
At the industry level, news flowed mainly from the bond to the stock market in Energy, Real Estate
and Technology, and in the opposite direction in Basic Materials, Consumer Discretionary, Consumer
Staples, Finance, Industrials, and Utilities.
Table 3 displays the p-values of the Granger causality tests for the middle part of the
distributions. During the crisis period, the evidence of delayed information flow across markets in the
middle of the distribution is weaker than in the left tail (12 significant tests in the bond-stock
direction, and 5 in the reverse one). Greece exhibits the highest number of lagged responses in both
directions, while information is timely transmitted between markets in the core European
economies. At the industry level, the stock market dominates the bond market for Energy, and the
reverse pattern is observed for Financials, Health Care, Industrials, and Technology. The period after
the crisis also presents modest evidence of lagged news flows, with a slight dominance of the bond
market over the stock market (13 significant tests in the bond-stock direction, and 10 in the stock-
bond direction).
During the heyday of the crisis, markets also showed a lack of integration following good
news. There are 22 significant causality tests from the bond to the stock markets, in the right tail of
the distribution, and 28 from the stock to the bond markets (Table 4). Curiously, the core European
markets, together with Spain, show the highest number of failures in the timely information
transmission across markets. At the industry level, the industries which present clearer evidence of
lead over the bond market are Finance, Telecommunications, and Utilities, while Consumer
Discretionary lags the bond market in most countries. In the period after the crisis, the bond markets
saw an increase in their ability to incorporate and transmit good news (28 significant tests), but, in
Greece, the stock market became dominant over the bond market in the speed of information
Electronic copy available at: https://ssrn.com/abstract=3697288

transmission. In Basic Materials, Health Care, Industrials, Real Estate, Telecommunications, and
Utilities news ran mainly from the bond to the stock market, but in Finance it continued to flow in
the other direction.
6. Concluding Remarks
In this study, I show that the transmission of shocks between sovereign bonds and stock
markets depends upon the industry and the zone of the distributions considered. Contagion is
especially prevalent at the left and right tails of the distribution, and it is almost absent at the center.
Stock markets exhibit a slight dominance in information incorporation following bad news, while the
bond market prevails after good news.
Greece, the country where the European debt crisis began, shows a curious pattern of
information flows across different sections of the distributions: the bond market clearly dominates
the stock market following negative shocks, but there is evidence of bidirectional causality in the
middle and right tails of the distribution. This pattern, which was revealed by my choice of a causality
test in distribution, has not been reported in previous studies that rely on standard Granger causality
in mean tests. In the remaining GIIPS countries, neither the stock nor the bond markets present a
clear dominance during the most severe period of the crisis.
I also find that the finance industry led the sovereign bond market during the Irish banking
crisis. That is, sovereign bond prices failed to reflect, promptly, both good and bad news coming from
banks.
Overall, Finance seems to be the industry that can incorporate bond market shocks the
fastest. This result is not surprising given that banks were drawn to the center of the debt crisis by
their strong interconnectedness with sovereign bond yields, through the asset holding, collateral,
ratings, and government guarantee channels.
Electronic copy available at: https://ssrn.com/abstract=3697288

In other industries, there is evidence that prices do not fully reflect news from the bond
market in a timely manner, particularly in the left and right tails of the distributions. Conversely, I
also find that stock market shocks are not immediately reflected in sovereign bond prices.
Surprisingly, this pattern is not specific to the peripheral GIIPS country, whose financial markets are
less evolved but can also be observed in the core European countries, even the post-crisis period.
These results provide support to the limited attention hypothesis, according to which investors lack
the time and resources to follow all the markets and tend to specialize in a particular one. Thus,
market integration is less than perfect, which explains the lead-lag pattern observed across markets.
Electronic copy available at: https://ssrn.com/abstract=3697288
References
Alexakis, Christos and Pappas, Vasileos, 2018, “Sectoral dynamics of financial contagion in Europe-
The cases of recent crises episodes”, Economic Modelling 73, 222-239.
Allegret, Jean-Pierre, Raymond Hélène and Rharrabti, Houda, 2017, “The impact of the European
sovereign debt crisis on bank stocks. Some evidence of shift contagion in Europe”, Journal of Banking
and Finance 74, 24-37.
Alter, Adrian and Beyer, Andreas, 2014, “The dynamics of spillover effects during the European
sovereign debt turmoil”, Journal of Banking & Finance 42, 134-153.
Ballester, Laura, Casu, Barbara and González-Urteaga, Ana, 2016, “Bank fragility and contagion:
Evidence from the bank CDS market”, Journal of Empirical Finance 38, 394-416.
Bekaert, Geert, Ehrmann, Michael, Fratzcher, Marcel and Mehl, Arnaud, 2014, “The Global Crisis and
Equity Market Contagion”, The Journal of Finance 69 (6), 2597-2649.
Beirne, John and Gieck, Jana, 2014, “Interdependence and Contagion in Global Asset Markets”,
Review of International Economics 22 (4), 639-659.
Bhanot, Karan, Burns, Natasha Hunter, Delroy and Williams, Michael, 2014, “News spillovers from
the Greek debt crisis: Impact on the Eurozone financial sector”, Journal of Banking and Finance 38,
51-63.
BIS, 2011, “The impact of sovereign credit risk on bank funding conditions”, Committee on the Global
Financial System Papers 43.
Candelon, Bertrand and Tokpavi, Sessi, 2016, “A Nonparametric Test for Granger Causality in
Distribution With Application to Financial Contagion”, Journal of Business & Economic Statistics, 34
(2) 240-253.
Chang, Guang-Di and Cheng Po-Ching, 2016, “Evidence of cross-asset contagion in U.S. markets”,
Economic Modelling 58, 219-226.
Electronic copy available at: https://ssrn.com/abstract=3697288

Chulia, Helena and Torró, Hipôlit, 2008, “The economic value of volatility transmission between the
stock and bond markets”, The Journal of Futures Markets 28 (11), 1066-1094.
Coronado, Maria, Corzo, Teresa and Lazcano, Laura, 2012, “A case for Europe: The relationship
between Sovereign CDS and stock indexes”, Frontiers in Finance and Economics 9 (2), 32-63.
Corsi, Fulvio, Lillo, Fabrizio, Pirino, Davide and Trapin, Luca, 2018, “Measuring the propagation of
financial distress with Granger-causality tail risk networks”, Journal of Financial Stability 38, 18-36.
De Bruyckere, Valerie, Gerhardt, Maria, Schepens, Glenn and Vennet, Rudi, 2013, “Bank/sovereign
risk spillovers in the European debt crisis”, Journal of Banking & Finance 37, 4793-4809.
Engle, Robert and Manganelli, Simone, 2004, “CARiaR”, Journal of Business & Economic Statistics 22
(4), 367-381.
Engle, Robert and Ng, Victor, 1993, “Measuring and Testing the Impact of News on Volatility”, Journal
of Finance 48, 1749-1778.
Grammatikos, Theoharry and Vermeulen, Robert, 2012, “Transmission of the financial and sovereign
debt crises to the EMU: Stock prices, CDS spreads and exchange rates”, Journal of International
Money and Finance 31, 517-533.
Hong, Harrison, Totous, Walter and Valkanov, Rossen, 2007, “Do Industries lead stock markets?”,
Journal of Financial Economics, 83, 367-396.
Hong, Yongmiao, Liu, Yanhui and Wang, Shouyang, 2009, “Granger causality in risk and detection of
extreme risk spillover between financial markets”, Journal of Econometrics 150, 271-287.
Longstaff, Francis, 2010, “The subprime credit crisis and contagion in financial markets” Journal of
Financial Economics 97, 436-450.
Menzly, Lior and Ozbas, Oguzhan, 2010, “Market Segmentation and Cross-predictability
of Returns”, Journal of Finance, 65 (4), 1555-1580.
Electronic copy available at: https://ssrn.com/abstract=3697288
Morgan, J.P., 1996, “Risk Metrics” Technical Document,4th edition, Morgan Guarantee Trust
Company, New York.
Norden, Lars and Weber, Martin, 2009, “The Co-movement of Credit Default Swap, Bond and Stock
Markets: An Empirical Analysis”, European Financial Management 15 (3), 529-562.
Phylaktis, Kate and Xia, Lichuan, 2009, “Equity Market Comovement and Contagion: A Sectoral
Perspective”, Financial Management 38 (2), 381-409.
Shahzad, Syed, Nor, Safwan, Hammoudeh, Shawkat and Shahbaz, Muhammad, 2017, “ Directional
and bidirectional causality between U.S. industry credit and stock markets and their determinants”,
International Review of Economics and Finance 47, 46-61.
Tamakoshi, Go and Hamori, Shigeyuki, 2011, “Transmission of stock prices amongst European
countries before and during the Greek sovereign debt crisis”, Economics Bulletin 31 (4) 3339-3353.
Tamakoshi, Go and Hamori, Shigeyuki, 2014, “Causality-in-variance and causality-in-mean between
the Greek sovereign bond yields and Southern European banking sector equity returns”, Journal of
Economics and Finance 38 (4), 627-642.
Tola, Albi and Walti, Sebastian, 2015, “Deciphering financial contagion in the euro area during the
crisis”, The Quarterly Review of Economics and Finance 55, 108-123.
Electronic copy available at: https://ssrn.com/abstract=3697288
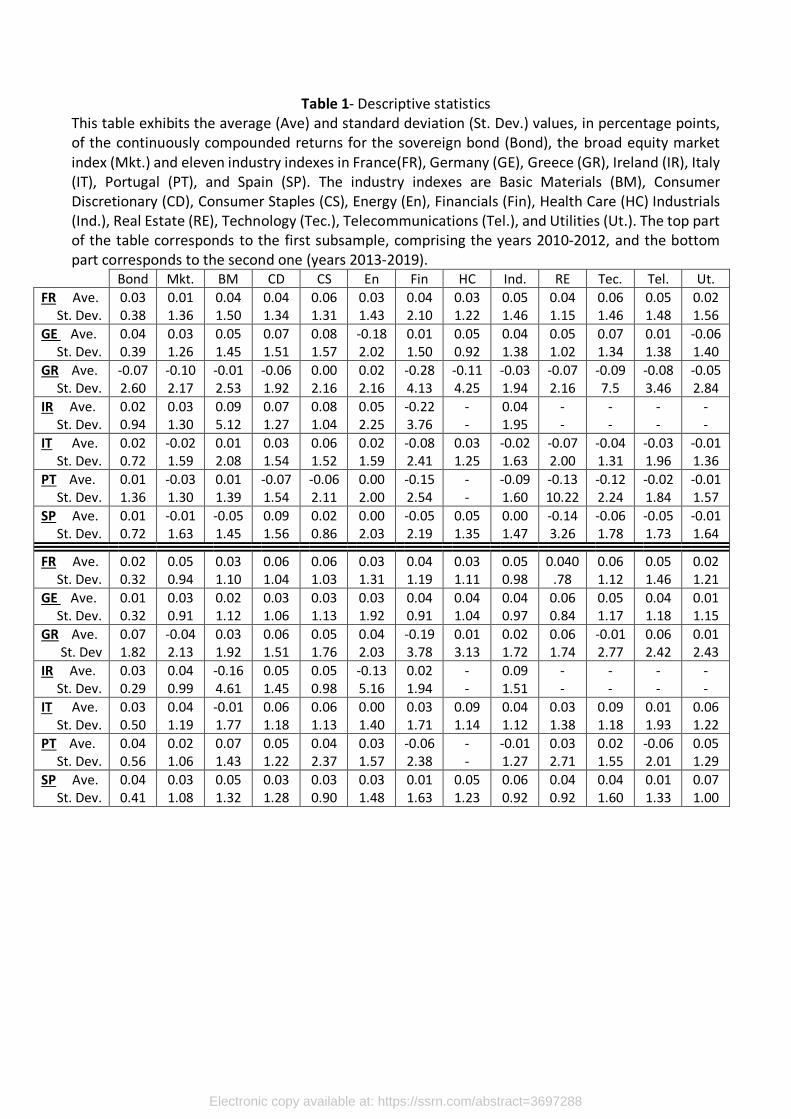
Table 1- Descriptive statistics
This table exhibits the average (Ave) and standard deviation (St. Dev.) values, in percentage points,
of the continuously compounded returns for the sovereign bond (Bond), the broad equity market
index (Mkt.) and eleven industry indexes in France(FR), Germany (GE), Greece (GR), Ireland (IR), Italy
(IT), Portugal (PT), and Spain (SP). The industry indexes are Basic Materials (BM), Consumer
Discretionary (CD), Consumer Staples (CS), Energy (En), Financials (Fin), Health Care (HC) Industrials
(Ind.), Real Estate (RE), Technology (Tec.), Telecommunications (Tel.), and Utilities (Ut.). The top part
of the table corresponds to the first subsample, comprising the years 2010-2012, and the bottom
part corresponds to the second one (years 2013-2019).
Bond Mkt. BM CD CS En Fin HC Ind. RE Tec. Tel. Ut.
FR Ave.
St. Dev.
0.03
0.38
0.01
1.36
0.04
1.50
0.04
1.34
0.06
1.31
0.03
1.43
0.04
2.10
0.03
1.22
0.05
1.46
0.04
1.15
0.06
1.46
0.05
1.48
0.02
1.56
GE Ave.
St. Dev.
0.04
0.39
0.03
1.26
0.05
1.45
0.07
1.51
0.08
1.57
-0.18
2.02
0.01
1.50
0.05
0.92
0.04
1.38
0.05
1.02
0.07
1.34
0.01
1.38
-0.06
1.40
GR Ave.
St. Dev.
-0.07
2.60
-0.10
2.17
-0.01
2.53
-0.06
1.92
0.00
2.16
0.02
2.16
-0.28
4.13
-0.11
4.25
-0.03
1.94
-0.07
2.16
-0.09
7.5
-0.08
3.46
-0.05
2.84
IR Ave.
St. Dev.
0.02
0.94
0.03
1.30
0.09
5.12
0.07
1.27
0.08
1.04
0.05
2.25
-0.22
3.76
-
-
0.04
1.95
-
-
-
-
-
-
-
-
IT Ave.
St. Dev.
0.02
0.72
-0.02
1.59
0.01
2.08
0.03
1.54
0.06
1.52
0.02
1.59
-0.08
2.41
0.03
1.25
-0.02
1.63
-0.07
2.00
-0.04
1.31
-0.03
1.96
-0.01
1.36
PT Ave.
St. Dev.
0.01
1.36
-0.03
1.30
0.01
1.39
-0.07
1.54
-0.06
2.11
0.00
2.00
-0.15
2.54
-
-
-0.09
1.60
-0.13
10.22
-0.12
2.24
-0.02
1.84
-0.01
1.57
SP Ave.
St. Dev.
0.01
0.72
-0.01
1.63
-0.05
1.45
0.09
1.56
0.02
0.86
0.00
2.03
-0.05
2.19
0.05
1.35
0.00
1.47
-0.14
3.26
-0.06
1.78
-0.05
1.73
-0.01
1.64
FR Ave.
St. Dev.
0.02
0.32
0.05
0.94
0.03
1.10
0.06
1.04
0.06
1.03
0.03
1.31
0.04
1.19
0.03
1.11
0.05
0.98
0.040
.78
0.06
1.12
0.05
1.46
0.02
1.21
GE Ave.
St. Dev.
0.01
0.32
0.03
0.91
0.02
1.12
0.03
1.06
0.03
1.13
0.03
1.92
0.04
0.91
0.04
1.04
0.04
0.97
0.06
0.84
0.05
1.17
0.04
1.18
0.01
1.15
GR Ave.
St. Dev
0.07
1.82
-0.04
2.13
0.03
1.92
0.06
1.51
0.05
1.76
0.04
2.03
-0.19
3.78
0.01
3.13
0.02
1.72
0.06
1.74
-0.01
2.77
0.06
2.42
0.01
2.43
IR Ave.
St. Dev.
0.03
0.29
0.04
0.99
-0.16
4.61
0.05
1.45
0.05
0.98
-0.13
5.16
0.02
1.94
-
-
0.09
1.51
-
-
-
-
-
-
-
-
IT Ave.
St. Dev.
0.03
0.50
0.04
1.19
-0.01
1.77
0.06
1.18
0.06
1.13
0.00
1.40
0.03
1.71
0.09
1.14
0.04
1.12
0.03
1.38
0.09
1.18
0.01
1.93
0.06
1.22
PT Ave.
St. Dev.
0.04
0.56
0.02
1.06
0.07
1.43
0.05
1.22
0.04
2.37
0.03
1.57
-0.06
2.38
-
-
-0.01
1.27
0.03
2.71
0.02
1.55
-0.06
2.01
0.05
1.29
SP Ave.
St. Dev.
0.04
0.41
0.03
1.08
0.05
1.32
0.03
1.28
0.03
0.90
0.03
1.48
0.01
1.63
0.05
1.23
0.06
0.92
0.04
0.92
0.04
1.60
0.01
1.33
0.07
1.00
Electronic copy available at: https://ssrn.com/abstract=3697288
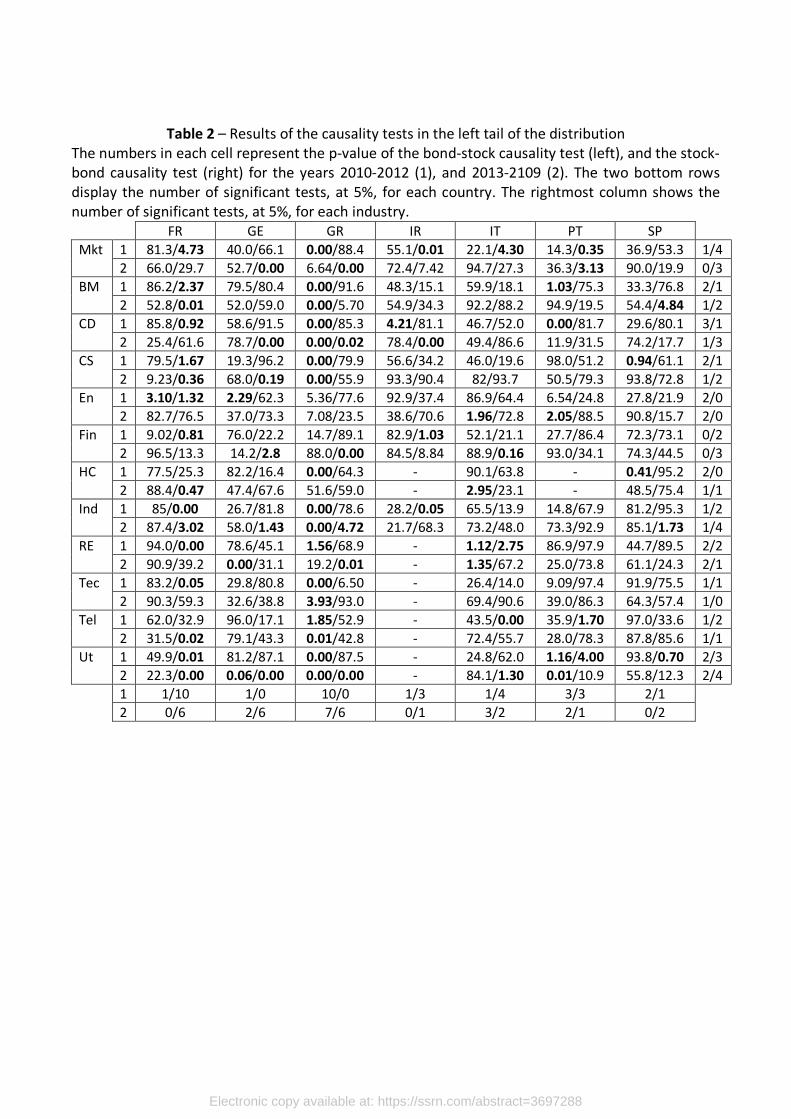
Table 2 – Results of the causality tests in the left tail of the distribution
The numbers in each cell represent the p-value of the bond-stock causality test (left), and the stock-
bond causality test (right) for the years 2010-2012 (1), and 2013-2109 (2). The two bottom rows
display the number of significant tests, at 5%, for each country. The rightmost column shows the
number of significant tests, at 5%, for each industry.
FR GE GR IR IT PT SP
Mkt 1 81.3/4.73 40.0/66.1 0.00/88.4 55.1/0.01 22.1/4.30 14.3/0.35 36.9/53.3 1/4
2 66.0/29.7 52.7/0.00 6.64/0.00 72.4/7.42 94.7/27.3 36.3/3.13 90.0/19.9 0/3
BM 1 86.2/2.37 79.5/80.4 0.00/91.6 48.3/15.1 59.9/18.1 1.03/75.3 33.3/76.8 2/1
2 52.8/0.01 52.0/59.0 0.00/5.70 54.9/34.3 92.2/88.2 94.9/19.5 54.4/4.84 1/2
CD 1 85.8/0.92 58.6/91.5 0.00/85.3 4.21/81.1 46.7/52.0 0.00/81.7 29.6/80.1 3/1
2 25.4/61.6 78.7/0.00 0.00/0.02 78.4/0.00 49.4/86.6 11.9/31.5 74.2/17.7 1/3
CS 1 79.5/1.67 19.3/96.2 0.00/79.9 56.6/34.2 46.0/19.6 98.0/51.2 0.94/61.1 2/1
2 9.23/0.36 68.0/0.19 0.00/55.9 93.3/90.4 82/93.7 50.5/79.3 93.8/72.8 1/2
En 1 3.10/1.32 2.29/62.3 5.36/77.6 92.9/37.4 86.9/64.4 6.54/24.8 27.8/21.9 2/0
2 82.7/76.5 37.0/73.3 7.08/23.5 38.6/70.6 1.96/72.8 2.05/88.5 90.8/15.7 2/0
Fin 1 9.02/0.81 76.0/22.2 14.7/89.1 82.9/1.03 52.1/21.1 27.7/86.4 72.3/73.1 0/2
2 96.5/13.3 14.2/2.8 88.0/0.00 84.5/8.84 88.9/0.16 93.0/34.1 74.3/44.5 0/3
HC 1 77.5/25.3 82.2/16.4 0.00/64.3 - 90.1/63.8 - 0.41/95.2 2/0
2 88.4/0.47 47.4/67.6 51.6/59.0 - 2.95/23.1 - 48.5/75.4 1/1
Ind 1 85/0.00 26.7/81.8 0.00/78.6 28.2/0.05 65.5/13.9 14.8/67.9 81.2/95.3 1/2
2 87.4/3.02 58.0/1.43 0.00/4.72 21.7/68.3 73.2/48.0 73.3/92.9 85.1/1.73 1/4
RE 1 94.0/0.00 78.6/45.1 1.56/68.9 - 1.12/2.75 86.9/97.9 44.7/89.5 2/2
2 90.9/39.2 0.00/31.1 19.2/0.01 - 1.35/67.2 25.0/73.8 61.1/24.3 2/1
Tec 1 83.2/0.05 29.8/80.8 0.00/6.50 - 26.4/14.0 9.09/97.4 91.9/75.5 1/1
2 90.3/59.3 32.6/38.8 3.93/93.0 - 69.4/90.6 39.0/86.3 64.3/57.4 1/0
Tel 1 62.0/32.9 96.0/17.1 1.85/52.9 - 43.5/0.00 35.9/1.70 97.0/33.6 1/2
2 31.5/0.02 79.1/43.3 0.01/42.8 - 72.4/55.7 28.0/78.3 87.8/85.6 1/1
Ut 1 49.9/0.01 81.2/87.1 0.00/87.5 - 24.8/62.0 1.16/4.00 93.8/0.70 2/3
2 22.3/0.00 0.06/0.00 0.00/0.00 - 84.1/1.30 0.01/10.9 55.8/12.3 2/4
1 1/10 1/0 10/0 1/3 1/4 3/3 2/1
2 0/6 2/6 7/6 0/1 3/2 2/1 0/2
Electronic copy available at: https://ssrn.com/abstract=3697288
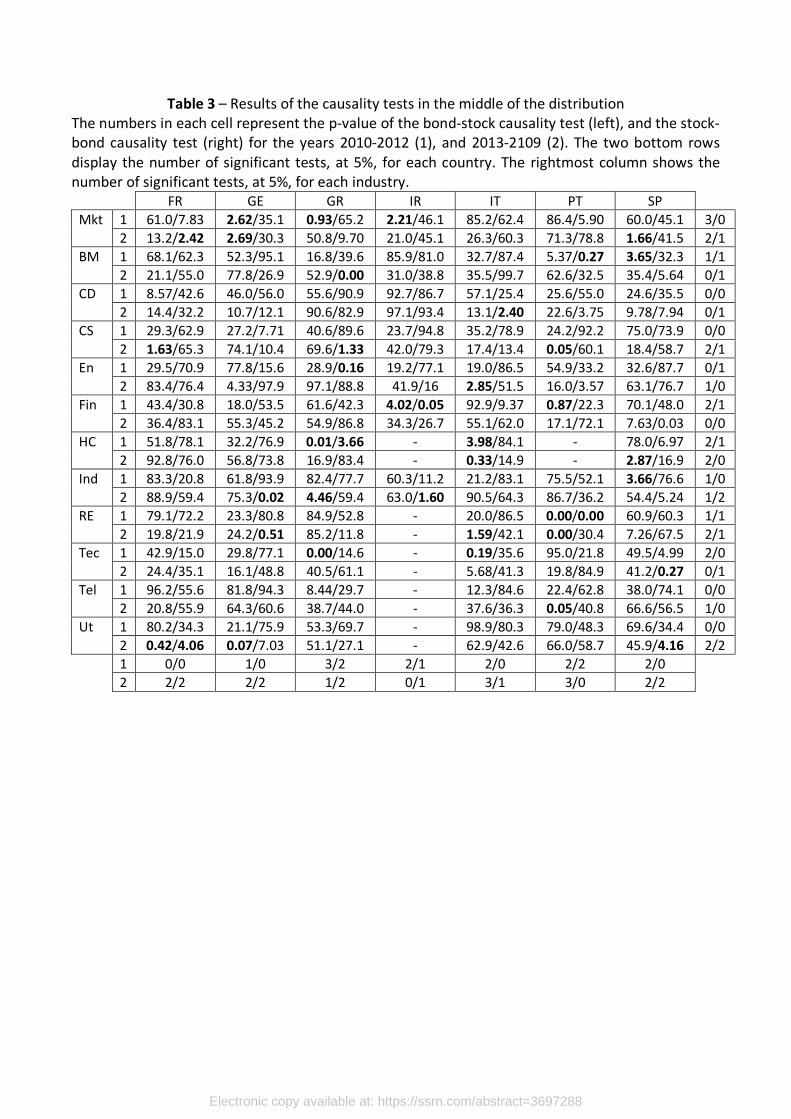
Table 3 – Results of the causality tests in the middle of the distribution
The numbers in each cell represent the p-value of the bond-stock causality test (left), and the stock-
bond causality test (right) for the years 2010-2012 (1), and 2013-2109 (2). The two bottom rows
display the number of significant tests, at 5%, for each country. The rightmost column shows the
number of significant tests, at 5%, for each industry.
FR GE GR IR IT PT SP
Mkt 1 61.0/7.83 2.62/35.1 0.93/65.2 2.21/46.1 85.2/62.4 86.4/5.90 60.0/45.1 3/0
2 13.2/2.42 2.69/30.3 50.8/9.70 21.0/45.1 26.3/60.3 71.3/78.8 1.66/41.5 2/1
BM 1 68.1/62.3 52.3/95.1 16.8/39.6 85.9/81.0 32.7/87.4 5.37/0.27 3.65/32.3 1/1
2 21.1/55.0 77.8/26.9 52.9/0.00 31.0/38.8 35.5/99.7 62.6/32.5 35.4/5.64 0/1
CD 1 8.57/42.6 46.0/56.0 55.6/90.9 92.7/86.7 57.1/25.4 25.6/55.0 24.6/35.5 0/0
2 14.4/32.2 10.7/12.1 90.6/82.9 97.1/93.4 13.1/2.40 22.6/3.75 9.78/7.94 0/1
CS 1 29.3/62.9 27.2/7.71 40.6/89.6 23.7/94.8 35.2/78.9 24.2/92.2 75.0/73.9 0/0
2 1.63/65.3 74.1/10.4 69.6/1.33 42.0/79.3 17.4/13.4 0.05/60.1 18.4/58.7 2/1
En 1 29.5/70.9 77.8/15.6 28.9/0.16 19.2/77.1 19.0/86.5 54.9/33.2 32.6/87.7 0/1
2 83.4/76.4 4.33/97.9 97.1/88.8 41.9/16 2.85/51.5 16.0/3.57 63.1/76.7 1/0
Fin 1 43.4/30.8 18.0/53.5 61.6/42.3 4.02/0.05 92.9/9.37 0.87/22.3 70.1/48.0 2/1
2 36.4/83.1 55.3/45.2 54.9/86.8 34.3/26.7 55.1/62.0 17.1/72.1 7.63/0.03 0/0
HC 1 51.8/78.1 32.2/76.9 0.01/3.66 - 3.98/84.1 - 78.0/6.97 2/1
2 92.8/76.0 56.8/73.8 16.9/83.4 - 0.33/14.9 - 2.87/16.9 2/0
Ind 1 83.3/20.8 61.8/93.9 82.4/77.7 60.3/11.2 21.2/83.1 75.5/52.1 3.66/76.6 1/0
2 88.9/59.4 75.3/0.02 4.46/59.4 63.0/1.60 90.5/64.3 86.7/36.2 54.4/5.24 1/2
RE 1 79.1/72.2 23.3/80.8 84.9/52.8 - 20.0/86.5 0.00/0.00 60.9/60.3 1/1
2 19.8/21.9 24.2/0.51 85.2/11.8 - 1.59/42.1 0.00/30.4 7.26/67.5 2/1
Tec 1 42.9/15.0 29.8/77.1 0.00/14.6 - 0.19/35.6 95.0/21.8 49.5/4.99 2/0
2 24.4/35.1 16.1/48.8 40.5/61.1 - 5.68/41.3 19.8/84.9 41.2/0.27 0/1
Tel 1 96.2/55.6 81.8/94.3 8.44/29.7 - 12.3/84.6 22.4/62.8 38.0/74.1 0/0
2 20.8/55.9 64.3/60.6 38.7/44.0 - 37.6/36.3 0.05/40.8 66.6/56.5 1/0
Ut 1 80.2/34.3 21.1/75.9 53.3/69.7 - 98.9/80.3 79.0/48.3 69.6/34.4 0/0
2 0.42/4.06 0.07/7.03 51.1/27.1 - 62.9/42.6 66.0/58.7 45.9/4.16 2/2
1 0/0 1/0 3/2 2/1 2/0 2/2 2/0
2 2/2 2/2 1/2 0/1 3/1 3/0 2/2
Electronic copy available at: https://ssrn.com/abstract=3697288
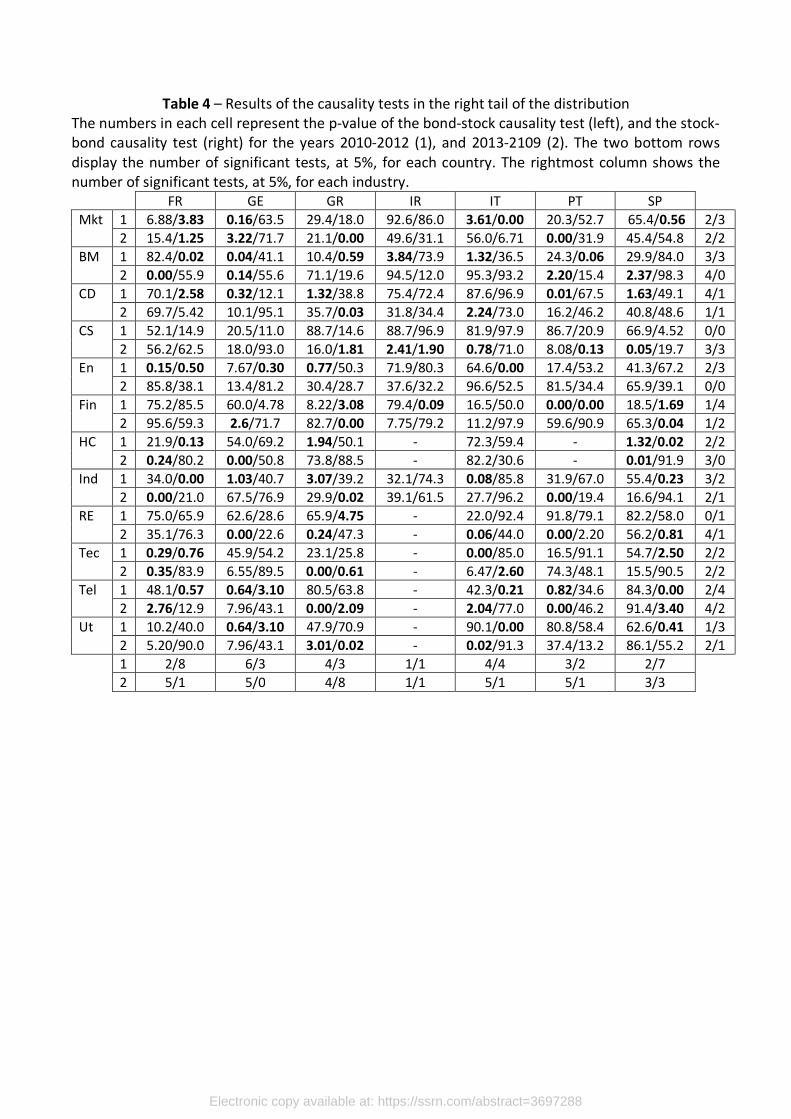
Table 4 – Results of the causality tests in the right tail of the distribution
The numbers in each cell represent the p-value of the bond-stock causality test (left), and the stock-
bond causality test (right) for the years 2010-2012 (1), and 2013-2109 (2). The two bottom rows
display the number of significant tests, at 5%, for each country. The rightmost column shows the
number of significant tests, at 5%, for each industry.
FR GE GR IR IT PT SP
Mkt 1 6.88/3.83 0.16/63.5 29.4/18.0 92.6/86.0 3.61/0.00 20.3/52.7 65.4/0.56 2/3
2 15.4/1.25 3.22/71.7 21.1/0.00 49.6/31.1 56.0/6.71 0.00/31.9 45.4/54.8 2/2
BM 1 82.4/0.02 0.04/41.1 10.4/0.59 3.84/73.9 1.32/36.5 24.3/0.06 29.9/84.0 3/3
2 0.00/55.9 0.14/55.6 71.1/19.6 94.5/12.0 95.3/93.2 2.20/15.4 2.37/98.3 4/0
CD 1 70.1/2.58 0.32/12.1 1.32/38.8 75.4/72.4 87.6/96.9 0.01/67.5 1.63/49.1 4/1
2 69.7/5.42 10.1/95.1 35.7/0.03 31.8/34.4 2.24/73.0 16.2/46.2 40.8/48.6 1/1
CS 1 52.1/14.9 20.5/11.0 88.7/14.6 88.7/96.9 81.9/97.9 86.7/20.9 66.9/4.52 0/0
2 56.2/62.5 18.0/93.0 16.0/1.81 2.41/1.90 0.78/71.0 8.08/0.13 0.05/19.7 3/3
En 1 0.15/0.50 7.67/0.30 0.77/50.3 71.9/80.3 64.6/0.00 17.4/53.2 41.3/67.2 2/3
2 85.8/38.1 13.4/81.2 30.4/28.7 37.6/32.2 96.6/52.5 81.5/34.4 65.9/39.1 0/0
Fin 1 75.2/85.5 60.0/4.78 8.22/3.08 79.4/0.09 16.5/50.0 0.00/0.00 18.5/1.69 1/4
2 95.6/59.3 2.6/71.7 82.7/0.00 7.75/79.2 11.2/97.9 59.6/90.9 65.3/0.04 1/2
HC 1 21.9/0.13 54.0/69.2 1.94/50.1 - 72.3/59.4 - 1.32/0.02 2/2
2 0.24/80.2 0.00/50.8 73.8/88.5 - 82.2/30.6 - 0.01/91.9 3/0
Ind 1 34.0/0.00 1.03/40.7 3.07/39.2 32.1/74.3 0.08/85.8 31.9/67.0 55.4/0.23 3/2
2 0.00/21.0 67.5/76.9 29.9/0.02 39.1/61.5 27.7/96.2 0.00/19.4 16.6/94.1 2/1
RE 1 75.0/65.9 62.6/28.6 65.9/4.75 - 22.0/92.4 91.8/79.1 82.2/58.0 0/1
2 35.1/76.3 0.00/22.6 0.24/47.3 - 0.06/44.0 0.00/2.20 56.2/0.81 4/1
Tec 1 0.29/0.76 45.9/54.2 23.1/25.8 - 0.00/85.0 16.5/91.1 54.7/2.50 2/2
2 0.35/83.9 6.55/89.5 0.00/0.61 - 6.47/2.60 74.3/48.1 15.5/90.5 2/2
Tel 1 48.1/0.57 0.64/3.10 80.5/63.8 - 42.3/0.21 0.82/34.6 84.3/0.00 2/4
2 2.76/12.9 7.96/43.1 0.00/2.09 - 2.04/77.0 0.00/46.2 91.4/3.40 4/2
Ut 1 10.2/40.0 0.64/3.10 47.9/70.9 - 90.1/0.00 80.8/58.4 62.6/0.41 1/3
2 5.20/90.0 7.96/43.1 3.01/0.02 - 0.02/91.3 37.4/13.2 86.1/55.2 2/1
1 2/8 6/3 4/3 1/1 4/4 3/2 2/7
2 5/1 5/0 4/8 1/1 5/1 5/1 3/3
Electronic copy available at: https://ssrn.com/abstract=3697288