Embed Size (px)
Citation preview
Information Visualization Course
Informatica UmanisticaUniversità di Pisa
Lecture I – 24th February 2010
Emanuele RuffaldiPERCRO - Scuola Superiore S.Anna

Term Visualizeform a mental image of something
to make perceptible to the mind
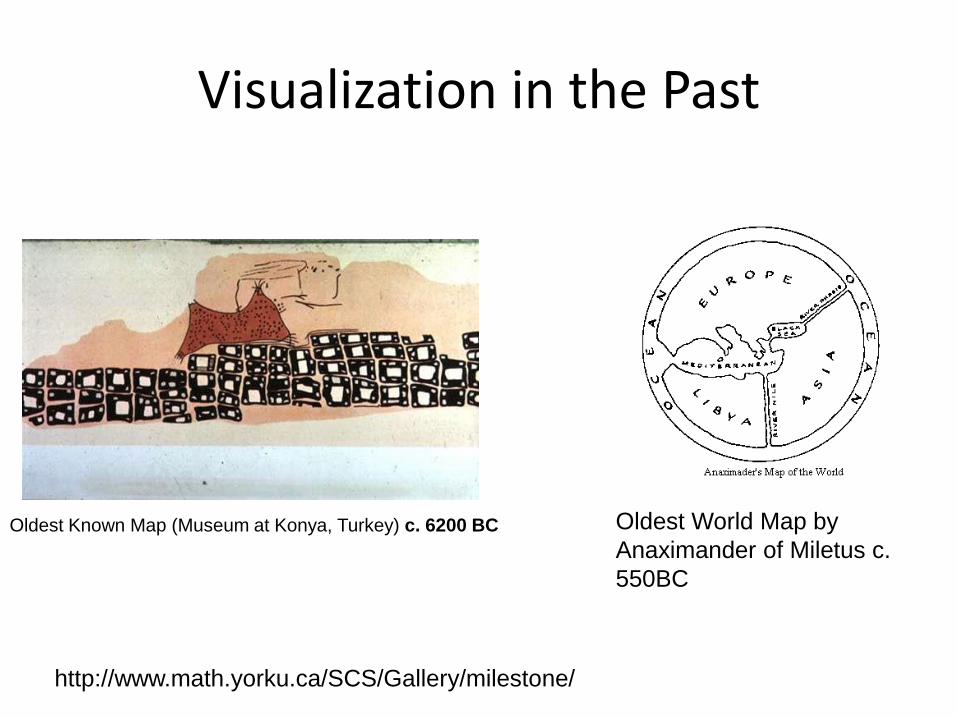
Visualization in the Past
http://www.math.yorku.ca/SCS/Gallery/milestone/
Oldest Known Map (Museum at Konya, Turkey) c. 6200 BC Oldest World Map by
Anaximander of Miletus c.
550BC

Visualization Today
Evolution of Storage
MIT, Real Time Rome Rosling @ TED
New York Tube (NYT)
RoamBi
Enabling Technology Laboratory in the
UAB School of Engineering
Information Visualization
The purpose of
visualization is to
convey information to
people through
graphical means
Pat Hanrahan, Barbara Tverski, et al.
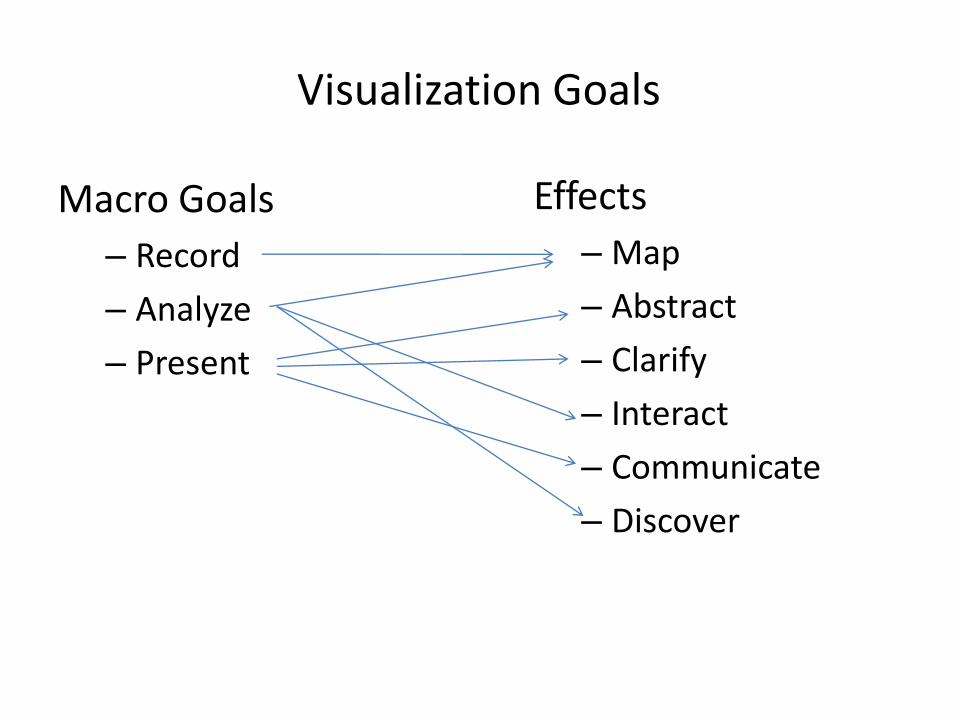
Visualization Goals
Macro Goals
– Record
– Analyze
– Present
Effects
– Map
– Abstract
– Clarify
– Interact
– Communicate
– Discover

Clarify
http://homepage.ntlworld.com/clivebillson/tube/tube.html
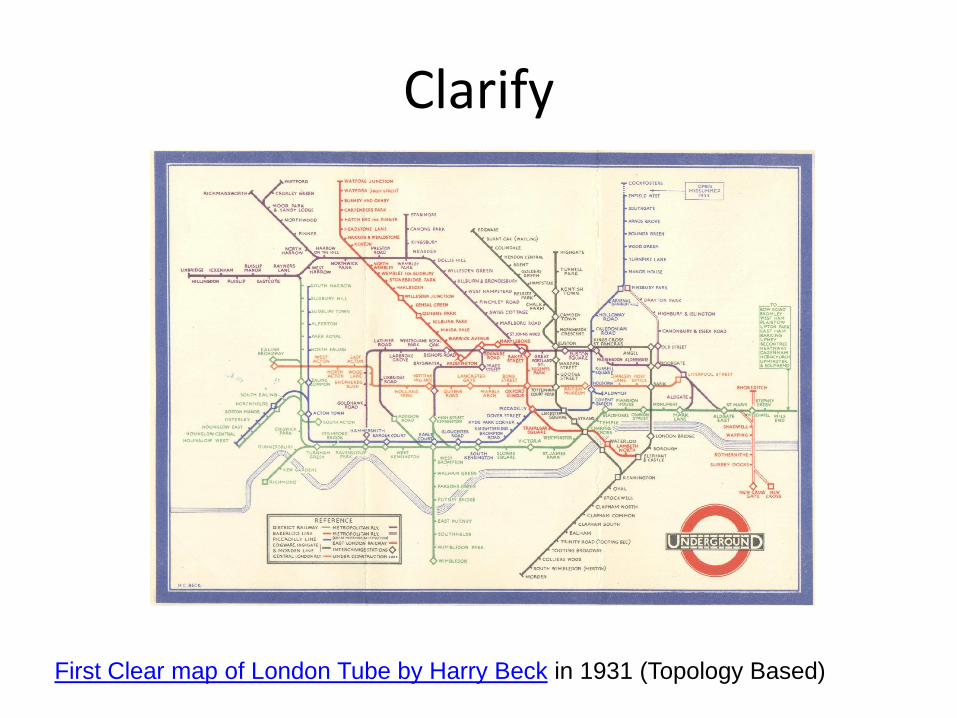
Clarify
First Clear map of London Tube by Harry Beck in 1931 (Topology Based)

Challenges
• Information Explosion– Increasing amount of data
– How to Select?
• Visual Form – Many different ways of representing data
– Which Visualization?
• Interactivity– Interactivity improves visualization
– Which Interaction metaphor?
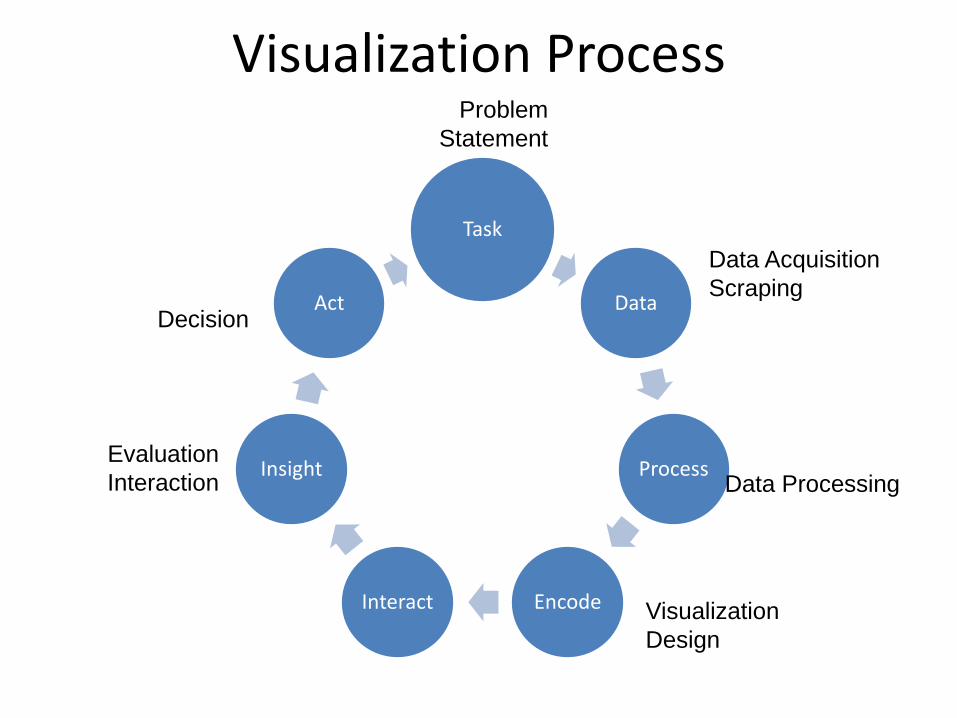
Visualization Process
Task
Data
Process
EncodeInteract
Insight
Act
Data Acquisition
Scraping
Visualization
Design
Evaluation
Interaction Data Processing
Decision
Problem
Statement
Information Model
• Entities
– Single elements with Attributes
• Relationships
– Associations between Entities
– With their Attributes
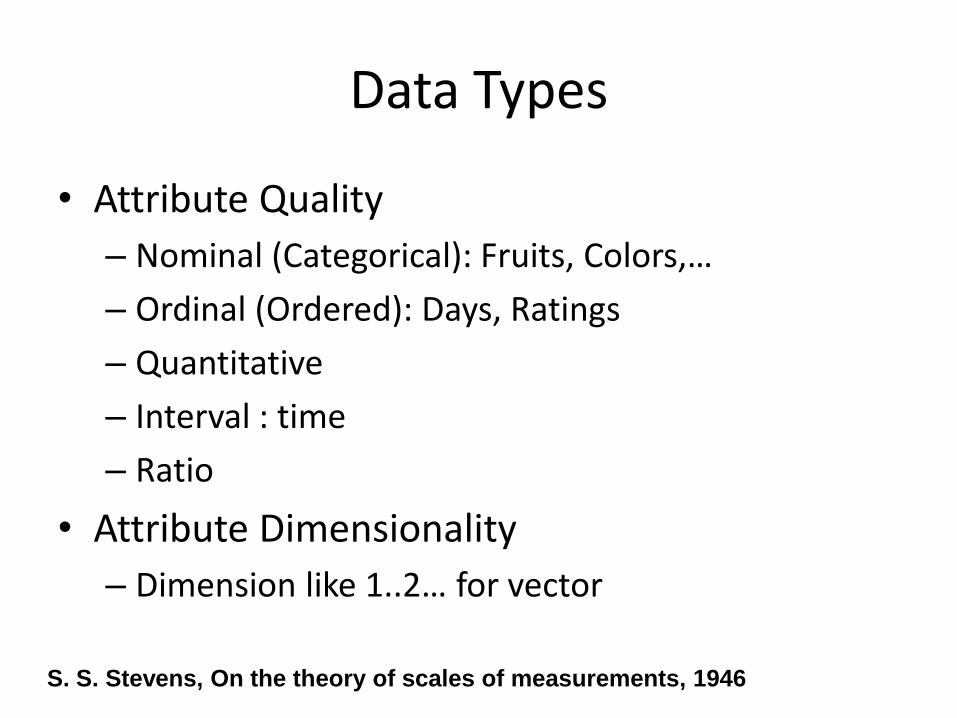
Data Types
• Attribute Quality
– Nominal (Categorical): Fruits, Colors,…
– Ordinal (Ordered): Days, Ratings
– Quantitative
– Interval : time
– Ratio
• Attribute Dimensionality
– Dimension like 1..2… for vector
S. S. Stevens, On the theory of scales of measurements, 1946
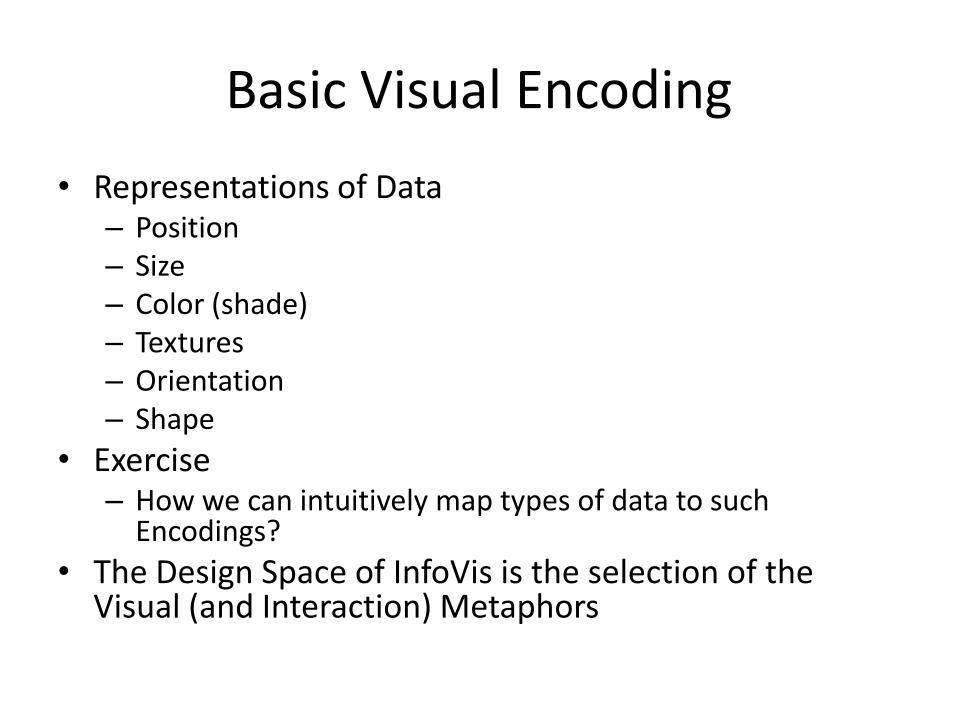
Basic Visual Encoding
• Representations of Data– Position– Size– Color (shade)– Textures– Orientation– Shape
• Exercise– How we can intuitively map types of data to such
Encodings?
• The Design Space of InfoVis is the selection of the Visual (and Interaction) Metaphors
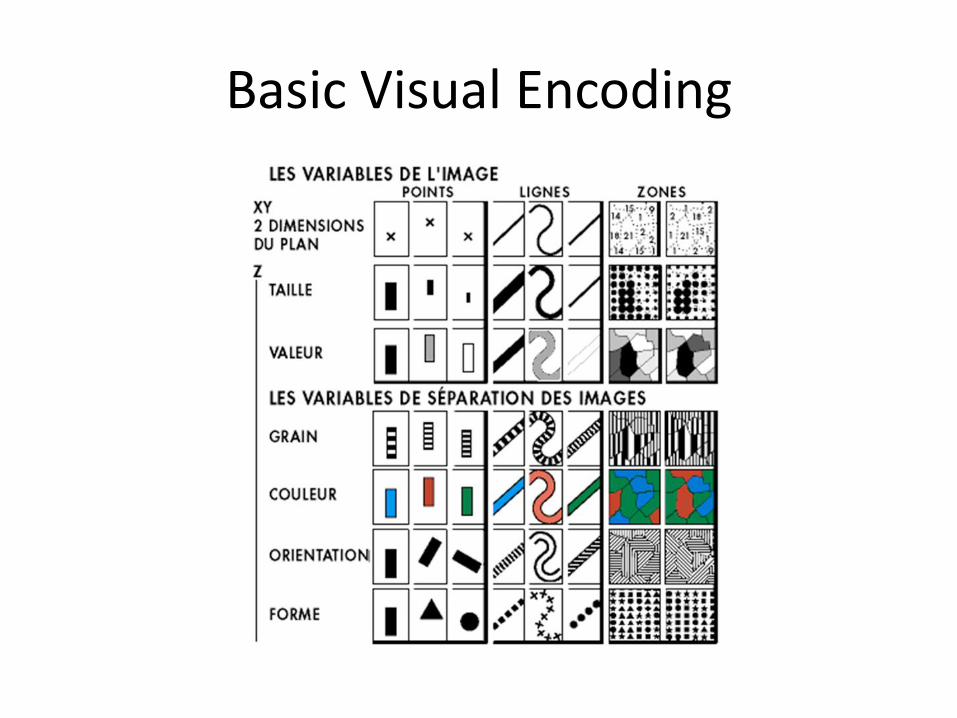
Basic Visual Encoding

COURSE STRUCTURE

Objective of this Course
Provide the principles and the technique for making effective visualizations

Structure of the Course
Foundation
Perception
Cognition
Interaction
Design
Methods
Charts
Maps
Graphs and Nets
High Dimensions
Landscapes
Tools
Web
Map
High Level
Applications
Text
Patents
Social
Web

Foundation
Perception
Cognition
Design
Interaction

• Design principles for Statistics Graphs
• Varieties of Graphs
Charts
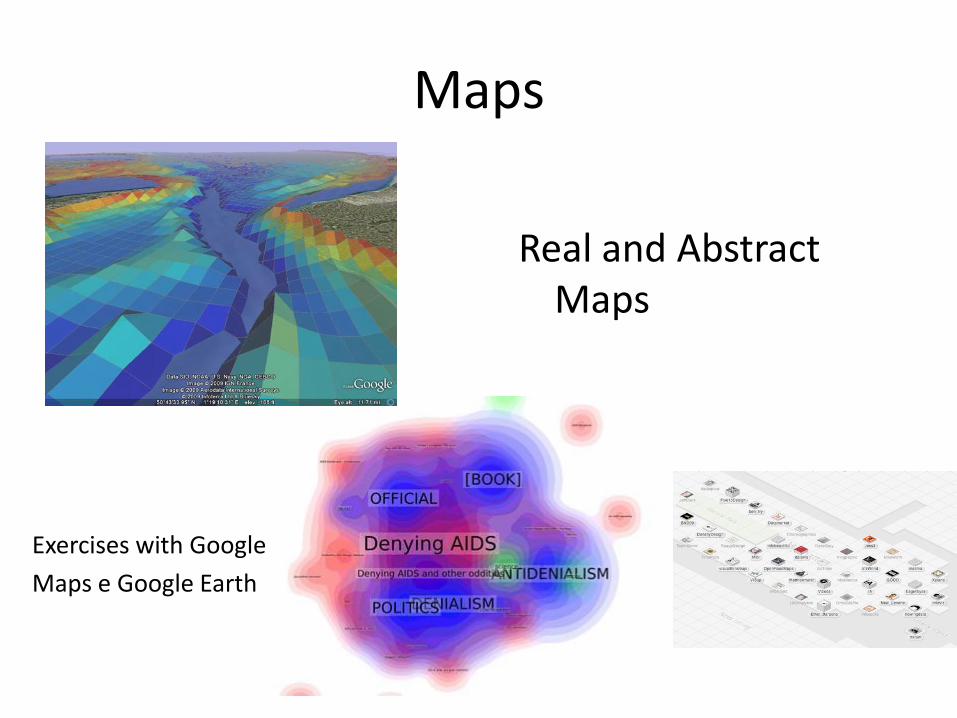
Maps
Real and Abstract Maps
Exercises with Google
Maps e Google Earth
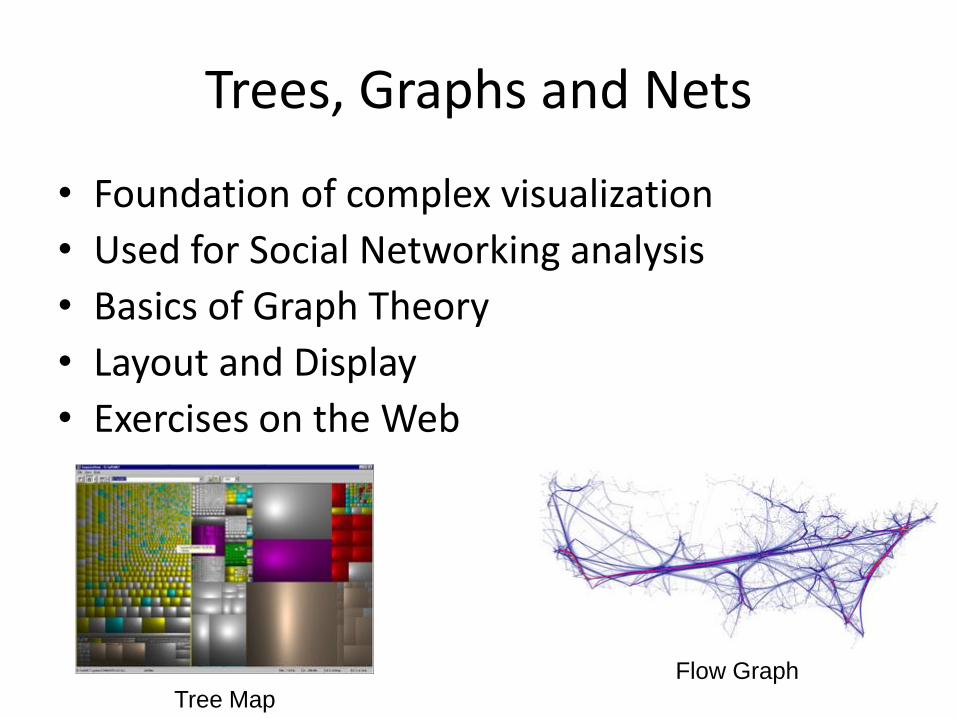
Trees, Graphs and Nets
• Foundation of complex visualization
• Used for Social Networking analysis
• Basics of Graph Theory
• Layout and Display
• Exercises on the Web
Flow Graph
Tree Map
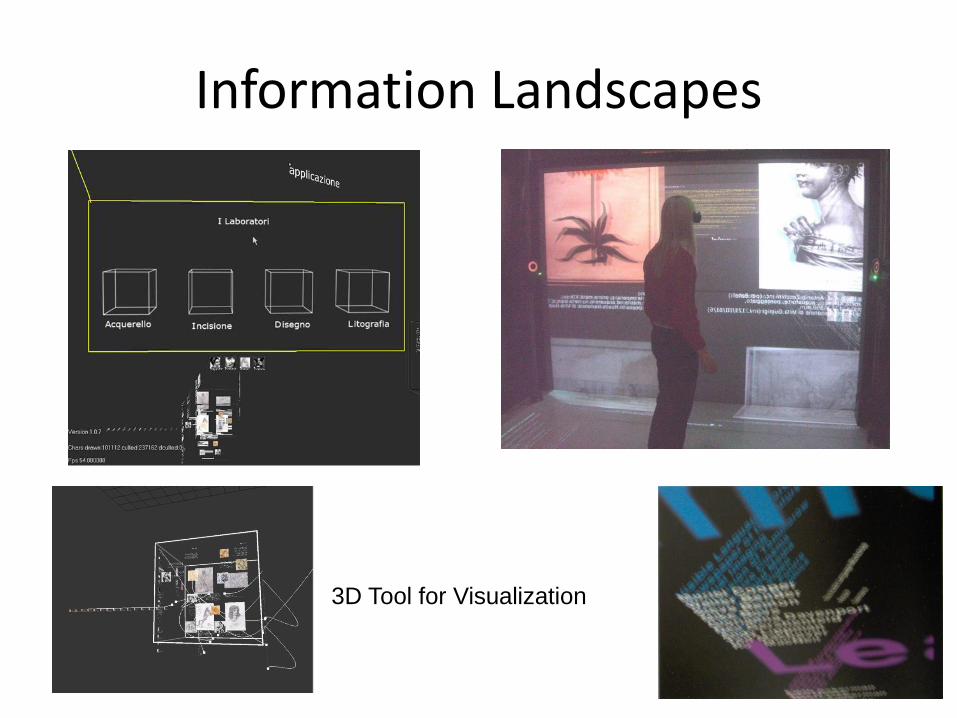
Information Landscapes
3D Tool for Visualization

Text Analysis
Application of principles to text corpora
Exercises on known large corpora as Shakespeare, Homerus …

Patent Analysis
• Case Study on use of Visualization for patent data
• Graphs and Maps based
• Citation Analysis
Lectures
• Lecture Types
– Theoretical
– Practical
– Exercises
– Project Discussion
• Relevant Scientific Papers

Textbook
• Textbook– Information Visualization
Perception for Design (2nd), Colin Ware (2004) Morgan Kauffmann
– This first lecture is covered in Chapter 1
• Interesting Books– Envisioning Information,
Edward Tufte

Practice
• Web Visualization– HTML + JavaScript (Low)– Processing.js
• Maps– Google Map e Google Earth
• High Level Tools– Mondrian (Java Based)
• 3D Visualization– Information Landscape– WebGL
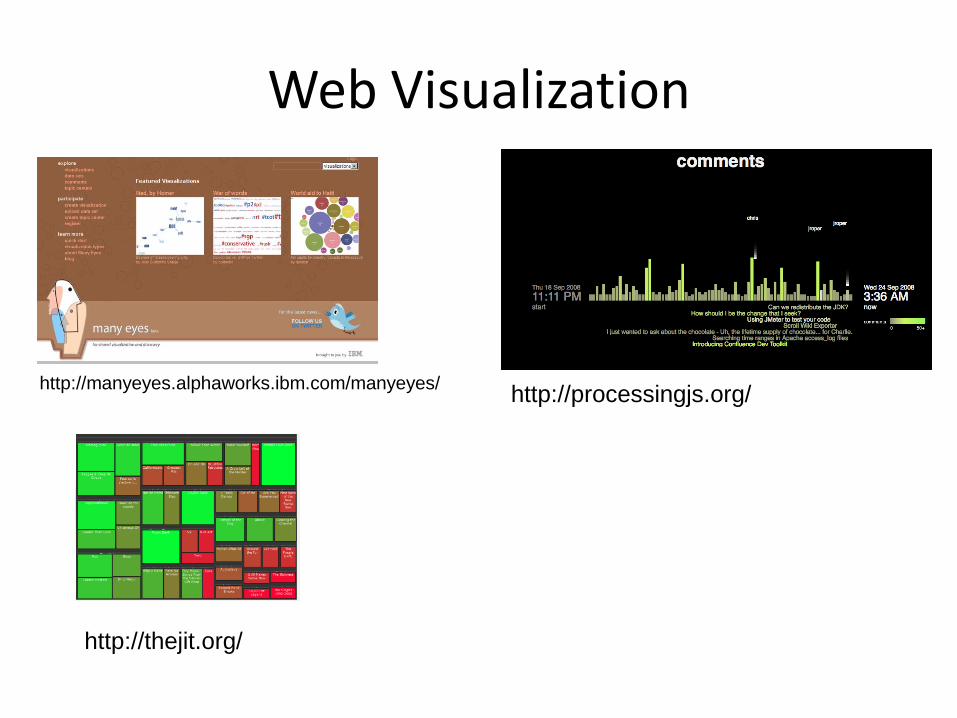
Web Visualization
http://manyeyes.alphaworks.ibm.com/manyeyes/http://processingjs.org/
http://thejit.org/
Requirements of the Course
• Passion about Information and Visualization
• Web Concepts and Tools
• Basics of Programming
• Data Concepts

Exam
• Project developed during the Course
• Integrated with one or two questions
Contact Information
• Emanuele Ruffaldi– Email [email protected]
– Address• PERCRO Scuola Superiore S.Anna, Via Martiri 11
• Schedule– Mer 16.15-17.45
– Ven 14.00-16.00
– Class: FIB-I Aula I - Polo didattico via Buonarroti
• Website http://www.percro.org/corsi/infovis10/

These slides are subject to the LicenseCreative Commons
Attribution-Noncommercial-Share Alike 2.5 Italy