Embed Size (px)
Citation preview
The advantages of the rota t ing sample holder are as follows :
(1) More reliable analytical intensi ty data can be obtained for nonhomogeneous samples.
(2) The sample holder is easy to operate, and it is easily assembled, disassembled, or adjusted.
(3) The sample holder can be designed to fit any sample characteristic. The only l imitat ion is that sample and holder cannot be larger than the spec- t rometer drawer.
(4) The mechanism is compact since gearing is designed to fit into the holder with the sample and other fixtures.
(5) The contra-angle U may be oriented at any angle desired.
(6) The sample holder can be used without modi- fication when samples do not require rotation.
1. E. P. Bertia and 1~. J. Longobueco, Advan. X-Ray Anal. 5, " 447 (1962).
2. C'Turntable Sample Holder for X-Ray Spectroscopy, J~ The Spex Speaker, Metuchen, N. J., Spex Industries, Inc., Vol.
5, No. 2, p. 6 (June 1960). 3. T. C. Cullen, Anal. Chem. 33, 1342 (1961).
Infrared and Proton Nuclear Magnetic Resonance Spectra of Hydrazinium Phosphates
Jan H. Vis and Phyllis Meinke
The Standard Oil Company (Ohio), Cleveland, Ohio
(Received 17 July 1968; revision received 2 October 1968)
Very little is known about the products f rom re- actions between phosphate esters and hydrazines. We found that phosphate esters with the general formula (RO)3P=O, R = m e t h y l , hydrogen, and /o r pheny], react with hydrazine or its phenyl- and methyl-subst i tuted derivatives to fo rm hydrazin ium phosphates. * I n f r a r e d and proton nuclear magnetic resonance spectroscopy (NMR) proved to be indis- pensable tools in establishing the s t ructure and sub- sti tution pa t te rns of these salts. This communication contains characterist ic spectroscopic data for ten new hydrazin ium phosphates which were obtained. The salts are presented in the spectral data Tables I and I I along with Roman numerals by which they are designated in the discussion.
S t ruc tura l elucidation of the salts by ir p r imar i ly rests on the presence and location of N H and /o r
N H stretching bands of the cation. Characteristic ir vibrations are presented in TaMe I.
• A paper discussing these reactions will be published shortly.
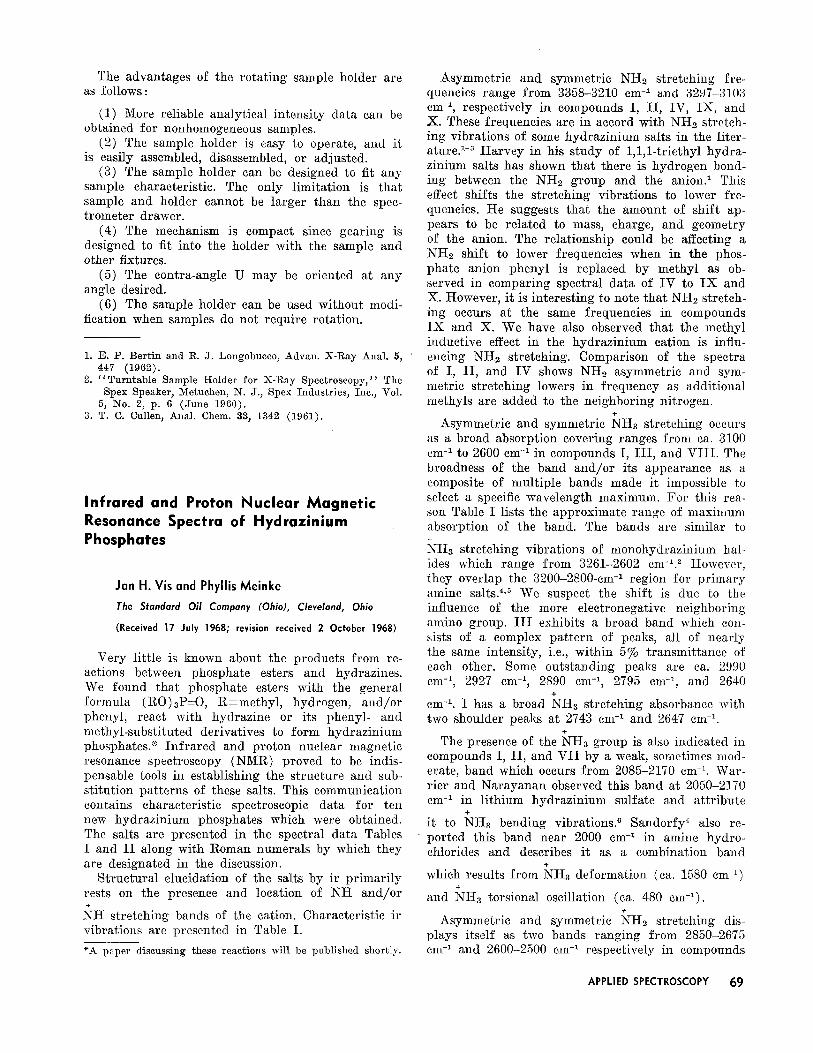
Asymmetr ic and symmetr ic NH2 stretching fre- quencies range f rom 3358-3210 cm -1 and 3297-3103 cm -1, respectively in compounds 2, I I , IV, IX, and X. These frequencies are in accord with NH2 stretch- ing vibrations of some hydrazin ium salts in the liter- ature. 1-3 H a r v e y in his s tudy of 1,1,1-triethyl hydra- zinium salts has shown tha t there is hydrogen bond- ing between the NHe group and the anion. 1 This effect shifts the stretching vibrat ions to lower fre- quencies. He suggests that the amount of shift ap- pears to be related to mass, charge, and geometry of the anion. The relationship could be affecting a NH2 shift to lower frequencies when in the phos- phate anion phenyl is replaced by methyl as ob- served in comparing spectral data of I V to I X and X. However, it is interesting to note tha t NIt2 stretch- ing occurs at the same frequencies in compounds I X and X. We have also observed tha t the methyl inductive effect in the hydraz in ium cation is influ- encing NH2 stretching. Comparison of the spectra of I, I I , and I V shows NH2 asymmetr ic and sym- metric s tretching lowers in f requency as addit ional methyls are added to the neighboring nitrogen.
÷
Asymmetr ic and symmetr ic NH3 stretching occurs as a broad absorption covering ranges f rom ca. 3100 cm -1 to 2600 cm -~ in compounds I, I I I , and V I I I . The broadness of the band and /o r its appearance as a composite of mult iple bands made it impossible to select a specific wavelength maximum. For this rea- son Table I lists the approximate range of maximum absorption of the band. The bands are similar to +
NIt3 stretching vibrations of n~onohydrazinium hal- ides which range f rom 3261-2602 cm-1. 2 However, they overlap the 3200-2800-cm -1 region for p r imary amine salts. 4,~ We suspect the shift is due to the influence of the more eleetronegative neighboring amino group. I I I exhibits a broad band which con- sists of a complex pa t t e rn of peaks, all of near ly the same intensity, i.e., within 5% t ransmit tance of each other. Some outstanding peaks are ca. 2990 cm-% 2927 era-% 2890 cm -~, 2795 era-% and 2640
+
cm -1. I has a broad NH8 stretching absorbance with two shoulder peaks at 2743 cm -~ and 2647 am -1.
+
The presence of the NH3 group is also indicated in compounds I, I I , and V I I by a weak, sometimes mod- erate, band which occurs f rom 2085-2170 cm -1. War- r ier and Narayanan observed this band at 2050-2170 cm -~ in l i thium hydrazin ium sulfate and at t r ibute
it to ~qI-t~ bending vibrat ions2 Sandorfy 4 also re- ported this band near 2000 cm -1 in amine hydro- chlorides and describes it as a combination band
+
which results f rom NH3 deformat ion (ca. 1580 cm -~) +
and NH3 torsional oscillation (ca. 480 cm-~). +
Asymmetr ic and symmetr ic NH2 stretching dis- plays itself as two bands ranging f rom 2850-2675 em -~ and 2600-2500 cm -~ respectively in compounds
APPLIED SPECTROSCOPY 69
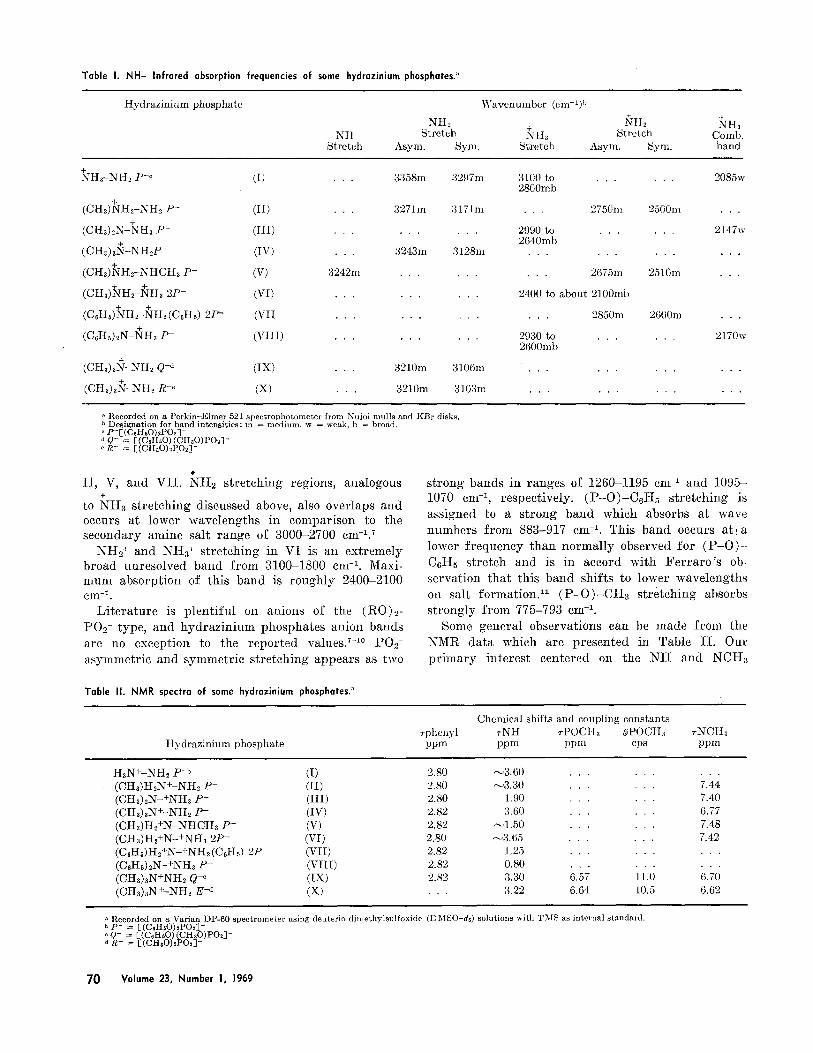
Table I. NH- Infrared absorption frequencies of some hydrazinium phosphates2
Hydrazinium phosphate
NH Stretch
Wavenumber (em-~) b
NH2 Stretch + NHa
Asym. Sym. Stretch
+ NH~
Stretch Asym. Sym.
NHa Comb. band
+ NHa-NH2 p-c (I)
+ (CHa)NH2-NH2 P- (II)
+ (CHa)2N-NHa P- (III)
+ T (CHa)aN-N H=P- (IV) +
(CHa)NH2-NHCHa P - (V) + +
(CHa)NH2-NHa 2P- (VI) + +
(C~Hs)NH2-NH2 (C~Hs) 2 P - (VII +
(C6Hs)2N-NHa P- (VIII)
+ (CHa)aN-NH~ Q-d (ix)
H * (C QaN-NH2 R -~ (X)
3242m
3358m 3297m
3271m 3171m
3243m 3128m
3210m 3106m
3210m 3103m
3100 to . . . 2800mb
. . . 2750m
2990 to . . . 2640mb
. . . 2 6 7 5 m
2400 to about 2100mb
. . . 2850m
2930 to 2600mb
2500m
2510m
2600m
2085w
2147w
• , .
2170w
R e c o r d e d on a P e r k i n - E l m e r 521 s p e c t r o p h o t o m e t e r f rom N u j o l m u l l s a n d K B r disks• b D e s i g n a t i o n for b a n d i n t e n s i t i e s : m = m e d i u m , w = weak , b = broad•
P - [ ( C e H 5 0 ) s P O 2 ] - '~ Q - = [ ( C s H a O ) ( C H 3 0 ) P O 2 ] - o R - = [ ( C H , O ) 2 p 0 2 ] -
÷
l [ , V, and V i i . NH2 s t re tch ing regions, analogous
÷ H to N a s t r e tch ing discussed above, also overlaps a nd occurs a t lower wavelengths in compar ison to the secondary amine salt r ange of 3000-2700 cm-~. 7
NH2 + and NHa ÷ s t re tch ing in VI is an ex t remely broad unreso lved b a n d f rom 3100-1800 cm -~. Maxi- m u m absorp t ion of this b a n d is rough ly 2400-2100 c n l - l •
L i t e r a t u r e is p l e n t i f u l on anions of the (RO)e- P02- type, and h y d r a z i n i u m phosphates an ion bands
are no except ion to the repor ted values. 7-1° POe- asymmet r ic and symmet r i c s t r e tch ing appears as two
s t rong bands in ranges of 1260-1195 cm ~ and 1095- 1070 em -~, respectively• ( P - 0 ) - C 6 H 5 s t re tch ing is assigned to a s t rong b a n d which absorbs at wave
n u m b e r s f rom 883-917 cm -~. This b a n d occurs atl a lower f r e que nc y t h a n n o r m a l l y observed for ( P - O ) - C6H5 s t re tch a nd is in accord wi th F e r r a r o ' s ob- serva t ion tha t this b a n d shif ts to lower wavelengths
on salt f o r m a t i o n 2 ~ ( P - O ) - C H a s t re tch ing absorbs s t rong ly f rom 775-793 cm -z.
Some genera l observat ions can be made f rom the
NMR data which are p resen ted in Table I I . Our p r i m a r y in te res t centered on the N H and NCHa
Table II. NMR spectra of some hydrazinium phosphates2
Ilydrazinium phosphate
ChemicM shifts and coupling constants rphenyl TNH T P O C H a O P O C H a TNCHa ppm ppm ppm cps ppm
H3N+_NH~ p-b (I) (CHa)H2N+-NIt2 P- (II) (CHa)2N-+NHa P- (III) (CHa)aN+-NH2 P - (IV) (CHa)H2+N-NHCHa P- (V) (CHa)H2+N-+NHa 2P- (VI) (CsHs)H2+N-+NH2 (C6H5) 2 P - (VII) (C~Hs) 2N-+NHa P- (VIII) (CHa)aN+NH2 Q-° (IX) (CHa)aN+-NH: E -d (X)
2.80 ~-~3.60 2.80 ~3.30 2.80 1.90 2.82 3.60 2.82 HI.50 2.80 ~3.65 2.82 1.25 2.82 0.80 2.82 3.30 • . . 3.22
6.57 11.0 6.64 10.5
7.44 7.40 6.77 7.48 7.42
6.70 6.62
R e c o r d e d on a V a r i a n D P - 6 0 s p e c t r o m e t e r us ng d e u t e r i o d m e t h v l s u l f o x i d e b p- = [(C~H~O)sPO2]- - 0- = [(C~H~O) (CH~O)PO~]-
d R- = [(CHsO)2PO~]-
( D M S O - d 6 ) so lu t ions w i t h T ~ J S as i n t e r n a l s t a n d a r d •
70 Volume 23, Number 1, 1969
signals f rom the cation for suppor t of the conclusions reached in the ir spectral interpretat ion.
I t is difficult to draw specific conclusions as to the effect of different degrees of substitution on the N i t chemical shift because of various inter- and intramolecu]ar interactions of the N i l protons in solution. We compared the N i l chemical shifts in I, I I , I I I , and IV. I, I I , and I V have values within the range of rNi l=4 .00-3 .40 found for 1,1,1-triethyl hydrazinium chloride at different concentrations2 I I I deviates and falls outside this range. Concentra- tion effect of 0.60 ppm on the N H chemical shift is too small to account for a downfield shift of 1-1.5 ppm. The cause is more likely due to a more localized charge on the nonsubsti tuted ni t rogen atom. This is supported by ir which shows absence of uncharged Ni l stretching in I I I , cont rary to I, I I , and IV. A similar observation is made by Aubagnac, et alY who suggest on the basis of NMR evidence tha t un- sym. methyl pheny]hydrazinium picrate is proto- nated at the Nil2 group.
V I I and V I I I show an expected difference in N H shift because of differences in possibilities to de- localize the positive charges.
The NCHa signals are all very sharp and narrow, indicating equivalence of the methyl groups within the hydrazinium cations. In IV, IX, and X the charge is located on the one substi tuted nitrogen, result ing in higher degree of NCIl3 deshielding with consequently a lower r value.
In addition to NCIl3 in I X and X we see methyl groups of the phosphate anion at r6.57 and r6.64, respectively. These methyl groups appear as doublets with ~ values of 11 and 10.5 cps respectively be- cause of spin-spin coupling with 8~p.
I t is interesting to compare I V with its phos- phonium and arsonium analogues (CII3)~P÷-NII2C1 - and (CII3)3As÷-NII2C1 -. Sisler 1~ compared the CH3 chemical shifts of the la t ter compounds with each
Table III. NMR spectra of some arsonium, phosphonium, ammonium, and hydrazinium salts.
Chemie~d shifts rCHa ArCHa
Compound ppm ppm
(CH3) aAs+-CI-I3 I - 8.00~ + +0.21"
(CH3)3As-NH2 C1- 8.213
(cH~)~i~-cm I- s.o8~ + +0.01"
(CH3)~P-NH2 C1- 8 .09J +
(CH~)~N-CH~ C]- 6.82~ + ~0.22 b
(CH3)3N-NH2 I - 6 .60J +
(CH3)3N-CHa C1- 6.82~ + --0.05 u
(CH3)3N-NH2 P ~" 6 .77J
D a t a froln Ref . 13. b R e c o r d e d on a V a r i a n I ) P - 6 0 s p e c t r o m e t e r u s i n g D~ISO-d~ so lu t ions w i t h
T h I S as i n t e r n a l s t a n d a r d . P - = [ ( C 6 H 6 0 ) 2 P O ~ ] -
other and with those of t e t ramethyl phosphonium iodide and te t ramethylarsonium iodide. These chemi- cal shifts together with those of te t ramethylam- monium chloride, IV, and t r imethyl-hydrazinium iodide are given in Table I I I .
We see that wCil3 in both the qua te rnary am- monium chloride and the hydrazin ium phosphate or iodide is shifted downfield in comparison with its arsonium and phosphonium analogues. This is very likely due to the differences in electronegativity of the central atoms.
Replacement of a Cila group in the qua te rnary arsonium and phosphonium salts by the more elee- t ronegative Ni le group does not result in an ex- pected downfield shift of TCHs, on the cont rary a small upfield shift is found. Sisler suggests tha t this shift is caused by d~-p~ bonding between ar- senic and nitrogen, and phosphorus and nitrogen which more than compensates the electronegative action of the Nil2 group. I lowever in ammonium salts replacement of CHa by Nil2 causes a small downfield shift. Absence of d~-p~ bonding between the two nitrogen atoms prevents possible compensa- tion of the deshielding effect of Nil2 which supports Sisler 's suggestions.
Cont ra ry to the data of the arsonium and phos- phonium salts, 14 the picture in ammonium or hy- drazinium salts is more complicated because of con- centrat ion effects not only for the amino groups, but also for the Cila group, which in tu rn depend on the character of the anion. 1,~5
The authors wish to thank Dr. R. J. DeGray for his continuous and s t imulat ing interest. They thank F r a n k Knoll and Herb Grossman for determination of the NMI~ spectra in this work.
]. M. C. Harvey and D. E. Kramm, Appl. Spectry. 18, 140 (1964).
2. J. C. Declus and D. P. Pearson, 5. Am. Chem. Soc. 75, 2436 (1953).
3. J. C. Declus and E. C. Gilbert, J . Am. Chem. Soe. 80, 3872 (1958).
4. C. Brissette and C. Sandorfy, Can. J'. Chem. 38, 34 (1960). 5. B. Chenor and C. Sandorfy, Can. 5. Chem. 36, 1181 (1958). 6. A. V. R. Warr ier and P. S. Igarayanan, Proc. Indian
Acad. Sci. Sect. A 64, 254 (1966). 7. It. B. Colthup, L. It . Da]y, and S. E. Wilberly, Introduc-
tion to Infrared and Raman Spectroscopy (Academic Press, Inc., New York, 1964), pp. 282, 301.
8. L. J. Bellamy and L. Beeeher, J . Chem. Soe. 1953, 728 (1953).
9. C. L. Thomas and R. A. Chittenden, Chem. Ind. (Lon- don) 1913 (1961).
10. D. E. C. Cobridge, J. Appl. Chem. 6, 456 (1956). 11. J. R. Ferraro, 5. Inorg. bIuel. Chem. 24, 475 (1962). 12. 5. L. Aubagnac, J. Elguero, and R. Jacquier, Compt.
Rend. Acad. Set. Paris, Ser. C t.263, 739 (1966). 13. H. H. Sisler and S. R. Ja in , $norg. Chem. 7, 104 (1968). 14. C. E. Griffen and hi. Gordon, J. Organomet. Chem. 3, 414
(1965). 15. R. L. Buckson and S. G. Smith, J. Phys. Chem. 68, ]875
(J964).
APPLIED SPECTROSCOPY 71


![The shape of the cosmic ray proton spectrum - arXiv · 2019. 11. 5. · Hardenings in the proton and helium spectra were then directly observed by PAMELA [2], that reported the existence](https://img.pdfslide.net/doc/110x75/60fa8b6494d81414d935b740/the-shape-of-the-cosmic-ray-proton-spectrum-arxiv-2019-11-5-hardenings-in.jpg)