Embed Size (px)
Citation preview

NASA/TMm2000-210220 ASME-2000-GT-0216
Infrared Low Temperature Turbine Vane
Rough Surface Heat Transfer Measurements
R.J. Boyle, C.M. Spuckler, B.L. Lucci, and W.P. Camperchioli
Glenn Research Center, Cleveland, Ohio
Prepared for the
45th International Gas Turbine and Aeroengine Technical Congress
sponsored by the American Society of Mechanical Engineers
Munich, Germany, May 8-11, 2000
National Aeronautics and
Space Administration
Glenn Research Center
August 2000
https://ntrs.nasa.gov/search.jsp?R=20000082017 2018-04-18T21:27:39+00:00Z

Acknowledgments
The authors wish to thank Dr. James Van Fossen for the two-dimensional computer code used for the
analysis of the conduction losses.
Available from
NASA Center for Aerospace Information7121 Standard Drive
Hanover, MD 21076Price Code: A03
National Technical Information Service
5285 Port Royal RoadSpringfield, VA 22100
Price Code: A03
Available electronically at http://gltrs.grc.nasa.gov/GLTRS

INFRARED LOW TEMPERATURE TURBINE VANE ROUGH
SURFACE HEAT TRANSFER MEASUREMENTS
R,J. Boyle, C.M. Spuckler, B.L. Lucci and W.P. Camperchioli
National Aeronautics and Space Administration
Glenn Research Center
Cleveland, Ohio 44135
ABSTRACT
Turbine vane heat transfer distributions obtained
using an infrared camera technique are described. In-
frared thermography was used because non-contact stir-
face temperature nleasurements were desired. Surface
t,emperatures were S0°C or less. Tests were couducted
in a three vane linear cascade, with inlet pressures be-tween 0.14 and 1.02alln., and exit Math numbers of 0.3.
0.7. and 0.9. for turbulence intensities of apl)roximately1 and 10%. Measurements were taken on the vane suc-
tion side, and on the pressure side leading edge region.
The designs for both the vane and test facility are dis-
cussed. The approach used to account, for conduction
within the vane is described. Midspan heat transfer
distributions are given for the range of test conditions.
Nomenclature
A - Area of heat surface
6)/2 - Friction factor('× Axial chord
D - Leading edge diameter
K Local-to-average heat. flux
f Fraction of radiant energy
Fr Frossling number,NuD/_Gr G rashof number
h Roughness heightI Current
K Thermal conductivityN u Nusselt number
Pr Prandtl number
q Heat nux per unit areaRe Reynolds numberSt Stanton number
Surface distance
T
Tu
.r
32
(
7"
1,J
pO"
Subscripts
A
a
COND
ELEC
EQ1N
IR
M
NET
RAD
RMS
F
SR
V
W
1
"2
Superscripts+
!
Temperature
Turbulence intensity
Voltage
Spatial coordinateMomentum thickness
Emissivity
Transmissivity
Kinelnatic viscosity
ReflectivityStefan-Boltzmann const ant
Ambient
Absolute difference fFOlll mean
Conduction
Electrical
Sand grain equivalentGas inlet
Infrared
Measured
Net to gasRadiation
RMS value
Recovery
Test section surroundingsVane surface
Window
Inlet
Exit
Normalized
Total
Average
NASA/TM--2000-210220 1

INTRODUCTION
I! is importantto understandthe eff('ctsof sur-facerouglmesson turbinebladeheattransfer. Sur-faceroughnessis expectedto increasebladesurfaceh(,attransfer. Whetherbladetemperatureincreases,dependsontile natureof [email protected] tilesurfacerouglmessresultsfromlowthermalconductiv-
ity material deposited onto the blade surface, tile heat
load, and therefore blade temperature, may decrease
due to the thermal resistance of the deposition layer.
If surface roughness results from material erosion, un-
derstanding Blade heat transfer becomes more critical,
since blade strength decreases, and average blade tem-
perature increases due t.o higher gas side heat transfer.
Experimental heat transfer for rough surface tur-
bine blades have been reported by several investigators.
Dunn el a1.(1994), and Blair(1994) used different tech-
niques to measure rotor heat transfer in rotating fa-
cilities. Tarada(1987), Tarada and Suzuki(1993), andAbuaf et al.(1997) reported measurements of vane heat
transfer for rough surfaces. While these tests indicated
higher heat I ransfer for rough surfaces, the heat transfer
ratio between rough and smooth surfaces varied con-
siderably. This may have been due t.o differences in
Reynolds number as well as roughness characteristics.
To help clari_ the conseqnences of surface rough-
hess, a program to measure tile heat transfer on a roughsurface turbine vane was undertaken. It was felt, that,
true surface temperatures, as opposed to temperatures
between tile roughness and the freestream, should be
measured. Also, it was felt important to generate theheat flux at the vane surface, so as not to introduce
an insulating layer between the heater and the vane
surface. Temperature differences across an insulating
layer of unknown thickness would adversely affect the
measurements, especially at higher Reynolds numbers.
These requirements led to a test configuration in which
the rough surface was used to generate the heat. flux,
and temperatures were measured using an infrared cam-
era. All infrared measurement technique was used be-
cause this technique does not rely on contact with the
test surface, and does not disturb the surface profle.
The infrared camera system generates a temperature
mat) of the portion of the vane surface seen by the cam-
era. Heat transfer nleasurements using an infrared cam-era have been reported by several investigators. Sar-
gent et a1.(1998). Baldauf et al.(19q9), Johnston et
a1.(1999), as well as Sweeney and Rhodes(1999) used
infrared cameras to measure different aspects of fihn
cooling heat transfer.
Ta, ble 1. 'Fesl vane characteristics
Axial chord, Cx
True chord, C/C'x
Pitch-to-axial chord ratio
Span-to-axial chord ratio
Heated span-to-axial chord ratio
Flow turning
4.445cm
2.25
1.86
4.86
2.36
800
The test facility allowed accurate flow measurements
over a range of Reynolds numbers that varied by more
than a factor of twenty. A single vane was tested. (?on-
sequentty, while the physical vane roughness relnained
constant, the surface went from being nearly hydrauli-
cally smooth to fully rough as the Reynolds numl)er
was varied. While the lower Reynolds numbers tests
are lower than those for a typical high pressure turbine
application, they are approached in low power engine
applications.
The purposes of the work reported herein are to show
the effects of surface roughness on heat transfer, and to
quantify when surface roughness is importallt. A con>
panion paper, Boyle et al.(2000) describes an analysis
useful for predicting rough surface turbine heat trans-fer.
DESCRIPTION of EXPERIMENT
The measurements were taken in the three vane Jill-
ear cascade illustrated in figure t. The center vane was
the test vane. Air entered the test section at pressures
between 0.14 and slightly greater than 1 atmospheres.The air was at. ambient temperature. Valves between
the test section and a low pressure altitude exhaust sec-
tion were adjusted to maintain the desired vane exit
isentropic Mach number. Periodicity was achieved by
adjusting tile tailboards. Further details of the test con-
figuration are given by Boyle et al. (1998). This ref-
erence documented the inlet turbulence intensity and
length scale for the range of Reynolds and Mach num-
bers used in tl,e present, work. Test. were done with and
without the turbulence grid in place.
The vane was heated, and when steady state was
achieved, vane surface temperatures were measured us-
ing an infrared camera system. The lnframetrics 600
camera was operated in tile open mode, (3t, ol2tml), and
used a liquid nitrogen cooled detector. The output, from
the camera and its associated computer was the ten>
perature at each pixel in an array. The pixel array size
was 364 by 208. The digital temperature output of the
camera system was verified using a black body' of knowntemperatures.
NASA/TM--2000-210220 2

Pro
Exhaust
Rear window
GLsidewall
Test Section
Top viewCovers removed
ailboardadjustment
ure side window
Housing
Tailboard
adjustment-_
\
Shaped sidewall
Guide vane Suction sidewindow
Inlet flow
- Turbulence generator
Fig. 1 Overall view of test section.
Both the inside and outside of the test section were
painted with a flat black paint to reduce reflected ther-
mal energy. This was done to minimize stray thermal
energy onto the detector. The vane was viewed througheach of the the three window locations shown in figure1. A ZnSe window, mounted flush with the inside sur-
face, was used. The ZnSe window had a diamondlike
coating to increas,' its surface hardness, and thus reduce
the effects of abrasion from high speed flows. The coat-
ing was applied using the method described by Banks
and Rutledge(1982 ).
Data were obtained for a range of Reynolds and Machnumbers, and two inlet turbulence intensities. For each
test there were three views of the vane. The forward
portion of the pressure surface was viewed through the
pressure side window. The forward portion of the suc-tion surface was viewed through the suction side win-
dow, and the rear portion of the suction surface wasviewed through the rear window. A front faced, highly
reflecting, mirror was used when viewing through therear window. A region of the suction surface forward ofthe throat was not visible to the infrared camera.
However, enough of the vane surface was visible that
the effects of surface roughness could be quantified.
Figure 2 illustrates the test vane construction, andtable I gives the vane geometric parameters. The in-tent of the test was t,o make midspan meast]rements,
away from the endwalls Consequently. a high aspect
ratio of 4.86 was specified, which gives a span-to-truechord ratio of 2.16. An aluminum vane was used, and
much of the middle portion was removed. A spar was
left in this region to provide rigidity to resist the pres-
sure loads at high Mach and Reynolds numbers. Onlythe suction surface of the vane and the pressure surface
near the leading edge were available for heat transfermeasurenaents. A copper bus bar. shaped to the vane
profile was attached to each end of the opening. Thebus bars were insulated from the ahlminum vane. and
had copper rods extending through the entire test sec-
tion to provide electrical power. A high strength, but
low thermal conductivity foam material, Rohacell 300.
was inserted between the copper bus bars. It was also
shaped to the vane profile. Roughness was achieved by
NASA/TM--2000-210220 3

_ Heater power lead
I i' [ Test section wall
0.64cm ' !: i,_ Insulation
I _ o o ° -I_'_ ThermocouplesC°pperend plate
21.6cm 1 _ /
i 10.2cm
_ Electrically
conductive
surface
Centerline oftest section
p- Copper end plate' -----1_" Insulation
- Heater power lead
Fig. 2 Construction of heat transfer vane.
not smoothing tile foam surface. Tile foam was securely
bonded to tile copper bus bars. After appropriate mask-
ing, an electrically conducting silver paint was sprayed
onto tile vane surface. This created an electric circuit
between tile bus bars. As shown in figure 2 the for-
ward portion of the pressure surface, all of the suction
surface, and a small part of the pressure surface trail-
iug edge region were painted. At room temperature the
resistance of the heater was 0.07 ohms.
In addition to instrumentation to measure the heater
voltage and current, nine Type E thermocouples were
attached to the test section. Three thermocoup]es were
attached t.o the aluminum spar near midspan. They
were located between tile foam and aluminum. Six ther-
mocouples were placed on the vane surface at different
locations close to the upper bus bar. They were insu-
lated from the heater surface, and were attached with
an epoxy covering. Five thermocouple locations are
Table II. Average roughness properties
Property t Value Normalized by ('×
RrtMs ] 111 4- 18/m_ 25 + 4 × 10 -4
Ra 92 4- 15/tin 21 4- 4 × 10 -4
Skewness -0.58 4- 0.34
Kurtosis -0.42 4- 0.49
shown in figure 2. The sixth thernlocouph: is on the
vane pressure side. Tlw surface thermocouples could
not be used tbr all tn ,sit. calibration of the infrared
camera. Because the surface thermocouples were se-
cured using an epoxy covering they did not read the sur-
face temperature. The difference between the thermo-
couple and infrared temperatures varied with the flow
condition. The thermocouple locations were known.
and because the infrared temperature differed from
the thermocouple's surrounding temperature, they were
used to locate tile pixel coordinates onto the vane sur-
face. The thermocouple locations were especially visible
during transient cool down.
Roughness Characteristics. Data from six profilometer
traces were used to determine the roughness character-
istics of the heated surface. Each trace was approxi-
mately 1 cm ill length. A summary of the analysis of
these traces is presented in table II. The rms roughness
averaged slightly over 100 micrometers, while the aver-
age absolute roughness height was 92 micrometers. The
one sigma variation in these parameters among the six
traces was approximately 16(7(,. The skewness showed
considerable variation among the traces, but was always
negative. Negative skewness means that the area above
the meanline exceeds the area below the meanline. The
average kurtosis was negative, with only one trace evi-
dencing a positive value. According to Dagnall(1986) a
negative kurtosis indicates a bumpy, rather than spiky
surface profile.
The roughness height of 111 micrometers corre-
sponds to haMs/C_ of 0.0025, or hags/C of 0.001.
Kind et a1.(1998) reported aerodynamic effects for ro-
tors having bands of roughness in the height-to-chord
range of 0.0021 to 0.0063. Aerodynamic tests for uni-
formly covered sand grain roughness in the range of
hEQ/C between 0.001 and 0.01 have been reported by
Bammert and Stanstede(1972,1976) and by Boynton et
a1.(1992).
The degree to which surface roughness affects the
flow and heat transfer is determined by its value in
wall normalized coordinates. The naaxilnum normal-
ized roughness height., h+Q, was estimated using the
procedure proposed by Boyle and Giel(1995) to esti-
mate the maxinmm near wall grid spacing prior to a
CFD calculation.
NASA/TM--2000-210220 4

10(D.0rI! ----- ROUGH C_
SMOOTH C t .,", hfdC,=O.01
8OO.OT_T,=1.2 //
/"
/hso/h.m=1.0 /,
600.0 ,/
/ ./"/'/ J--hsjIC,==O'01h'so
400,0 ,,,,'/" / I. _--hso/C_ ='0"005
/, h_/C,=O.O08
/" / °
200.0 ,/ I - "¢°¢"
/ ._o .
0.2 0.4 0.6 0.8 1,0
Axial chord Reynolds No., X 104
0.00.0
Fig. 3 Estimated maximum equivalent roughness height, hEQ
• Y-TvJ
Where Re is a Reynolds number based on axial chord.
('.r. To maximize h+Q, Re is taken as tile exit Reynolds
number. Ree. Tile ratio of hEQ to hRMS was estimated
t,o be about two for the vane tested. Figure 3 showsh+
EQ as a function of Re__ and hEq/Cx for two friction
factors. The curves labeled SMOOTH are for a (!/
ratio of one. The curves labeled ROUGH are fbr for
fully' rough flow using tile relationship for Qf/2 given
by Nays and Cra.wford(1980)
Qf = 0.168
2 [In(864b,_,/hgq )]2
This figure shows thai h+q increases almost, linearly'
with Reynolds number and with the roughness height.
For h+Q > 70, the ROUGH curve is the appropriate
curve t.o use for estimating h+EQ For 5 < h+q < 70, the
appropriate value for h+Q lies between the two curves.
Fortunately, in this region the differences between the
SMOOTH and ROUGH curves are small. Since the
equivalent height ratio was estimated to be about
two, and hRMs/('_ = 0.0025. the maximunl equivalent
height at each Reynolds number was expected t,o be on
the HOUGH ('j line for hRMS/C_ = 0.005. At high
Reynolds numbers the maxinmm h+q was expected to
be given by' the dashed curve for hEQ/('_ = 0.005. As
the Reynolds number decreases the maximum h+q was
expected to eventually be given by" the solid line at. the
same value for heq/('a-.
ANALYSIS of DATA
The measured temperatures were corrected to give
the true surface temperature. This correction accotmts
for the emissivity of the vane surface, the emissivity
and teinl)erature of tile surroundings, and the ambient
temperature. The IR camera system measured the true
temperature of a black body when the emissivity was
one. The measured temperature, TM, is determined
from a heat. balance on the infrared camera receiver.
The energy' incident on the detector is less than the
emitted energy'. The camera system cuts off energy at,
wavelengths above 1_ microns. Camera temperatures
were deterlnined by' energy in the 3 to 12 micron band.
Because of tile small measured temperature differences,
and the wide wavelength band. the variation in the frac-
tion of energy incident on the detector was neglected.
The energy on tile detector is q]R = f(3. l:2)MCr'I_l.
_¥here f(3, 12) is the fraction of available radiant en-
ergy ill the 3 t.o 12 micron baud, and is a function of
temperature. In actuality the heat flux is given by':
qm = cr (r'w(evf(3, 12)vT 4, + #vesRf(3. 12)sRT_R)+
(1 - _V)ehf(3, 12)AT 4)
The fraction of available energy, f(3.12), was assunled
constant. Calculations showed that, because of the
small temperature differences, no significant error was
introduced by assuming f(3, 12) constant. Equating the
two expressions for the heat flux gives the vane temper-
ature as:
T,_ )<_T_ _w,v_s.T_.T,_,= M-(1-rw
7X, V _V
At each point Oil the vane tile Nusselt nulnber is
calculated from:
Nit -- qNET ('x
(Tv- 7;-)K
The local adiabatic recovery' temperature, _/_, was de-
ternfined from the inlet total temperature, TIN, and
the surface pressure distribution. The surface pressures
were determined from a two-dimensional Navier-St.okes
analysis,(Chima, 1996).
The vane local net, heat flux was calculated from:
qNET -- qELEC -- qCOND -- qRAD
NASA/TM_2000-210220 5

Null tests. If tile resistivity of the lwater were uniform,
qCLEC would be given by: qELEC = I'I/A = q. How-
ever, nwasurenlents indicaled that the heat flux was
not unifornl, so that the ratio of local-to-average heat
flux. F, had to be determined. Tests were done where
the heal transfer was known t.o be nearly uniforn_ over
the vane surface. For these tests heat transfer was by
free, not forced convection. For turbulent free convec-
tion the heat transfer is independent of the streamwise
location. For turbulent flow over a vertical flat plat
Burmeister(1983) gives a correlation for the local Nus-
selt nmnher as:
Nu,. = O.l((;r_,Pr) 1/a
Here, a' is the spanwise distance. Since Gr, = gxa(Tv-
7]'N)/(P27[N), _'Vu is independent of x, but depends oll
Tv-T{N to the one-third power. For this test condition:
qELEC _ 17 = \Tv-T/N J + qCOND/q--N--E_ + qRAD/_
rt 1 + _/_ + _/_
AI each poillI on the vane surface qCOND is evaluated
from the temperature distribution around the vane.
q('OND is evaluated using the average surface tempera-
lure and nteasured metal telnperatures.
qR.H)/_ is approximated by:
qRAD _ qRAD (Tv - TSR)tINCT qNET "TV TSR
At each poiut on the circulnference of the vane qCOND
was assulned equal to qCOND, qCOND was evaluated us-
ing a two-dimensional conduction analysis. The analy-
sis used the average surface teml)erature and measured
metal spar temperature.
Flow tests. ["or test with flow over the vane the local
Nussell is given by:
( FII/A - qCOND -- qRAD)(',".\" II
(Tv -T_)K
The term qCOND was evaluated for each test using the
same t.wo-dinlensional conduction analysis as for the
null test. In the flow test the heat transfer distribu-
lion was not uniform, but varied with circumferential
location. The local value of F was found from the null
test.
Since the flow in the cascade is two dimensional, the
spanwise average Nusselt number is of interest. This
value was obtained by integrating in the spanwise di-
rection. At each distance around the vane, the heat.
•able Ill. Summary of lest condition_,
0.3
0.7
0.9
Ideal Axial chord Re No. :,. t0 -_;
lulet Exit
0.0055 0.0,11
(I.0086 0.061
!1.0157 O.lOl
1!.0278 0.202
0.0,105 0.303
0,0317 0.236
0.0521 0.3.q4
0.0792 I}.5,q(t
0.0307 0.240
0.0555 0.444
I).0_;2(i 0.665
transfer coefficient was averaged over a fraction of the
spanwise distance. When the fraction was very small
the result was the midspan values. However, these val-
ues, in addition to being noisy, were very' sensitive to
the spanwise alignment of the infrared camera images.
Averaging over a 40_7t of the healed span gave less align-
mere sensitivity and less point-to-point variations in the
heal transfer.
The uncertainty in the Nusselt number was estimated
to be about 15_,_ over most of the vane surface. The
uncertainty in the infrared camera measurements was
better than 2°C, and the camera resolved differences of
less than 0.2°C. The infrared camera uncertainty was
minmfized be verifying the camera system output, for a
calibrated black body', and by comparing the pre-test
surface temperatures with the inlet thermocouph, read-
ings. The maximum uncertainty occured at. the mini-
mum surface-to-gas temperature difference. The maxi-
mum surface temperature of S0°C was set based on the
temperature capability of the foam material. This t.em-
perature occurs at the milfimum Nussell numbers. The
large variation in Nusselt numbers meant that at high
Nusselt numbers the surface-to-gas t.enaf)erature differ-
ence was nmch less than 60°(I. The estimate was made
1)5, assigning uncertainties to all of the variables used in
the data reduction, and doing the analysis repetitively.
The local heat flux was determined by properties in
addition to the heater voltage and current. The uncer-
tainty analysis treated the determination of F as a part.
of the analysis, and not as an independent quantity.
This has the beneficial effect of reducing heat transfer
uncertainty due to some independent variables, such as
thermal conductivity. The one region where there is a
higher uncertainty in heat transfer is the very rear por-
tion of the suction surface. At the design of the test
vane the assumption was made that the heat transfer
rate at. the very rear of the suction and pressure sur-
faces would be the same. This was done on the basis of
CFD analyses. However, the experiment was unable to
NASA/TM--2000- 210220

Pressure side Suction- Front Suction- Rear
)
Fig. 4 Temperatures recorded by infrared camera, °C.
veri_' this assumption under flow conditions. A temper-
ature difference across the vane near the trailing edgewould affect low Nusselt number measurements more
than those at higher Nusselt numbers.
There was also a positional uncertainty due to tile
aligmnent of the camera. This uncertainty was esti-mated to be less than 0.05('×.
EXPERIMENTAL RESULTS
Table IlI shows the range of test conditions for whichdata were obtained. Data were obtained at three isen-
tropic exit, Mach numbers for a range of inlet total pres-
sures. The Reynolds numbers in this table are based on
axial cilord, and varied by nearly a factor of 15 over the
range of test conditions. At each test point, data were
obtained for two inlet turbulence intensities, Boyle el
a1.(1998) reported that the turbulence intensity mea-
sured 1.14 axial chords upstream of the leading edge
was between 13 and 15¢X, over the range of test con-
ditions. Air was blown through the grid to achieve apitchwise uniformity in turbulence intensity.
The results obtained for the entire heated span at
a single test condition will be discussed first. This is
followed by a discussion of the midspan results for allof the test cases.
Full span results. Figures 4 through 7 illustrate fullspan results for a typical test case. The case is for
Re2 = 0.394 × l0 s , M,, = 0.7, with the turbulence grid.
Tile temperatures recorded by the infrared camera are
give//, followed by the calculated valle surface tempera-lures. Next, the surface Nusseh numbers are shown.
The Nusselt number distribution is shown when the
heat generation is assumed uniform, and this is followed
by the Nusselt number distribution calculated using the
the local heat, generation deternlined from the null test..
Figure 4 shows the infrared camera temperature distri-
bution for the vane for a typical test case. Tile views
as seen through each of the three windows are shown.
Tile heated portion of the pressure surface is followed
by the forward portion of the suction surface, and ends
with the rear part of the suction surface. Moving from
left. t.o right in the pressure side view shows the forward
part of tile pressure surface, the leading edge region,and a small portion of the suction surface.
NAS A/TM--2000-210220 7

Pressure side Suction- Front Suction - Rear
Fig. 5 Calculated surface temperatures.°C.
Similarly, the forward view of the suction side shows a
small portion of the pressure side, the lending edge and
the front portion of the suction side. The rear suction
side view begins near the throat region, and continues
to the trailing edge. The first two parts overlap in the
leading edge region. In the lower region of the two front
views there are apparent discontinuities in the surface
temperatures. These are the result, of sensor probes
in the line of sight between the vane and the camera,
and were left in the camera's view t.o help align the
ilnages. The spanwise temperature variation is due to
heat generation non uniformity and variations in sur-
face roughness. In each view, near the blade top, there
are small islands of large temperature gradients. These
islands, labeled 35, 60. 40, and 45°C, correspond to
thermocouple locations. A high degree of spatial res-
olution is visible in these figures. The suction surface
rear view shows cold temperatures in the middle of the
surface distance. Since this is where the insulating foam
is thinest, it is reasonable to suspect, that this is a region
of high conductive heat loss. "While the conductive
heat. loss to the cold aluminum spar can be significant
in this region, this is also a region of lower than av-
erage heat generation. If conduction were the cause of
the cold temperatures, its relative importance decreases
as the Reynolds number and external heat transfer in-
crease. The temperatures would become more uniform
at high convective heat transfer rates. However. this
was not the case, and using measured values for the
foam thermal conductivity showed that the generated
heat flux in this region was lower than average.
Figure 5 shows the calculated t.en_perat.ures using the
measured infrared camera tenlperatures, the surround-
ing temperature, the ambient temperature, the vane
emissivity, and the window transmissivity. At the two
higher Maeh numbers the surrounding temperature var-
ied from view to view. It. was calculated as the adiabatic
temperature seen on the adjacent vane. Even though
the silver paint has a low emissivity on a smooth sur-
face, measurements of the rough vane surface gave an
emissivity of approximately 0.75. The measured emis-
sivity was influenced by several factors. Considerable
NASAfrM--2000-210220 8

Pressure side Suction - Front Suction - Rear
Fig. 6 Nusselt number - uniform heat flux.
variations in emissivity were observed, and tile effect of
a variation in emissivity is discussed. The transmissionof the gnSe window was found to be approximately 0.7,
when viewing at a near normal angle. This transmissiv-
it y was consistent with the calculated value using theindex of refraction for the material. When the vane was
viewed through the rear window tlle transmissivity wasreduced to 0.65 to account for both the mirror reflectiv-
ity and tile highly oblique angle t,o the window. There
is a temperature discontinuity when the camera views asurface other than the heated one. This could be either
an adjacent vane or the unheated portion of the test.vane. However, this temperature difference is spread
out. over several pixels when the camera views tile vane
through the ZnSe infrared window at a non-normal an-
gle. The thickness of the window displaces the imagein the st reamwise direction for images passing through
at oblique angles.
Figure 6 shows tile Nusselt number distributionbased on a uniform heat flux. This Nusselt number
distribution includes the corrections for radiation from
the heated vane and conduction to tile aluminum
spar. The correction for radiation was small. At. this
Reynolds number tile correction for conduction to the
spar was also small. High temperature regions in figure
5 correspond to low Nusselt number regions in figure 6.
Figure 7 shows the Nusselt distribution after cor-
recting for the non uniformity in tile electrical heat flux.Since there were variations in surface roughness on the
vane surface, there would not be spanwise uniformity inthe Nusselt number distribution for a uniform heat flux.
Some of the spanwise non uniformity seen in this figure
vane could be the result of non uniformity in the surface
roughness. Tile pressure side view shows a low Nusseltnumber region on tile pressure side of the leading edge.
The heat transfer rises to the leading edge and beyond.
The front suction view shows high heat transfer on the
pressure side, a decrease in heat transfer, followed byan increase on the suction side of the vane. The suction
rear view shows a fairly uniform level over nmch of the
region away from the end bus bars. Midway along thesurface of this view, and near midspan there is a high
heat transfer region. Either high surface roughness or,
NASA/TM--2000-210220 9

Pressure side Suction - Front Suction - Rear
Fig. 7 Nusselt number - non uniform heat flux.
overestilnating heat generation in this region could ac-
count tbr this apparent high heat transfer. An errorin calculating the local value of F causes a bias in the
heat generation !hroughout the entire range of test con-ditions.
Midspan results. The data for each case were averaged
over different fractions of tile heated span. No signif-
icant variation in the spanwise averaged Nusselt nun>
ber distribution was observed for averaging regions of20 and 40(7v of the heated span.
M,_, = 0.3 results. Figure 8 shows the midspan heattransfer distribution for the different Reynolds numbersat the three vane exit Mach numbers, and for the two in-
let turbulence intensities. Each part of the figure shows
data for a single Math number. Successive parts show
data at low and high turbulence levels. High turbu-lence being the result of the upst.ream grid. For clarity,
the pressure side window data have been offset on the
plot by s/('_- = -1. In reality there is an overlap in
the leading edge region. The two suction surface views
have a gap between them. because the camera could not.
view a region upstream of the throat.. The no grid data
at Me = 0.3 shown in figure 8a clearly shows suction
surface transition moving forward as the Reynolds
number increases. Data for the forward portion of the
suction side show a heat transfer peak on the pressure
side of the leading edge. Nu increases approaching theleading edge, s/('_ = 0, from the pressure side, then
decreases. This is followed by a rapid increase, and is
most evident at higher Reynolds numbers.
The pressure side data do not show the peak leading
edge heat transfer at s/C_ = -1 in the plot. The peakis over onto the suction surface. The surface on the
far side of the leading edge is nearly tangential to the
camera view. The discrepancy between the two viewscould be due to unaccounted variation in surface emis-
sivity with viewing angle to the surface. In the overlap
region the pressure side view heat transfer is SOlnewhat
higher.
Figure 8b gives the Nusselt numbers for the same
exit, Mach number as in part (a), but with the grid in-
stalled. The presence of the grid increases the Nusselt
number, even for the rear portion of the suction sur-
face. For these tests, and those at. higher Mach num-
bers, air was blown through t.he grid. Test were done.viewing the rear portion of the suction surface, with no
grid air. The turbulence intensity varied significantly
in the pitchwise dkect.ion for the unblown grid, (Boyle
et a1.(1998)). However, no significant Nusselt uumber
differences were seen for the unblown grid test.
NASA/TM--2000-210220 10

1000 -
!800
Re2=0.041Xl06
Re2=0.061X10 s
.... R%=0.10X10 s----- Re2=0.20Xl0 s
----- R%=0.30X10⁶
Pressure
side
600 _ Offset=-1
;
NM
A400 / ,
I At'1
,11,,_
200 //; )
y,
Ie
I!
t'_
_B "4r
_,"W
I
¢
i i
-2.0 -1.0 0.0 1.0 2.0Surface distance, _C x
a) Nusselt number for M2=0.3, No grid
1000 _ _ Re2=0.041X10 e[ _ Re2=O.061X10 e
i .... Re2=0.10X10⁶! ----- Re2=0.20X10 sI Re2=0.30X10⁶
8O0
600 r
iNu i
F
400
Offset=-1 ii
i I
i i !r_ i,
,/" i//200!
!
J0
3.0
vq 'l
I I
,/'1 _/I
// ;1,f
-2.0 -1.0 0.0 1.0 2.0
Surface distance, s/Cx
3.0
b) Nusselt number for M==0.3, Turbulence grid.
Fig. 8 Midspan Nusselt numbers.
1600 -
1400.
i
1200 _
1000
Nu
800
600
400 i_
0 I-2,0
1600
1400
1200
1000
i800
INu
600
40O
2O0
Re=_-0.236X10 _ /_, ,p/'_.... Re=_-O.394X10 e
----- Re,---0.59X10' !"/ !/_!t,
nml
II
Offset:-1 i i
,, l::!Ji/,_ :;,,,
,t_ ._,
Pressure side
I
Suction side
-1.0 0.0 1.0 2.0
Surface distance, s/C,
c) Nusselt number for M2=0.7, No grid.
3.0
Re_=0.236X10"
.... Re_=0.394X10 _Re==O.59X10 e
t," _, r,/ _,_,_ \1
! t
Offset=-1 ,' _ \ _.,
1 | i | I
/l', ,",_,!:'J tV!
Pressure side Suction side
-2.0 -1.0 0.0 1.0 2.0 3.0
Surface distance, s/C,
d) Nusselt number for M==0.7, Turbulence grid.
NASA/TM--2000-210220 II
2000.
18001
1600 -
Re2=0.240X10⁶
.... Re2_-0.444X10⁶
Re2=O.665X106
1400
1200
1000
Nu
8O0
6O0
400
Pressure side
Offset=-1
fi0
,¢J/
200
A'I
i,:".'i*I I I
/q I
rIJi i
A _' 14%i% &_# I
!
Ih_l l%!
Suction side
0 - ............... ± ....... ±
-2.0 -1.0 0.0 1.0 2.0
Surface distance, s/C x
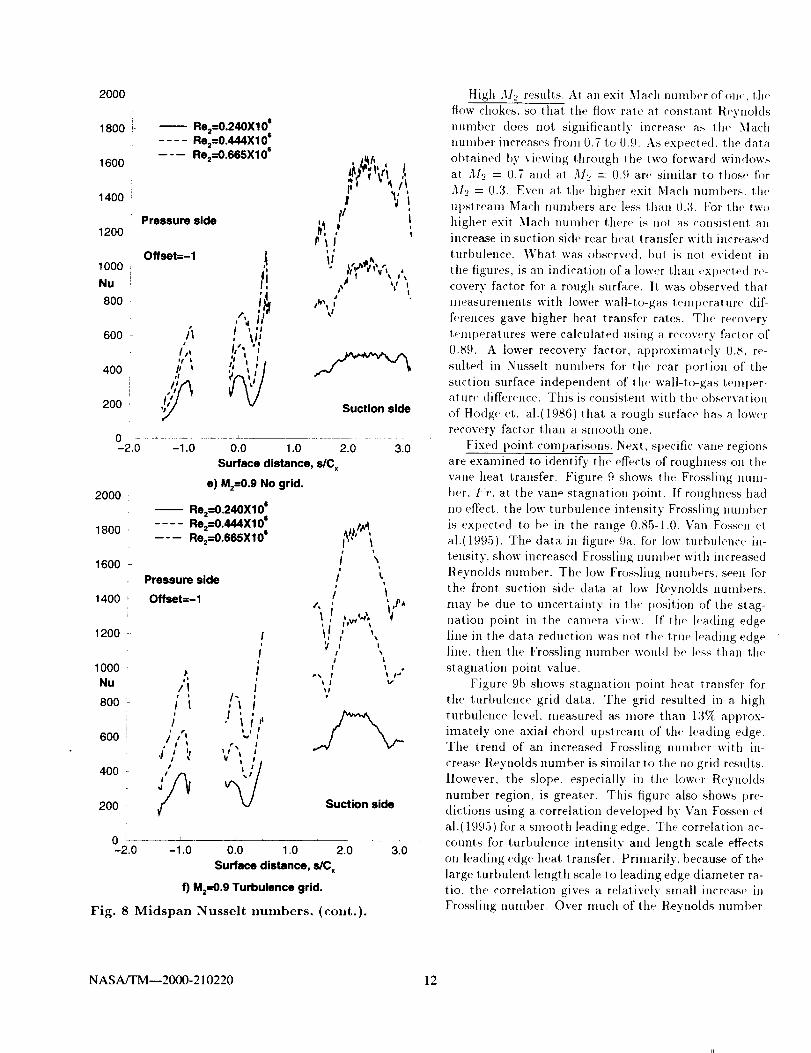
e) M2--0.9 No grid.
R%=0.240X10⁶
.... Re2=0.444X10 e
Ro2_-0.665X10⁶
Pressure side
Offset=-1
2000
1800 L
1600
1400 ,
1200 -
1000
Nu
800 -
600
400
200
0
Ii
I
, ifl i
II I
e _ b B
I %l;i j |
,' I *'% I
.I ; ', ", '& II t !
3.0
i \! t
/ kt!
/ I
It J! %
I• _ I t r'**
_1II v
r
Suction side
-2.0 -1.0 0.0 1.0 2.0
Surface distance, s/C.
f) M2--0.9 Turbulence grid.
Fig. 8 Midspan Nusselt nuznbers, (cont.).
3.0
High M._, results. AI an exit Mach nunlber of one, the
flow chokes, so that the flow rate at constant Reynolds
number does not significantly increase as the Mach
number increases from 0.7 to 0.9. As expected, the data
obtained by viewing through rile two [brward windows
at M-_, = 0.7 and at .11._, = 0.9 are similar to those for
M,_, = 0.3. Even at. the higher exil Mach numbers, the
upstream Mach numbers are less than 0.3. For lhe two
higher exit Mach number there is not as consistent an
increase in suction side rear heat transfer with increased
turbulence. What was observed, but is not eviden! in
the figures, is an indication of a lower than expected re-
covery factor for a rough surface. It was observed that
measurements with lower wall-to-gas temperature dif-
ferences gave higher heat transfer rates. The recovery
temperatures were calculated using a recovery facl.or of
0.89. A lower recovery factor, approximately 0.8, re-
sull.ed in Nusselt numbers for the rear portion of the
suction surface independent of the wall-to-gas temper-
ature difference. This is consistent with the observation
of ttodge et. a1.(1986) that. a rough surface has a lower
recovery factor than a smooth one.
Fixed point, comparisons. Next. specific vane regions
are examined to identify the effects of roughness on the
vane heat transfer. Figure 9 shows the Frossling nun>
her. Fr, at the vane stagnation point. If roughness had
no effect, the low turbulence intensity Frossling number
is expected to he ill the range 0.85-1.0. Van Fossen el
a1.(1995). The data in figure 9a, for low turbulence in-
tensity, show increased Frossling number with increased
Reynolds number. The low Frossling numbers, seen for
the front suction side data at low Reynolds numbers,
may be due to uncertainty in the position of the stag-
nation point in the camera view. If the leading edge
line in the data reduction was not the true leading edge
line, then the Frossling number wouhl be less than the
stagnation point value.
Figure 9b shows stagnation point heat transfer for
the turbulence grid data. The grid resulted in a high
turbulence level, measured as more than 13(7( approx-
imately one axial chord upstream of the leading edge.
The trend of an increased Frossling number with in-
crease Reynolds number is similar 1o the no grid results.
However, the slope, especially in the lower Reynolds
number region, is greater. This figure also shows pre-
dictions using a correlation developed by \:an Fossen el
al.(1995) for a smooth leading edge. The correlation ac-
counts for turbulence intensity' and length scale effects
on leading edge heat transfer. Primarily, because of the
large turbulent, length scale to leading edge diameter ra-
tio, the correlation gives a relatively small increase in
Frossling number. Over nmch of the Reynolds number
NASA/TM--2000-210220 12

1.5
Fr
1.0
0.5
O Front suction side data
A Front pressure side data
CO
A
&A
6_0
0 0
00
00
AA
A A£
0
i i J10000 20000 30000
2.0
Leading edge diameter Reynolds number
a) No grid - Tu=1%
1.5
Fr
1.0
0.5
AA
A A
f
OO A
OO
A A
oA O
OO A
0
Front suction side data
Front pressure side data-- Correlation - Van Fossen et a1.(1995)
10000 20000
Leading edge diameter Reynolds number
b) Turbulence grid
Fig. 9 Frossling number at vane stagnation point.
J30000
range, the effect of roughness on Frossling uumber is
significantly greater.Figure 10 shows the Stanton number at ,s/('x = "2.5.
This location was chosen because the heat transfer co-
efficient is representative of the rear part of the suction
surface. Results are presented in terms of Stanton num-
ber, 5! = .\ru/R_/Pr, since this quantity varies slowly
with Reynolds number. In addition to the experimentaldata, correlation curves are shown. The turbulent Stan-
ton number correlation for a smooth surface is shown
along with results from a correlation given by Kays andCrawford(1980) for rough surfaces. This correlation is:
5t = ('.r/2Pr, + V/_//2/S'th
and
r,[n h EQ ?__f_) -0251 h = t k/_e-- Pr -044_x
0.0060
0.0050
0.0040
St
0.0030
0.0020
O0.0010
-- Smooth - Turbulent
-- h=JC =0.001
.... ht_==0.002
----- htJC==O.005
----- heJC==0.0t
© No grid• Grid
1--__ o'_ ........ "e-..................
.._k,_.__-_7_-7__:-_o-7_°7o..... ....._ o .........................
015 1.0 1,5 2.00.0
Reynolds number at s/C =2,5, X 10 -6
Fig. 10 Stanton number at s/C =2.5
The constant. C, which is a function of the roughness
geometry is taken as 1. While the appropriate value forthis vane geometry is not known, the data of Pitnenta
et a1.(1975) for closely, packed spheres corresponded to
a value of (' = 1.0. The Reynolds nutnber is t.aken as
Re = Re,_,s/('x. C//2 is determined from the roughsurface correlation for a range of hEQ/('× values. Theturbulent Prandtl number, Prt, was assumed to be 0.9.
The lowesl Reynolds number no grid case has aStanton number below the turbulent correlation. This
value is consistent with a Stanton tmmber for laminar
flow. The data for the next highest. Reynolds numberis close to the smooth correlation for turbulent flow.
At this Reynolds number, and lower, the flow appears
to be hydraulically smooth, as it also does for the grid
cases. The no grid cases show a rapid increase in Stan-
ton number, followed by' a decrease in Stanton num-
ber, eventually approaching the hEQ/('× = 0.00,5 curve
at high Reynolds numbers. Stanton numbers just af-t.er transition are typically higher than the turbulent
value. As was mentioned earlier, the expected value
for hEQ/C× was 0.005. With the turbulence grid in
place, the trend shows higher Stanton numt)ers at lower
Reynolds tmmbers, and a more negative slope of Stan-ton number versus Reynolds number. The grid Stanton
numbers approach the no grid values at high Reynoldsnumbers.
Emissivity variations. As mentiotled earlier, measure-
ments of the surface emissivity gave a cousiderable
amount of uncertainty. Among the factors which con-tributed to the emissivity uncertainty were the angle t.o
the catnera: the position on the vane: and uncertainty
in the reference black paint emissivity. Figure 11 shows
NASA/TM--2000-210220 13

1300[
1200
1100
1ooo
9o0Nu8OO
7OO
6OO
5O0
400-
3OO-2.0
Pressureside
oEmissivity - 0.7Emissivity - 0.75
v Emissivity- 0.8
Offset= -1v
-1.0
Suction side
0.0 1.0
Surface distance, s/Cx
2.0 3.0
Fig. 11 Effectof emissivity variaion, Re=:O.394X10e,M==0.7,grid.
tile midspan Nusselt mnnber distribution for three val-
ues of the surface emissivity. Tile three values are the
estimated value of 0.75+0.05. Increasing the vane emis-
sivity causes the vane temperature to decrease. This
in turn causes the vane-to-gas temperature difference
to decrease. While the Nusselt number does increase,
as expected, the increase is not large. The number of
symbols in each line are the nuulber of pixels in the
st,reamwise direction. The number of pixels per unit,
length were approximately the same in the spanwise
and streamwise directions.
CONCLUSIONS
The experimental results showed that an infrared
camera technique is a usefifl tool for measuring turbine
heat transfer over the entire blade surface. Knowledge
of surface emissivity and window transmission are im-
portant to achieving accurate results. Verifying the
camera system output with a calibrated black body
source, and verifying the agreement between the gas
t.emperature measurement and surface t.enaperatures
measured with the infrared camera, results in accurate
heat transfer even when the temperature differences are
small. The portion of the blade surface for which the
heat transfer is measured is controlled by optical ac-
cess. The portion of the surface viewed through each
window is determined by the adjacent blades. The frac-
tion of the surface viewed is determined by the solidity
as well as blade shape. Even though in this application
the measurements were averaged to obtain the midspan
heat transfer, spanwise as well as streamwise variations
in surface teml)eratures were readily measured. This
technique is applicable to measuring surface heat trans-
fer resulting from three-dimensional flows.
Leading edge Frossling numbers increased with
increasing Reynolds number. The increase was sig-
nificantly greater than was expected from freest.ream
turbulence effects. The trend in the low turbulence
intensity data showed Frossling numl)ers approaching
1.3 at high Reynolds numbers. This is 30-,t0_7, greater
than is expected for leading edge heat transfer of a
smooth vane. When the inlet turbulence intensity was
increased, the trend in leading edge Frossling number
showed a higher initial slope. At high Reynolds nun>
bers the Frossling number approached 1.7. The in-
creased Frossling number at high turbulence was again
greater than expected for a smooth surface, and ap-
proached 50_ at high Reynolds nunll)ers. The heat
transfer augmentation clue to roughness increased with
Reynolds number throughout the range of test condi-
tions.
The heat transfer on the rear I)ortion of the suc-
tion surface was greater than would be expected for a
Slnooth vane by nearly a factor of two at high Reynolds
numbers. For the low turbulence test cases, the ra-
tio was less as the Reynolds number decreased. How-
ew,r. with a high turbulence intensity, the ratio re-
mained close to two for Reynolds numbers of 101,000
and greater. Only R)r Reyilohts numbers of 61,000 or
less was the heat transfer consistent with t,ha! for a
smooth surface. The estimated equivalent roughness
height, h+Q was approximately 23 at a Reynolds nun>
ber of 61,000. This value of 2:/corresponds to a transi-
tionally rough equivalent height.
REFERENCES
Abuaf. N.. Bunker, R.S., and Lee, ('.P.. 1997. "Effects of
Surface Roughness on Heat Transfer and Aerodynamic Per-
formance of Turbine Airfoils," ASME paper 97-CT-10.
Baldauf, S.. Schulz, A., and Witting. S., 1999, "'High Reso-
lution Measurements of Local Heat Transfer Coefficients B.v
Discrete Hole Fihn Cooling," ASME paper 99-GT-43.
Bammert, K., and Stanstede, It.. 1972, "Measurements
Concerning the Influence of Surface Roughness and Pro-
file Changes on the Performance of Gas Turbines," ASME
Journal oJ Engineerin9.for Power. Vol. 94. pp. 207-213.
Barnmert, K.. and Stanstede. H., 1976, "Influences of Man-
ufacturing Tolerances and Surface Roughness of Blades on
the Performance of Turbines," ASME Journal el En9ineer-
ing fin" Power. Vol. 98, pp. 29-36.
NASAfI'M--2000-210220 14
Banks. B. A.. and Rutledge, S. K., 1982, "Ion Beam
Sputter Deposited Diamondlike Films," NASA TM82873.
Blair. M.F., 1994. "All Experinwntal Study of Heat
Transfer ill a Large-Scale Turbine Rotor Passage,"
ASME Journal of T_lrbomachinery, Vol. 116, pp. 1-13.
Boyle, R.J., Spuckler, (!M., and Lucci, B.L., 2000,
"Comparison of Predicted and Measured Vane Rough
Surface Heat Transfer," Proposed for presental, ion at
the 45th ASME Gas Turbine and Aeroengine Technical
(_Ollgress as 00-GT-0217.
Boyle. R.J., Lucci, B.L., Verhoff, V.G., (lamperchioli,
W.P., and La. 11., 1998, "Aerodynamics of a Transi-
tioning Turbine Stator Over a Range of Reynolds Nun>
bers," ASME paper 98-GT-285.
Boyle, H..l., and Giel. P.W., 1995, "Three-DimensionalNavier-St.okes Heat Transfer Predictions for Turbine
Blade Rows," AIAA Journal of PropMsion a_d Power.
Vol. 11, No. 6, pp. 1179-1186.
Boynton, J.L.. Tabibzadeh, R., and Hudson. S.T., 1992,
"Investigation of Rotor Blade Roughness Effects on
Turbine Performance," ASME Journal of Turbomacbin-
er.q, Vol. 115. pp. 614-620.
Braslow, A.L., 1960, "Review of the Effect of Dis-
tributed on Boundary Layer Transition," AGARD Re-
port 254.
Burmeister. L.C., 1983, "'Convective Heat Transfer,"
John Wiley and Sons, Inc, New York, p 544.
Chima, R.\'., 1996, "'Application of the k- _ Turbu-
lence Model to Quasi-Three-Dimensional Turbomachin-
cry Flows." AIAA .]ourl_al of Propulsiol_ al_d Power,
Vol. 12, No. 6, pp. 1176-1179.
Dagnall. H., 1986, "Exploring Surface Texture," Second
ed., Rank Taylor Hobson Limited, Leicester, England,
p 158.
Dunn, M.G., Kim. a., Civinskas, K.C., and Boyle,
R.J.. 1994, "Time-Averaged Heat Transfer and Pres-
sure Measuremeuts and (:omparison with Prediction for
a Two-Stage Turbine. ASME Journal of Turbomacbi11-
cry, Vol. 116. pp. 14-22.
tto(tge. B.K, Taylor, R.P., and Coleman, H.W., 1986.
"'All Investigation of Surface Roughness Effects on Adi-abatic Wall Temperature," AIAA Journal. Vol. 2,1, No.
9, pp. 17)60-1561.
Johnston, ('.A., Bogard, I).G., and McWaters. M.A.,
1999, "'Highly Turbulent Mainstream Effects on Fihn
(kxAing of a Simulated Airfoil Leading Edge." ASME
paper 99-GT-261.
Kay's, W. M.,and Crawford. M. E.. 1980. "ConvectiveHeat. and Mass Transfer". Second Ed. McGraw-Hill
Book Co., New York, p 327.
Kind, R.J., Serjak, P.J., and Abbott. M.W.P., 1998,"'Measurements and Prediction of the Effects of Surface
Roughness on Profile Losses and Deviation in a Turbine
Cascade." ASME Jour, al of Turbomachinery, Vol. 120,
pp. 20-27.
Pimenta. M.M., Moffatt, R.J., and Kays. W.M., 19!15,
"'The Turbulent Boundary Layer: An Experimental
Study of the Transport of Momentum and Heat with
the Effect of Roughness," Rep. HMT-21. Dept. of Me-
chanical Engineering, Stanford Univ.
Sargent, S.R.. Hedlund, C.R., and Ligrani, P.M..
1998, "'An Infrared Thermography Imaging System forConvective Heat Transfer Measurements in Complex
Flows," 3Ieas. Sci. Technol. Vol. 9, pp 1974-1981.
Sweeney, P.C., and Rhodes, J.F., 1999, "An Infrared
Technique for Evaluating Turbine Airfoil Cooling De-
signs," ASME paper 99-GT-142.
Tarada, F., 1987, "Heat transfer to Rough Turbine
Blading," PhD thesis, University of Sussex. England
Tarada, F., and Suzuki, 5,:I., 1993, "External Heat
Transfer Enhancement to Turbine Blading Due to Sur-
face Roughness," ASME paper 93-GT-74.
Taylor, R.P., 1990, "Surface Roughness Measurementson Gas Turbine Blades," ASME Journal of Turboma-
chinery, Vol. 112, pp. 175-180.
Van Fossen. G.J., Simoneau, R.J., and Ching, C.Y.,
1995, "Influence of Turbulence Parameters, Reynolds
Number. and Body Shape on Stagnation Region Heat
Transfer". ASME Journal of Heat Transfer. Vol. 117,
pp. 597-60::I.
NASA/TM---2000-210220 15

REPORT DOCUMENTATION PAGE FormApprovedOMBNO.0704-0188
Public reporting burden for this collection of information is estimated 1o average 1 hour per response, including the time for reviewing instructions, searching existing data sources,gathering and maintaining the data needed, and completing and reviewing the collection of information. Send comments regarding this burden estimate or any other aspect of thiscollection of information, including suggestions for reducing this burden, to Washington Headquarters Services, Directorate for Information Operations and Reports, 1215 JeffersonDavis Highway, Suite 1204, Arlington, VA 22202-4302, and to the Office of Management and Budget, Paperwork Reduction Project (0704-0188), Washington, DC 20503.
1. AGENCY USE ONLY (Leave blank) 2. REPORT DATE 3. REPORT TYPE AND DATES COVERED
August 2000 Technical Memorandum
4. TITLE AND SUBTITLE 5. FUNDING NUMBERS
Infrared Low Temperature Turbine Vane Rough Surface Heat
Transfer Measurements
6. AUTHOR(S)
R.J. Boyle, C.M. Spuckler, B.L. Lucci, and W.E Camperchioli
7. PERFORMING ORGANIZATION NAME(S) AND ADDRESS(ES)
National Aeronautics and Space Administration
John H. Glenn Research Center at Lewis Field
Cleveland, Ohio 44135-3191
9. SPONSORING/MONITORING AGENCY NAME(S) AND ADDRESS(ES)
National Aeronautics and Space Administration
Washington, DC 20546-0001
WU-523-26-13-430
8. PERFORMING ORGANIZATION
REPORT NUMBER
E-12339
110. SPONSORING/MONITORING
AGENCY REPORTNUMBER
NASA TM--2000- 210220
ASME-20(K)-GT-0216
11. SUPPLEMENTARY NOTES
Prepared for the 45th International Gas Turbine and Aeroengine Technical Congress sponsored by the American Society
of Mechanical Engineers, Munich, Germany, May 8-1 l, 2000. Responsible person, R.J. Boyle, organization code 5820,
(216) 433-5889.
12a. DISTRIBUTION/AVAILABILITY STATEMENT
Unclassified - Unlimited
Subject Category: 34 Distribution: Nonstandard
This publication is available from the NASA Center for AeroSpace Information, (301 ) 621-0390.
12b. DISTRIBUTION CODE
13. ABSTRACT (Maximum 2OO words)
Turbine vane heat transfer distributions obtained using an infrared camera technique are described. Infrared thermogra-
phy was used because noncontact surface temperature measurements were desired. Surface temperatures were 80 °C or
less. Tests were conducted in a three vane linear cascade, with inlet pressures between 0.14 and 1.02 atm., and exit Mach
numbers of 0.3, 0.7, and 0.9, for turbulence intensities of approximately I and 10%. Measurements were taken on the
vane suction side, and on the pressure side leading edge region. The designs for both the vane and test facility are dis-
cussed. The approach used to account for conduction within the vane is described. Midspan heat transfer distributions are
given for the range of test conditions.
14. SUBJECT TERMS
Turbine heat transfer; Surface roughness
17. SECURITY CLASSIFICATION 18. SECURITY CLASSIFICATION
OF REPORT OF THIS PAGE
Unclassified Unclassified
NSN 7540-01-280-5500
15. NUMBER OF PAGES
2116. PRICE CODE
A0319. SECURITY CLASSIFICATION 20. LIMITATION OF ABSTRACT
OF ABSTRACT
Unclassified
Standard Form 298 (Rev. 2-89)
Prescribed by ANSI Std. Z39-18298-102