Embed Size (px)
Citation preview

1
Infrared Night Vision Based Pedestrian Detection System
Chia-Yuan Ho, Chiung-Yao Fang, 2007 Department of Computer Science & Information Engineering
National Taiwan Normal University
INTRODUCTION
Traffic accidents account for the highest rate of accidental death in recent years, and the
victims are usually the pedestrians. Hence, we intended to develop a computer vision based
alerting system which detects the passing pedestrians within a dangerous distance to the vehicle,
especially at night when the driver’s visibility is greatly reduced. An infrared camera was set up
on driving automobiles for video-taping the surroundings to serve as the input to this system.
Combined with time and spatial analysis, the system would detect and track the pedestrians in
the continuous images. In the case the pedestrians were among any dangerous distance or
position, the system should warn the driver in advance to increase the available time to
response and avoid danger. The goal was to incorporate this system into real-world
automobiles to reduce the rate of traffic accidents due to unfavorable visibility at night time
which the drivers were unable to locate pedestrians around.
ABSTRACT
When people drive in low-visibility condition at night, even though the cars are equipped
with head lights, they’re often unable to provide enough lighting to locate suddenly-appearing
pedestrians. Hence, we have investigated in this system which utilizes the combination of
computer-vision techniques and computational analyses, to detect the location and moving
direction in advance, which could then warn any potential danger to reduce the chances of
accidents.
Unfortunately, the analysis of normal video-taping at night has its limits, such as the
noises produced by electronic devices, even if the aperture and ISO are large enough. However,
even though visible light is dim during night time, infrared is emitted whenever an object with
considerable temperature is present. In this case, human body temperature is relatively higher
than the environment and thus the more intense infrared can be easily detected. After applying
the computation of spatial distance, shape, the intensity of infrared and appropriate position,
we might infer the objects which satisfy these analysis to be potential pedestrians.
Moreover, because of the fast-speed driving (especially on highways), this system has to
be efficient and gives real-time feedback to be considered useful.
PREVIOUS STUDIES AND DOCUMENTATION
The idea of using infrared images to detect pedestrians was introduced by M. Nilson et. al,

2
2004. They mentioned the fact that infrared images are a lot easier in detecting pedestrians at
night than images taken with visible light, even with very low resolution, and had proposed a
5-step model of pedestrian detection as following:
Fig.1. 5-Step Pedestrian Detection Model by M. Nilsson4
(“Gray” color indicates steps involving most intensive CPU and memory usage)
Fig.2. Comparison between Images of Low Resolution under Visible Light and Infrared Imaging4
Also, A. Shashua et. al, had proposed a pedestrian detection system using single images in
2004, which categorized pedestrians into 4 types – pedestrians crossing the drive way, walking

3
along the drive way, standing on drive way, and standing outside the drive way. They split the
image into several subunits, and categorize according to the dynamic changing of distances
between subunits.
Fig.3. Model of Subunit Splitting of a Pedestrian by A. Shashua7
At the same time, D. M. Gavrila et. al, had utilized computer vision to furnish this system.
They standardized the candidate regions of pedestrians by resizing, then analyze their validity
with neural network. However the drawback was the over-sensitivity of this system, which
reduced its reliability.
Fig.4. Analysis with Resizing by D. M. Gavrila
Later in 2005, F. Xu et. al, had developed a pedestrian tracking scheme specially designed
for detection night pedestrians, including 3 phases:
(1) Selection of candidate regions
During night time, the infrared emitted by human body forms a good contrast with
the background. Normally, the head is the region with strongest infrared intensity because
it’s the least likely to be covered by clothing. Nevertheless, the intensity of infrared in
background is dynamically changing; hence the author had calculated a threshold for

4
background intensity using the average of previous data. This threshold is then used to
segment the whole image, followed by noise reduction, analysis of the proper
height-width ratio and its position relative to the road, to determine the validity of this
candidate region. Often because the pedestrian might wear heavy clothing which reduces
the contrast between human-emitted infrared and the background, it would be better to
detect the upper part of the body, or even the head region, which are less likely to have
undesired movement comparing to the lower part. (This is known as Support Vector
Machine (SVM) method.)
Fig.5. Potential Candidate Regions of Pedestrians1
(2) Verification of Actual Pedestrians
Since we want to verify whether the pedestrian is actually walking on the drive way,
we need to locate the area of the drive way itself. Normally the drive way would have a
relatively uniformed infrared intensity; hence we can use the Sobel Edge Detection method to
find the largest area, which corresponds to the road surface. Then we are able to further
decide the candidate regions of pedestrians, and here’s how the SVM method comes into
play.
The practice of SVM requires to first “train” the system to be familiar with various
forms of pedestrians (with different clothing, color…etc). Firstly, there were 2 choices
between the use of images, gray-scale and binary images. It was first thought to use binary
image for analyzing because it ignores the clothing or accessories on the pedestrians
whereas gray-scales are prone to be distracted by those details. However further
experiences concluded that the SVM system had yielded an almost 100% correctness with
gray-scale images, while the binary images were over-sensitive to the shapes of candidate
regions which reduced their correctness. Moreover, it was found that the detection with
the whole upper body or only the un-covered parts such as hands and head region had
resulted in approximately the same correctness. If the candidate region was an infrared
image which revealed the whole human body (instead of just partial parts), the SVM
could even better perform its job to efficiently detect pedestrians.

5
Fig.6. Candidate Regions – Whole Body V.S. Upper Part Only1
Secondly, the pedestrians were categorized into 3 types – walking a long the road,
walking across the road, and bicyclists. The “training” of SVM was done in two forms –
one with the presence of all these 3 types of pedestrians (form 1), and the other was to
develop 3 SVM systems each deals with only one type (form 2). The results were that,
form 1 was more time-consuming and difficult to converge, yet form 2 had exhibited
satisfactory convergence within an acceptable time period. After the SVM is “trained”, it
is then ready to be used in actual detection of pedestrians.
Fig.7. Using “Trained” SVM to Detect Pedestrians in Gray-Scale Images1
(3) Tracking of Pedestrians
It is essential that after we’ve successfully detect any pedestrians in the images, the
system has to be able to keep track of them. Therefore the Kalman Filter technique is
introduced to track and predict the direction in which the pedestrian is moving based on
its position in the previous image in terms of timeline using the mean-shift method.
However, in the case of two pedestrian crossing over each other, the system might
produce false computations. Yet the good property of Kalman Filter is that it keeps
tracking with its former prediction even if a false computation is produced unless the
tracking is no more available, then it re-detects again.

6
Fig.8. Detecting and Tracking of Pedestrian’s Directino of Movement1
In conclusion, the critical problem with SVM is that its ability of detection largely relies
on the data of its former “training”. If the data was overly used, the SVM becomes easier to
produce false detections. Also the background infrared intensity needs to be maintained at a
stable level without large variations, to avoid any potential harm to the training result.
SYSTEM DEVELOPMENT AND DESCRIPTIONS
Our goal is to develop a real-time night pedestrian detection system, which helps drivers
to avoid the traffic accidents due to the low visibility during night time.
Fig. 9. Abstract Procedure of This System

7
Fig.10 Flow Chart of Detailed Procedures (video input, sub-sample, warning)
Video
Input
Resample
Binarization
Noise
Removal
Verification
TrackingWarning
Candidate
Location

8
1) Initial System Interface
1. Threshold of binarization
2. Histogram of the distribution of gray-scaled pixels
3. Cursor position over the image
4. The mean and variation over whole image
5. Start resampling with selected criterions
6. Batch list of input image files
7. Original image
8. Image after resampling
In the following paragraphs, most procedures are introduced with their intention and methods
first, followed by a screenshot of the system interface used to accomplish this procedure.

9
2) Procedures
2.1 Continuous Infrared Image Input
(INTENTION)
Using the infrared video-taping to obtain continuous images of drive ways during night
time as input, the system will analyze on a per-image basis as well as the batched tracking.
Here we use one infrared picture provided from Toyota, Japan to illustrate the following
procedures and the interfaces appeared:
(INTERFACE)
There are two ways to input the image samples. The system can automatically analyze and
track a batch of continuous (in terms of timeline) image files by clicking the “Batch List”
and read in the text file which contains the file names and their associated file paths. If we
want to analyze single image, simply click on File >> Open, and read in the image as we
normally do with any program. After the process of single image, we can click on File >>
Next Image on the menu bar to input the following image of timeline.
Fig.12. Open Single Image File

10
2.2 Resampling
(INTENTION)
Originally, we planned to reduce fuzziness of the images resulted from the shaking of
the camera on equipped vehicle, by equalizing the histograms to enhance contrast, and
to make the pixel distribution more unified. Yet we found that this way also reduced
some deterministic characteristics of pedestrians, which made them even harder to
detect. Then we’ve observed that, one property of the camera’s formation of images
was shifting the odd number of rows in an opposite direction with the even number of
rows. Hence, we figured out to solve this problem by shrinking the image to 1/4 of its
original size, which removed the shifting phenomenon as showed in Fig.13 and Fig.14.
The interface of this part will be shown in the following Binarization phase.
2.3 Binarization
(INTENTION)
During this phase, we converted the gray-scale into binary images. After histogram
equalization, there remained fragments of colors and textures on the road, which
would interfere with out detection, hence a binarization was used to reduce
non-necessary information remained on the image, leaving only the shape of larger
objects like this:
Fig.13. Original Image
Fig.14. Image After Resizing to a Smaller Scale
11
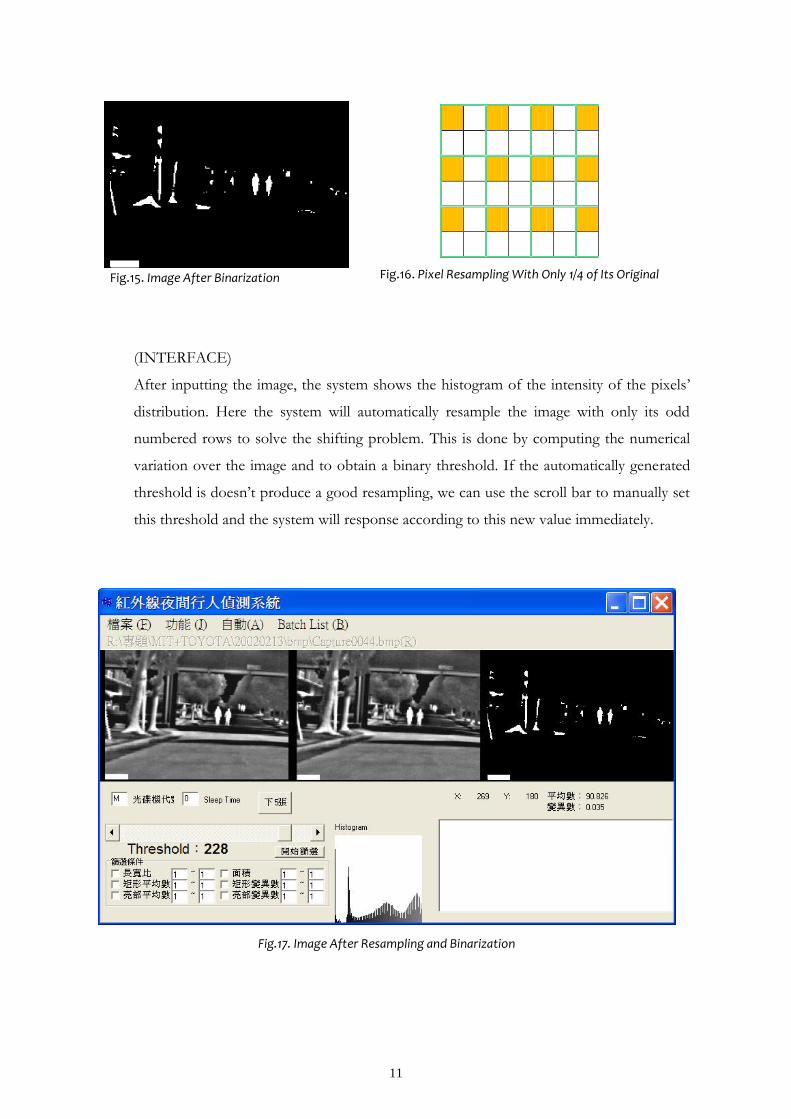
Fig.15. Image After Binarization
(INTERFACE)
After inputting the image, the system shows the histogram of the intensity of the pixels’
distribution. Here the system will automatically resample the image with only its odd
numbered rows to solve the shifting problem. This is done by computing the numerical
variation over the image and to obtain a binary threshold. If the automatically generated
threshold is doesn’t produce a good resampling, we can use the scroll bar to manually set
this threshold and the system will response according to this new value immediately.
Fig.16. Pixel Resampling With Only 1/4 of Its Original
Fig.17. Image After Resampling and Binarization
12
2.4 Noise Removal
(INTENTION)
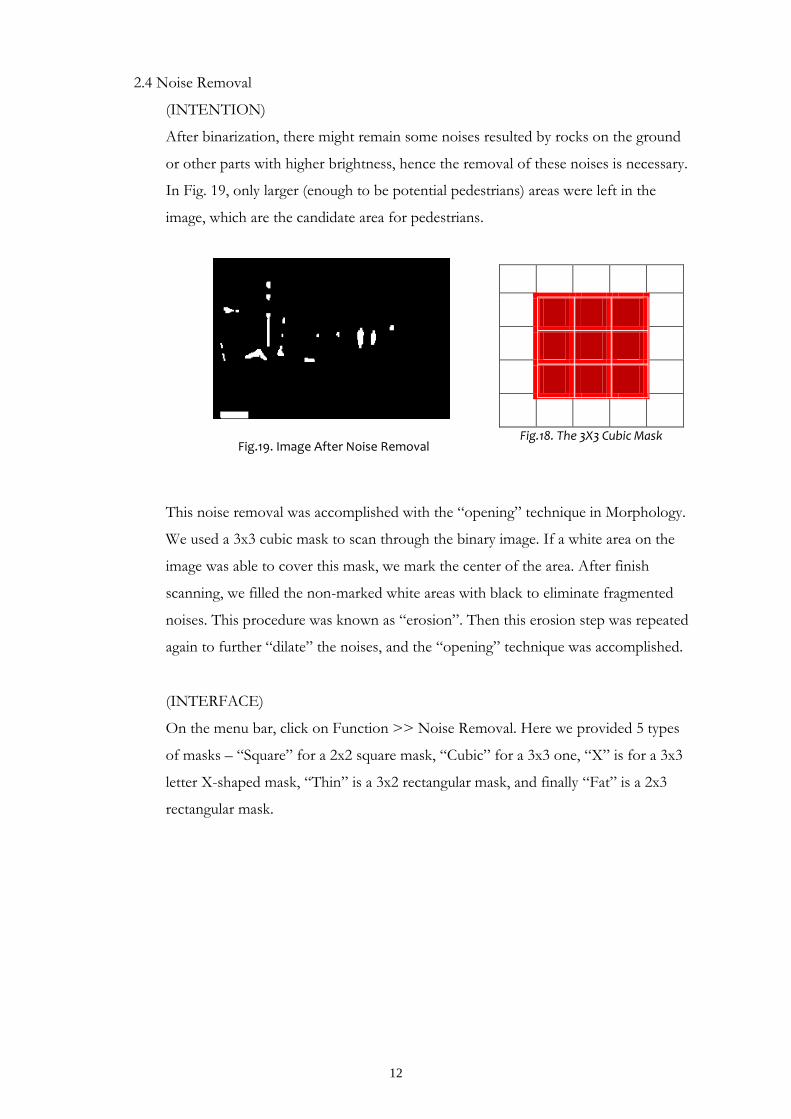
After binarization, there might remain some noises resulted by rocks on the ground
or other parts with higher brightness, hence the removal of these noises is necessary.
In Fig. 19, only larger (enough to be potential pedestrians) areas were left in the
image, which are the candidate area for pedestrians.
This noise removal was accomplished with the “opening” technique in Morphology.
We used a 3x3 cubic mask to scan through the binary image. If a white area on the
image was able to cover this mask, we mark the center of the area. After finish
scanning, we filled the non-marked white areas with black to eliminate fragmented
noises. This procedure was known as “erosion”. Then this erosion step was repeated
again to further “dilate” the noises, and the “opening” technique was accomplished.
(INTERFACE)
On the menu bar, click on Function >> Noise Removal. Here we provided 5 types
of masks – “Square” for a 2x2 square mask, “Cubic” for a 3x3 one, “X” is for a 3x3
letter X-shaped mask, “Thin” is a 3x2 rectangular mask, and finally “Fat” is a 2x3
rectangular mask.
Fig.18. The 3X3 Cubic Mask Fig.19. Image After Noise Removal

13
Fig.20. Noise Removal With a 3x3 Cubic Mask
2.5 Connected Component
(INTENTION)
Here we use the connected component algorithm to mark each individual white area
in the image, and each area corresponds to a candidate region of a pedestrian.
Fig.21. Connected Components Detected For Figure. 19
Occasionally, the connected components detected after binarization would produce
oversized connected areas, hence the system is designed to repeat binarization and
noise removal, using a new threshold level to separate these large and fragmented
pieces, and to reform a smaller connected components of reasonable size.

14
(INTERFACE)
After the image is processed with binarization, click Function >> Connected
Component on the menu bar. The system will now use bypass algorithm to calculate
the independent areas. Then we select Function >> Circle Components, the
computed connected areas will be marked with green rectangles.
Fig.23. The Connected Components Are Circled With Green Rectangles
Fig.22. Selecting The Connected Component

15
2.6 Verification
After we have found the candidate regions, we need to verify which are potential
pedestrians. Here we consider some criteria to eliminate objects that are impossible
to be humans: First of all, pedestrians must walk on the ground, hence the region
under the objects should be the ground. According to the position of the ground we
can eliminate unreasonable candidates. As shown in Fig. 24, we eliminate the objects
outside the “box” which the driving vehicle can possibly bump into. A limitation
here is that, because the areas on the left and right side of the image represent the
drive ways which are very close to the vehicle, in the case that any pedestrian rushed
out, we won’t have enough time what so ever to stop the car. Hence this is an
exception which is unable to be handled with in this system. Also, the pedestrians
are assumed to be “walking” on the road in stead of lying or sitting, hence we
eliminate the unreasonable height-width ratios of the objects. Finally, because the
intensity of infrared emitted by human is relatively different from other objects, this
can be another implication of possible pedestrian by analyzing their mean and
variation of numeric values. After all these analysis, the system selects only the
reasonable regions to be potential pedestrians.
Fig.25. Potential Pedestrian Detected By Verification
(INTERFACE)
Simply click on the “Verification” bottom, and that does its job.

16
2.7 Tracking
After the candidates are successfully located, the system will then keep track of them
over a series of continuous images, and warn if the pedestrian is within a dangerous
distance to the vehicle. We used the concept of Kalman Filter to utilize the
previously located position of one pedestrian to predict its position in the next image,
which reduces the process time. After a certain amount of tracking, the system will
be able to calculate the direction in which the pedestrian is moving, and even if it is
temporarily blocked by some obstacles, the system can still keep track of it using the
calculated predictions for a considerable period of time.
Fig.27. Keeping Track of The Pedestrians On Batch of Images
Fig.26. Candidates After Verification

17
(INTERFACE)
After the verification, click on Function >> Trace, and the system will keep a log of
current position of the pedestrians for future prediction.
Fig.28. Select The “Trace” Option
2.8 Batch Processing
(INTENTION & INTERFACE)
To achieve the real-time processing, the system can read in the text files containing
multiple file paths to simulate the actual video input on the road. There is a built-in
scheme which applies all the process over each image and in the middle of the
interface it will show as a serious of results in an “animated” fashion, which is what
supposed to be seen in the real-world application.

18
Fig.29. “Animated” Batch Processing
RESULT AND DISCUSSION
We had used 1616 images for testing this system, including 15 people walking throughout
the time being. With single image verification (not considering tracking), 1847 pedestrians were
successfully detected with a total of 2486 people in the testing data, yielding a successful rate of
74.2%. With tracking, 12 out of 15 walking people were detected and successfully tracked over
a period of time, yielding the successful rate to be 80%. Among these, 16 items were
misinterpreted as pedestrians, including trees and other similar objects.
Here we provide some factors that contributed to the errors:
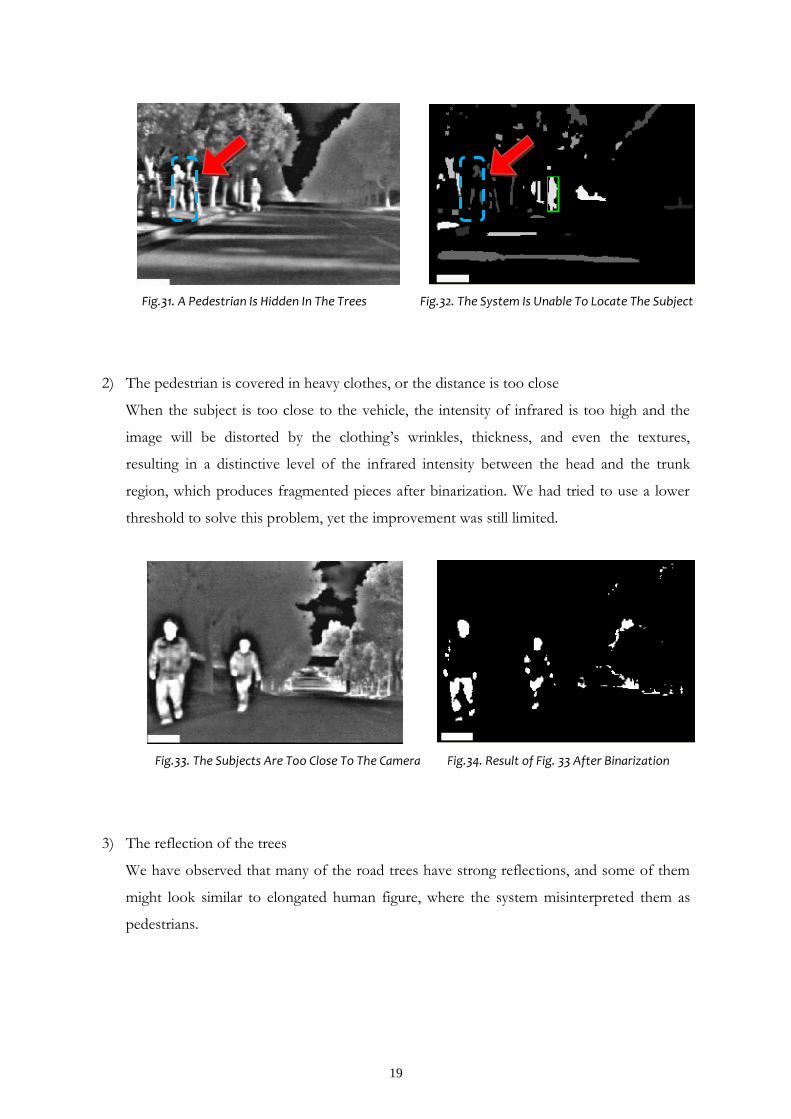
1) The pedestrian is hidden behind some objects
In the presence of trees, the pedestrian is possible to be hidden by the tree. Therefore the
human body would appear as fragmented pieces which interfere with the detection. If the
subject was previously tracked, the system might still be able to keep track of him using
previous predictions. However if the time of being hidden is too long, the system will
eventually lose track of it and requires to relocate it next time the subject reappears.
Verification Tracking Error
74.2% 80% 16(items)
Fig.30. Statistics of Successful Rates
19
2) The pedestrian is covered in heavy clothes, or the distance is too close
When the subject is too close to the vehicle, the intensity of infrared is too high and the
image will be distorted by the clothing’s wrinkles, thickness, and even the textures,
resulting in a distinctive level of the infrared intensity between the head and the trunk
region, which produces fragmented pieces after binarization. We had tried to use a lower
threshold to solve this problem, yet the improvement was still limited.
3) The reflection of the trees
We have observed that many of the road trees have strong reflections, and some of them
might look similar to elongated human figure, where the system misinterpreted them as
pedestrians.
Fig.31. A Pedestrian Is Hidden In The Trees Fig.32. The System Is Unable To Locate The Subject
Fig.33. The Subjects Are Too Close To The Camera Fig.34. Result of Fig. 33 After Binarization

20
4) Diffusion of infrared from the surroundings
This is found especially in urban area, where multiple sources such as street light and cars
which also emits a high level of infrared. In the presence of objects with smooth surfaces
or buildings that allow for easy reflection, the infrared is diffused disorderly throughout the
image. This will result in the average level of infrared intensity in the image is too high,
which interferes the detection of pedestrians.
Fig.35. Tree Reflections Detected As Human Candidate
Fig.36. Diffusion of Infrared In The Surroundings
Fig.37. The Diffusion Caused The Binarization Lose Track Of Pedestrians

21
CONCLUSION
The system we’ve developed is a simple yet realistic model of detecting the pedestrians in
the real world with the successful rate of 74.2% in verification, and 80% correctness in tracking.
Under certain circumstances the detection was limited by some possible factors as discussed
above. In the future, we hope to incorporate the technique of machine learning and AI to
further enhance the correctness into this system, including the ability to detect subjects
regardless of weather, clothing, or other noises, to precisely locate the whole human body. We
believe that this will be a very practical application which is able to efficiently reduce the traffic
accidents caused by low visibility during night time. Further improvements of this system
might include pedestrian detection and tracking during the daytime, snow days where the light
is intensively reflected to harm the visibility, or even marine applications which performs under
deep water (a typical environment with extremely low visibility).
REFERENCES
[1] C. Büttner, “Next Generation Thermal Infrared Night Vision System,” AMAA Conference, Berlin, 2005.
[2] D. M. Gavrila, J. Giebel, and S. Munder, “Vision-based Pedestrian Detection: the PROTECTOR System,”
Proceedings of the IEEE Intelligent Vehicles Symposium,pp.13-18 , Parma, Italy, 2004.
[3] R. C. Gonzalez and R. E. Woods, “Digital Image Processing,” Prentice Hall, London, 2002.
[4] M. Nilsson, D. Binnie, and A. Armitage, “Pedestrian Detection using Low-resolution Thermal Imager
Versus Visual Imager,” PREP 2004, pp.156-157, UK, 2004
[5] A. Shashua, Y. Gdalyahu, and G. Hayon, “Pedestrian Detection for Driving Assistance Systems:
Single-frame Classification and System Level Performance,” Proceedings of the IEEE Intelligent Vehicles Symposium,
pp.1-6, Parma, Italy, 2004.
[6] F. Xu, X. Liu, and K. Fujimura, “Pedestrian Detection and Tracking with Night Vision,” IEEE Trans. on
Intelligent Transportation Systems, VOL.6, pp. 63-71, 2005.
[7] M. Yasuno, S. Ryousuke, N. Yasuda, and M. Aoki, “Pedestrian Detection and Tracking In Far Infrared
Images,” Proceedings of the 8th International IEEE Conference on Intelligent Transportation Systems, pp.125, Vienna,
Austria, 2005.