Embed Size (px)
Citation preview

Infrared surface polaritons on antimony
Justin W. Cleary,1,*
Gautam Medhi,2 Monas Shahzad,
2 Imen Rezadad,
2 Doug
Maukonen,2 Robert E. Peale,
2 Glenn D. Boreman,
3 Sandy Wentzell,
4 and Walter R.
Buchwald4
1Sensors Directorate, Air Force Research Laboratory, Wright-Patterson Air Force Base, Ohio, 45433, USA 2Department of Physics, University of Central Florida, Orlando, Florida 32816, USA
3Department of Physics and Optical Science, University of North Carolina at Charlotte, Charlotte NC 28223, USA 4Solid State Scientific Corporation, Hollis, New Hampshire 03049, USA
Abstract: The semimetal antimony, with a plasma frequency ~80 times less
than that of gold, is potentially useful as a host for infrared surface
polaritons (SPs). Relevant IR SP properties, including the frequency-
dependent propagation length and penetration depths for fields into the
media on either side of the interface, were determined from optical
constants measured on optically-thick thermally-evaporated Sb films over
the wavelength range 1 to 40 µm. Plasma and carrier relaxation frequencies
were determined from Drude-model fits to these data. The real part of the
permittivity is negative for wavelengths beyond 11 µm. Distinct resonant
decreases in specular reflected intensity were observed for Sb lamellar
gratings in the wavelength range of 6 to 11 µm, where the real part of the
permittivity is positive. Both resonance angles and the angular reflectance
spectral line shapes are in agreement with theory for excitation of bound
surface electromagnetic waves (SPs). Finite element method (FEM)
electrodynamic simulations indicate the existence of SP modes under
conditions matching the experiments. FEM results also show that such
waves depend on having a significant imaginary part of the permittivity, as
has been noted earlier for the case of surface exciton polaritons.
© 2012 Optical Society of America
OCIS codes: (240.5420) Polaritons; (240.6690) Surface waves; (240.6680) Surface plasmons;
(040.3060) Infrared; (350.2770) Gratings; (280.4788) Optical sensing and sensors.
References and links
1. A. Brillante, I. Pockrand, M. R. Philpott, and J. D. Swalen, “Experimental Observation of Exciton Surface
Polaritons on a Polymerized Diacetylene Crystal,” Chem. Phys. Lett. 57(3), 395–399 (1978).
2. F. Yang, J. R. Sambles, and G. W. Bradberry, “Long-Range Surface Modes Supported By Thin Films,” Phys.
Rev. B Condens. Matter 44(11), 5855–5872 (1991).
3. F. Yang, G. W. Bradberry, and J. R. Sambles, “Experimental Observation of Surface Exciton-polaritons on
Vanadium using Infrared Radiation,” J. Mod. Opt. 37(9), 1545–1553 (1990).
4. R. Soref, R. E. Peale, and W. Buchwald, “Longwave plasmonics on doped silicon and silicides,” Opt. Express
16(9), 6507–6514 (2008).
5. J. W. Cleary, R. E. Peale, D. J. Shelton, G. D. Boreman, C. W. Smith, M. Ishigami, R. Soref, A. Drehman, and
W. R. Buchwald, “IR permittivities for silicides and doped silicon,” J. Opt. Soc. Am. B 27(4), 730–734 (2010).
6. M. Shahzad, G. Medhi, R. E. Peale, W. R. Buchwald, J. W. Cleary, R. Soref, G. D Boreman, and O. Edwards,
“Infrared surface plasmons on heavily doped silicon,” J. Appl. Phys. 110(12), 123105 (2011).
7. J. C. Ginn, R. L. Jarecki, Jr., E. A. Shaner, and P. S. Davids, “Infrared plasmons on heavily-doped silicon,” J.
Appl. Phys. 110(4), 043110 (2011).
8. H. Raether, “Surface plasma oscillations and their applications,” in Physics of Thin Films (Academic Press, New
York, 1977) 9, 145–261.
9. J. W. Cleary, G. Medhi, R. E. Peale, and W. R. Buchwald, “Long-wave infrared surface plasmon grating
coupler,” Appl. Opt. 49(16), 3102–3110 (2010).
10. P. Halevi, in Electromagnetic Surface Modes, A. D. Boardman, ed. (Wiley, Chichester, 1982).
11. M. G. Cottam and D. R. Tilley, Introduction to Surface and Superlattice Excitations, (Cambridge Univ.
Cambridge UK, 1988).
12. E. B. Sernelius, Surface modes in Physics, (Wiley-Vch, Berlin, 2000).
#157835 - $15.00 USD Received 9 Nov 2011; revised 5 Jan 2012; accepted 5 Jan 2012; published 23 Jan 2012(C) 2012 OSA 30 January 2012 / Vol. 20, No. 3 / OPTICS EXPRESS 2693

13. H. Raether, Surface Plasmons on Smooth and Rough Surfaces and on Gratings (Springer, New York, 1988).
14. K. Welford, “Surface plasmon-polaritons and their uses,” Opt. Quantum Electron. 23(1), 1–27 (1991).
15. A. Hessel and A. A. Oliner, “A new theory of Wood’s anomalies on optical gratings,” Appl. Opt. 4(10), 1275–
1297 (1965).
16. L. D. Landau, E. M. Lifshitz, and L. P. Pitaevskii, Electrodynamics of continuous media, Course of theoretical
physics vol. 8 (Butterworth-Heinenann, Oxford, 2002), Sect. 87.
17. E. B. Saff and A. D. Snider, Fundamentals of complex analysis with applications to engineering and science, 3rd
ed. (Pearson Education,Upper Saddle River, New Jersey, 2003).
18. P. Y. Yu and M. Cardona, Fundamentals of Semiconductors (Springer, Berlin, 1996).
19. H. G. Tompkins and E. A. Irene, Handbook of Ellipsometry (William Andrew, Heidelberg, 2005).
20. T. J. Fox, R. P. Howson, and D. C. Emmony, “Optical properties of thin films of antimony,” J. Phys. D Appl.
Phys. 7(13), 1864–1872 (1974).
21. L. Harris and F. R. Corrigan, “Optical and electrical properties of antimony deposits,” J. Opt. Soc. Am. 54(12),
1437–1441 (1964).
22. I. N. Shkliarevskii, A. A. Avdeenki, and V. G. Padalka, “Measurements of the Optical Constants of Antimony in
the Infrared Region of the Spectrum at Temperatures of 290° and 110°,” Opt. Spectrosc. 6, 336 (1959).
23. J. W. Cleary, G. Medhi, R. E. Peale, W. Buchwald, O. Edwards, and I. Oladeji, “Infrared surface plasmon
resonance biosensor,” Proc. SPIE 7673, 767306, 767306-11 (2010).
24. J. W. Cleary, R. E. Peale, D. Shelton, G. D. Boreman, R. Soref, and W. Buchwald, “Silicides for infrared surface
plasmon resonance biosensors,” Proc. MRS 1133, 1133-AA10-03 (2008).
1. Introduction
Surface polaritons are electromagnetic waves coupled to surface polarization and are
described by the equations of macroscopic electrodynamics [1–3]. They have been studied
extensively in the visible and infrared wavelength region on semiconductors [4–7] and metals
[8, 9]. Different types of surface polarization may be involved, including plasmon, phonon,
magnon, and exciton [1–3]. Electrodynamic characteristics of these SPs, such as dispersion,
energy propagation length, and field penetration depth, have identical formulation in terms of
their wave function and the complex permittivities (or permeabilities) of the media on either
side of the interface [10]. The characteristic optical excitation of SPs utilizing the surface
electric polarization is via an incident p-polarized electric field with a field vector that lies in
the plane containing the surface normal and the SP propagation wavevector.
It is commonly asserted that a surface plasmon polariton can be excited at a
conductor/dielectric interface only when the conductor has a negative permittivity [8]
provided that the absolute value of the conductor’s permittivity significantly exceeds the
positive permittivity of the dielectric. These conditions are most clear when the permittivities
of both media are entirely real. However, these conditions for sustaining a surface plasmon
polariton are not absolute [2, 3]. In fact, as long as the permittivity of the conductor is
complex, a non-radiative surface mode may exist over the entire frequency range regardless
of the sign of the real part since all associated wavevectors will also be complex [2]. Whether
the mode is propagating or not and how quickly it decays in each medium away from the
interface can be determined by the values of the real and imaginary components of all
associated wavevectors. Bound surface waves that exist when the real part of the permittivity
is small and positive, while the imaginary part exceeds the real part are known [2]. Different
types of surface modes that depend on different types of surface polarization and different
relations between real and imaginary parts of the permittivity are discussed in [10–14].
This work presents a determination of relevant IR SP properties for the semimetal Sb,
including the frequency-dependent propagation length and penetration depths for the fields
into the media on either side of the interface. These properties are calculated using optical
constants that were measured over the wavelength range 1 to 40 µm on optically thick Sb.
Plasma and carrier relaxation frequencies are determined from Drude-model fits to these data.
The optical excitation of SPs in this material is verified experimentally by considering the
angular dependence of reflection from lamellar gratings. Interestingly, distinct absorption
resonances consistent with SP generation are experimentally observed in these angular
reflection spectra at wavelengths where the real part of the complex permittivity is positive.
These absorption resonances are found to be consistent with standard analytical theory that
#157835 - $15.00 USD Received 9 Nov 2011; revised 5 Jan 2012; accepted 5 Jan 2012; published 23 Jan 2012(C) 2012 OSA 30 January 2012 / Vol. 20, No. 3 / OPTICS EXPRESS 2694
predicts a bound surface wave and with commercial finite element method (COMSOL-FEM)
simulations that provide strong confirmation of such waves. These SP modes disappear in the
simulations when the imaginary part of the complex permittivity is artificially zeroed,
supporting the condition of having a sufficiently large imaginary part [2] for their appearance.
SP modes on Sb are a potential means of information transport in future nanophotonic
devices due to tighter IR SP field confinement when compared to plasmon hosts such as noble
metals. Their most significant potential commercial application is in biosensors, where the
time dependent change in the resonant coupling of light to SPs gives information on binding
and interactions of biomolecules to a suitably functionalized surface. The resonances reported
here are potentially useful for this IR sensor application. Sensor applications simply require
the existence of a suitable resonance that is sensitive to changes in the dielectric permittivity
at the interface with the conductor.
2. Theoretical considerations
The p-polarized (TM) surface polaritons at a dielectric-metal interface are described by their
magnetic field wave functions, which can be written as
( ),,
y o sp zd zcH H Exp i K x K z = − (1)
where the complex surface polariton propagation vector along the interface (x-direction) KSP
is [3]
( ) .d c
SP
d c
Kc
ε εωω
ε ε=
+ (2)
Here εd and εc are the complex permittivities of the dielectric and conductor, respectively. The
complex wavevector of the surface polariton in the direction perpendicular to and on either
side of the interface is given by
2
2
, , ,zd zc SP d cK Kc
ωε = −
(3)
where Kzd refers to the dielectric region with z > 0 (above the interface into the dielectric) and
Kzc the conductor region z < 0. For traditional surface plasmon polariton hosts, such as gold at
frequencies below its plasma frequency, we have Re[KSP] >> Im[KSP], which results in a
bound surface wave propagating along the interface. Also in this traditional case, Im[Kzd,zc] >>
Re[Kzd,zc] below the plasma frequency resulting in rapid exponential decay of the
electromagnetic fields in the direction perpendicular to the interface. Above the plasma
frequency, on the other hand, Re[Kzd,zc ] >> Im[Kzd,zc] leading to the propagation of energy
away from the interface. For the semi-metal Sb discussed here, Re[KSP ] ~ Im[KSP] and
Re[Kzd,zc] ~Im[Kzd,zc] leading to a situation where surface waves at frequencies both above and
below the plasma frequency have similar characteristics.
Knowledge of the decay length for propagation of energy and the penetration depth for the
field into the media on either side of the interface is important for determining how useful a
particular conductor is for various applications. The energy decay length (1/2 of the electric
field decay length) in the direction of propagation [8] is given by
( )( )
1.
2 Imx
SP
LK ω
= (4)
The 1/e penetration depth of the surface polariton fields [8] into the dielectric, Ld, or into
the conductor, Lc, is given by
#157835 - $15.00 USD Received 9 Nov 2011; revised 5 Jan 2012; accepted 5 Jan 2012; published 23 Jan 2012(C) 2012 OSA 30 January 2012 / Vol. 20, No. 3 / OPTICS EXPRESS 2695
12
,
,Im .
d c
d c
d c
Lc
εωε ε
− =
+ (5)
For traditional surface plasmon polariton hosts, at frequencies below the material’s plasma
frequency, KSP exceeds the wavevector of a freely propagating optical field at the same
frequency and as such there can be no direct excitation of SP modes from optical fields. When
εc′ > 0, KSP is less than the wavevector of a freely propagating optical field, i.e. the SP
dispersion curve lies above the grazing-incidence light line and thus no momentum matching
device (prism or grating) is required to excite such SPs. For Sb, the SP dispersion lies very
close to the grazing-incidence light line at all frequencies, but grazing incidence is
experimentally impractical for the excitation of SPs and observation of their effects. To
alleviate this problem, a grating coupler can be used to allow for a more convenient angle of
incidence. The coupling condition [8, 9] between an electromagnetic wave, which is incident
from the dielectric at an angle θ onto a conducting grating, and a SP is given by
( )sin Re[ ] ,SP
m cK
p
λθ
ω+ = ± (6)
where p is the grating period, m is an integer of either sign, and λ is the excitation wavelength.
Our experiment considers only positive angles of incidence θ.
Angular reflection spectra associated with the excitation of SP modes can be described
using the analytical theory of Hessel and Oliner [15], which predicts absorption resonances
that are accompanied by surface waves with wavefunctions given by Eq. (2). We adopt the
simplifying assumption that the grating is represented by a sinusoidal surface impedance [9].
Only the first order resonance (m = 1) appears in this case, but this suffices to characterize the
photon-to-SP resonant coupling. The theory of Hessel and Oliner gives the specular reflection
from a grating, R, in the form
( )
2
1 1
0 1 1
4cos1 .R abs
M D D D
θζ − −
−
≈ −
− − (7)
where M is the unitless amplitude of the sinusoidal impedance modulation [9, 15], ζ is the
spatial-average surface impedance relative to the impedance of free space (377 Ω) and the
coefficients D with a subscript integer s are given by
2
2 11 1 sin .
s
sD
M p
λθ
ζ
= + − +
(8)
With ζ = 1/√[εc] and εc′ = εc′ + i εc′′ we obtain
( ) 1/42 2
0cos sin ,
01 2 2
c
c c
c
'i= ' + '' i for
'
εφ φζ ε ε
ε− <− − >
(9)
where φ = tan−1
(εc′′/εc′) . On physical grounds we always require Re[ζ] > 0 and Im[ζ] < 0 [16]
which determines the coefficient of the fourth root in Eq. (9) from four possible pre-factors (±
1, ± i) [17]. Finally, to compare experimental reflection data to the theory of Hessel and
Oliner in this work, M, which is an unspecified function of grating permittivity, amplitude and
wavelength, is varied to obtain the best match to the measured data. This qualitative approach
to fitting gives an M value which is accurate to within ~10%.
In general, the aforementioned wave vectors (Kz and KSP) completely describe the SP with
the complex nature of these functions arising primarily from the complex nature of εc. In the
#157835 - $15.00 USD Received 9 Nov 2011; revised 5 Jan 2012; accepted 5 Jan 2012; published 23 Jan 2012(C) 2012 OSA 30 January 2012 / Vol. 20, No. 3 / OPTICS EXPRESS 2696

region of negative permittivity where free carriers dominate, εc takes the Drude form of
[5,18]
( )
( )
2 2/
1 ,1 /
p
c c ci
i τ
ω ωε ε ε ε
ω ω∞
′ ′′ = + = −
+ (10)
where ωp and ωτ are the bulk plasma and electron relaxation frequencies respectively and ε∞ is
the permittivity of the material at frequencies well above the bulk plasma frequency. Equation
(10) is used in this work to extract these Drude parameters for Sb from empirical data.
3. Experimental details
Antimony films were thermally evaporated from 99.999% pure Sb pellets onto various
substrates. The film thickness was monitored during evaporation using a crystal monitor.
Double-side polished high-resistivity silicon substrates allowed transmittance measurements
using a Bomem DA8 Fourier spectrometer with a globar source, KBr beamsplitter, and
HgCdTe detector to determine the IR penetration depth. This information was used to insure
that the films subsequently prepared for ellipsometry measurements were optically thick. An
Sb film deposited on a glass slide was characterized using a J.A. Woollam IR-VASE
ellipsometer in the wavelength range of 1 - 40 µm. The raw ellipsometer output was used to
calculate the complex permittivity spectrum using standard Fresnel equations [19].
Lamellar gratings of 20 µm period, 50% duty cycle and different amplitudes were formed
by photolithography and plasma etching in silicon. Figure 1 (left) presents scanning electron
microscope images of one such patterned silicon substrate. An optically thick Sb layer was
then deposited on these structures, and Fig. 1 (center) presents an SEM image of such a
sample. The subsequent morphology was measured using a step profilometer, and a measured
profile is presented in Fig. 1 (right).
Specular reflectance as a function of incidence angle was obtained for the antimony
gratings using either quantum cascade lasers (QCLs) at 9.38 or 6.14 µm wavelengths, or a
CO2 laser tuned to 9.250 or 10.591 µm wavelength. The QCL multimode lasers have
bandwidths of 0.16% and 0.20% for the 6.14 or 9.38 µm wavelengths, respectively. Either a
77 K, HgCdTe detector (for the QCL) or a power meter (for the CO2 laser) was used to detect
the reflected light. In all cases, the laser radiation was p-polarized, i.e. with the electric field
vector in the plane of incidence. The grating samples and detector were mounted on the θ and
2θ parts of a motorized goniometer, respectively. SP generation was observed as a resonant
decrease in the reflected intensity at certain angles. A schematic of the experiment is shown in
Fig. 1 (right).
Fig. 1. (left) Scanning electron microscope image of a silicon grating substrate with 50% duty
cycle, 20 µm period and 1 µm amplitude. (center) Sb-coating on the same grating structure
with the coating partially removed in upper central region. (right) Schematic of SP experiments
completed in this work. The sources used were a CO2 and quantum cascade lasers with incident
light being p-polarized as indicated by E. A power meter and a HgCdTe detector were used to
measure the specular reflection from the grating as a function of θ. The measured profile
pictured is of a 2-µm-amplitude Sb coated grating.
#157835 - $15.00 USD Received 9 Nov 2011; revised 5 Jan 2012; accepted 5 Jan 2012; published 23 Jan 2012(C) 2012 OSA 30 January 2012 / Vol. 20, No. 3 / OPTICS EXPRESS 2697
4. Results
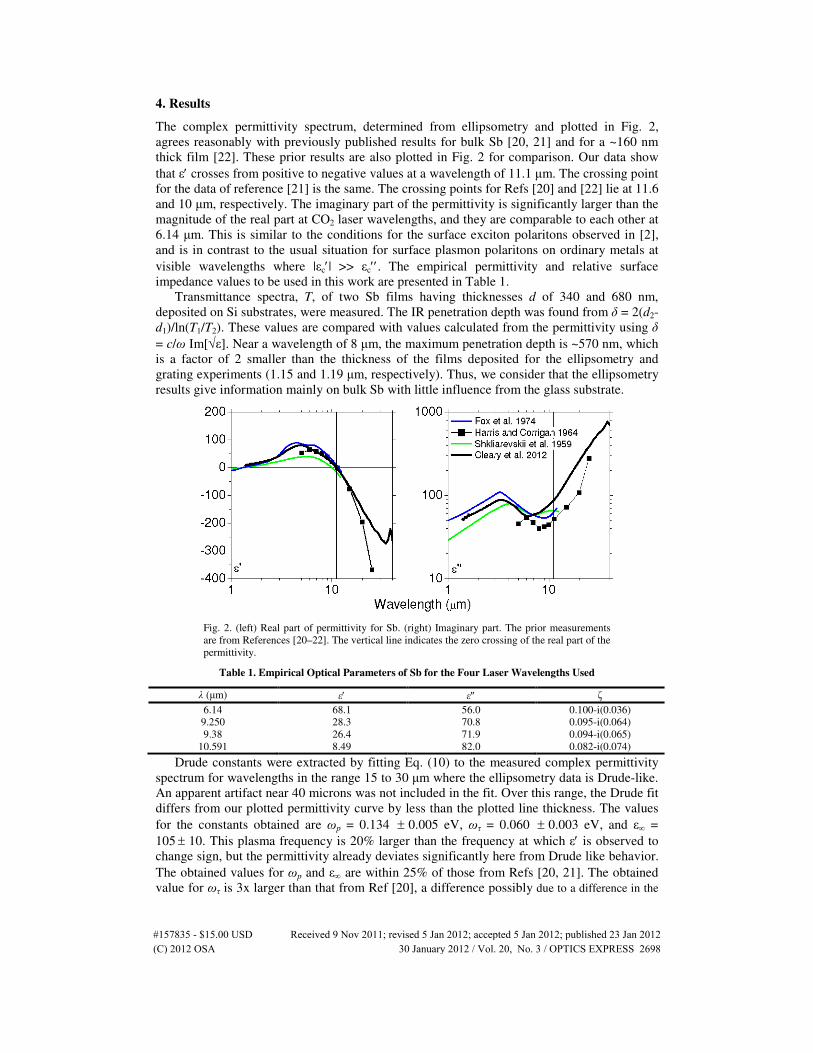
The complex permittivity spectrum, determined from ellipsometry and plotted in Fig. 2,
agrees reasonably with previously published results for bulk Sb [20, 21] and for a ~160 nm
thick film [22]. These prior results are also plotted in Fig. 2 for comparison. Our data show
that ε′ crosses from positive to negative values at a wavelength of 11.1 µm. The crossing point
for the data of reference [21] is the same. The crossing points for Refs [20] and [22] lie at 11.6
and 10 µm, respectively. The imaginary part of the permittivity is significantly larger than the
magnitude of the real part at CO2 laser wavelengths, and they are comparable to each other at
6.14 µm. This is similar to the conditions for the surface exciton polaritons observed in [2],
and is in contrast to the usual situation for surface plasmon polaritons on ordinary metals at
visible wavelengths where |εc′| >> εc′′. The empirical permittivity and relative surface
impedance values to be used in this work are presented in Table 1.
Transmittance spectra, T, of two Sb films having thicknesses d of 340 and 680 nm,
deposited on Si substrates, were measured. The IR penetration depth was found from δ = 2(d2-
d1)/ln(T1/T2). These values are compared with values calculated from the permittivity using δ
= c/ω Im[√ε]. Near a wavelength of 8 µm, the maximum penetration depth is ~570 nm, which
is a factor of 2 smaller than the thickness of the films deposited for the ellipsometry and
grating experiments (1.15 and 1.19 µm, respectively). Thus, we consider that the ellipsometry
results give information mainly on bulk Sb with little influence from the glass substrate.
Fig. 2. (left) Real part of permittivity for Sb. (right) Imaginary part. The prior measurements
are from References [20–22]. The vertical line indicates the zero crossing of the real part of the
permittivity.
Table 1. Empirical Optical Parameters of Sb for the Four Laser Wavelengths Used
λ (µm) ε′ ε″ ζ 6.14 68.1 56.0 0.100-i(0.036) 9.250 28.3 70.8 0.095-i(0.064) 9.38 26.4 71.9 0.094-i(0.065)
10.591 8.49 82.0 0.082-i(0.074)
Drude constants were extracted by fitting Eq. (10) to the measured complex permittivity
spectrum for wavelengths in the range 15 to 30 µm where the ellipsometry data is Drude-like.
An apparent artifact near 40 microns was not included in the fit. Over this range, the Drude fit
differs from our plotted permittivity curve by less than the plotted line thickness. The values
for the constants obtained are ωp = 0.134 ± 0.005 eV, ωτ = 0.060 ± 0.003 eV, and ε∞ =
105 ± 10. This plasma frequency is 20% larger than the frequency at which ε′ is observed to
change sign, but the permittivity already deviates significantly here from Drude like behavior.
The obtained values for ωp and ε∞ are within 25% of those from Refs [20, 21]. The obtained
value for ωτ is 3x larger than that from Ref [20], a difference possibly due to a difference in the
#157835 - $15.00 USD Received 9 Nov 2011; revised 5 Jan 2012; accepted 5 Jan 2012; published 23 Jan 2012(C) 2012 OSA 30 January 2012 / Vol. 20, No. 3 / OPTICS EXPRESS 2698
microsctructure of our film. Since the experiments discussed in this work occur in regions of
positive permittivity where the Drude model is invalid, all calculations relevant to SPs in this
work are based on empirical permittivities.
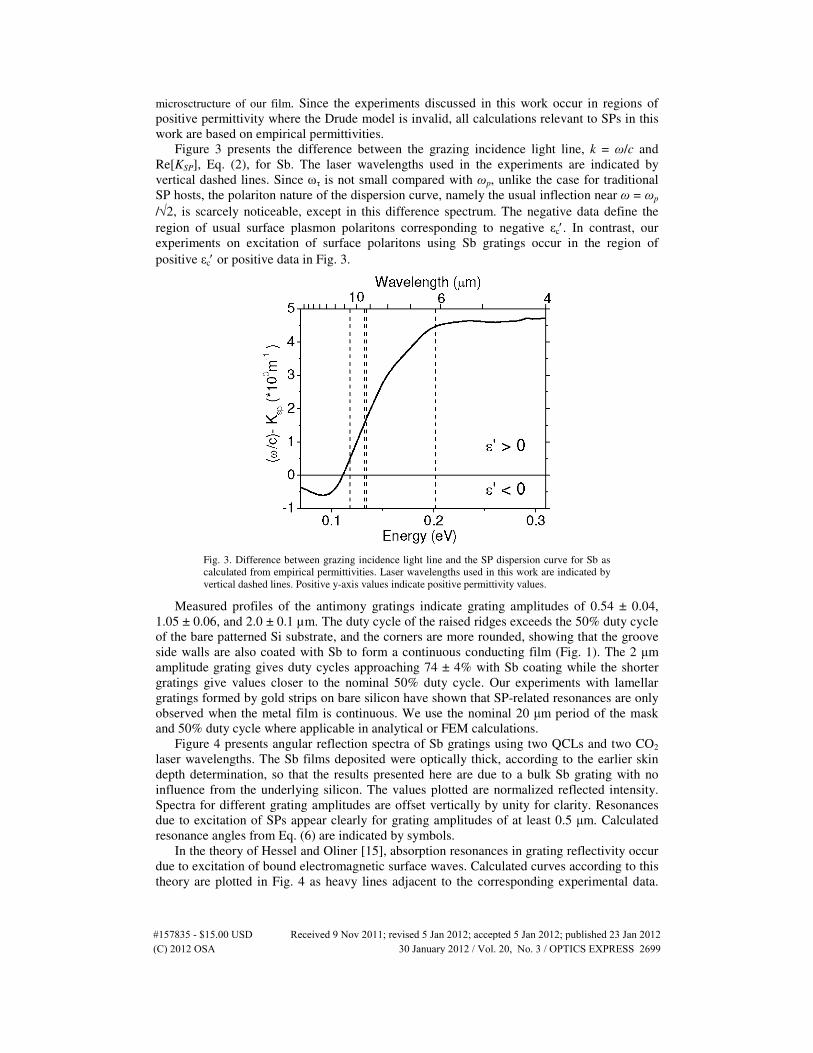
Figure 3 presents the difference between the grazing incidence light line, k = ω/c and
Re[KSP], Eq. (2), for Sb. The laser wavelengths used in the experiments are indicated by
vertical dashed lines. Since ωτ is not small compared with ωp, unlike the case for traditional
SP hosts, the polariton nature of the dispersion curve, namely the usual inflection near ω = ωp
/√2, is scarcely noticeable, except in this difference spectrum. The negative data define the
region of usual surface plasmon polaritons corresponding to negative εc′. In contrast, our
experiments on excitation of surface polaritons using Sb gratings occur in the region of
positive εc′ or positive data in Fig. 3.
Fig. 3. Difference between grazing incidence light line and the SP dispersion curve for Sb as
calculated from empirical permittivities. Laser wavelengths used in this work are indicated by
vertical dashed lines. Positive y-axis values indicate positive permittivity values.
Measured profiles of the antimony gratings indicate grating amplitudes of 0.54 ± 0.04,
1.05 ± 0.06, and 2.0 ± 0.1 µm. The duty cycle of the raised ridges exceeds the 50% duty cycle
of the bare patterned Si substrate, and the corners are more rounded, showing that the groove
side walls are also coated with Sb to form a continuous conducting film (Fig. 1). The 2 µm
amplitude grating gives duty cycles approaching 74 ± 4% with Sb coating while the shorter
gratings give values closer to the nominal 50% duty cycle. Our experiments with lamellar
gratings formed by gold strips on bare silicon have shown that SP-related resonances are only
observed when the metal film is continuous. We use the nominal 20 µm period of the mask
and 50% duty cycle where applicable in analytical or FEM calculations.
Figure 4 presents angular reflection spectra of Sb gratings using two QCLs and two CO2
laser wavelengths. The Sb films deposited were optically thick, according to the earlier skin
depth determination, so that the results presented here are due to a bulk Sb grating with no
influence from the underlying silicon. The values plotted are normalized reflected intensity.
Spectra for different grating amplitudes are offset vertically by unity for clarity. Resonances
due to excitation of SPs appear clearly for grating amplitudes of at least 0.5 µm. Calculated
resonance angles from Eq. (6) are indicated by symbols.
In the theory of Hessel and Oliner [15], absorption resonances in grating reflectivity occur
due to excitation of bound electromagnetic surface waves. Calculated curves according to this
theory are plotted in Fig. 4 as heavy lines adjacent to the corresponding experimental data.
#157835 - $15.00 USD Received 9 Nov 2011; revised 5 Jan 2012; accepted 5 Jan 2012; published 23 Jan 2012(C) 2012 OSA 30 January 2012 / Vol. 20, No. 3 / OPTICS EXPRESS 2699

The theory curves have been shifted vertically by amounts necessary to avoid overlapping the
experimental curves. Except for the sharp upward spikes at the highest grating amplitudes, the
calculated resonance spectra from Eq. (7) represent resonance positions, strengths, and widths
in fair agreement with the observations. The agreement in angular position is better for the
data from the CO2 laser because of its superior beam quality and intensity which more
accurately defines the angle of incidence. The similarity in experimental and calculated
resonance spectra supports the interpretation that creation of bound surface waves is
responsible for the resonances. Angular reflection spectra for uncoated silicon gratings show
no resonances [6], additionally supporting the interpretation that the observed resonances are
due to the excitation of bound SPs on antimony.
Fig. 4. Angular reflectance spectra of Sb gratings at QCL and CO2 laser wavelengths. Smooth
curves are calculated reflectance spectra. Grating amplitudes used (from the top) were 2, 1, and
0.5 µm.
FEM simulations (COMSOL Multiphysics) support the interpretation of resonant
excitation of bound SP waves on antimony, even when εc′ > 0, provided that εc″ is sufficiently
large. Figure 5 presents contour plots of the electric field distribution in the case of an incident
polarized field with a specified λ and θ on an antimony grating. Figure 5 (upper) is for the
case of the photon frequency below the plasma frequency, such that that εc′ < 0, the usual
condition for surface plasmon polariton excitation. Figure 5 (lower) is for the opposite regime,
where εc′ > 0. The incident angles used were chosen to match the first order resonance
condition according to Eq. (6), or 23.6° and 28.1° for 12 and 10.6 µm wavelengths,
#157835 - $15.00 USD Received 9 Nov 2011; revised 5 Jan 2012; accepted 5 Jan 2012; published 23 Jan 2012(C) 2012 OSA 30 January 2012 / Vol. 20, No. 3 / OPTICS EXPRESS 2700
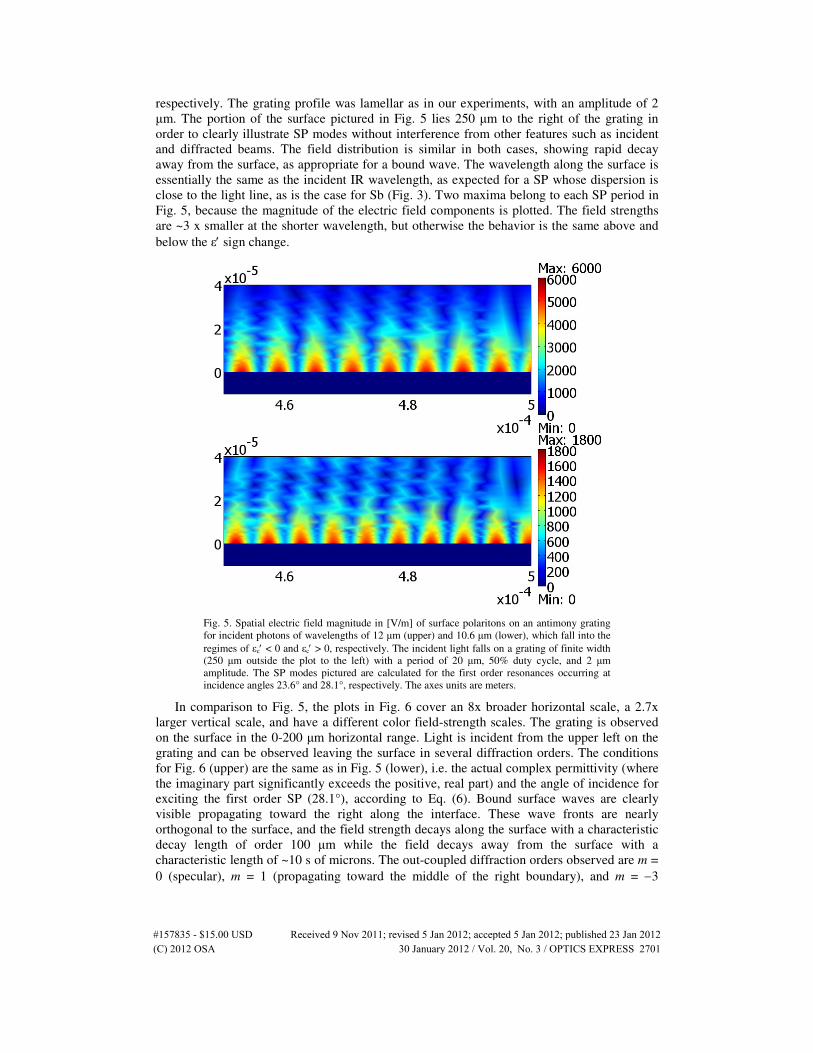
respectively. The grating profile was lamellar as in our experiments, with an amplitude of 2
µm. The portion of the surface pictured in Fig. 5 lies 250 µm to the right of the grating in
order to clearly illustrate SP modes without interference from other features such as incident
and diffracted beams. The field distribution is similar in both cases, showing rapid decay
away from the surface, as appropriate for a bound wave. The wavelength along the surface is
essentially the same as the incident IR wavelength, as expected for a SP whose dispersion is
close to the light line, as is the case for Sb (Fig. 3). Two maxima belong to each SP period in
Fig. 5, because the magnitude of the electric field components is plotted. The field strengths
are ~3 x smaller at the shorter wavelength, but otherwise the behavior is the same above and
below the ε′ sign change.
Fig. 5. Spatial electric field magnitude in [V/m] of surface polaritons on an antimony grating
for incident photons of wavelengths of 12 µm (upper) and 10.6 µm (lower), which fall into the
regimes of εc′ < 0 and εc′ > 0, respectively. The incident light falls on a grating of finite width
(250 µm outside the plot to the left) with a period of 20 µm, 50% duty cycle, and 2 µm
amplitude. The SP modes pictured are calculated for the first order resonances occurring at
incidence angles 23.6° and 28.1°, respectively. The axes units are meters.
In comparison to Fig. 5, the plots in Fig. 6 cover an 8x broader horizontal scale, a 2.7x
larger vertical scale, and have a different color field-strength scales. The grating is observed
on the surface in the 0-200 µm horizontal range. Light is incident from the upper left on the
grating and can be observed leaving the surface in several diffraction orders. The conditions
for Fig. 6 (upper) are the same as in Fig. 5 (lower), i.e. the actual complex permittivity (where
the imaginary part significantly exceeds the positive, real part) and the angle of incidence for
exciting the first order SP (28.1°), according to Eq. (6). Bound surface waves are clearly
visible propagating toward the right along the interface. These wave fronts are nearly
orthogonal to the surface, and the field strength decays along the surface with a characteristic
decay length of order 100 µm while the field decays away from the surface with a
characteristic length of ~10 s of microns. The out-coupled diffraction orders observed are m =
0 (specular), m = 1 (propagating toward the middle of the right boundary), and m = −3
#157835 - $15.00 USD Received 9 Nov 2011; revised 5 Jan 2012; accepted 5 Jan 2012; published 23 Jan 2012(C) 2012 OSA 30 January 2012 / Vol. 20, No. 3 / OPTICS EXPRESS 2701
(propagating toward the middle of the left boundary). The incident beam appears weaker
relative to the other plots in Fig. 6 due to the comparative intensity of the SP fields in Fig. 6
upper.
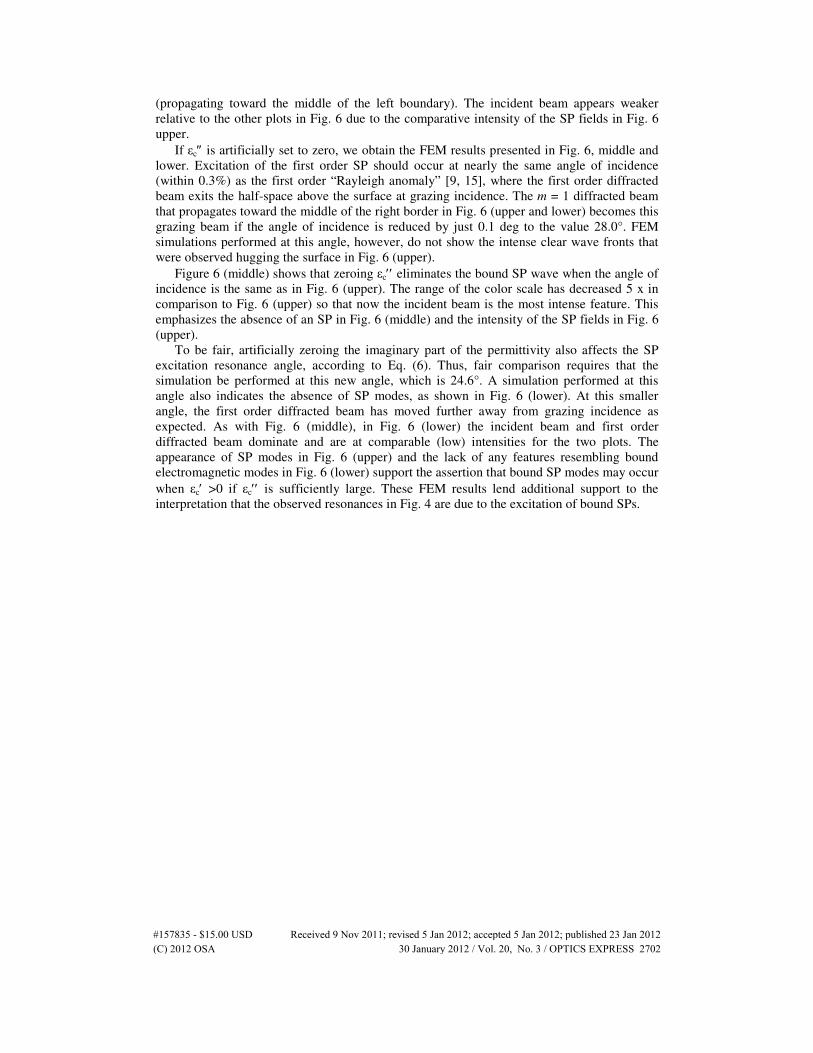
If εc″ is artificially set to zero, we obtain the FEM results presented in Fig. 6, middle and
lower. Excitation of the first order SP should occur at nearly the same angle of incidence
(within 0.3%) as the first order “Rayleigh anomaly” [9, 15], where the first order diffracted
beam exits the half-space above the surface at grazing incidence. The m = 1 diffracted beam
that propagates toward the middle of the right border in Fig. 6 (upper and lower) becomes this
grazing beam if the angle of incidence is reduced by just 0.1 deg to the value 28.0°. FEM
simulations performed at this angle, however, do not show the intense clear wave fronts that
were observed hugging the surface in Fig. 6 (upper).
Figure 6 (middle) shows that zeroing εc′′ eliminates the bound SP wave when the angle of
incidence is the same as in Fig. 6 (upper). The range of the color scale has decreased 5 x in
comparison to Fig. 6 (upper) so that now the incident beam is the most intense feature. This
emphasizes the absence of an SP in Fig. 6 (middle) and the intensity of the SP fields in Fig. 6
(upper).
To be fair, artificially zeroing the imaginary part of the permittivity also affects the SP
excitation resonance angle, according to Eq. (6). Thus, fair comparison requires that the
simulation be performed at this new angle, which is 24.6°. A simulation performed at this
angle also indicates the absence of SP modes, as shown in Fig. 6 (lower). At this smaller
angle, the first order diffracted beam has moved further away from grazing incidence as
expected. As with Fig. 6 (middle), in Fig. 6 (lower) the incident beam and first order
diffracted beam dominate and are at comparable (low) intensities for the two plots. The
appearance of SP modes in Fig. 6 (upper) and the lack of any features resembling bound
electromagnetic modes in Fig. 6 (lower) support the assertion that bound SP modes may occur
when εc′ >0 if εc′′ is sufficiently large. These FEM results lend additional support to the
interpretation that the observed resonances in Fig. 4 are due to the excitation of bound SPs.
#157835 - $15.00 USD Received 9 Nov 2011; revised 5 Jan 2012; accepted 5 Jan 2012; published 23 Jan 2012(C) 2012 OSA 30 January 2012 / Vol. 20, No. 3 / OPTICS EXPRESS 2702
Fig. 6. Spatial electric field magnitude in [V/m] of surface polaritons on an antimony grating at
a wavelength of 10.6 µm. The grating has a period of 20 µm, with a 50% duty cycle and 2 µm
amplitude. The SP modes pictured are calculated using a complex permittivity at 28.1°
incidence (upper), real permittivity at 28.1° (middle), and real permittivity at 24.6° (lower).
Axes units are meters.
The SP energy decay length or propagation length, Lx, is determined from Eq. (4) and is
presented in Fig. 7 (left) as a function of free-space photon wavelength. A broad shallow dip
for Sb occurs near 11 µm where ε′ changes sign. The propagation length is similar on either
side of this transition and the characteristic length of ~100 µm near 10 µm wavelengths is
comparable (within the expected factor of 2) to the electric field decay length along the
interface from the FEM calculations pictured in Fig. 6 (upper).
The characteristic penetration of the SP electric field into the dielectric (in this case air)
and into the conducting film were determined by Eq. (5) and are presented in Fig. 7 (right) as
functions of free space wavelength for antimony. The penetration depth into air is
approximately twice the wavelength in the CO2 laser range. Note that the penetration depths
for Sb differ little on either side of the 11 µm wavelength where εc′ changes sign. This is
already indicated by Fig. 5, where the spatial extent of SP modes differs little on each side of
the plasma wavelength (~11 µm). Inflections are observed near the εc′ sign change similar to
Fig. 7 (left). Both the analytical results (Fig. 7 right) and FEM results (Fig. 5) agree with
mode penetration depths on the order of 10 µm near the experimental wavelengths.
#157835 - $15.00 USD Received 9 Nov 2011; revised 5 Jan 2012; accepted 5 Jan 2012; published 23 Jan 2012(C) 2012 OSA 30 January 2012 / Vol. 20, No. 3 / OPTICS EXPRESS 2703

Fig. 7. Surface polariton properties for antimony. (left) Energy propagation length as a function
of free space wavelength. (right) Field penetration depths versus free space wavelength. Upper
curves show penetration depth into air while the lower curves show penetration depth into the
conductor.
5. Discussion
The traditional conditions for surface plasmon polariton excitation requires εc′ < 0 and |εc′| >>
εc′′ [4,8]. We present evidence that bound surface polaritions, which are similar in all respects
to surface plasmon polaritons, occur on Sb at wavelengths where εc′ is small but positive and
εc′′ is sufficiently large.
For an “ideal” metal, with zero εc′′, and at frequencies where εc′ is negative, Kz would be
pure imaginary and the SP bound. At frequencies with positive permittivity, Kz would be
purely real and the SP unbound. For Sb, Kz, or Eq. (3), has real and imaginary components of
the same order of magnitude on either side of the permittivity sign change, and it varies
slowly and monotonically with no discontinuities in the real or imaginary parts throughout the
2 to 40 µm wavelength range of our permittivity measurements. Hence, the SPs appear bound
on both sides of the sign change with little to distinguish them (Figs. 5 and 7). Clear
resonances are observed in the angular reflectance spectra (Fig. 4). These resonances are
attributable to SPs on Sb since similar measurements on uncoated silicon gratings yield no
resonances unless the carrier concentration exceeds ~1x10²⁰
cm−3
[4, 6]. This SP
interpretation is supported by analytic and FEM calculations. FEM results shown here
indicate that a sufficiently large imaginary part of permittivity is required if the permittivity is
positive in order to excite SPs.
Sensor applications mainly require the existence of a SP resonance that is sensitive to
index changes above the grating. Based on the results shown here that indicate the presence of
SPs on Sb, this semimetal may be useful for mid- to long-wavelength infrared sensing. The
potential advantage of a molecular sensor that operates in the IR is the opportunity to operate
near characteristic vibrational absorption lines [23, 24] where selectivity would be enhanced,
and the dispersion of the refractive index would allow for a larger index change and hence
improved sensitivity.
It may be useful to compare SP properties of Sb to other materials that have IR plasma
frequencies. Silicon based materials (metal silicides and highly doped-Si) have been
investigated recently in the mid- to long-wave IR wavelength regimes [4–7]. The SP
propagation length on Sb at a wavelength of 10 µm is approximately 20 times smaller than on
metal silicides [5] while the SP mode is about 250 times more tightly confined for Sb than it
is for metal silicides. At smaller wavelengths (~5 µm) the metal silicides are comparable to
Sb. The mode confinement on Sb is comparable to that of highly doped-Si [4–7] with carrier
#157835 - $15.00 USD Received 9 Nov 2011; revised 5 Jan 2012; accepted 5 Jan 2012; published 23 Jan 2012(C) 2012 OSA 30 January 2012 / Vol. 20, No. 3 / OPTICS EXPRESS 2704
concentrations near ~1021
cm−3
. Lower concentrations of doped-Si do give slightly better
mode confinement than Sb although the useful doping range is narrow, since silicon shows no
SP resonances at CO2 wavelengths below concentrations of 1020
cm−3
[6]. Thus Sb may be a
more versatile material for IR SP-based sensing than silicon.
In summary, this paper reports the observation of SP resonances in the experimental and
calculated angular reflection spectrum from Sb grating couplers. These resonances appear
even though the real part of the permittivity is positive. These resonances in the wavelength
range 6-11 µm are distinct and potentially useful for sensor applications. Antimony may also
be useful for IR SP waveguide applications, though the mode confinement is no better than
twice the photon wavelength at any frequency.
Acknowledgments
Support for this work is provided in part by AFOSR (Gernot Pomrenke PM) LRIR award
number 09RY09COR and Grant FA95501010030 as well as by an NSF SBIR Phase I award
IIP-0944520.
#157835 - $15.00 USD Received 9 Nov 2011; revised 5 Jan 2012; accepted 5 Jan 2012; published 23 Jan 2012(C) 2012 OSA 30 January 2012 / Vol. 20, No. 3 / OPTICS EXPRESS 2705